Numerical Study on the Effect of Distribution Plates in the Manifolds on the Flow Distribution and Thermal Performance of a Flat Plate Solar Collector


 ,
, 
Abstract
1. Introduction
1.1. Models for the Prediction of Flow Distribution
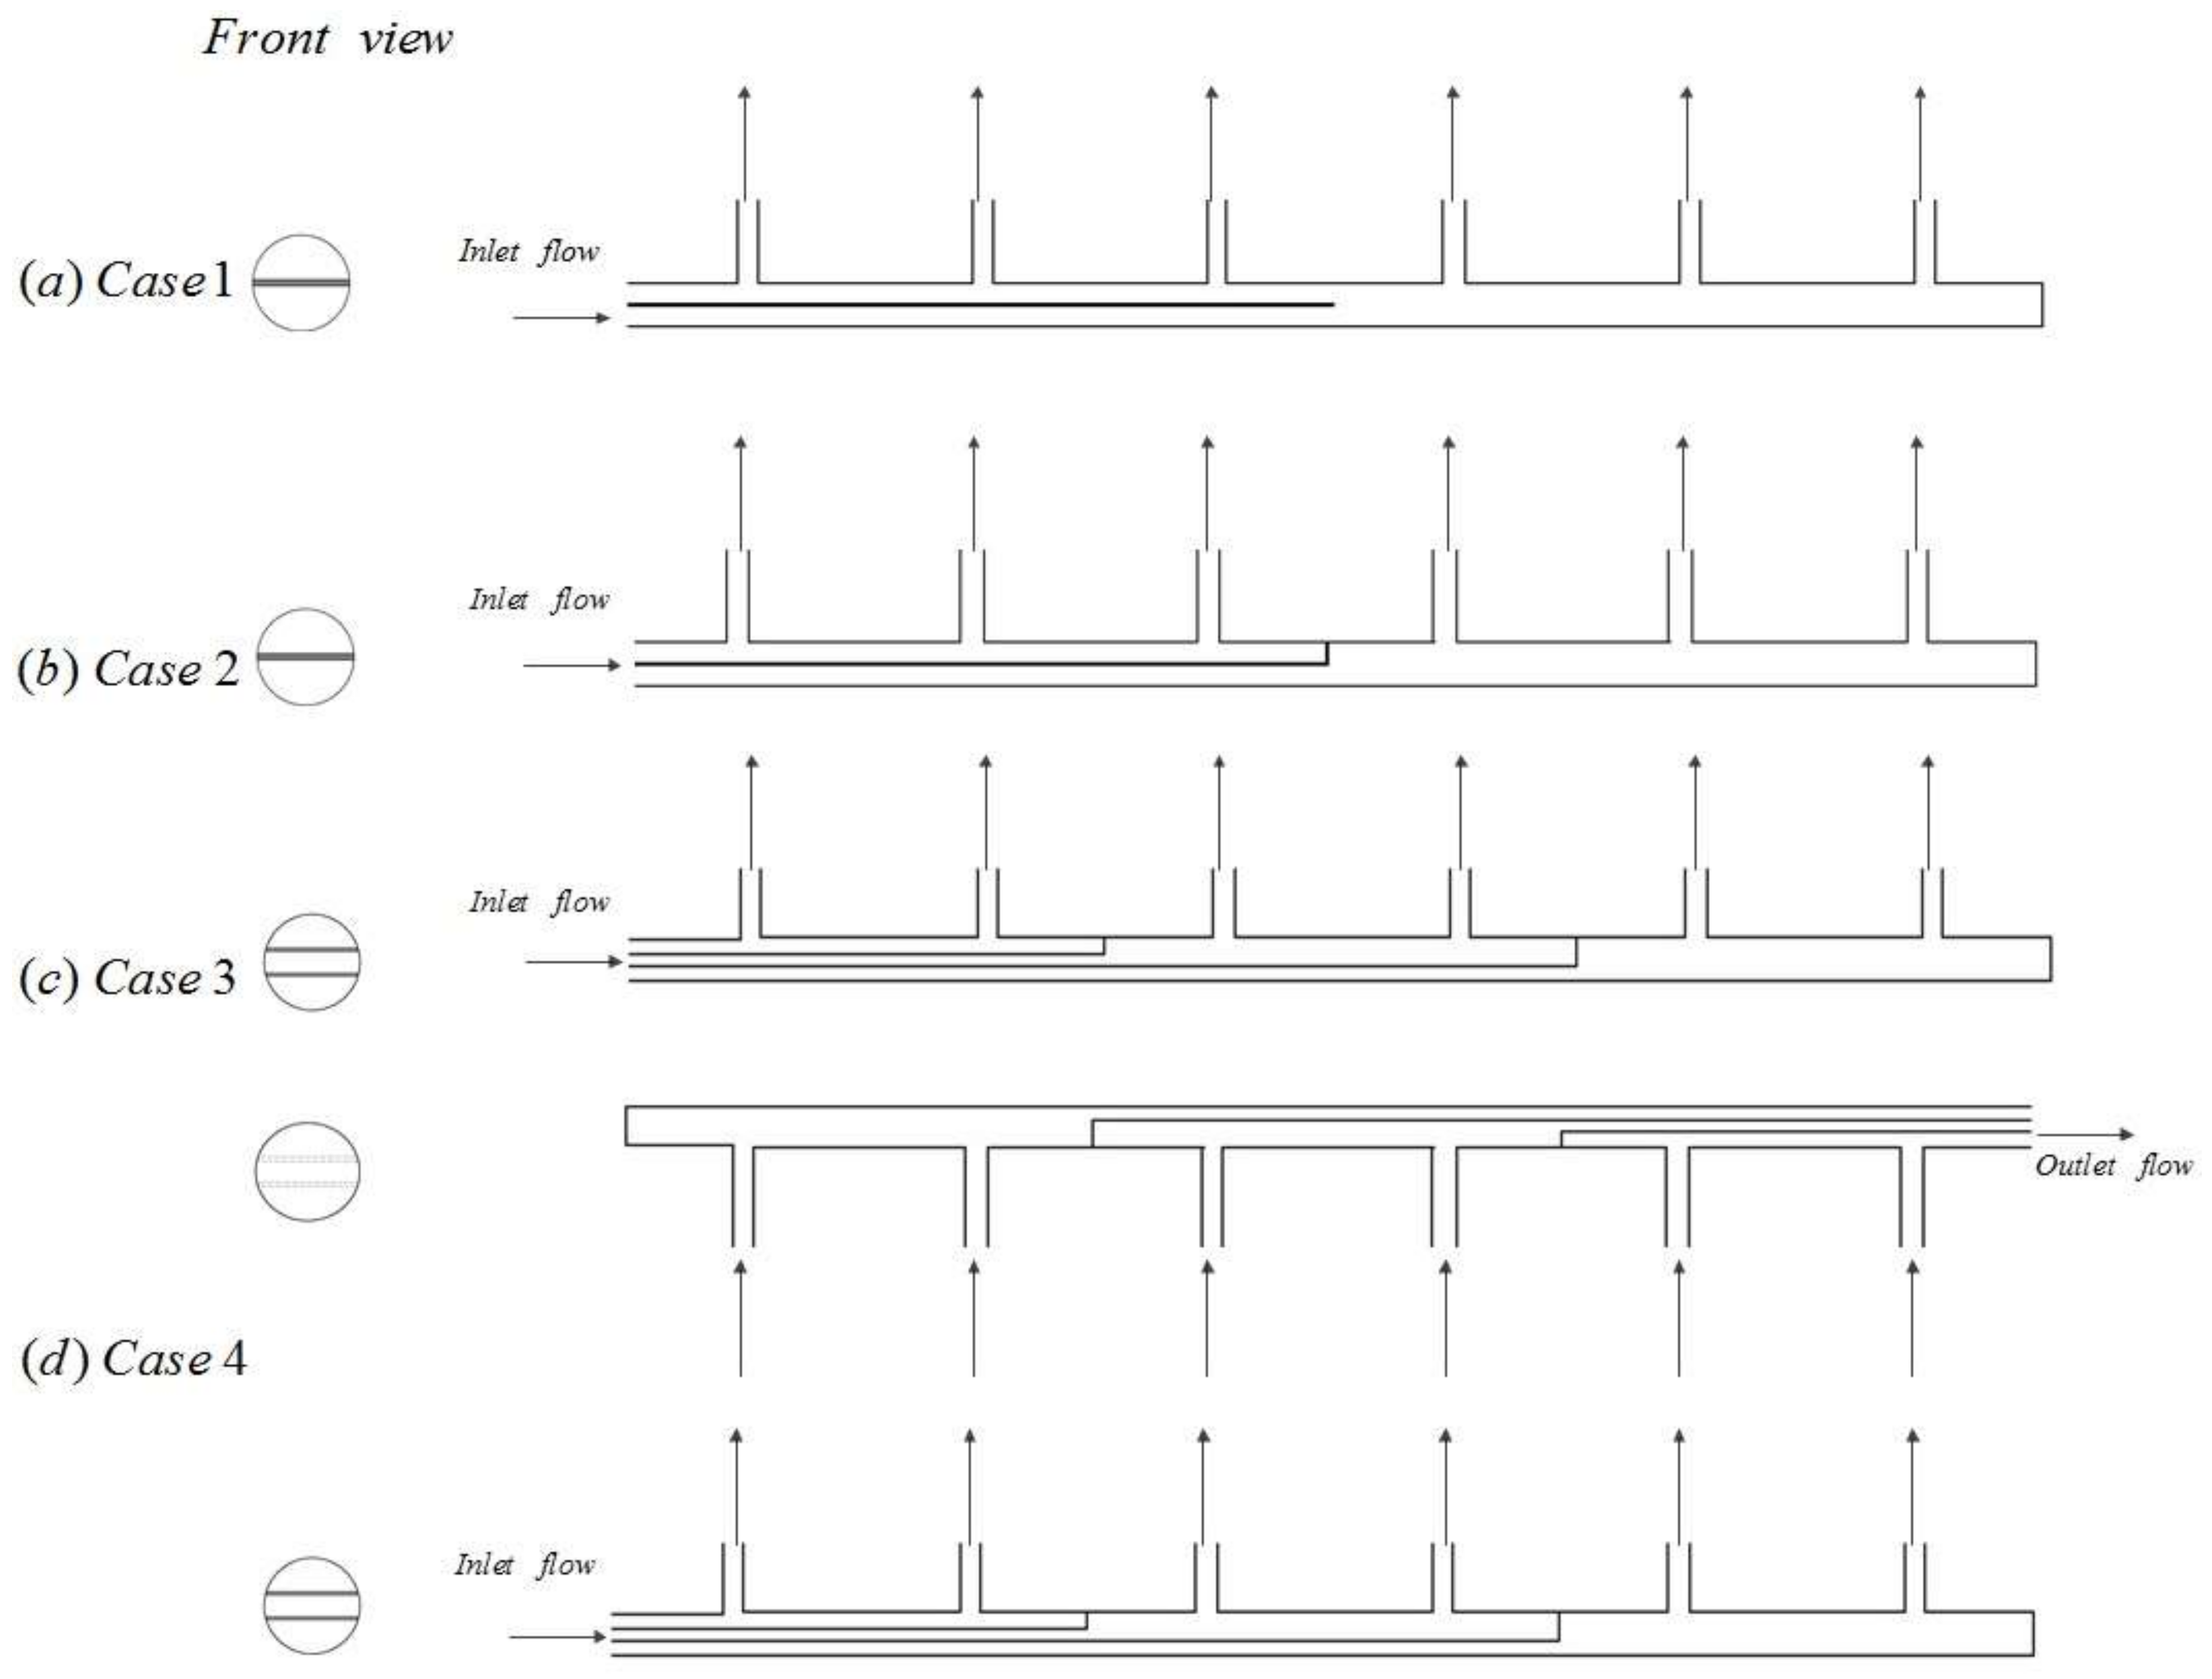
1.2. Strategies to Reduce the Flow Non-Uniformity
2. Numerical Modeling
2.1. Governing Equations
- Steady state;
- Newtonian fluid;
- Turbulent flow in the manifolds and riser tubes (3000 < Ree < 8000 in the riser tubes) and laminar flow in the riser tubes (1100 < Ree < 1600);
- Incompressible flow.
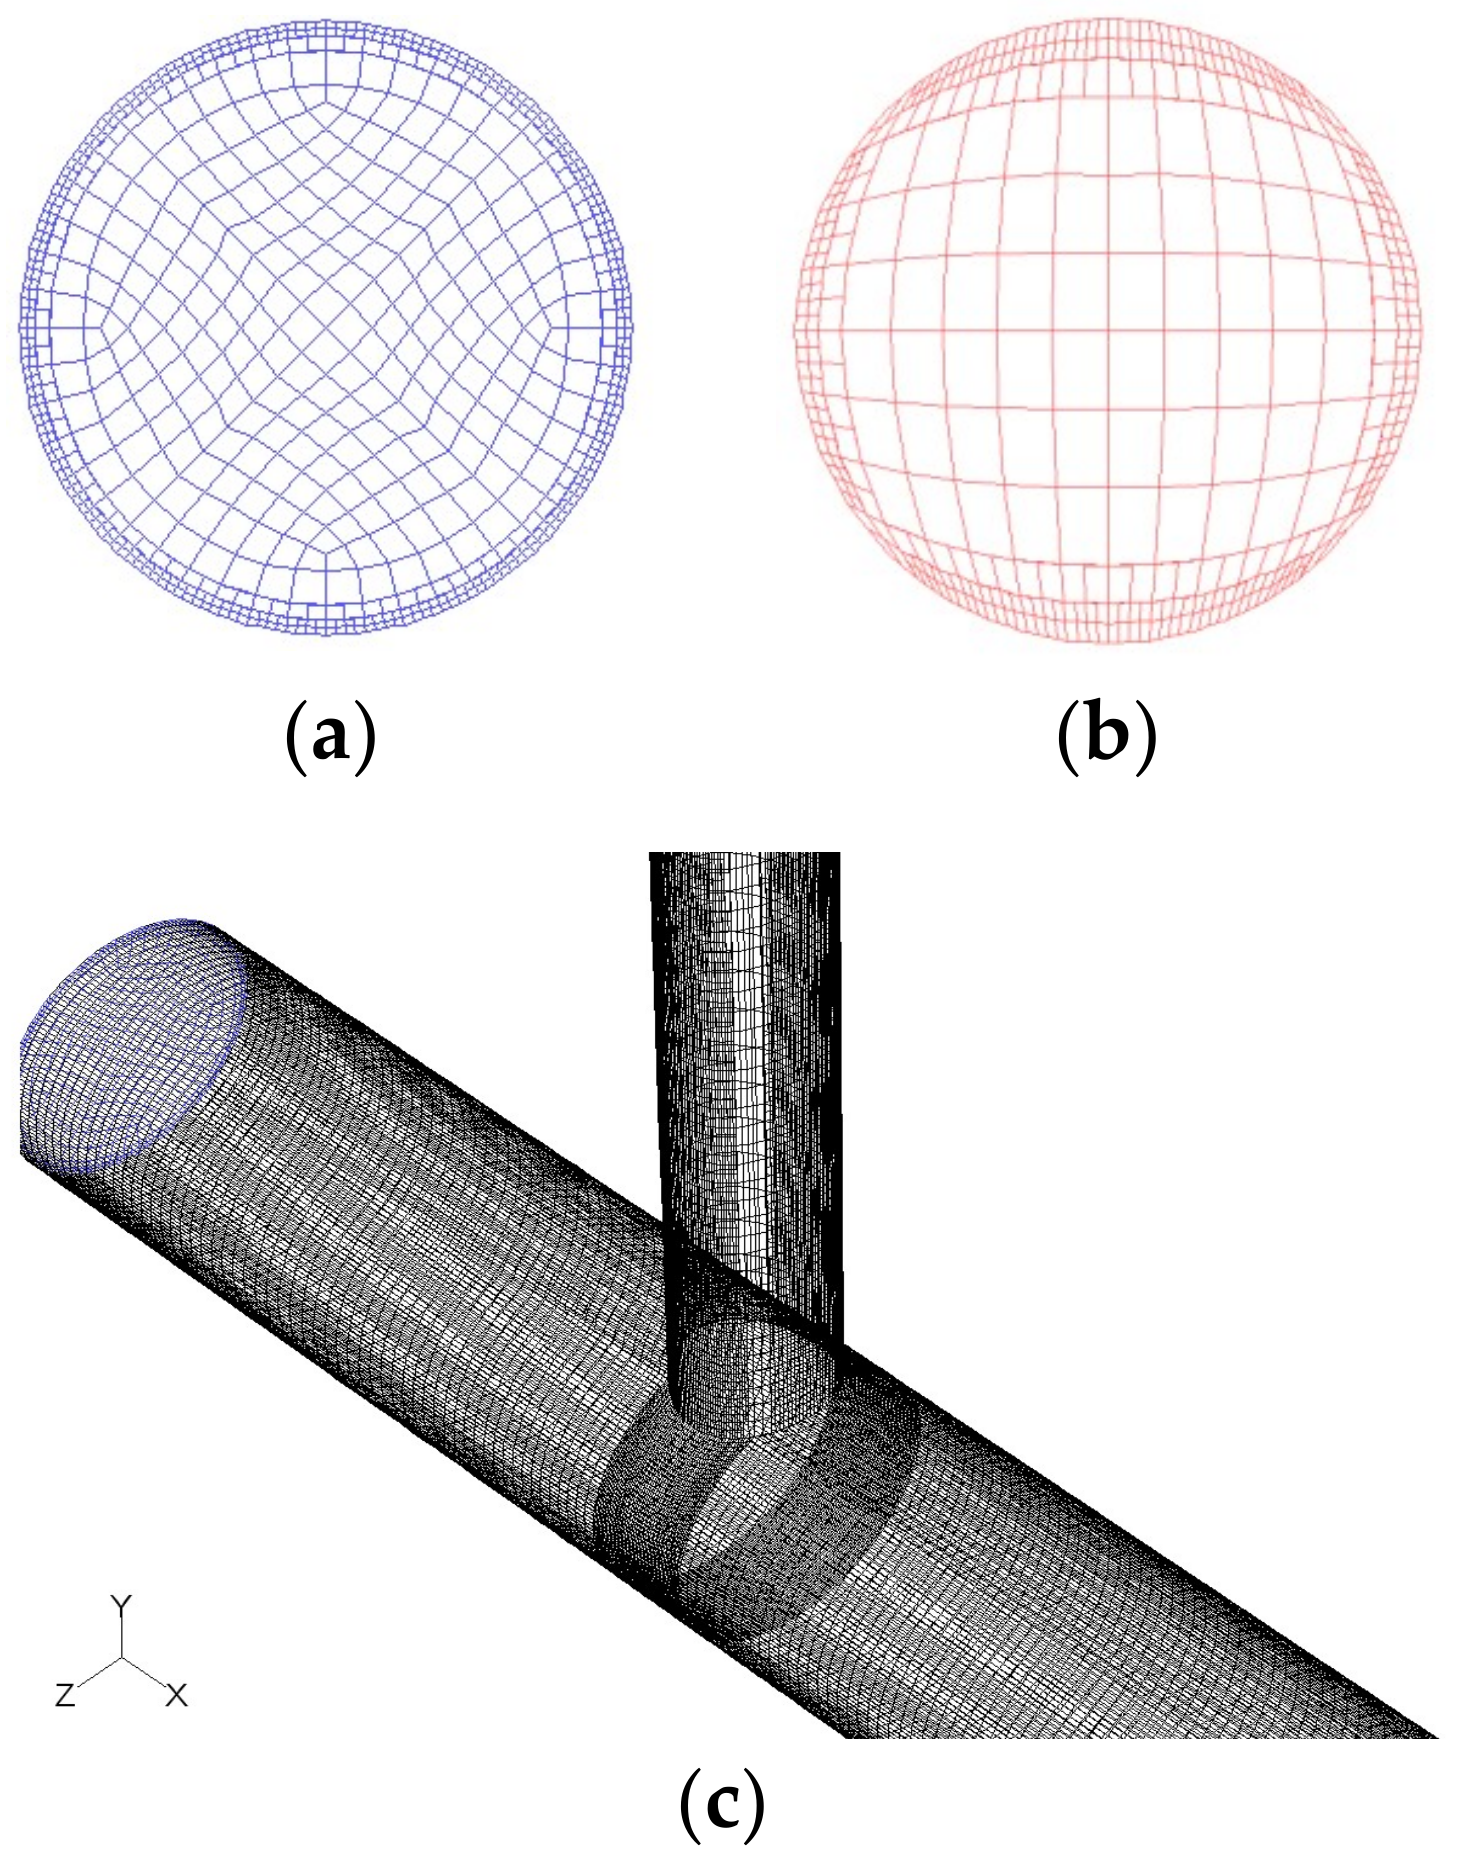
2.2. Mesh Generation
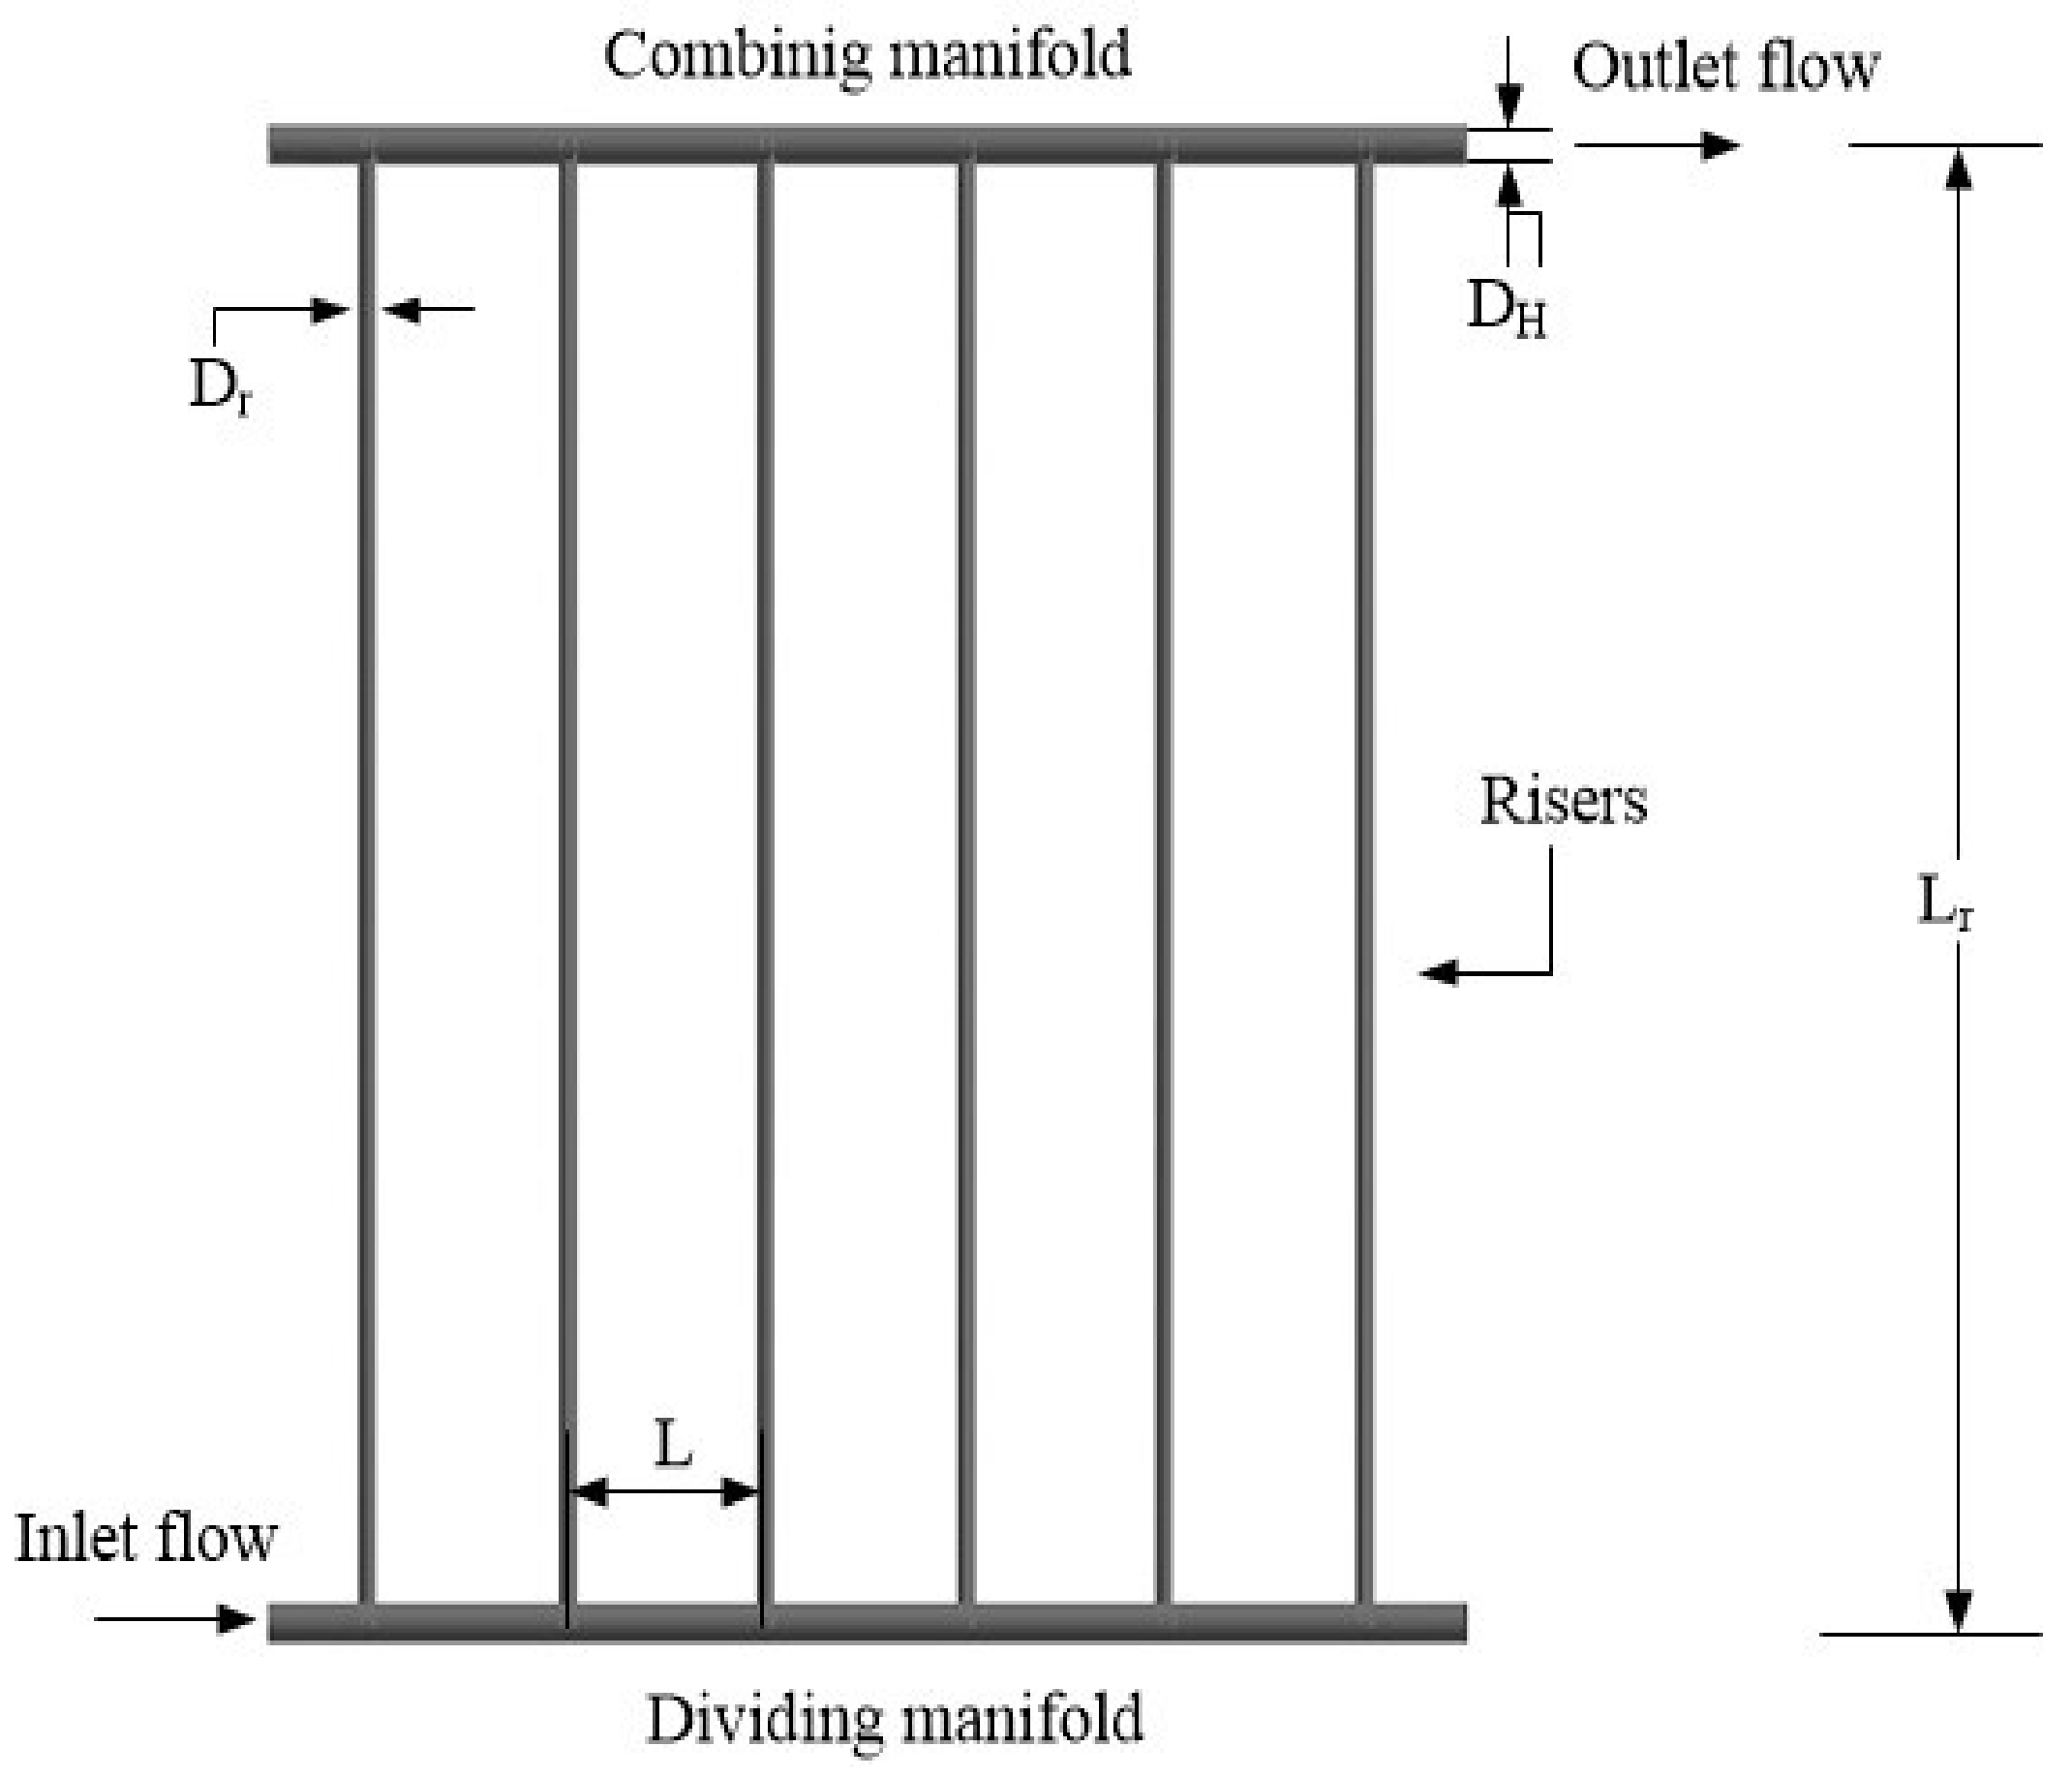
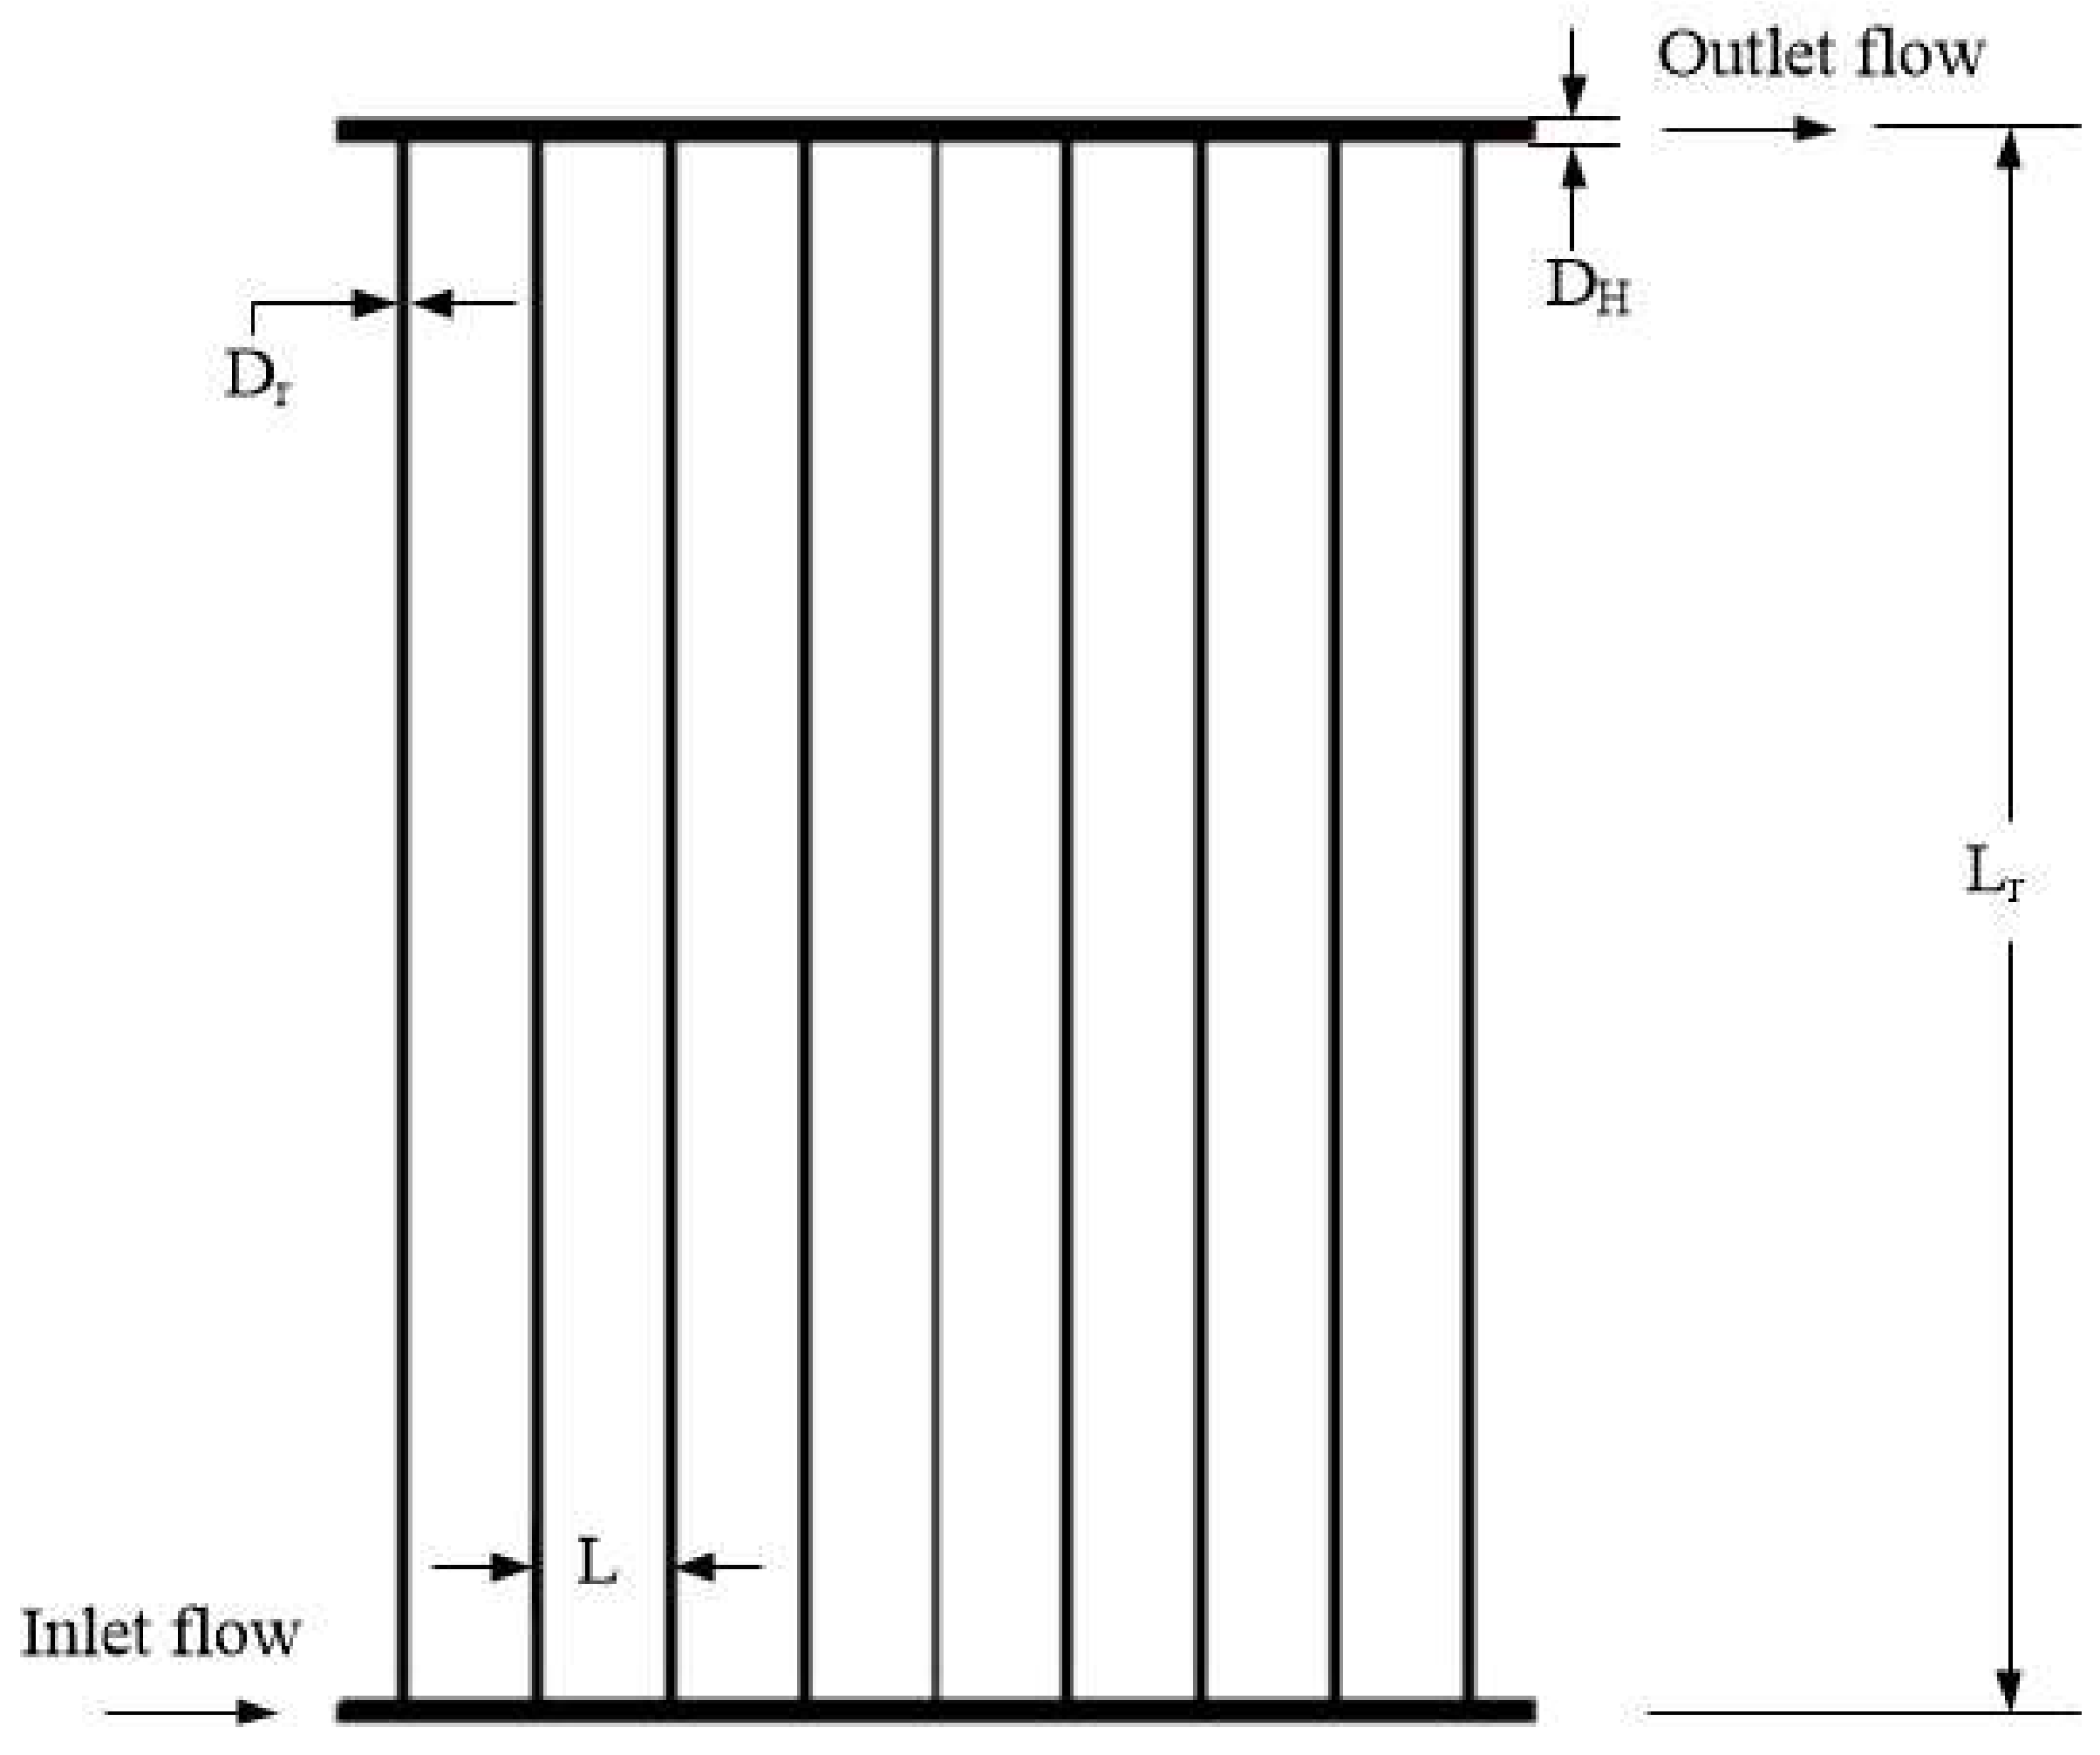
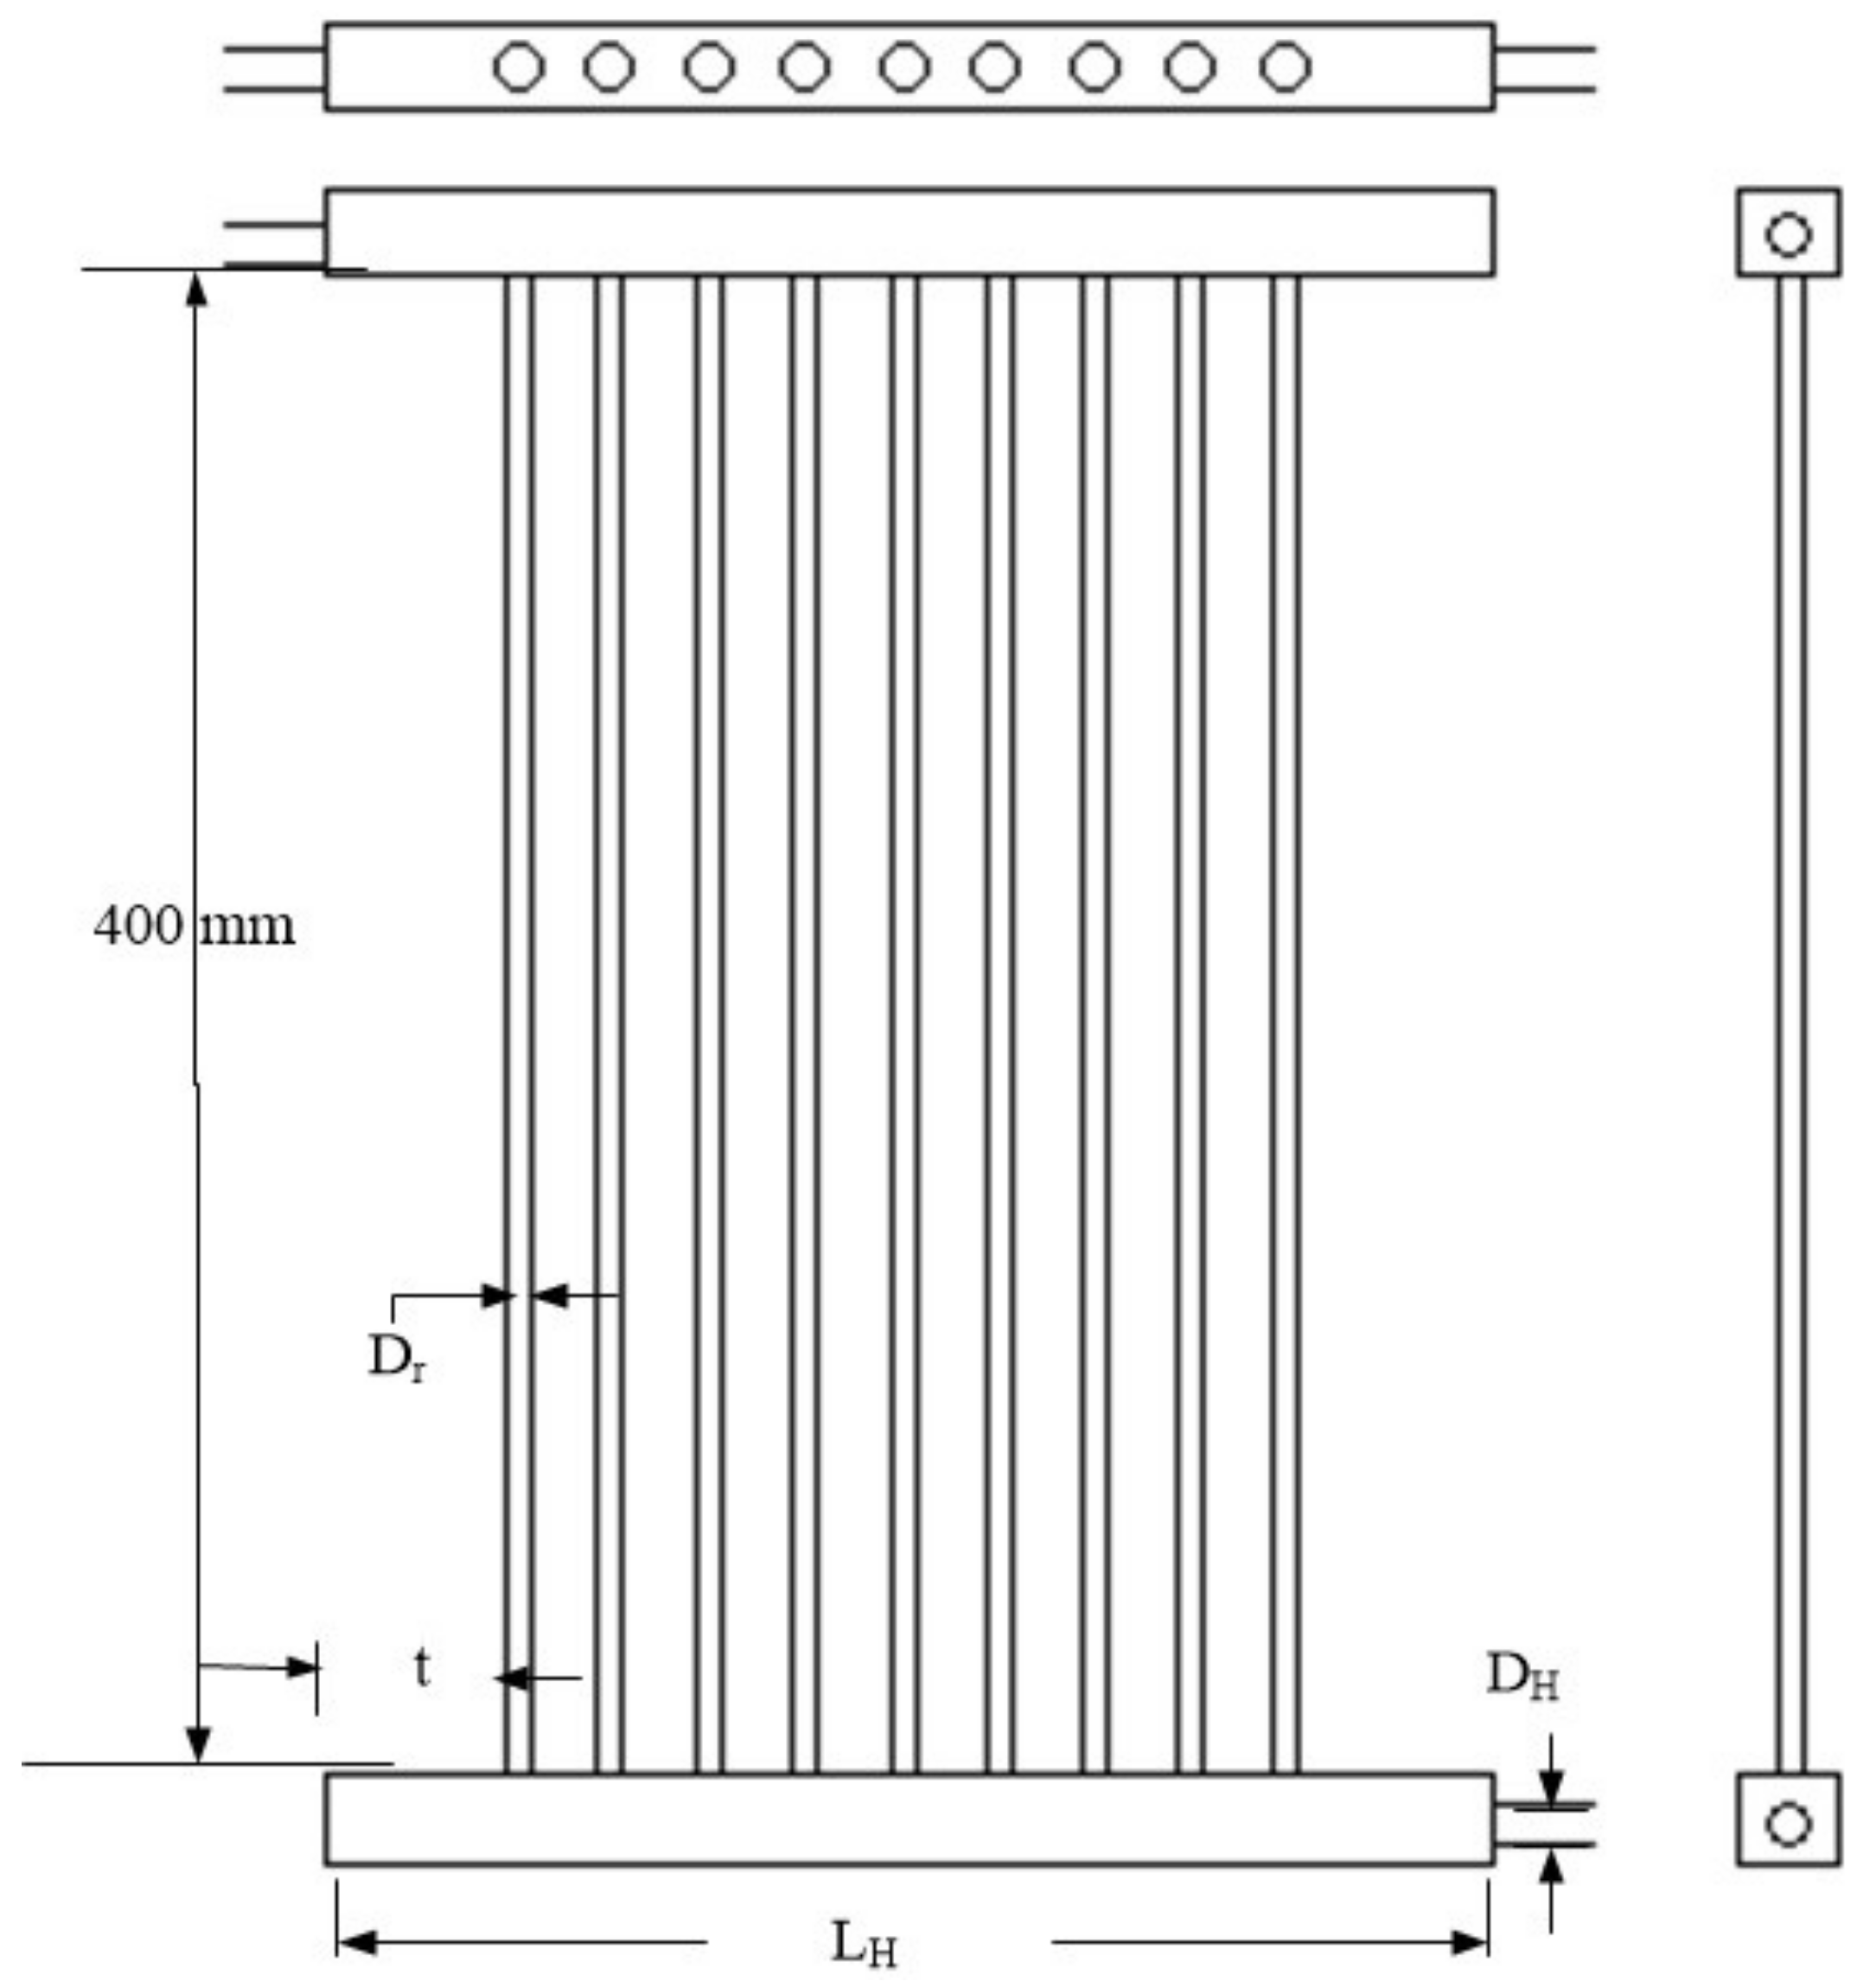
2.3. Baseline Case
3. Results
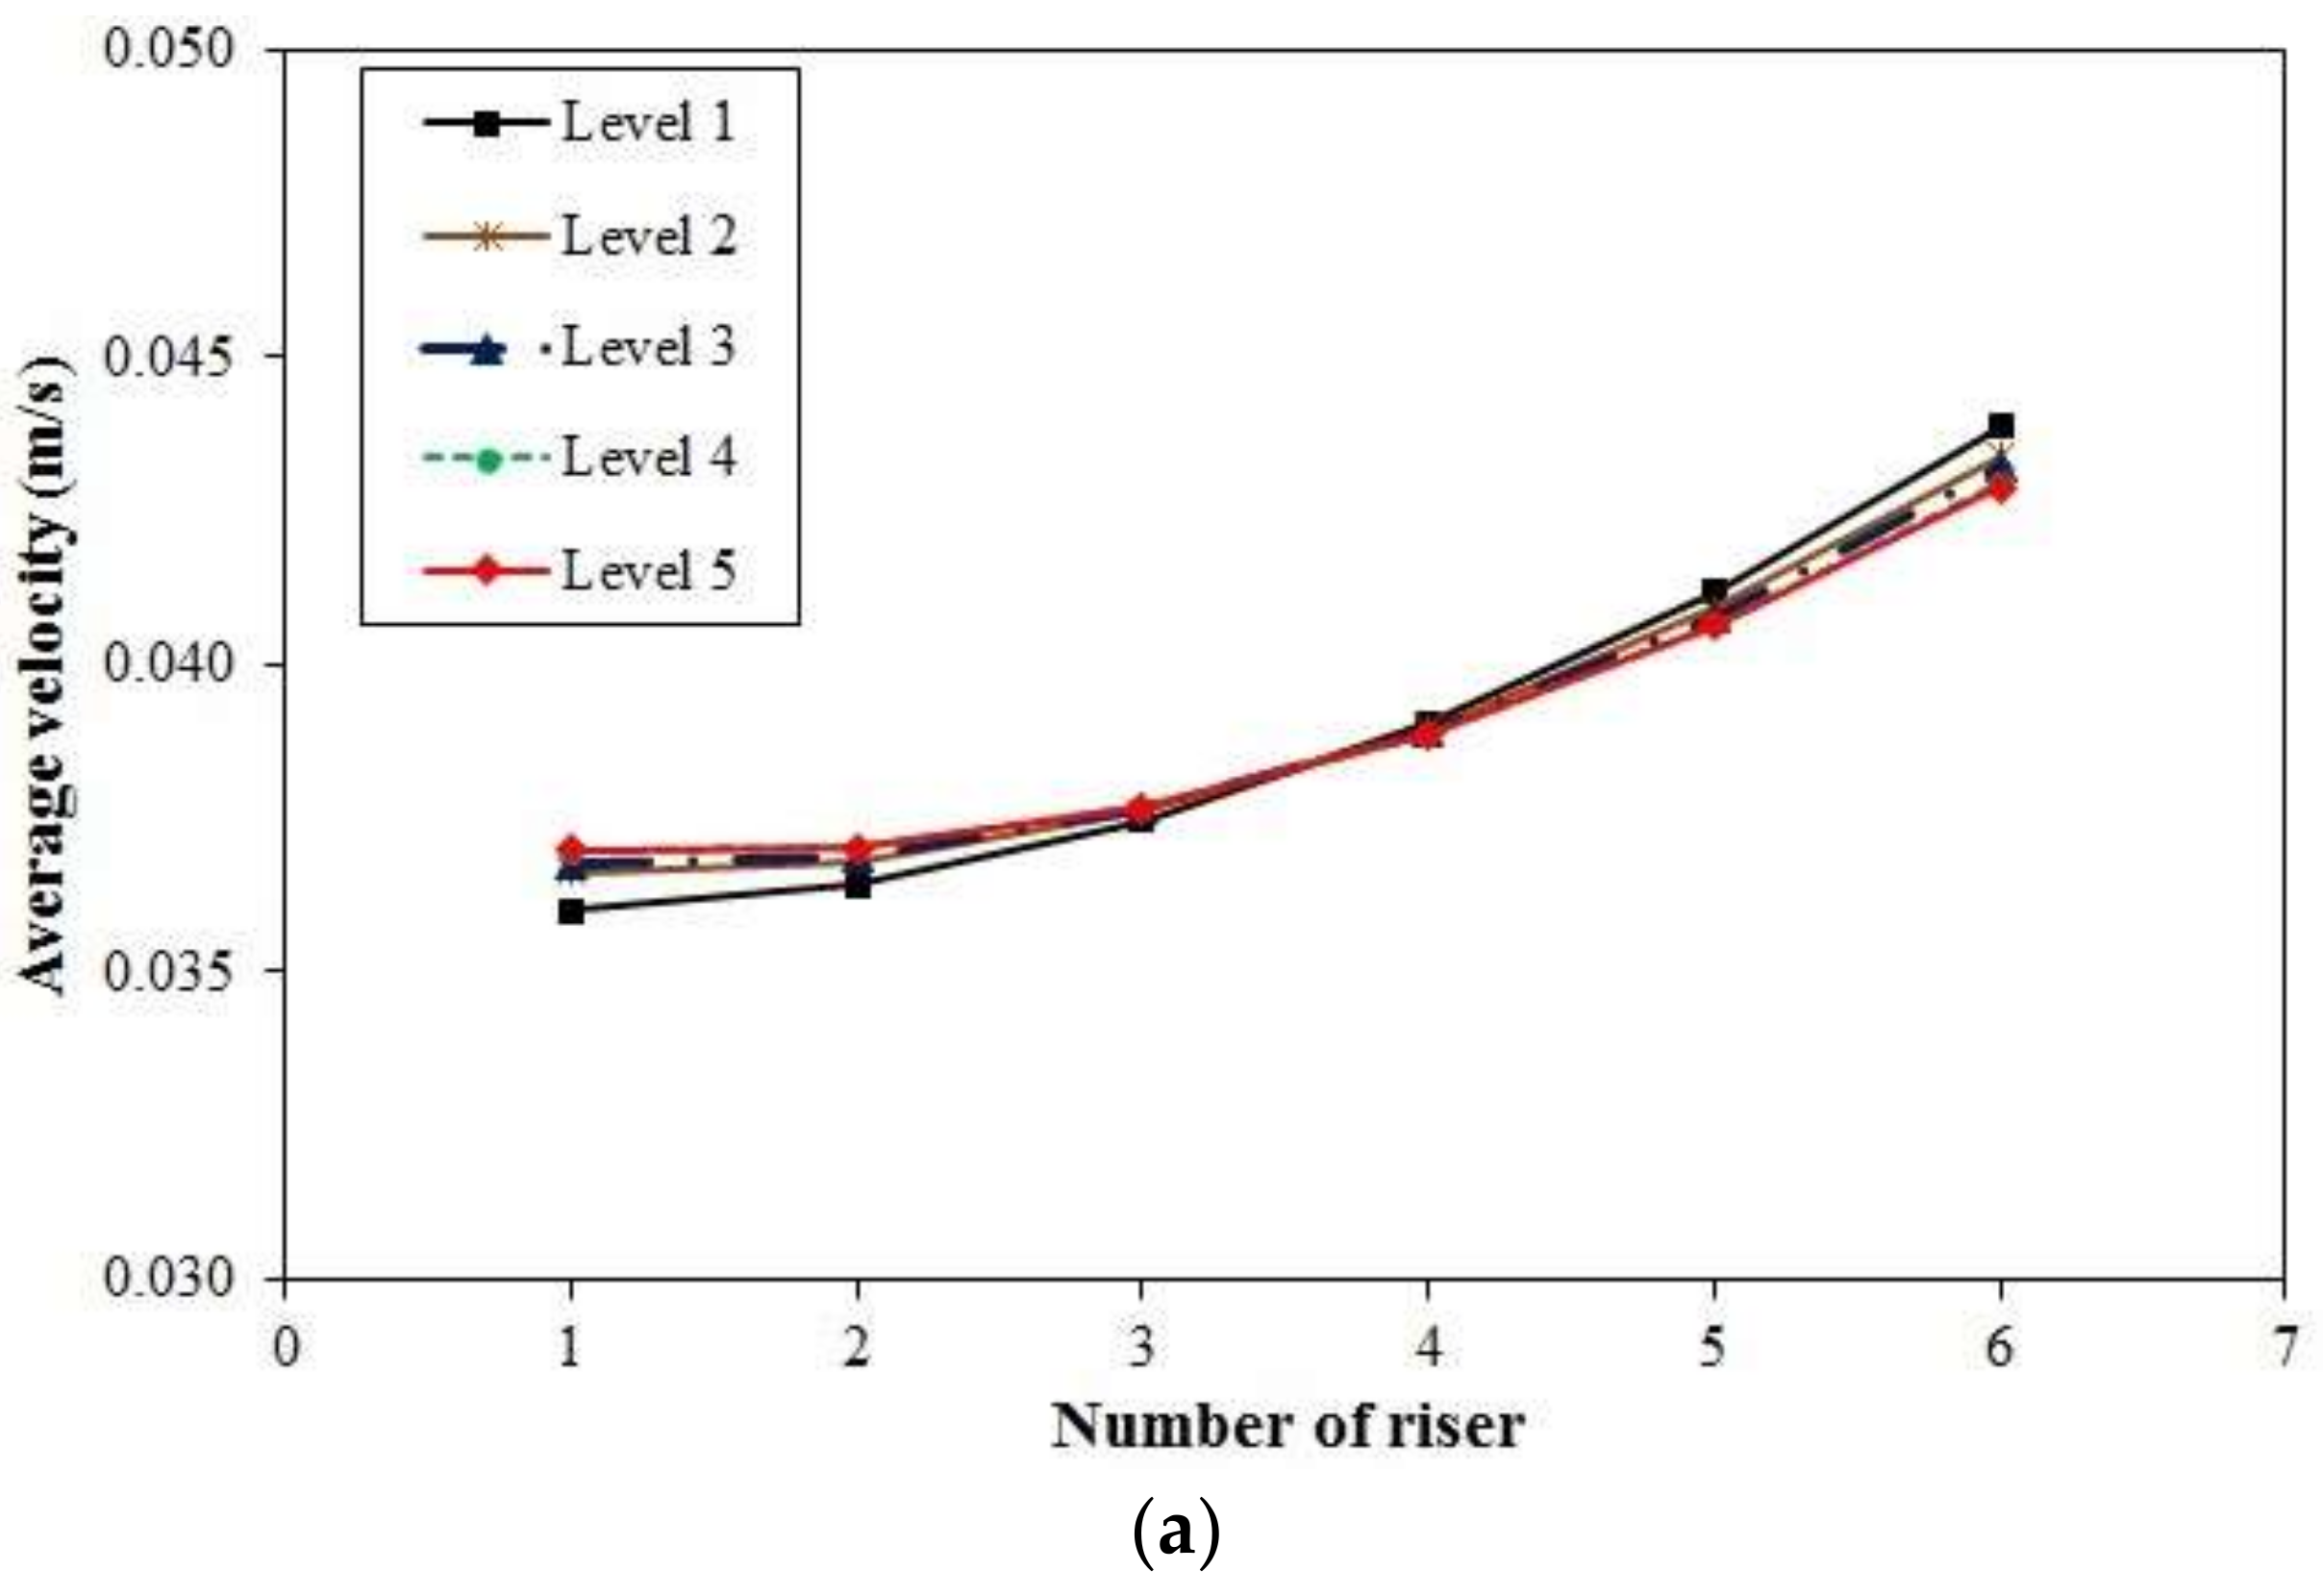
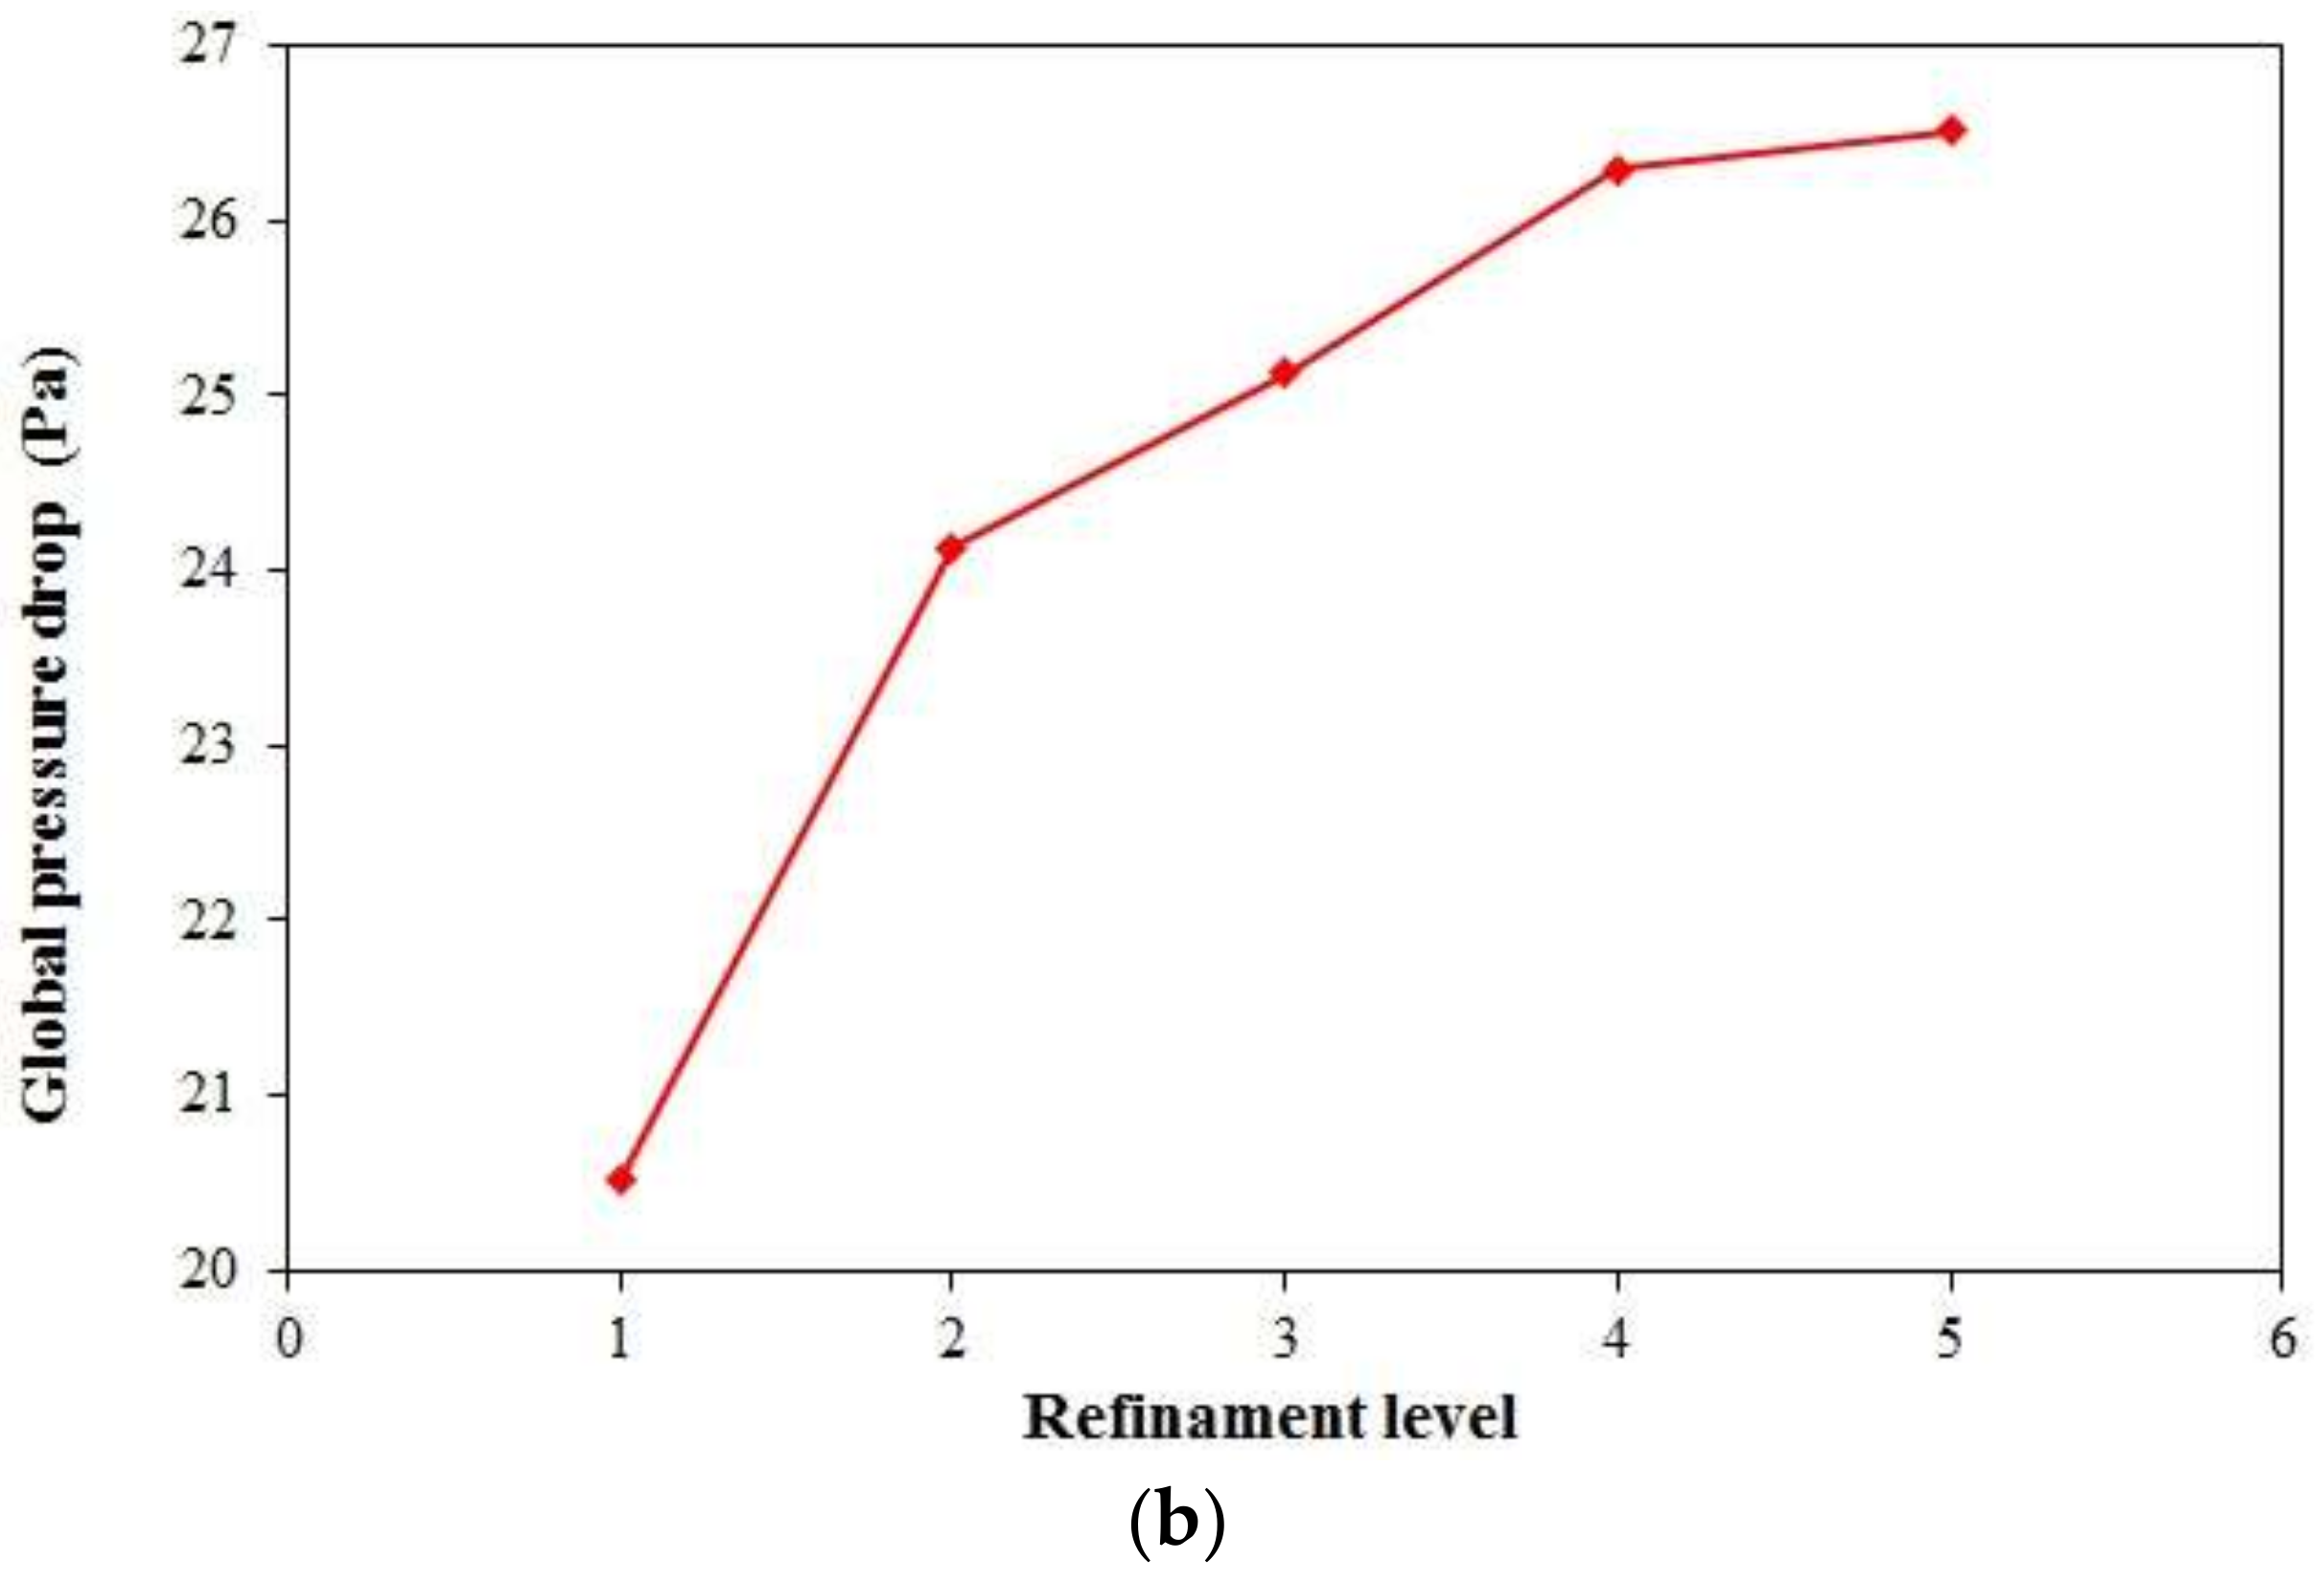
3.1. Grid Independence Analysis
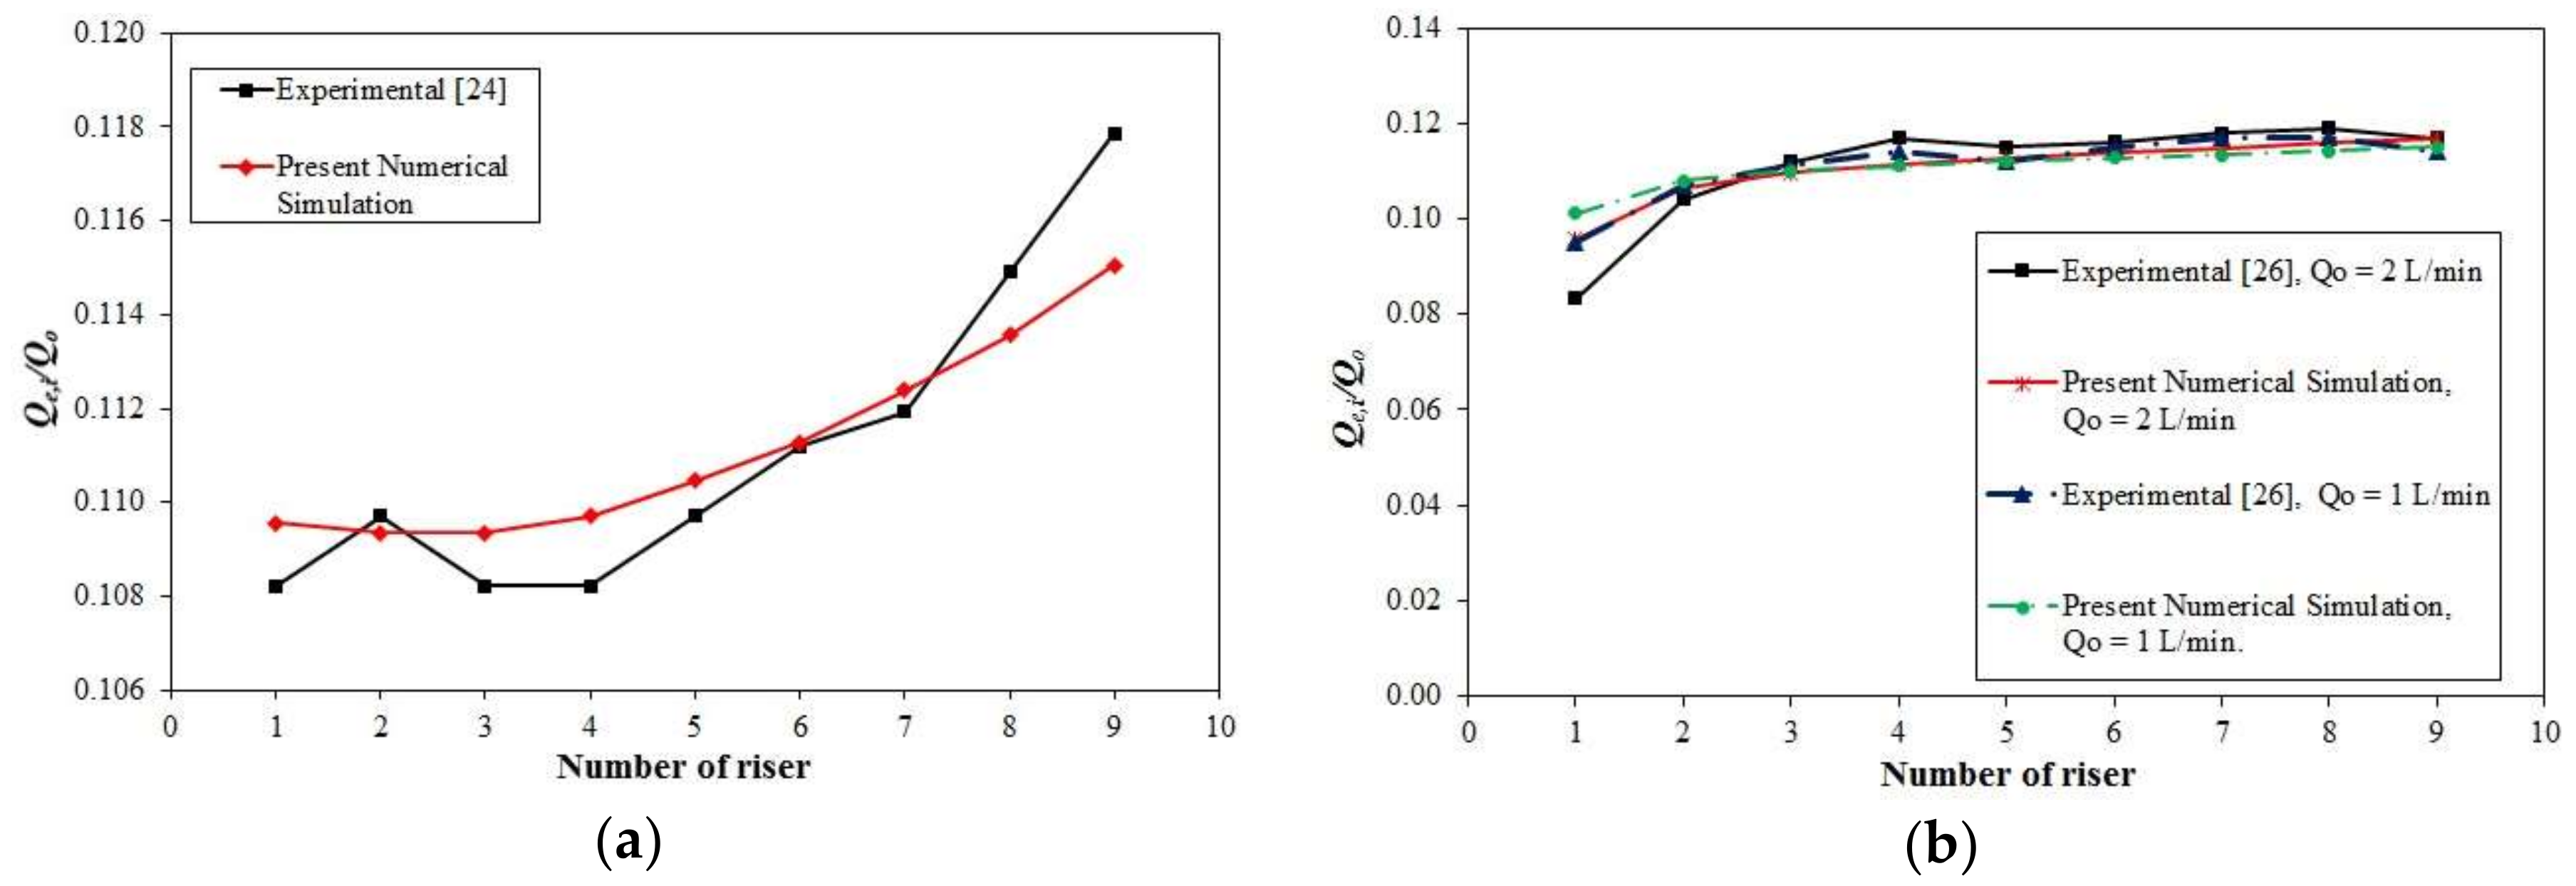
3.2. Validation of the Numerical Solution
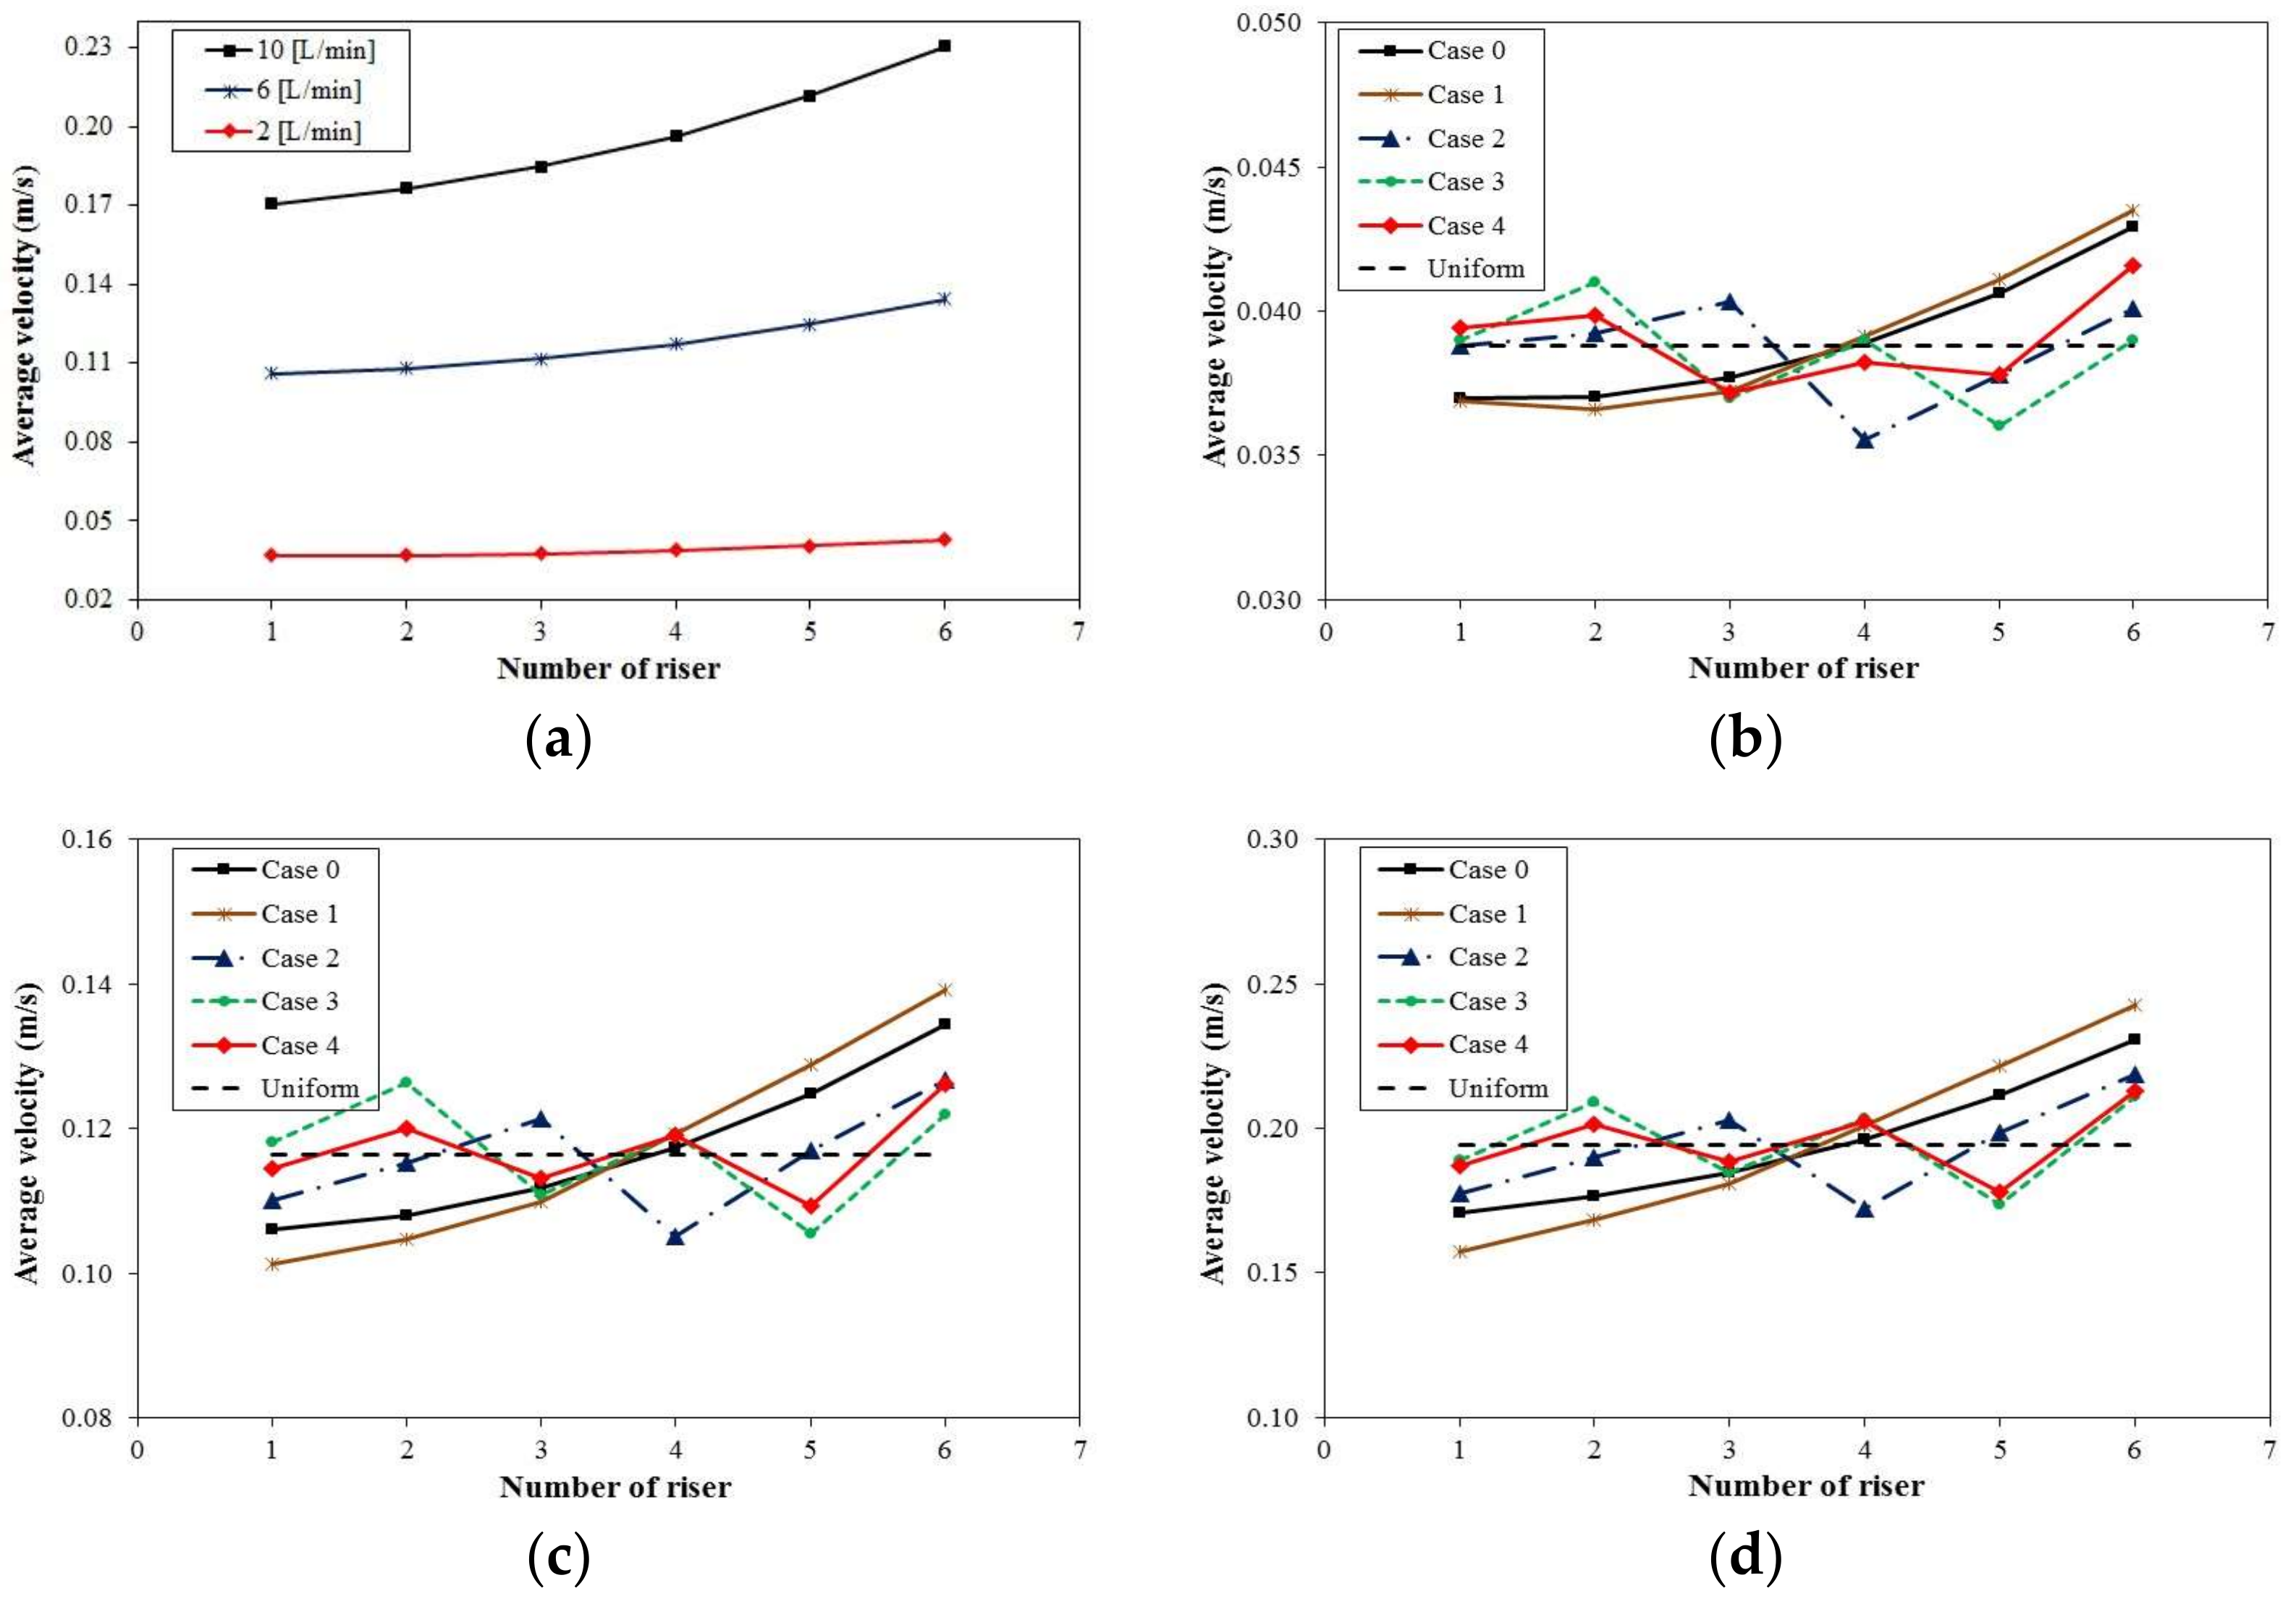
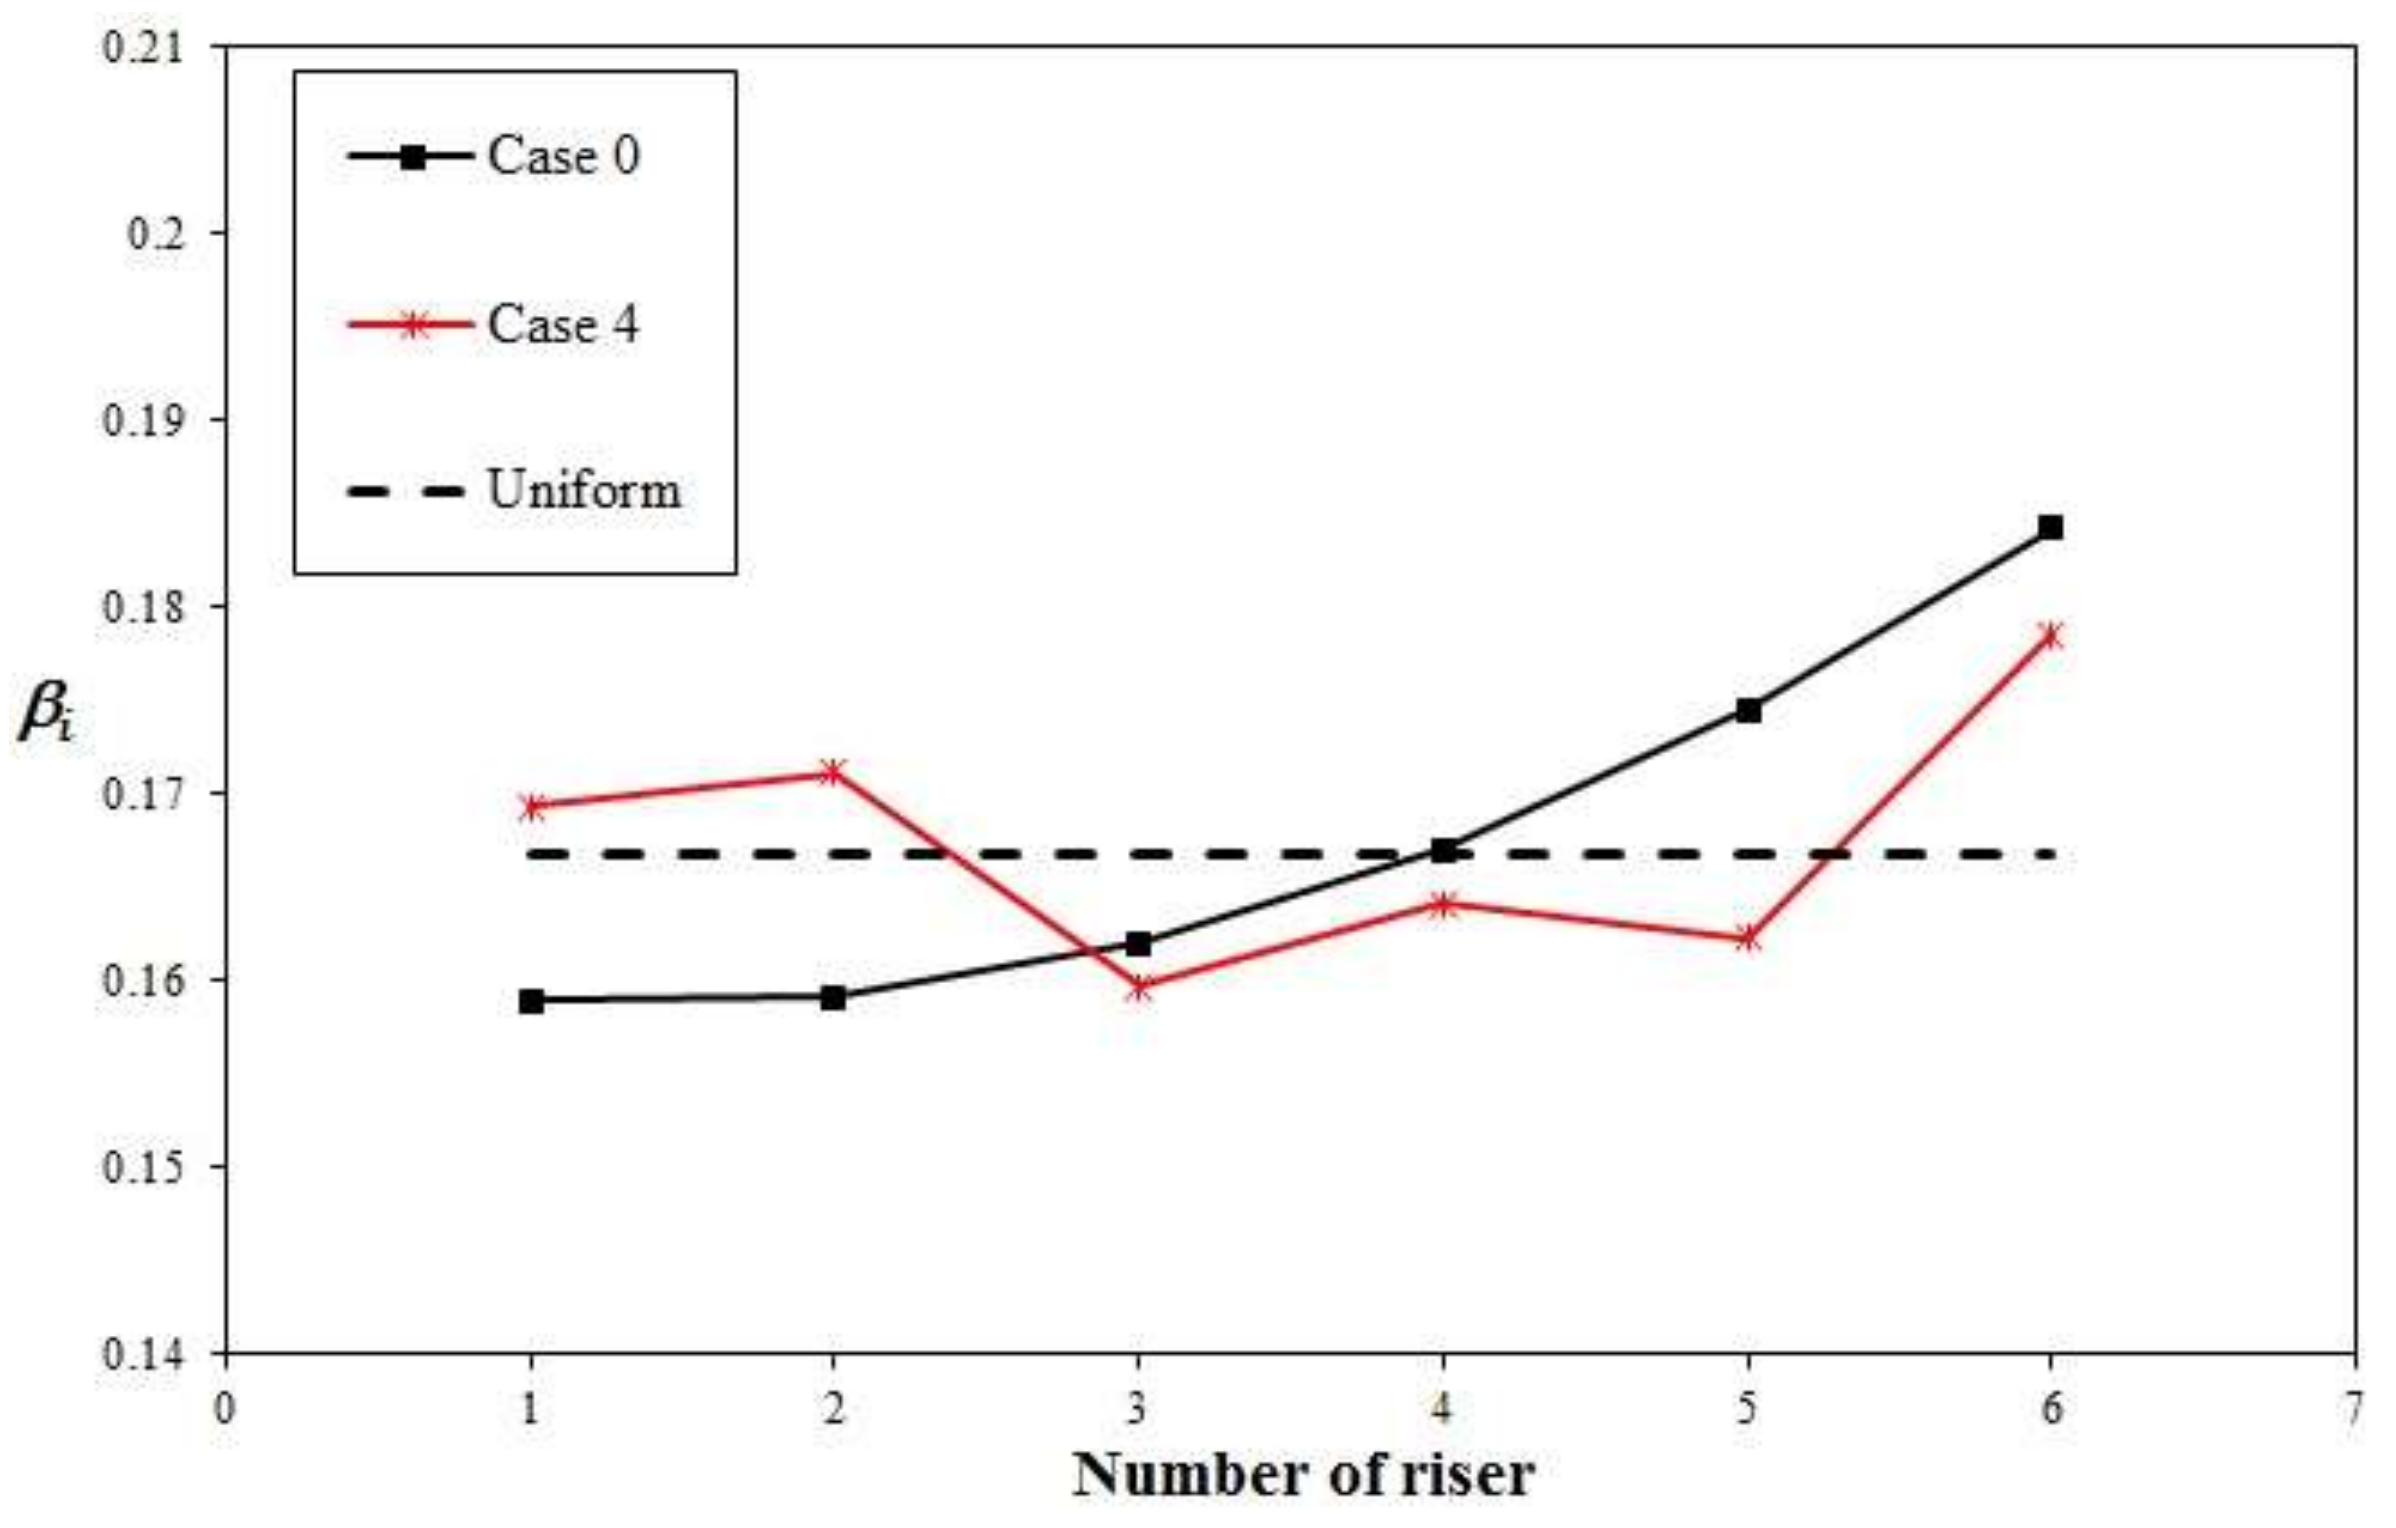
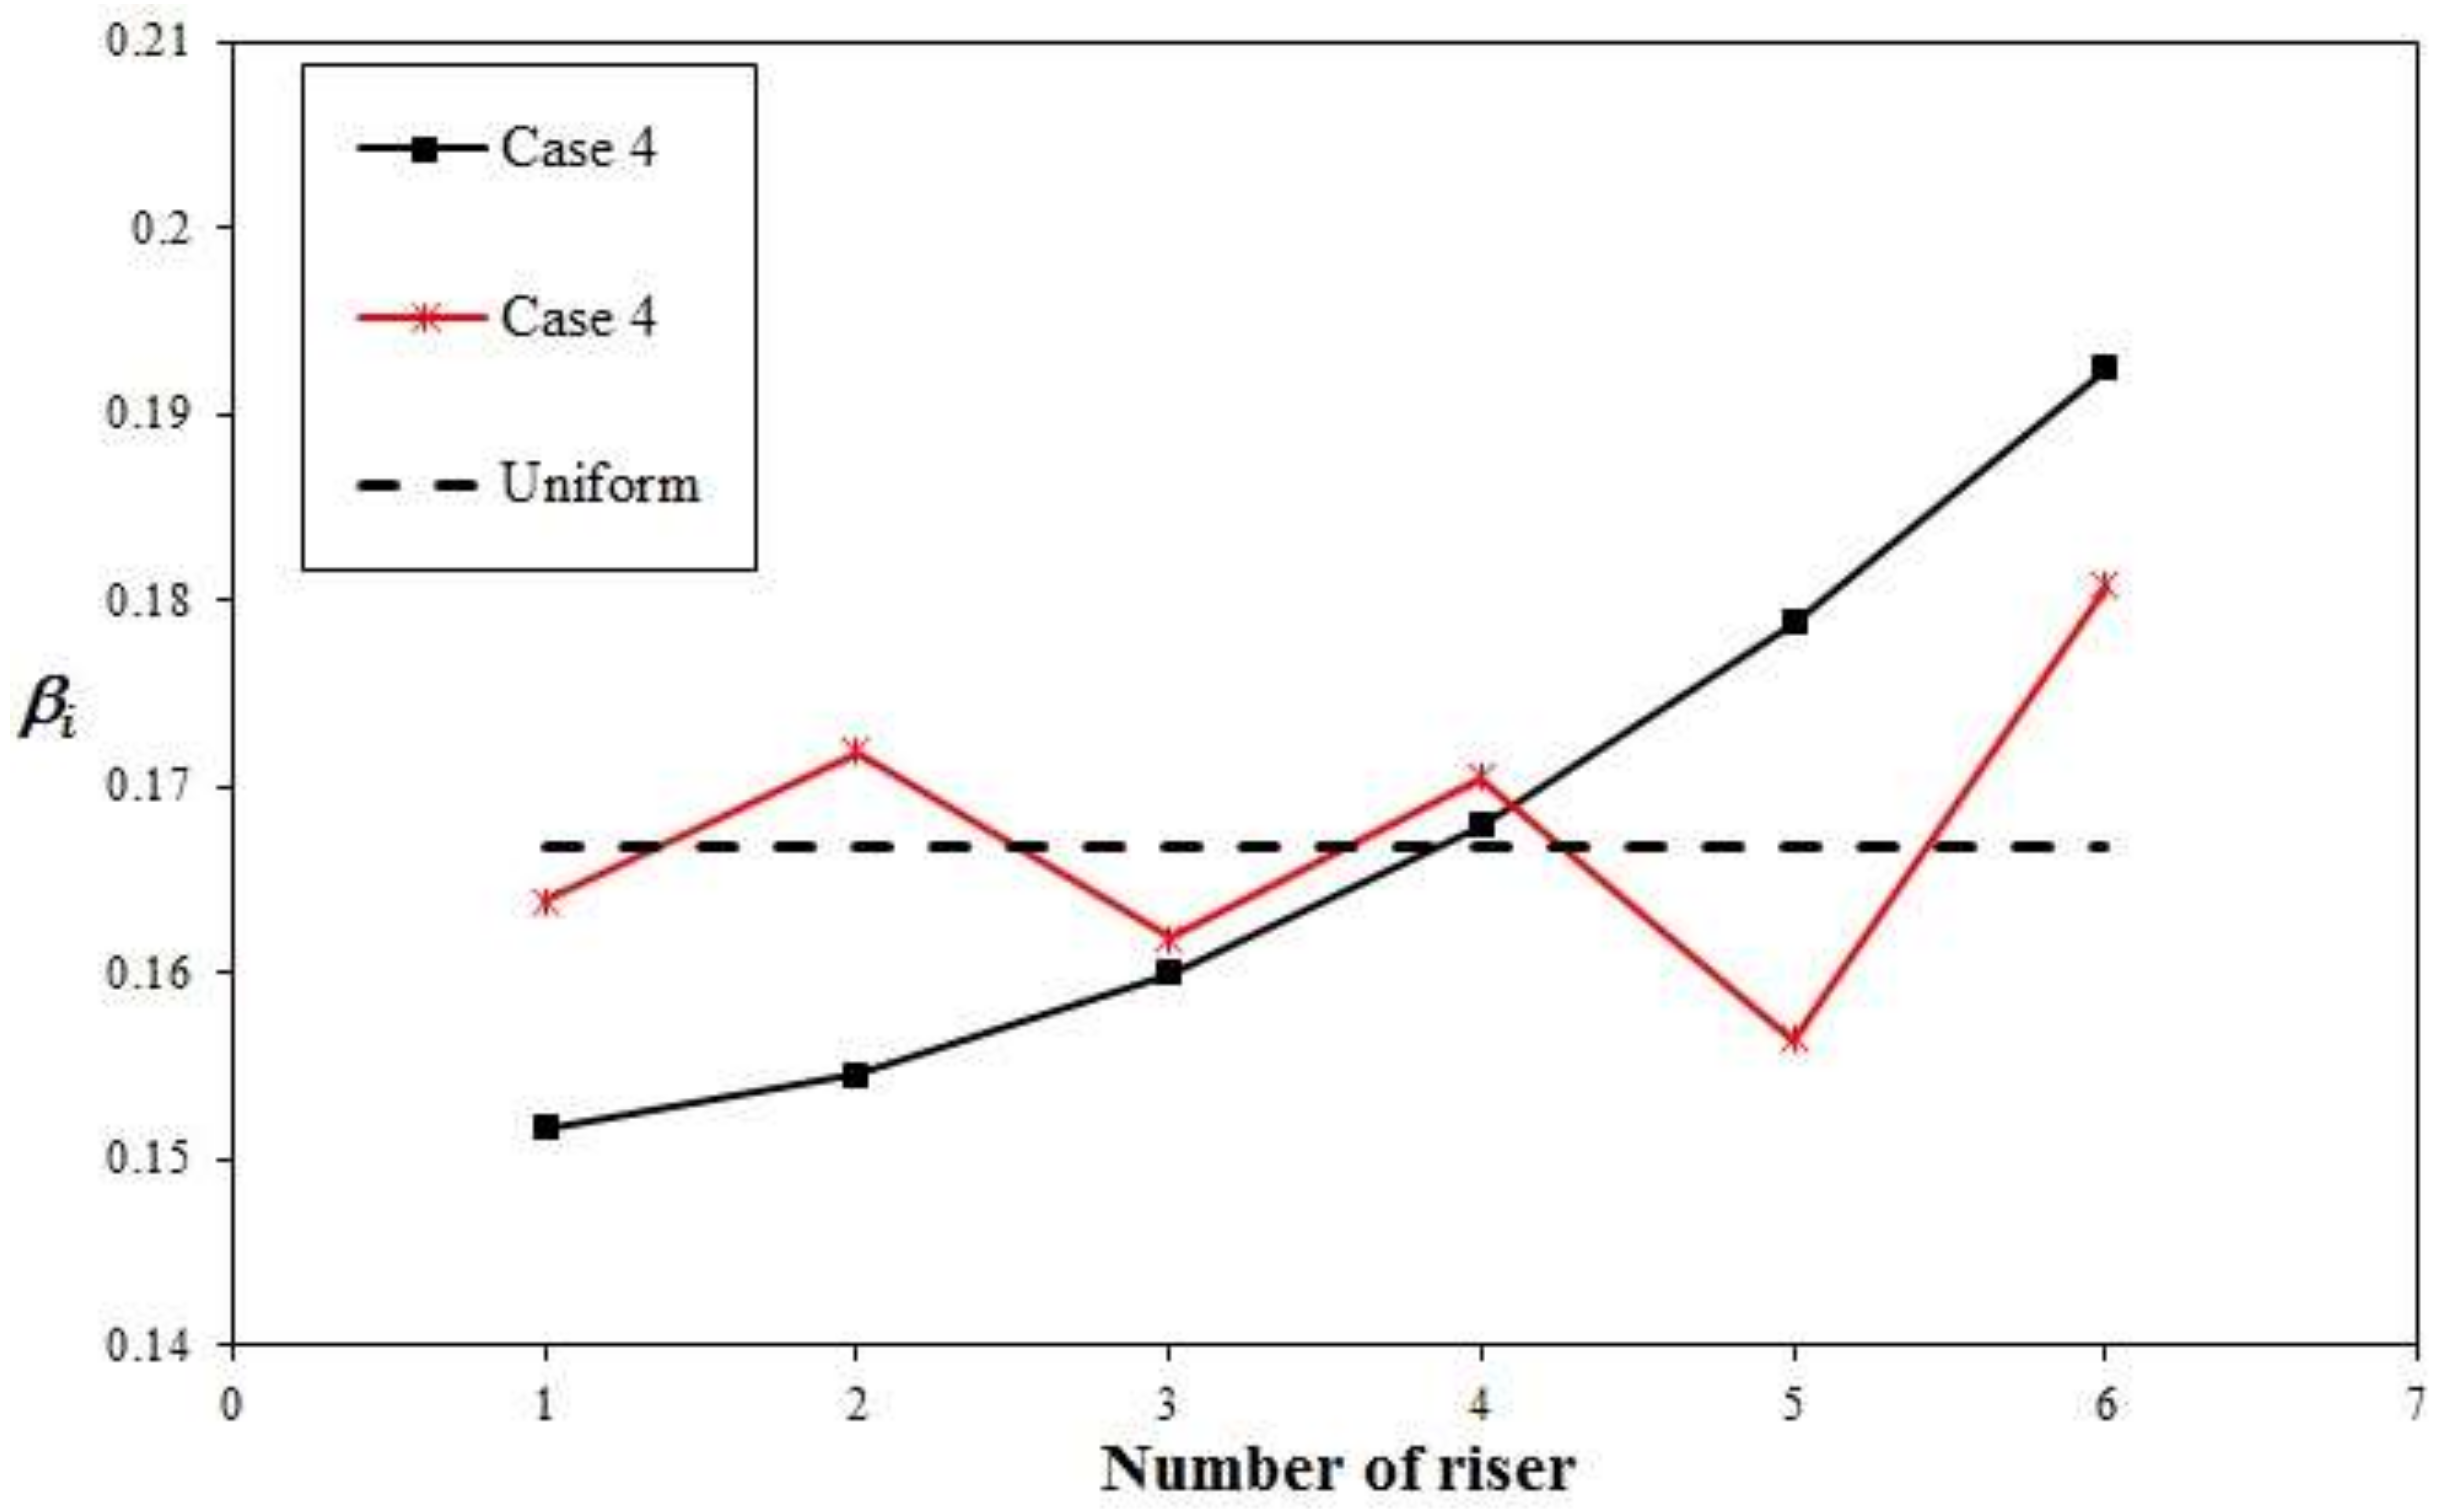
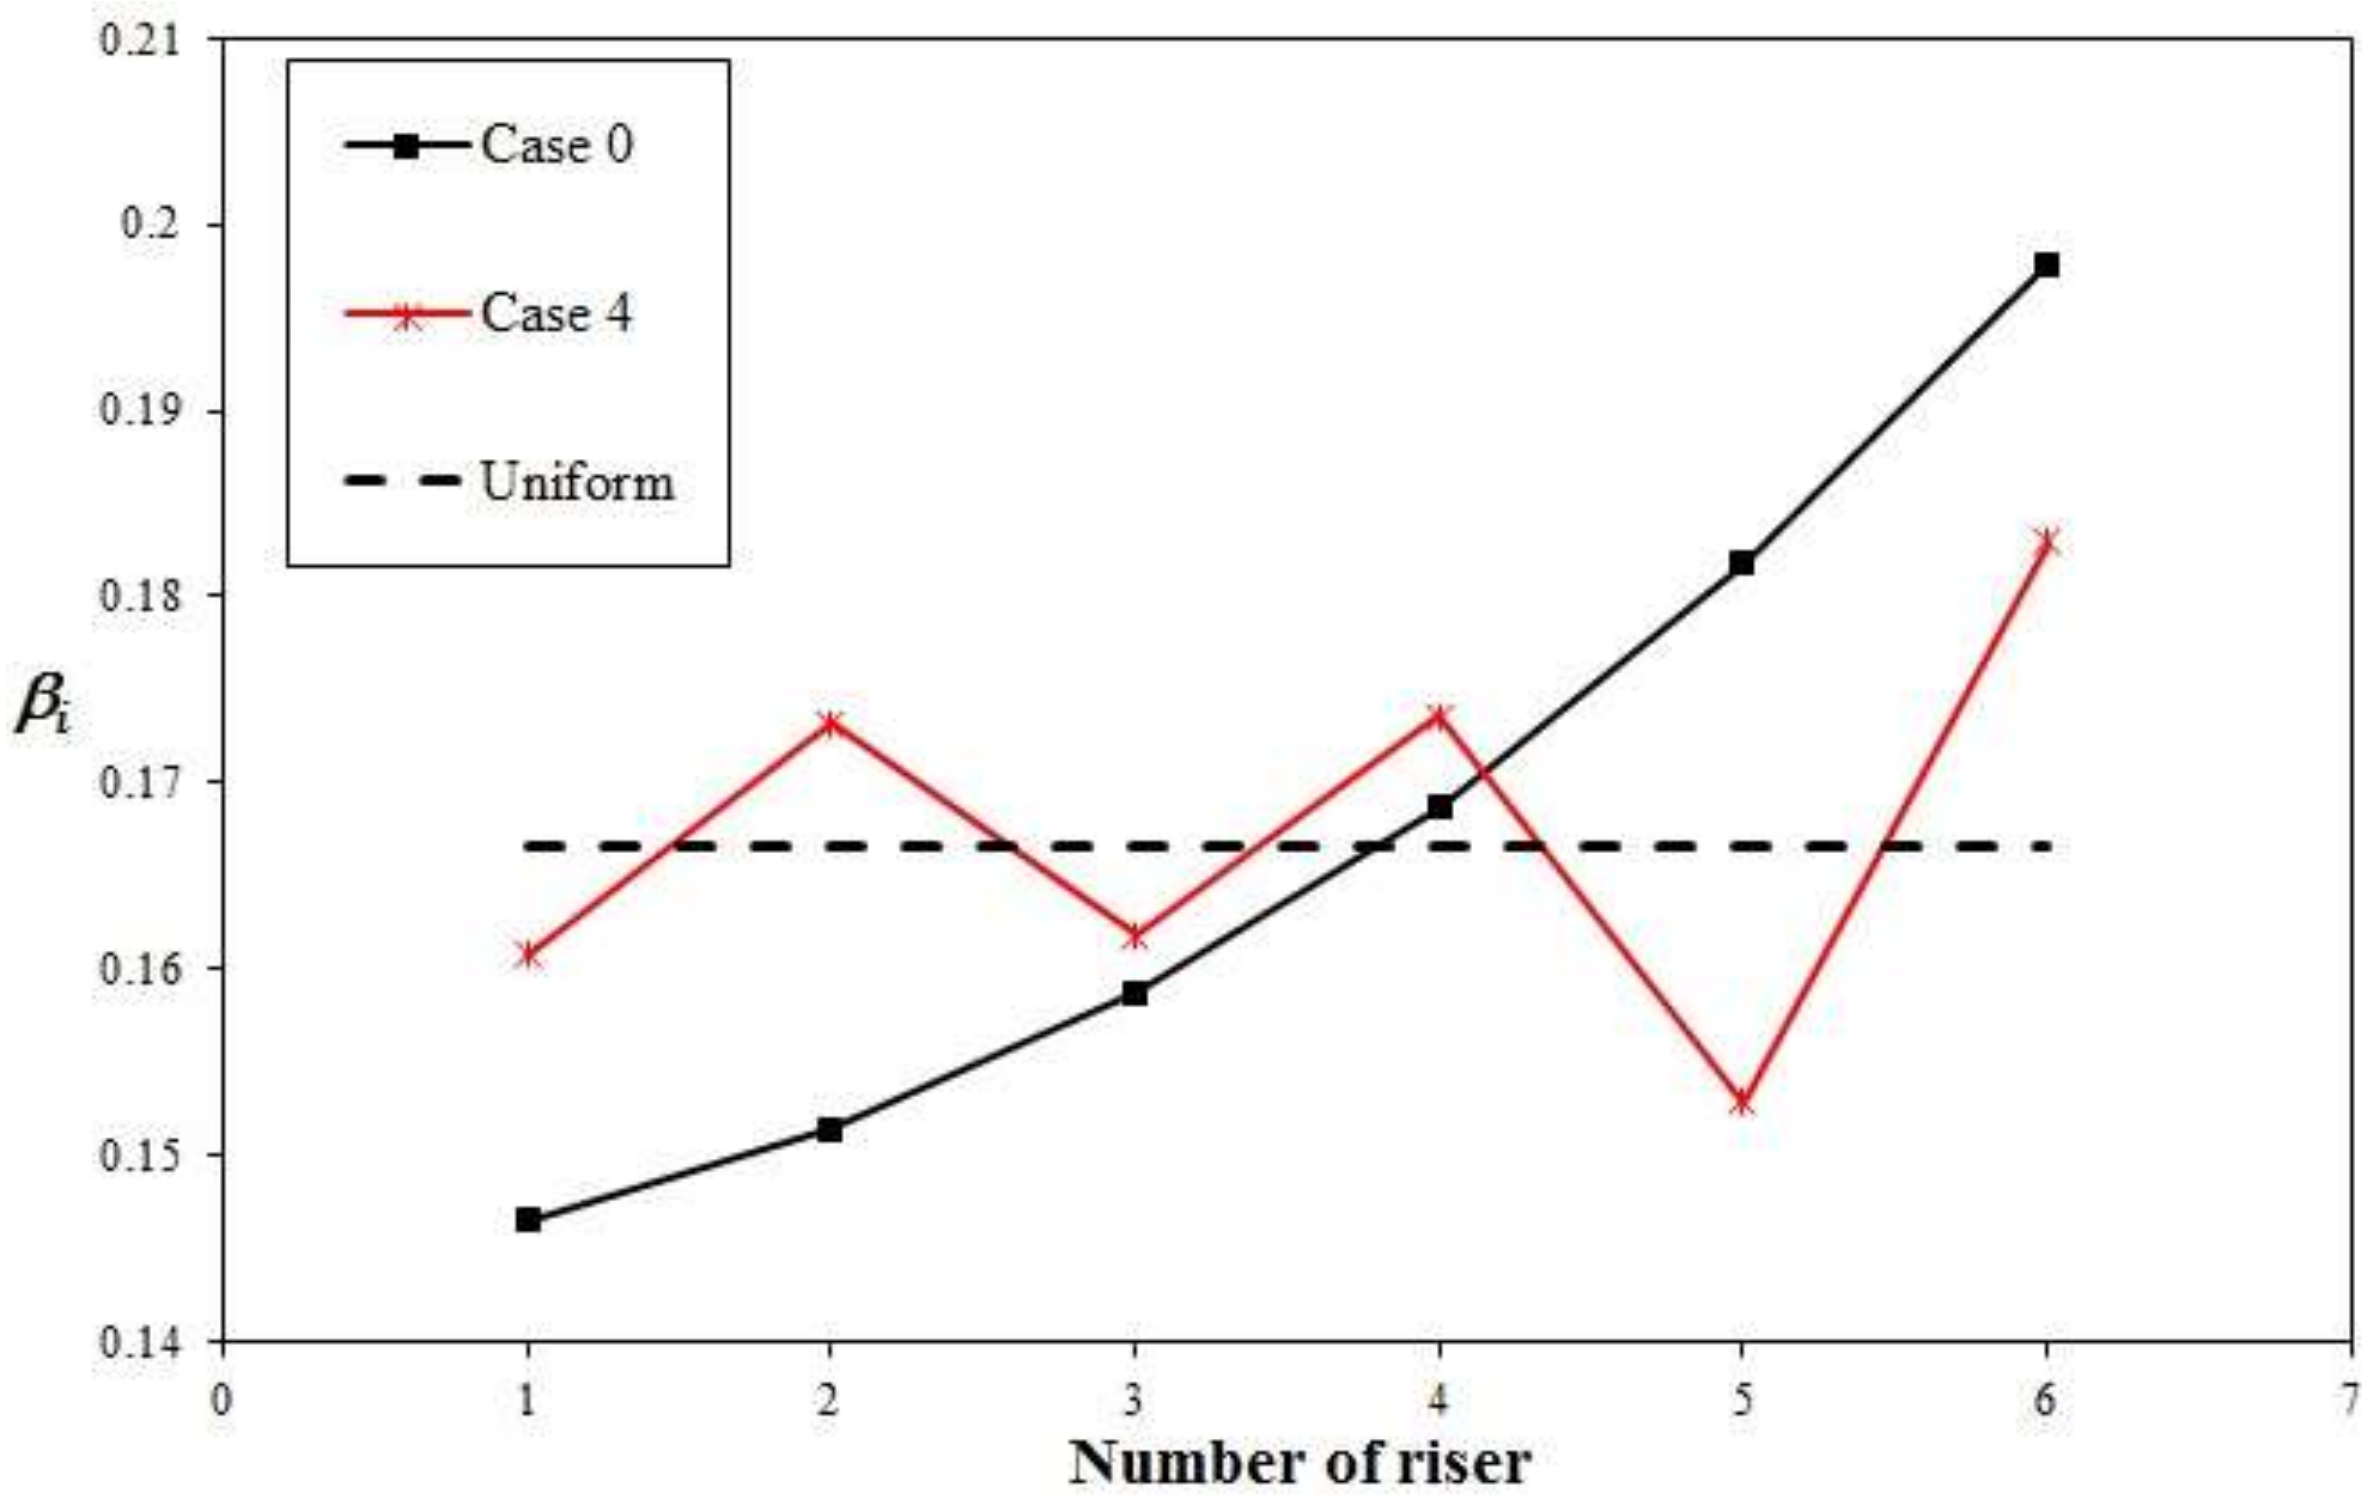
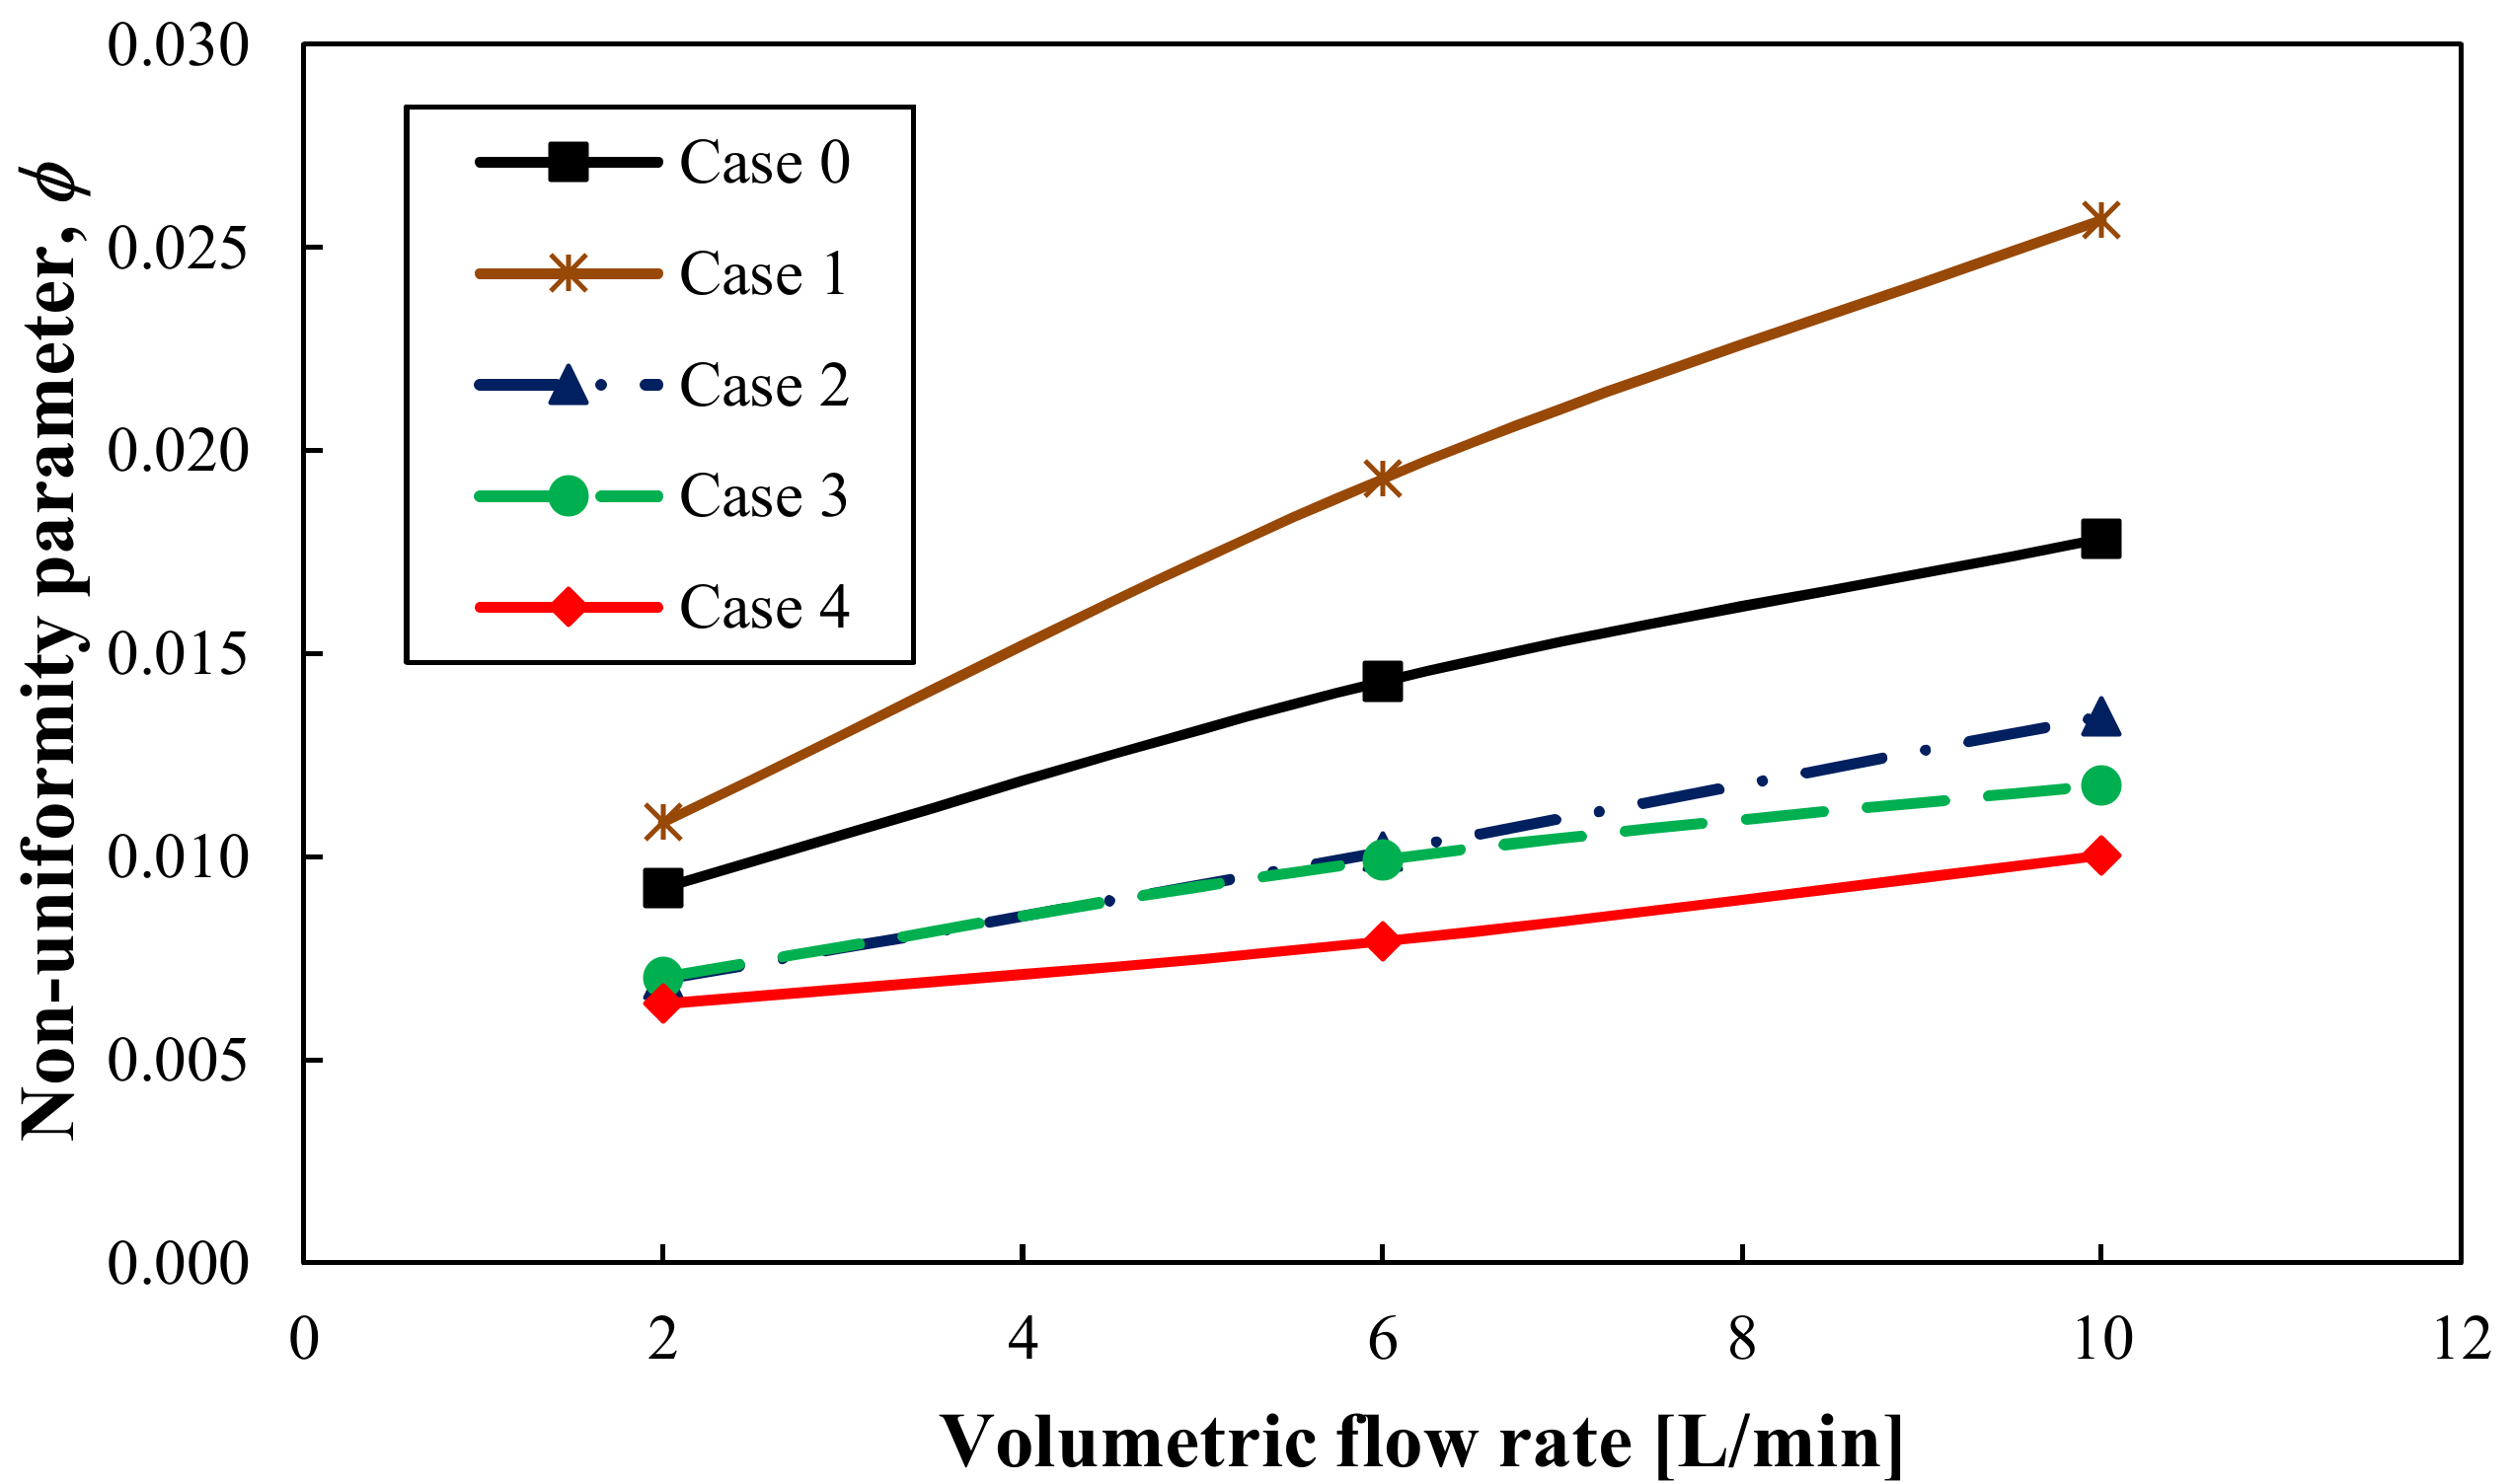
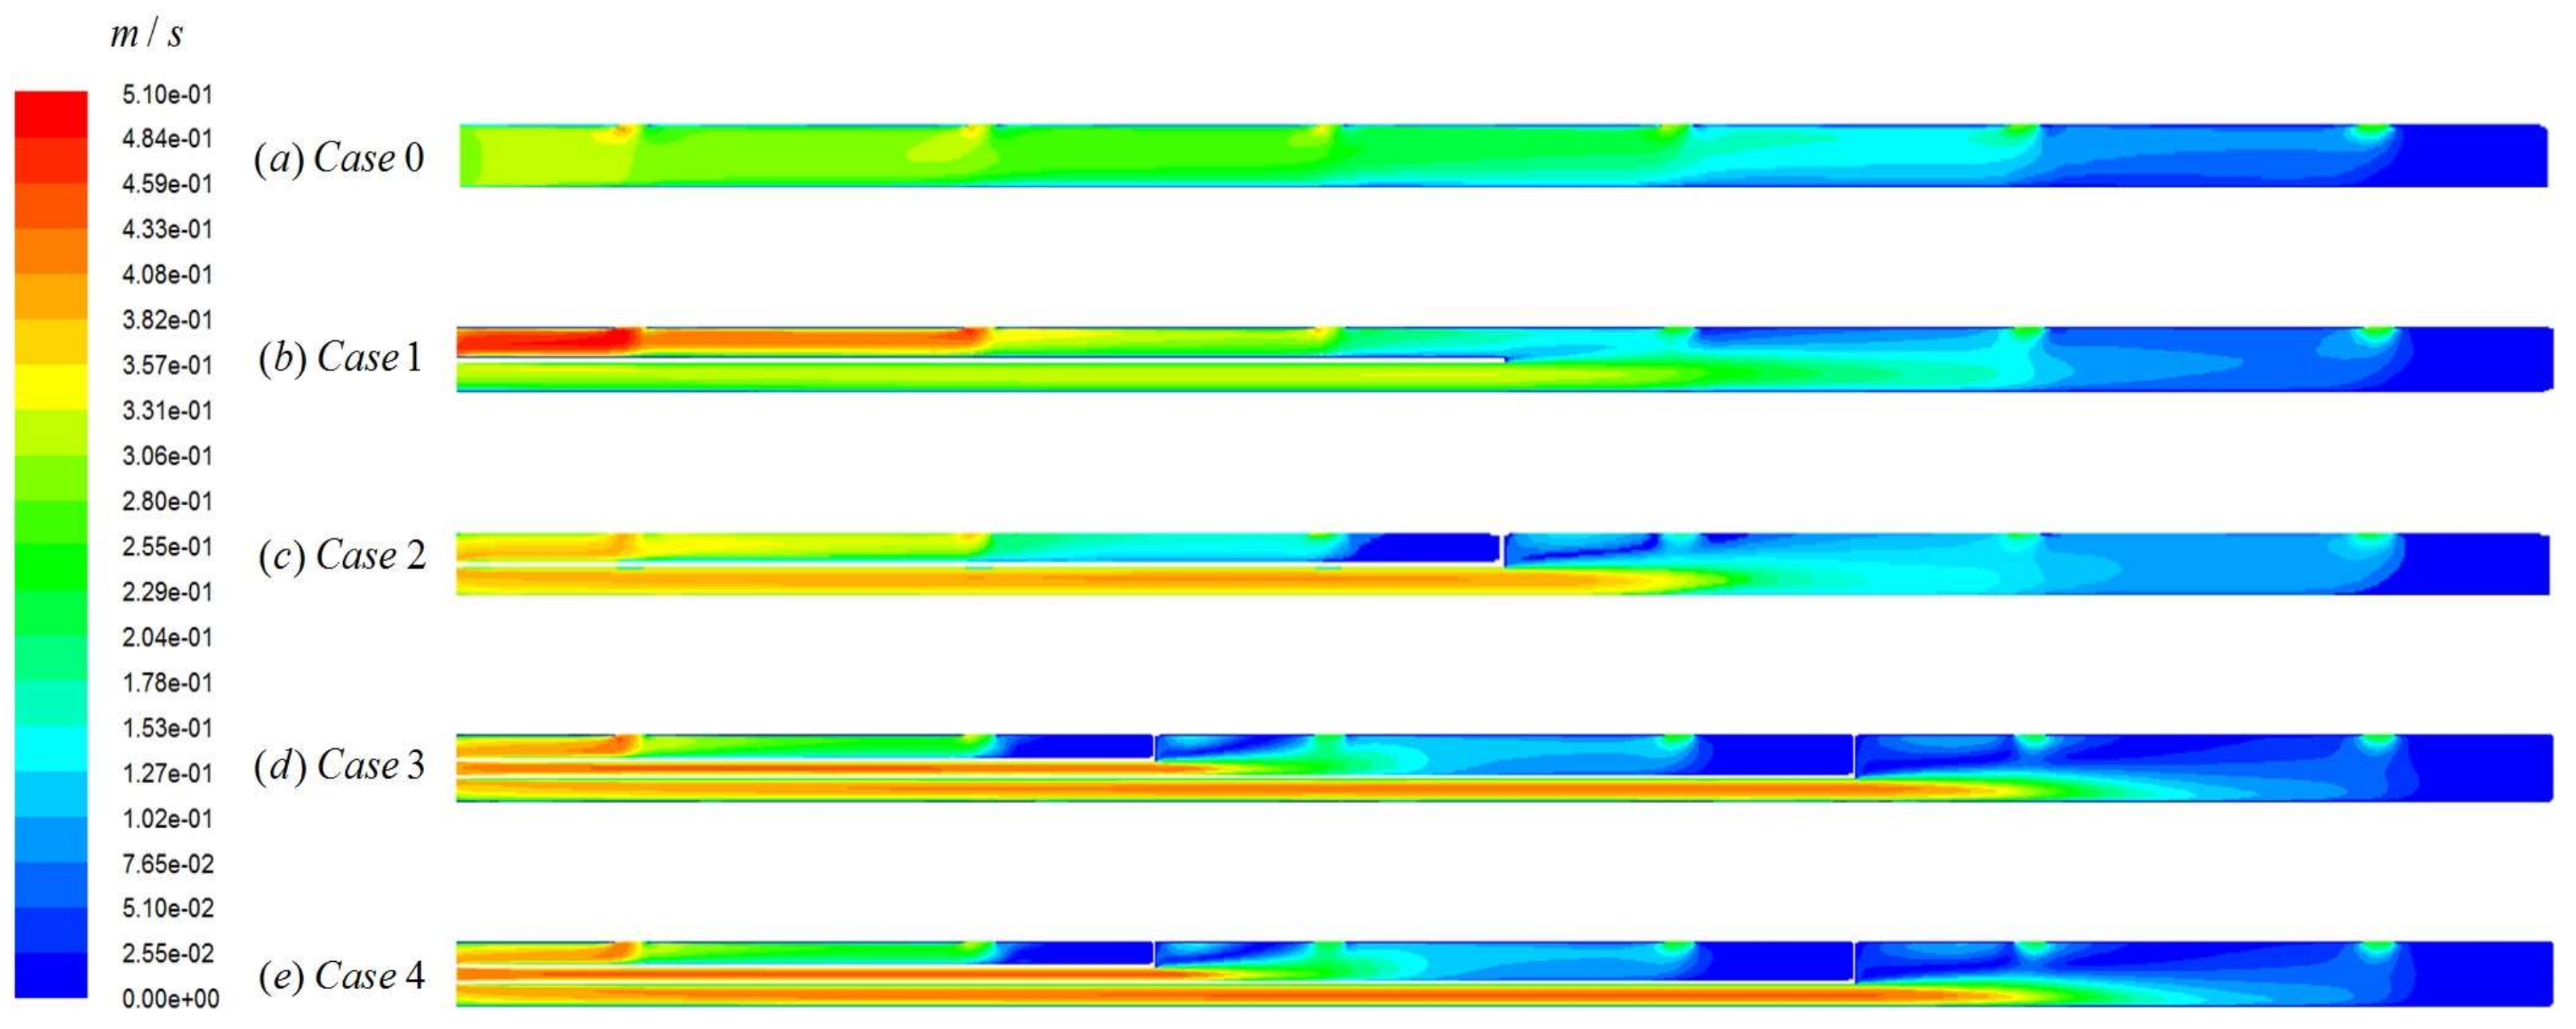
3.3. Flow Distribution Analysis
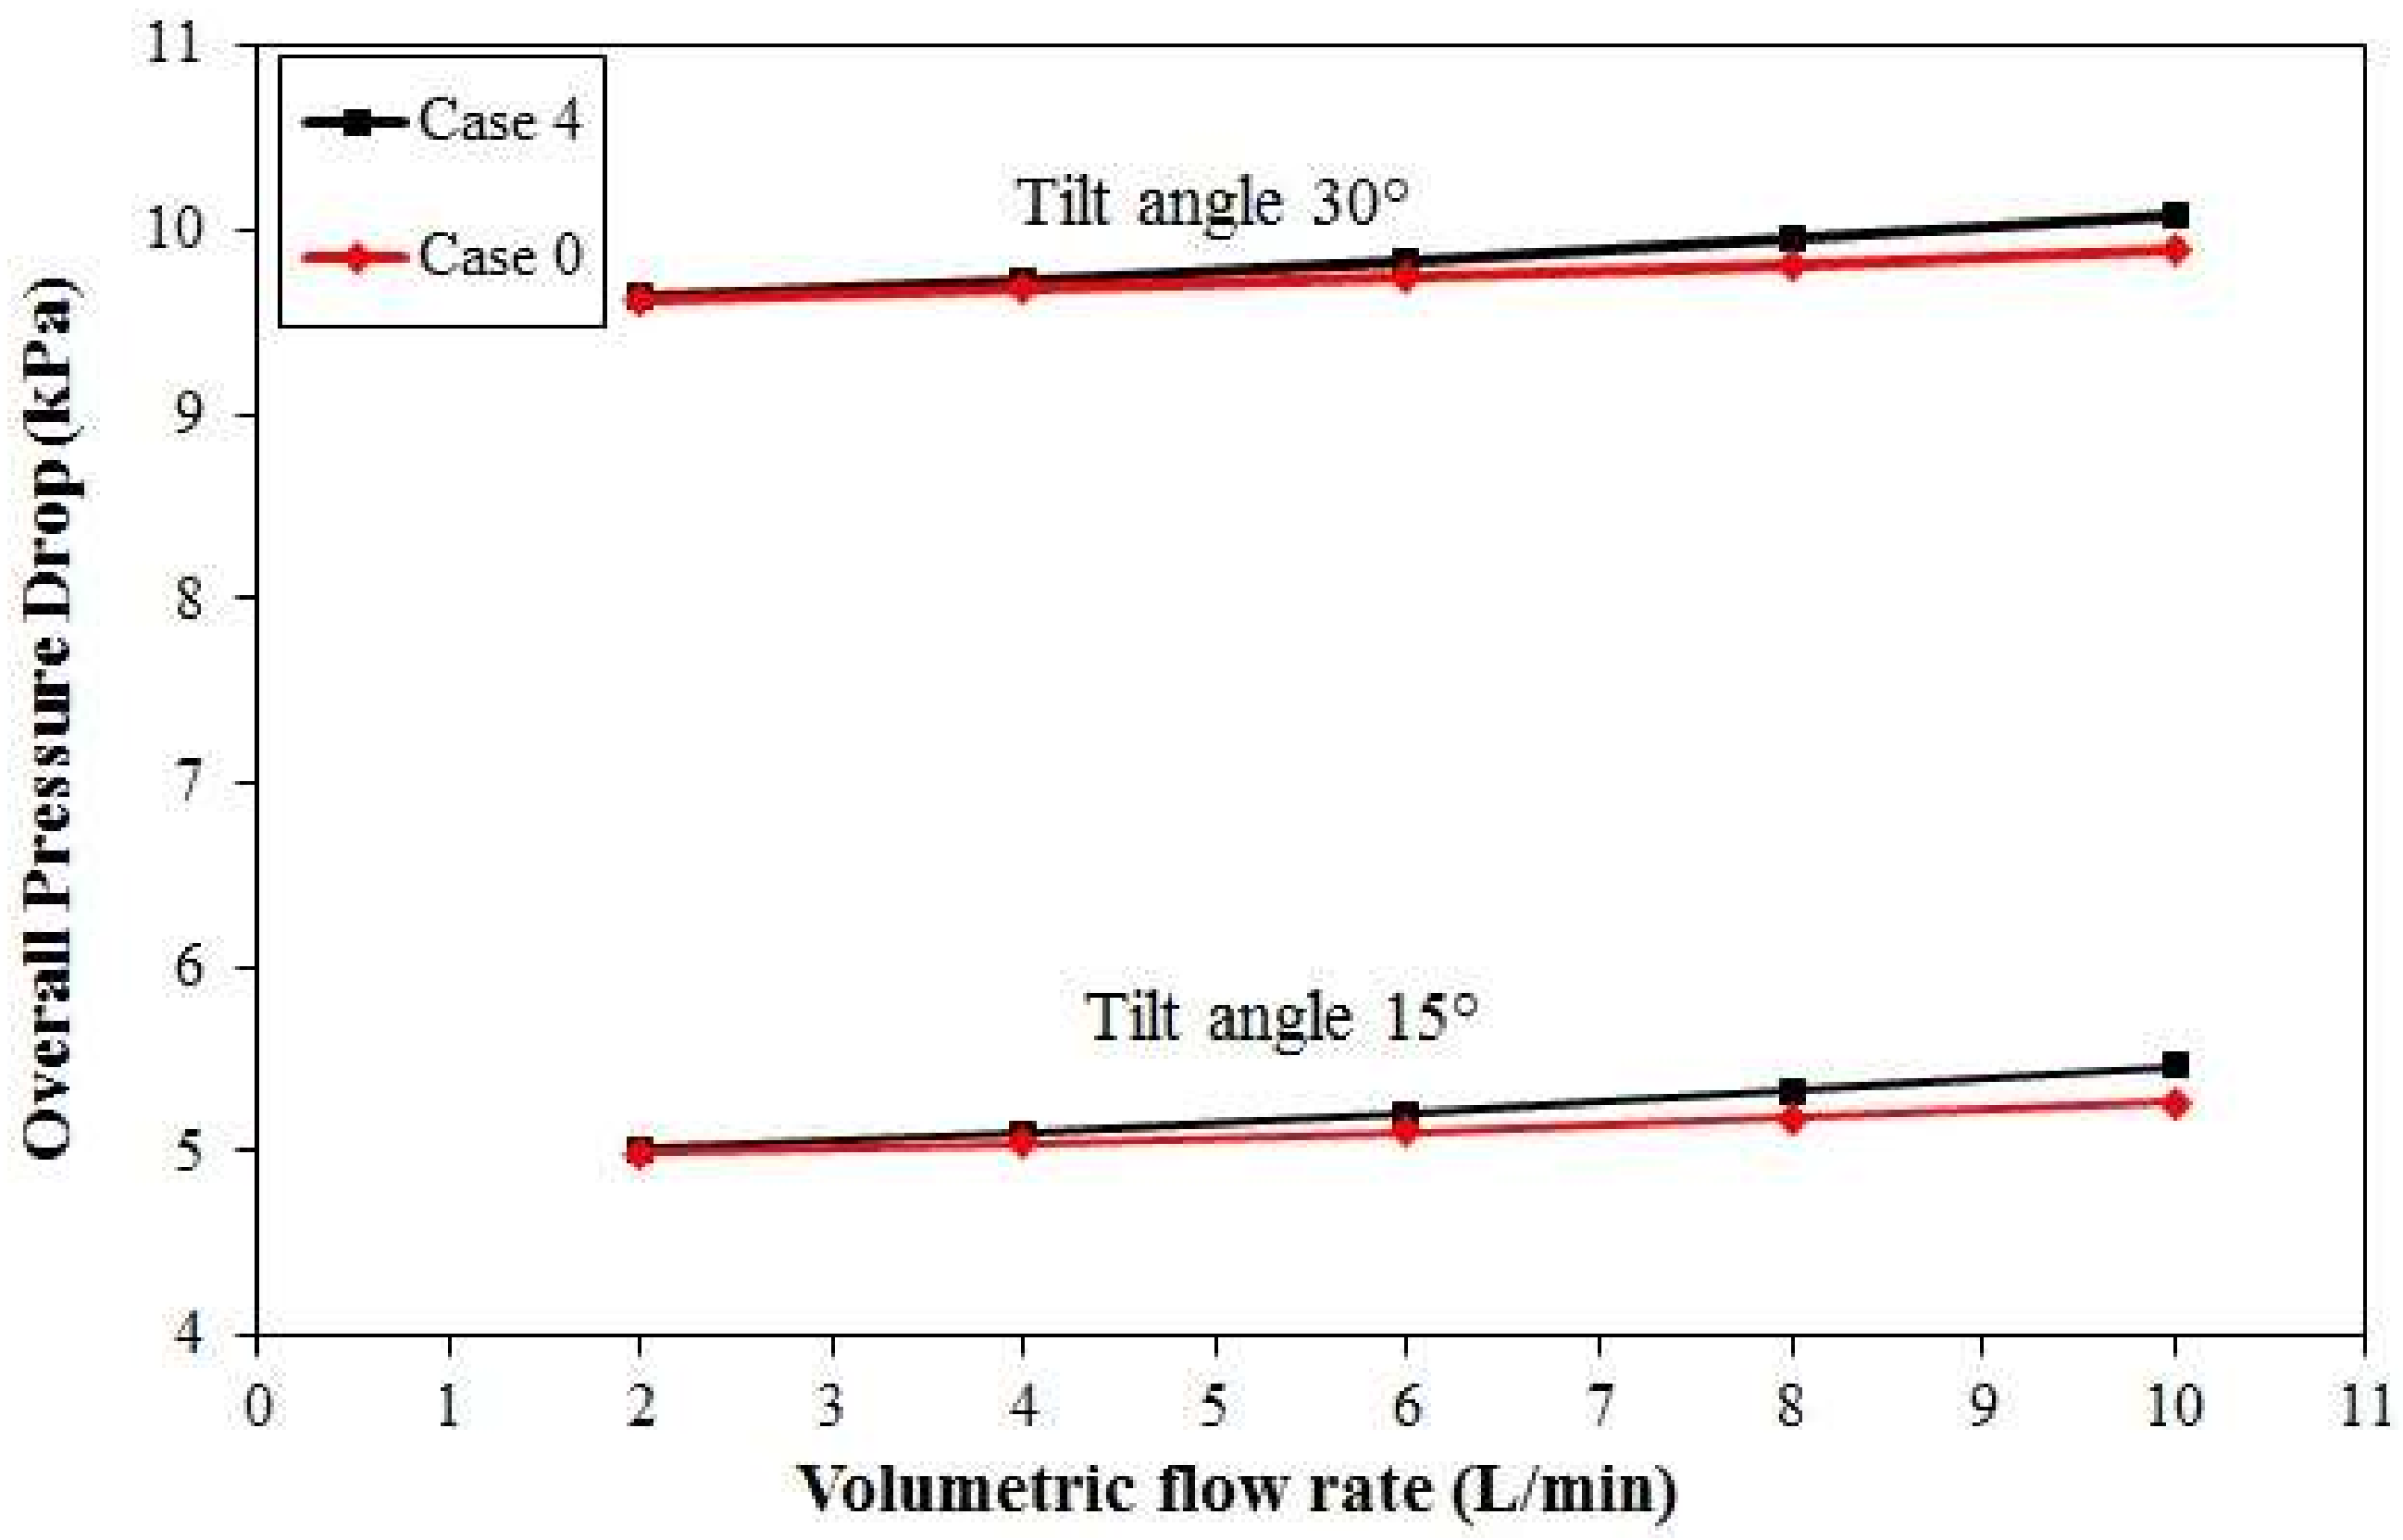
3.4. Overall Pressure Drop Analysis
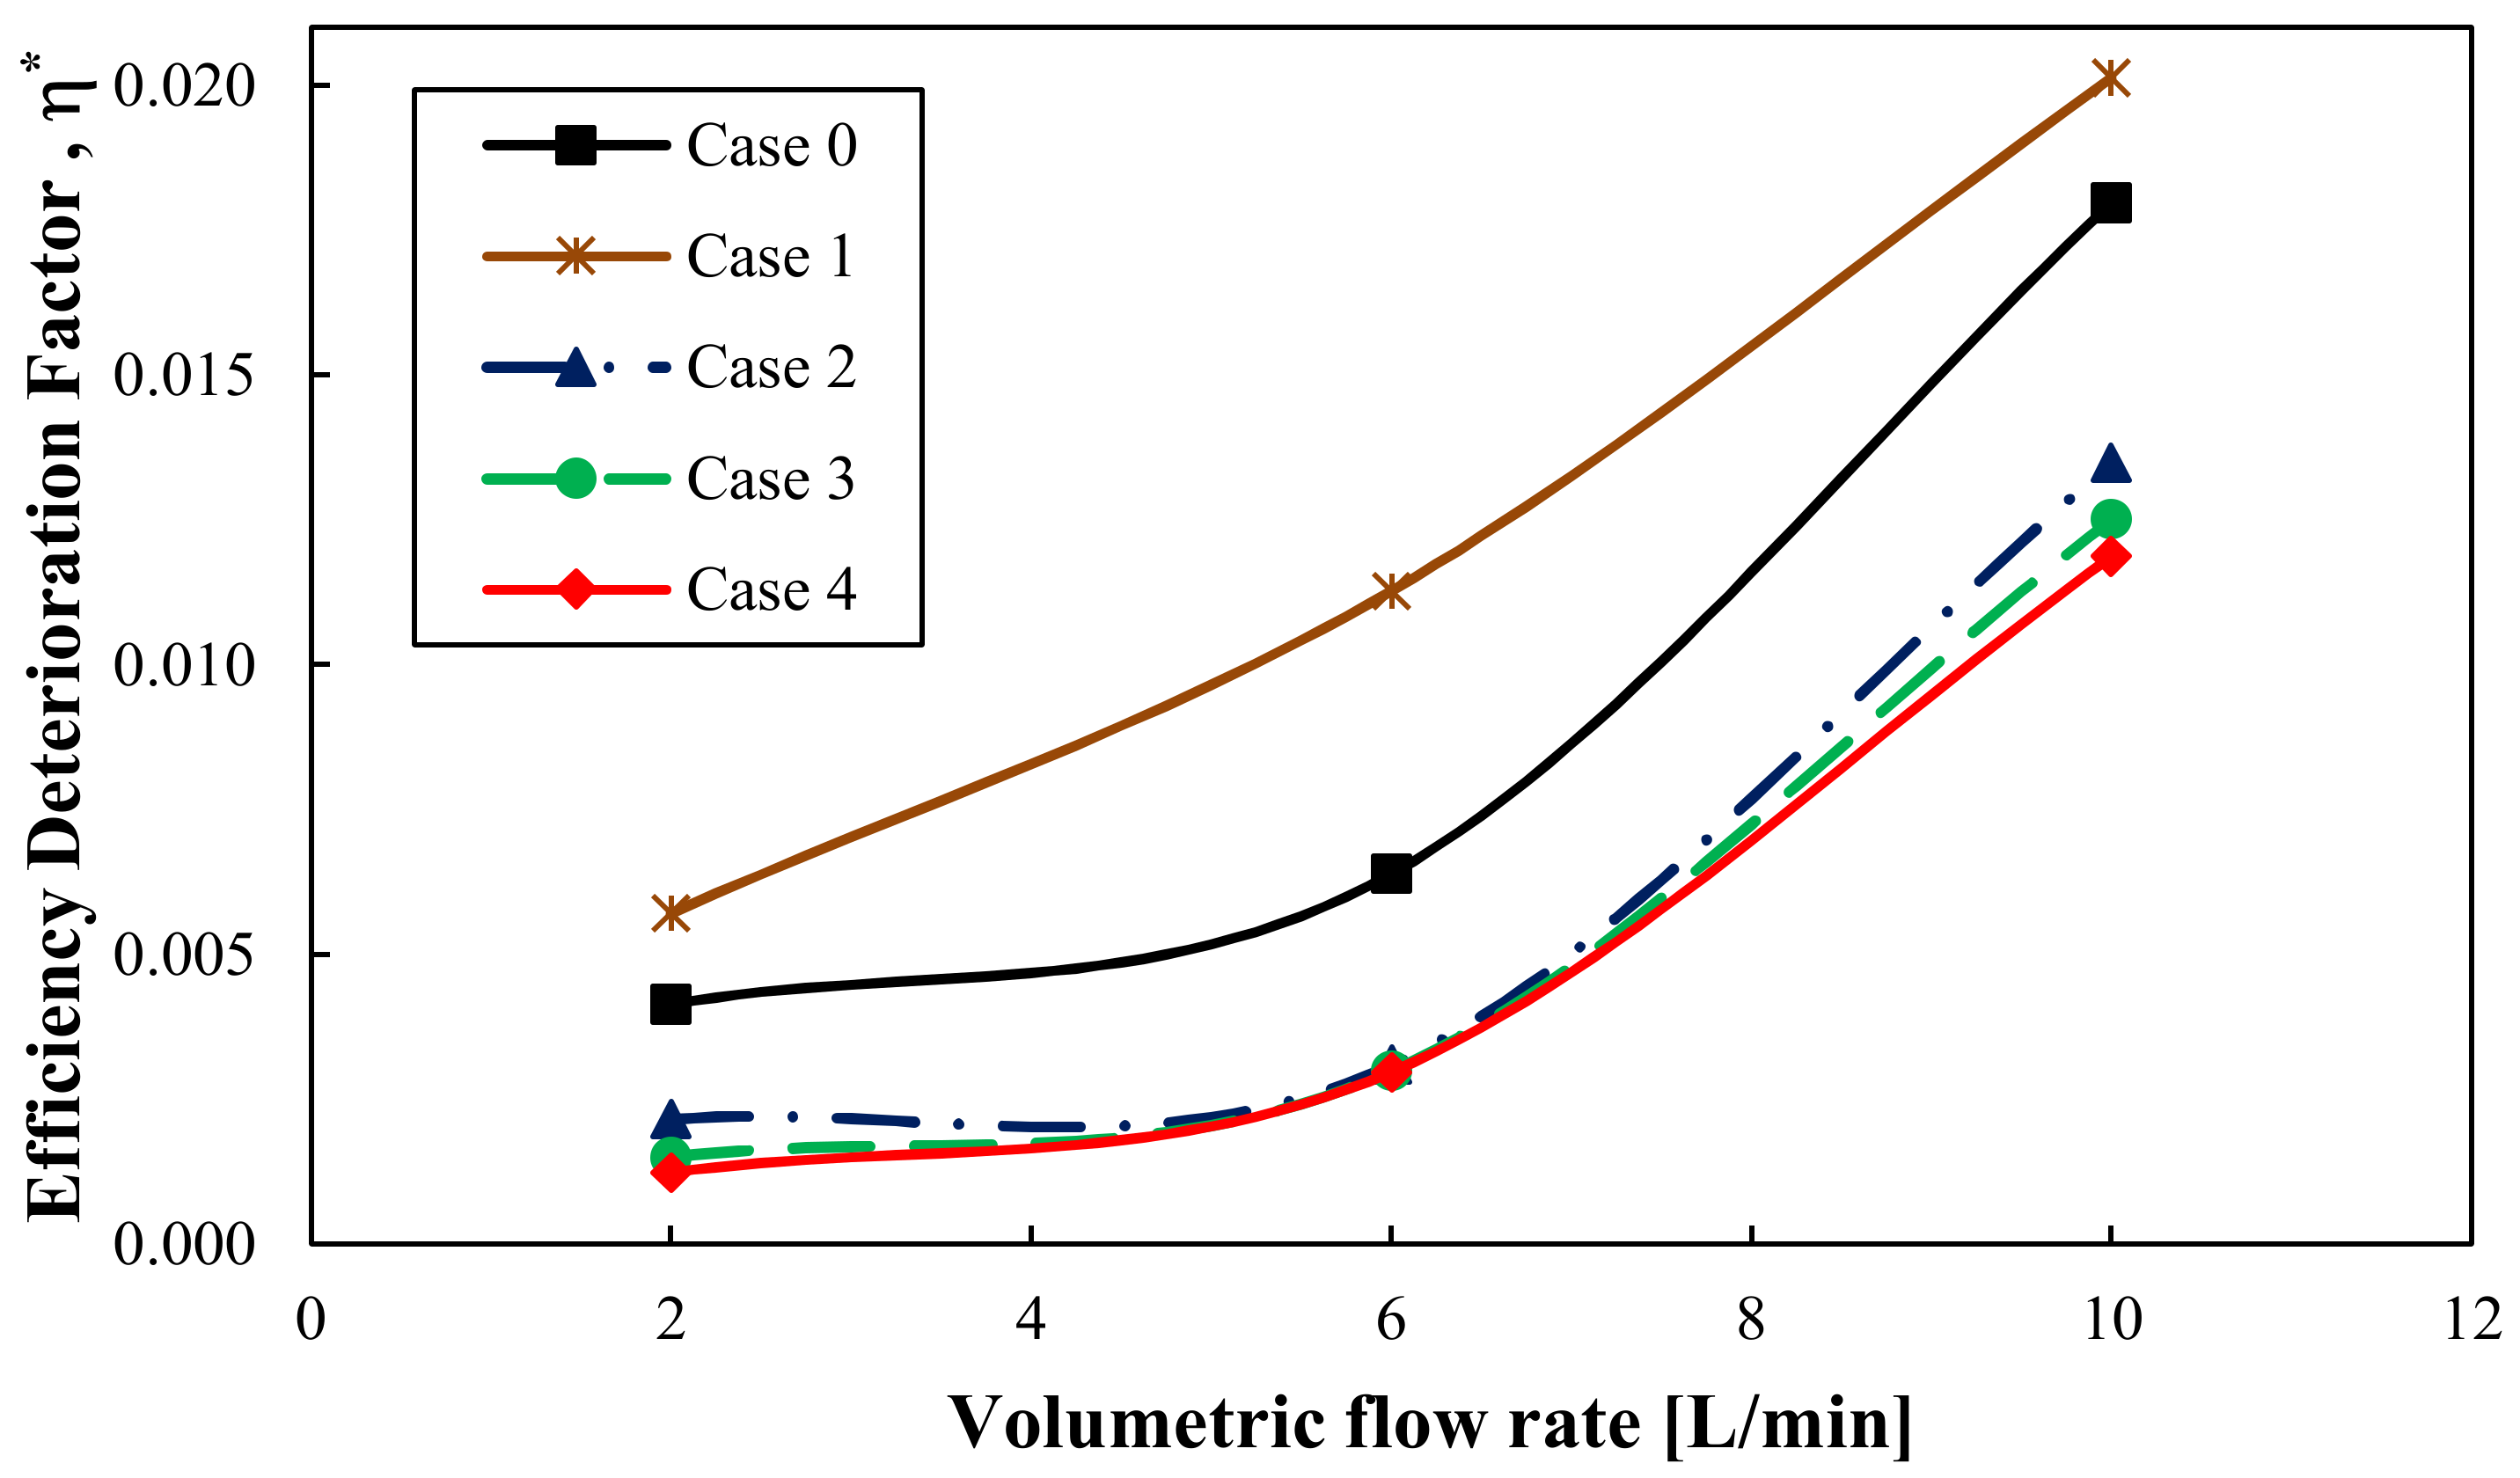
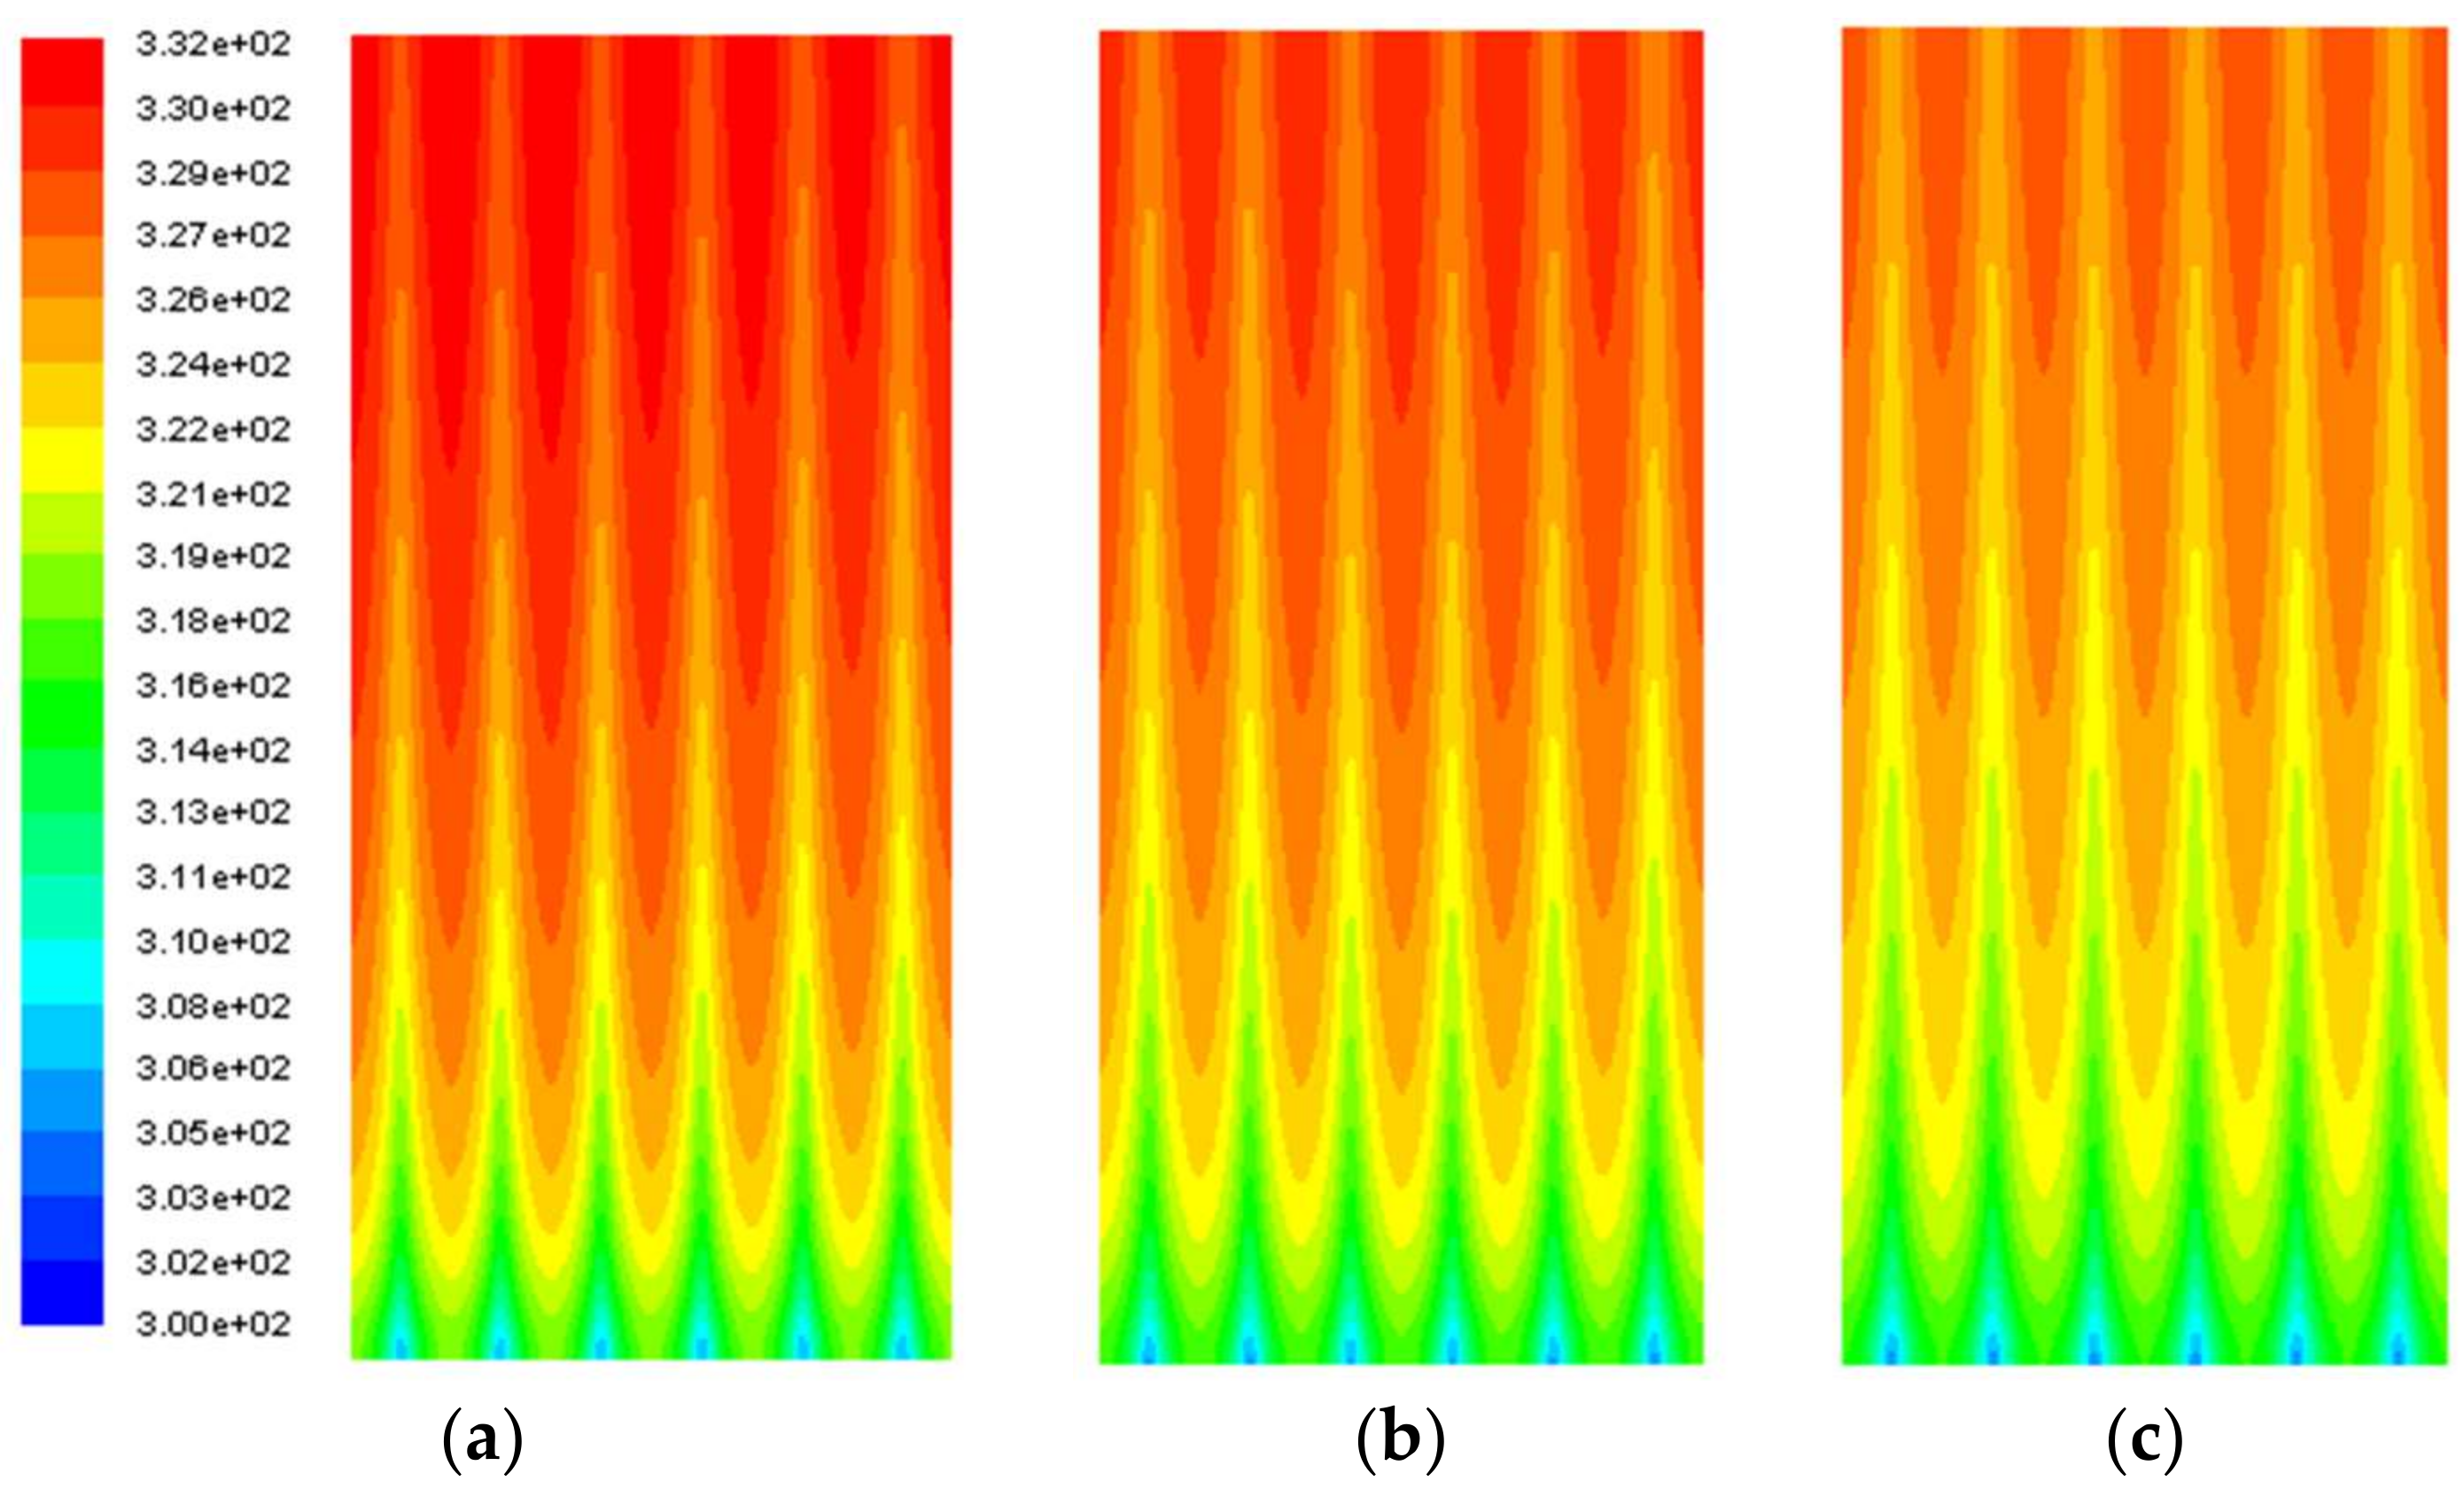
4. Thermal Analysis
5. Conclusions
Author Contributions
Conflicts of Interest
Nomenclature
| Cμ | Dimensionless constant for turbulent viscosity equal to 0.09 |
| C1ε | First dimensionless constant for the rate of dissipation equation, equal to 1.44 |
| C2ε | Second dimensionless constant for the rate of dissipation equation, equal to 1.92 |
| Cp | Specific heat [m2 s−2 K−1] |
| DH | Manifold diameter [m] |
| Dr | Riser tube diameter [m] |
| g | Force of gravity [m s−2] |
| Gk | Kinetic turbulent energy generation [kg m−1 s−3] |
| h | Sensible enthalpy [m2 s−2] |
| k | Thermal conductivity [kg m s−3 K−1] |
| keff | Effective thermal conductivity [kg m s−3 K−1] |
| L | Distance between riser tubes [m] |
| Lr | Riser tubes length [m] |
| LH | Manifolds length [m] |
| IT | Turbulent intensity [%] |
| ṁ | Mass flow rate [kg/s] |
| P | Pressure [Pa] |
| Prt | Turbulent Prandtl number [-] |
| Qi | Volumetric flow rate through the ith riser tube [m3 s−1] |
| Qo | Total volumetric flow rate at the inlet [m3 s−1] |
| ui | Velocity vector [m s−1] |
| Greek Symbols | |
| i | Ratio of riser flow to inlet flow Qi/Qo [-] |
| η* | Efficiency deterioration factor [-] |
| ε | Rate of dissipation of turbulent kinetic energy [m−2 s−3] |
| φ | Non-uniformity parameter [-] |
| κ | Turbulent kinetic energy [m−2 s−2] |
| μ | Viscosity [kg m s] |
| ρ | Density [kg m−3] |
| θ | Tilt angle [°] |
| τ | Wall shear stress [N m−2] |
References
- Nielsen, K.K.; Engelbrecht, K.; Christensen, D.V.; Jensen, J.B.; Smith, A.; Bahl, C.R.H. Degradation of the performance of microchannel heat exchangers due to flow maldistribution. Appl. Therm. Eng. 2012, 40, 236–247. [Google Scholar] [CrossRef]
- Nielsen, K.K.; Engelbrecht, K.; Bahl, C.R.H. The influence of flow maldistribution on the performance of inhomogeneous parallel plate heat exchangers. Int. J. Heat Mass Transf. 2013, 60, 432–439. [Google Scholar] [CrossRef]
- Yin, H.; Ding, J.; Jiang, R.; Yang, X. Thermocline characteristics of molten-salt thermal energy storage in porous packed-bed tank. Appl. Therm. Eng. 2017, 110, 855–863. [Google Scholar] [CrossRef]
- Mohan, G.; Rao, B.P.; Das, S.K.; Pandiyan, S.; Rajalakshmi, N.; Dhathathreyan, K.S. Analysis of Flow Maldistribution of Fuel and Oxidant in a PEMFC. J. Energy Resour. Technol. 2004, 126, 262–270. [Google Scholar] [CrossRef]
- Chiou, J.P. The effect of nonuniform fluid flow distribution on the thermal performance of solar collector. Sol. Energy 1982, 29, 487–502. [Google Scholar] [CrossRef]
- Bava, F.; Dragsted, J.; Furbo, S. A numerical model to evaluate the flow distribution in a large solar collector field. Sol. Energy 2017, 143, 31–42. [Google Scholar] [CrossRef]
- Martínez-Rodríguez, G.; Fuentes-Silva, A.L.; Picón-Núñez, M. Solar thermal networks operating with evacuated-tube collectors. Energy 2017, 146, 26–33. [Google Scholar] [CrossRef]
- Zhou, C.; Liang, R.; Zhang, J. Optimization Design Method and Experimental Validation of a Solar PVT Cogeneration System Based on Building Energy Demand. Energies 2017, 10, 1281. [Google Scholar] [CrossRef]
- Montoya-Marquez, O.; Flores-Prieto, J.J. The Effect of the Angle of Inclination on the Efficiency in a Medium-Temperature Flat Plate Solar Collector. Energies 2017, 10, 71. [Google Scholar] [CrossRef]
- Broekaert, S.; De Cuyper, T.; De Paepe, M.; Verhelst, S. Evaluation of empirical heat transfer models for HCCI combustion in a CFR engine. Appl. Energy 2017, 205, 1141–1150. [Google Scholar] [CrossRef]
- Kang, W.; Shin, Y.; Cho, H. Economic Analysis of Flat-Plate and U-Tube Solar Collectors Using an Al2O3 Nanofluid. Energies 2017, 10, 1911. [Google Scholar] [CrossRef]
- Duffie, J.A.; Beckman, W.A. Solar Engineering of Thermal Processes, 4th ed.; Wiley: Hoboken, NJ, USA, 2013; ISBN 978-0-470-87366-3. [Google Scholar]
- Dunkle, R.V.; Davey, E.T. Flow distribution on absorber banks. In Proceedings of the International Solar Energy Society Conference, Melbourne, Australia, 2–6 March 1970. [Google Scholar]
- Fan, J.; Shah, L.J.; Furbo, S. Flow distribution in a solar collector panel with horizontally inclined absorber strips. Sol. Energy 2007, 81, 1501–1511. [Google Scholar] [CrossRef]
- Jones, G.F.; Lior, N. Flow distribution in manifolded solar collectors with negligible buoyancy effects. Sol. Energy 1994, 52, 289–300. [Google Scholar] [CrossRef]
- Datta, A.B.; Majumdar, A.K. Flow distribution in parallel and reverse flow manifolds. Int. J. Heat Fluid Flow 1980, 2, 253–262. [Google Scholar] [CrossRef]
- Villar, N.M.; López, J.M.C.; Muñoz, F.D.; García, E.R.; Andrés, A.C. Numerical 3-D heat flux simulations on flat plate solar collectors. Sol. Energy 2009, 83, 1086–1092. [Google Scholar] [CrossRef]
- Cruz-Peragon, F.; Palomar, J.M.; Casanova, P.J.; Dorado, M.P.; Manzano-Agugliaro, F. Characterization of solar flat plate collectors. Renew. Sustain. Energy Rev. 2012, 16, 1709–1720. [Google Scholar] [CrossRef]
- Wang, J. Theory of flow distribution in manifolds. Chem. Eng. J. 2011, 168, 1331–1345. [Google Scholar] [CrossRef]
- Wang, J.; Gao, Z.; Gan, G.; Wu, D. Analytical solution of flow coefficients for a uniformly distributed porous channel. Chem. Eng. J. 2001, 84, 1–6. [Google Scholar] [CrossRef]
- Wang, J. Pressure drop and flow distribution in parallel-channel configurations of fuel cells: U-type arrangement. Int. J. Hydrog. Energy 2008, 33, 6339–6350. [Google Scholar] [CrossRef]
- Wang, J. Pressure drop and flow distribution in parallel-channel configurations of fuel cells: Z-type arrangement. Int. J. Hydrog. Energy 2010, 35, 5498–5509. [Google Scholar] [CrossRef]
- Majumdar, A.K. Mathematical modelling of flows in dividing and combining flow manifold. Appl. Math. Model. 1980, 4, 424–432. [Google Scholar] [CrossRef]
- Maharudrayya, S.; Jayanti, S.; Deshpande, A.P. Flow distribution and pressure drop in parallel-channel configurations of planar fuel cells. J. Power Sources 2005, 144, 94–106. [Google Scholar] [CrossRef]
- Wang, J. Design method of flow distribution in nuclear reactor systems. Nucl. Process Eng. 2013, 91, 595–602. [Google Scholar] [CrossRef]
- Acrivos, A.; Babcock, B.D.; Pigford, R.L. Flow distributions in manifolds. Chem. Eng. Sci. 1959, 10, 112–124. [Google Scholar] [CrossRef]
- Wang, J.; Wang, H. Discrete approach for flow field designs of parallel channel configurations in fuel cells. Int. J. Hydrog. Energy 2012, 37, 10881–10897. [Google Scholar] [CrossRef]
- Liu, J.; Li, H.; Lei, X.; Zhang, Q.; Li, L. An improved model on flow distributions of supercritical pressure water in parallel heated pipes. Appl. Therm. Eng. 2018, 130, 793–803. [Google Scholar] [CrossRef]
- Weitbrecht, V.; Lehmann, D.; Richter, A. Flow distribution in solar collectors with laminar flow conditions. Sol. Energy 2002, 73, 433–441. [Google Scholar] [CrossRef]
- Ríos Orozco, C.O.; Uzarraga-Rodriguez, N.C.; Gallegos-Muñoz, A.; Riesco Ávila, J.M. Flow Distribution in Flat Solar Collectors Systems Interconnected. In Proceedings of the ASME 6th International Conference of Energy Sustainability & 10th Fuel Cell Science, Engineering and Technology Conference, San Diego, CA, USA, 23–26 July 2012; pp. 1207–1216. [Google Scholar]
- Facão, J. Optimization of flow distribution in flat plate solar thermal collectors with riser and header arrangements. Sol. Energy 2015, 120, 104–112. [Google Scholar] [CrossRef]
- Huang, C.-H.; Wang, C.-H. The design of uniform tube flow rates for Z-type compact parallel flow heat exchangers. Int. J. Heat Mass Transf. 2013, 57, 608–622. [Google Scholar] [CrossRef]
- Wang, C.-C.; Yang, K.-S.; Tsai, J.-S.; Chen, I.Y. Characteristics of flow distribution in compact parallel flow heat exchangers, part I: Typical inlet header. Appl. Therm. Eng. 2011, 31, 3226–3234. [Google Scholar] [CrossRef]
- Cerón, J.F.; Pérez-García, J.; Solano, J.P.; García, A.; Herrero-Martín, R. A coupled numerical model for tube-on-sheet flat-plate solar liquid collectors. Analysis and validation of the heat transfer mechanisms. Appl. Energy 2015, 140, 275–287. [Google Scholar] [CrossRef]
- Kim, S.; Choi, E.; Cho, Y.I. The effect of header shapes on the flow distribution in a manifold for electronic packaging applications. Int. Commun. Heat Mass Transf. 1995, 22, 329–341. [Google Scholar] [CrossRef]
- Tonomura, O.; Tanaka, S.; Noda, M.; Kano, M.; Hasebe, S.; Hashimoto, I. CFD-based optimal design of manifold in plate-fin microdevices. Chem. Eng. J. 2004, 101, 397–402. [Google Scholar] [CrossRef]
- Griffini, G.; Gavriilidis, A. Effect of Microchannel Plate Design on Fluid Flow Uniformity at Low Flow Rates. Chem. Eng. Technol. 2007, 30, 395–406. [Google Scholar] [CrossRef]
- Pan, M.; Tang, Y.; Zhou, W.; Lu, L. Flow Distribution among Microchannels with Asymmetrical Manifolds. In Proceedings of the 2007 IEEE International Conference on Control and Automation, Guangzhou, China, 30 May–1 June 2007; pp. 193–197. [Google Scholar]
- Pan, M.; Tang, Y.; Pan, L.; Lu, L. Optimal design of complex manifold geometries for uniform flow distribution between microchannels. Chem. Eng. J. 2008, 137, 339–346. [Google Scholar] [CrossRef]
- Pan, M.; Wei, X.; Zeng, D.; Tang, Y. Trend prediction in velocity distribution among microchannels based on the analysis of frictional resistances. Chem. Eng. J. 2010, 164, 238–245. [Google Scholar] [CrossRef]
- Pan, M.; Tang, Y.; Yu, H.; Chen, H. Modeling of velocity distribution among microchannels with triangle manifolds. AIChE J. 2009, 55, 1969–1982. [Google Scholar] [CrossRef]
- Solovitz, S.A.; Mainka, J. Manifold Design for Micro-Channel Cooling With Uniform Flow Distribution. J. Fluids Eng. 2011, 133, 051103. [Google Scholar] [CrossRef]
- Mohammadi, M.; Jovanovic, G.N.; Sharp, K.V. Numerical study of flow uniformity and pressure characteristics within a microchannel array with triangular manifolds. Comput. Chem. Eng. 2013, 52, 134–144. [Google Scholar] [CrossRef]
- Uzarraga-Rodriguez, N.C.; Gallegos-Muñoz, A.; Payan-Rodriguez, L.A.; Belman-Flores, J.M. Analysis of the Manifold Area Change in a Flat Solar Collector. In Proceedings of the ASME 7th International Conference on Energy Sustainability, Minneapolis, MN, USA, 14–19 July 2013. [Google Scholar]
- Missirlis, D.; Martinopoulos, G.; Tsilingiridis, G.; Yakinthos, K.; Kyriakis, N. Investigation of the heat transfer behaviour of a polymer solar collector for different manifold configurations. Renew. Energy 2014, 68, 715–723. [Google Scholar] [CrossRef]
- Yang, H.; Wang, Y.; Ren, M.; Yang, X. Effect of the rectangular exit-port geometry of a distribution manifold on the flow performance. Appl. Therm. Eng. 2017, 117, 481–486. [Google Scholar] [CrossRef]
- Lauder, B.E.; Spalding, D.V. Lectures in Mathematical Models of Turbulence; Academic Press: London, UK, 1972. [Google Scholar]
- Badar, A.W.; Buchholz, R.; Lou, Y.; Ziegler, F. CFD based analysis of flow distribution in a coaxial vacuum tube solar collector with laminar flow conditions. Int. J. Energy Environ. Eng. 2012, 3, 24. [Google Scholar] [CrossRef]


| Model Type | References | Observations |
|---|---|---|
| Analytical | [19,20,21,22,23,24,25] | One-dimensional model based on mass and moment equations. No iterations are required. Constant frictional and loss coefficients. Low computational demands. Acceptable precision. |
| Discrete | [26,27,28,29,30,31] | Lumped model based on mass and moment equations. Iterations are required. Variable frictional and loss coefficients. Some are based on analysis of pipe networks. Low computational demands. Acceptable precision. |
| CFD | [30,31,32,34] | Two-dimensional or three-dimensional models based on the Navier-Stokes equations. Turbulence models can be applied. Large number of iterations are required. No need to know values of frictional and loss coefficients. High computational demands. High precision. |
| References | Model Type/Device | Observations |
|---|---|---|
| [35] | 2D CFD/Liquid cooling module | Effect of manifold shape (trapezoidal, triangular and square); trapezoidal shape reduces the mal distribution effect. |
| [36] | 3D CFD/Plate-fin micro device | Flow distribution depends on manifold shape, channels length and inlet mass flow rate. |
| [37] | 2D 3D models/Microchannel | 2D models overestimate the mal distribution compared to 3D simulations. |
| [38,39,40,41] | Discrete/Microchannels | Flow distribution becomes more uniform when the collector has symmetrical configurations, channel width is increased, manifolds with variable cross section are used. |
| [42] | Discrete/Microchannel | Multi-segmented geometry validated only for laminar flow regime. |
| [43] | 3D CFD/Microhannels | Manifolds with variable cross section improve flow distribution. |
| [44] | 3D CFD/Flat plate solar collectors | Manifolds with variable area. Increasing the ratio of the dividing and combining manifold areas give a good flow distribution. |
| [45] | 3D CFD/Polymer solar collector | Position of the inlet and outlet tubes contribute to flow distribution. |
| [31] | Discrete/Flat plate solar collector | Combining manifold diameter must be larger than dividing manifold. |
| [46] | CFD/Rectangular manifold | Aspect ratio (AR) is a parameter to define the non-uniformity in manifolds with rectangular exit ports. Verification and validation of CFD simulations have not been made. |
| Inlet Flow | |
|---|---|
| Volumetric flow rate | 2–10 [L/min] |
| Turbulent intensity (IT) | 4.7–5.7 [%] |
| Hydraulic diameter (DH) | 0.0265 [m] |
| Outlet Pressure | |
| Pressure at the outlet of the collector (Pout) | 0 [kPa] |
| Turbulent intensity (IT) | 4.7–5.7 [%] |
| Hydraulic diameter (DH) | 0.0265 [m] |
| Walls | |
| Stationary | - |
| No sliding condition | - |
| Roughness | 1.5 × 10⁻⁶ [m] |
| Geometrical Characteristics | |
| Riser length (Lr) | 2.0 [m] |
| Space between risers (L) | 0.1515 [m] |
| Riser diameter (Dr) | 0.0135 [m] |
| Pressure | 101.325 [kPa] |
| Density | 977.78 [kg/m3] |
| Dynamic viscosity | 4.04 × 10⁻⁴ [kg/m∙s] |
| Refinement Level | Number of Elements [Cells] |
|---|---|
| 1 | 317,925 |
| 2 | 877,483 |
| 3 | 1,359,475 |
| 4 | 2,537,036 |
| 5 | 3,157,320 |
| Volumetric flow rate at the inlet | 0.0135 [kg/s] |
| Hydraulic diameter of manifolds (DH) | 0.0168 [m] |
| Gage pressure at the outlet (Pout) | 0 [kPa] |
| No sliding condition in walls | - |
| Roughness of walls | 1.5 × 10⁻⁶ [m] |
| Riser length (Lr) | 1.922 [m] |
| Space between risers (L) | 0.120 [m] |
| Riser diameter (Dr) | 0.0052 [m] |
| Case | 2 L/min | 6 L/min | 10 L/min |
|---|---|---|---|
| 0 | 4.99 | 5.10 | 5.26 |
| 1 | 5.00 | 5.13 | 5.33 |
| 2 | 5.00 | 5.15 | 5.35 |
| 3 | 5.00 | 5.15 | 5.35 |
| 4 | 5.01 | 5.20 | 5.46 |
| Volumetric Flow Rate (L/min) | Case | |||
|---|---|---|---|---|
| 1 | 2 | 3 | 4 | |
| 2 | −1.58 | 1.97 | 2.32 | 2.90 |
| 6 | −4.88 | 3.31 | 3.41 | 3.42 |
| 10 | −2.17 | 4.49 | 5.46 | 6.11 |
© 2018 by the authors. Licensee MDPI, Basel, Switzerland. This article is an open access article distributed under the terms and conditions of the Creative Commons Attribution (CC BY) license (http://creativecommons.org/licenses/by/4.0/).
Share and Cite
García-Guendulain, J.M.; Riesco-Avila, J.M.; Elizalde-Blancas, F.; Belman-Flores, J.M.; Serrano-Arellano, J. Numerical Study on the Effect of Distribution Plates in the Manifolds on the Flow Distribution and Thermal Performance of a Flat Plate Solar Collector. Energies 2018, 11, 1077. https://doi.org/10.3390/en11051077
García-Guendulain JM, Riesco-Avila JM, Elizalde-Blancas F, Belman-Flores JM, Serrano-Arellano J. Numerical Study on the Effect of Distribution Plates in the Manifolds on the Flow Distribution and Thermal Performance of a Flat Plate Solar Collector. Energies. 2018; 11(5):1077. https://doi.org/10.3390/en11051077
Chicago/Turabian StyleGarcía-Guendulain, Juan Manuel, José Manuel Riesco-Avila, Francisco Elizalde-Blancas, Juan Manuel Belman-Flores, and Juan Serrano-Arellano. 2018. "Numerical Study on the Effect of Distribution Plates in the Manifolds on the Flow Distribution and Thermal Performance of a Flat Plate Solar Collector" Energies 11, no. 5: 1077. https://doi.org/10.3390/en11051077
APA StyleGarcía-Guendulain, J. M., Riesco-Avila, J. M., Elizalde-Blancas, F., Belman-Flores, J. M., & Serrano-Arellano, J. (2018). Numerical Study on the Effect of Distribution Plates in the Manifolds on the Flow Distribution and Thermal Performance of a Flat Plate Solar Collector. Energies, 11(5), 1077. https://doi.org/10.3390/en11051077