Design Optimization of a Complex Polygeneration System for a Hospital


Abstract
:1. Introduction
2. Problem Statement
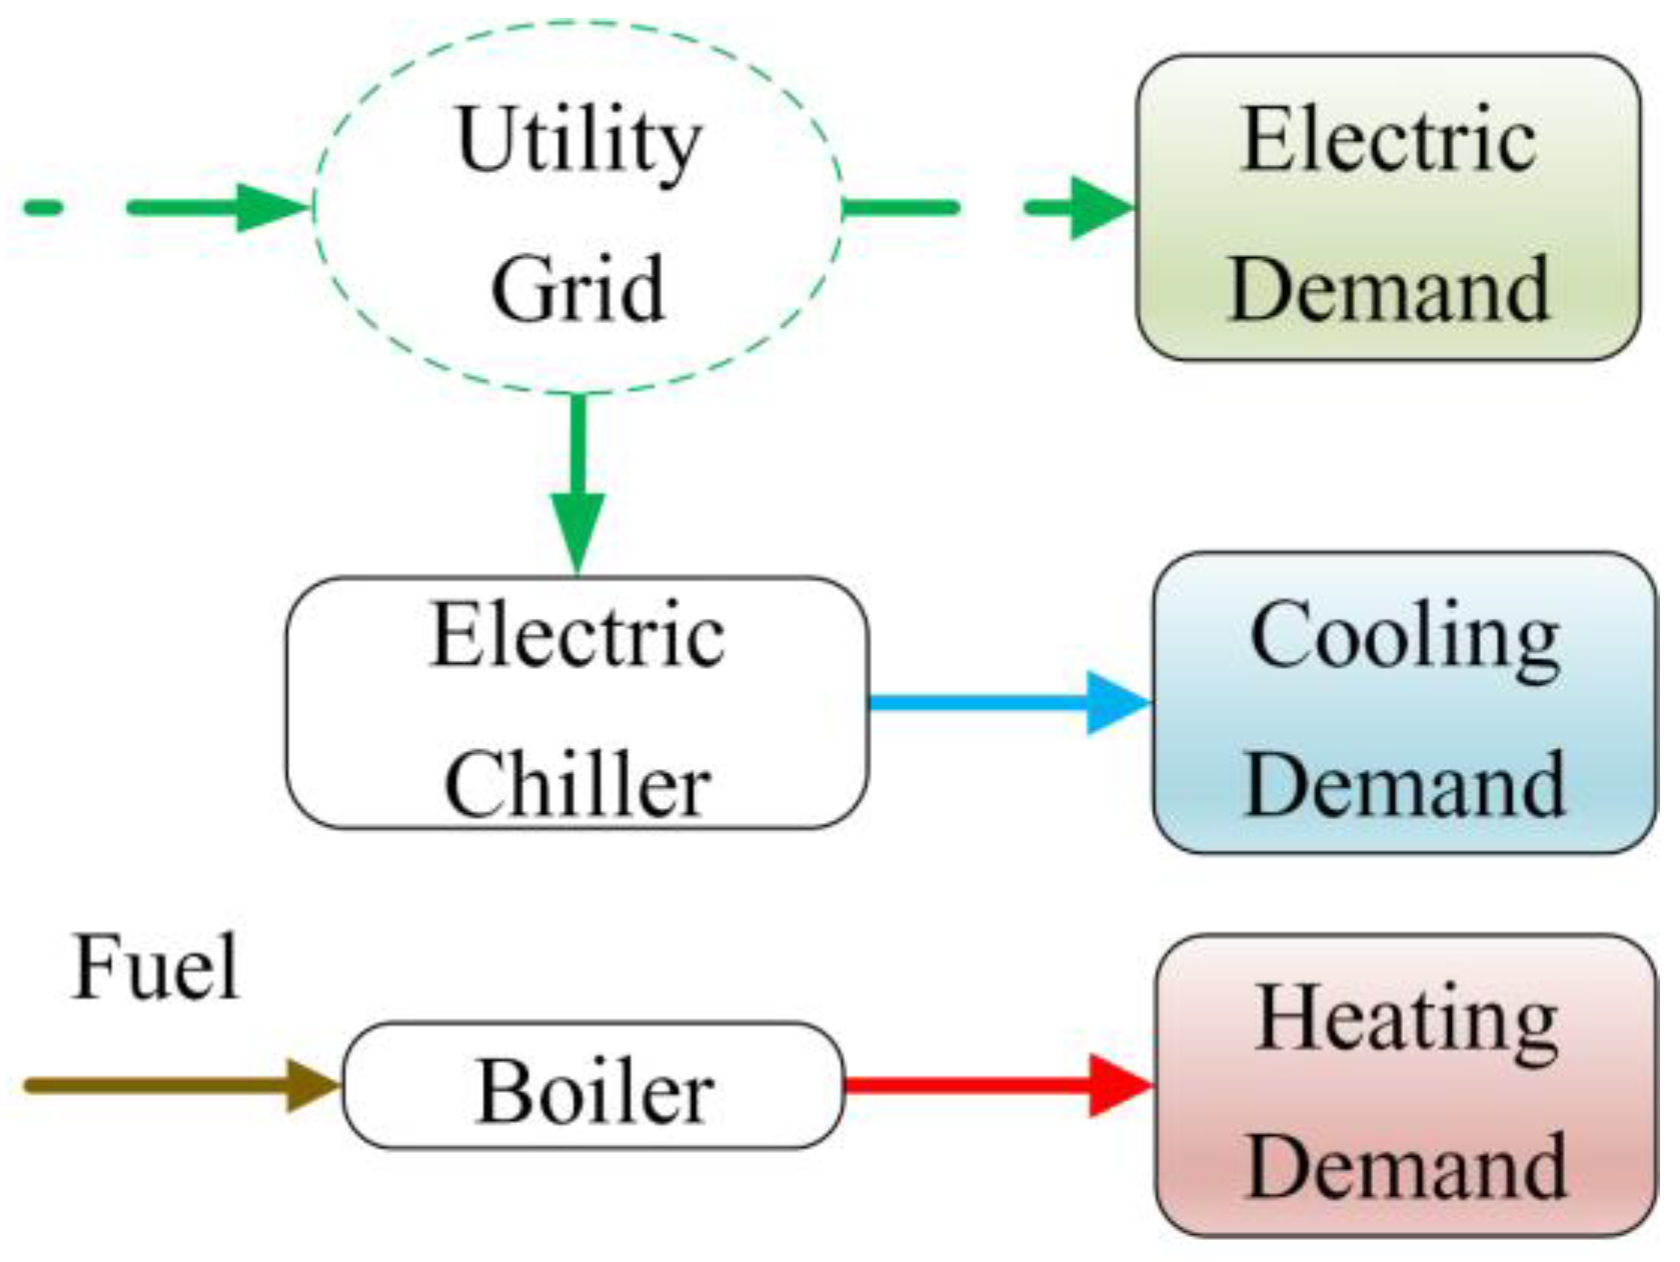
2.1. Reference System
- is the amount of electricity provided by the grid, is the electricity used directly in the building excluding the power demand of the electric chiller and is the power demand of the electric chiller;
- is the efficiency of the power plant and is the efficiency of the grid, which takes into account the distribution and transmission losses and is the time step.
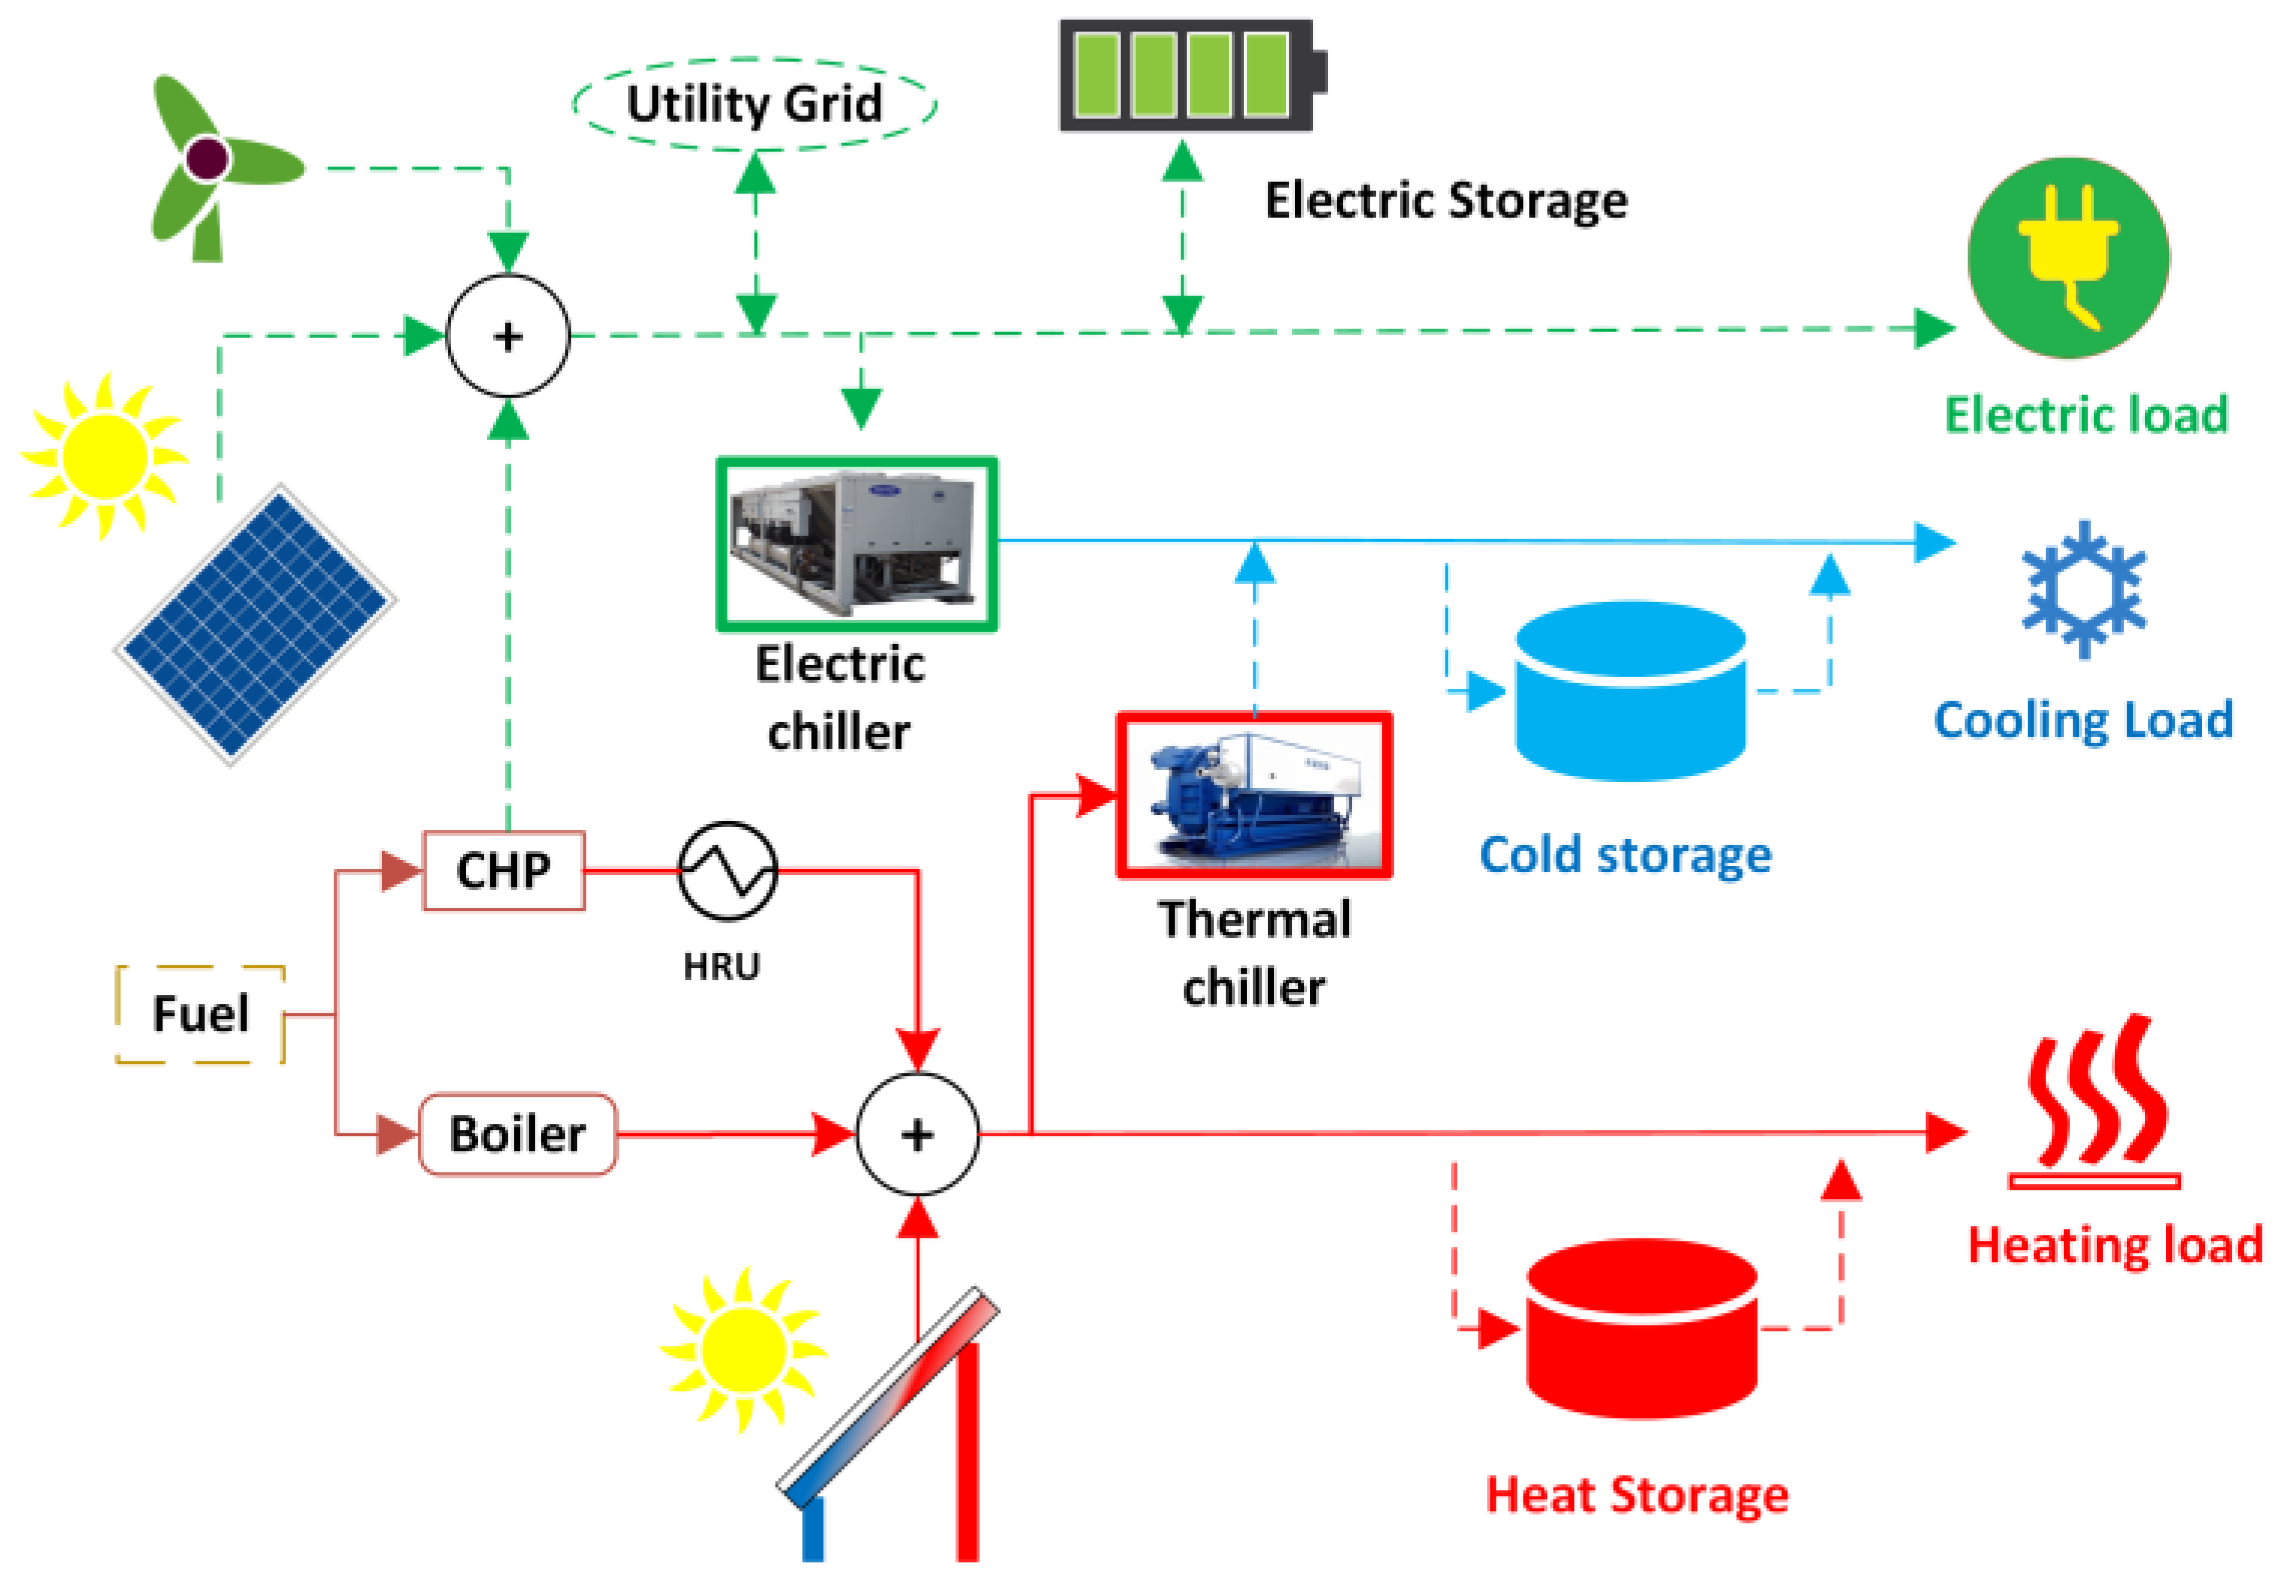
2.2. Polygeneration System Configuration
Operating Strategy Description
2.3. Performance Evaluation
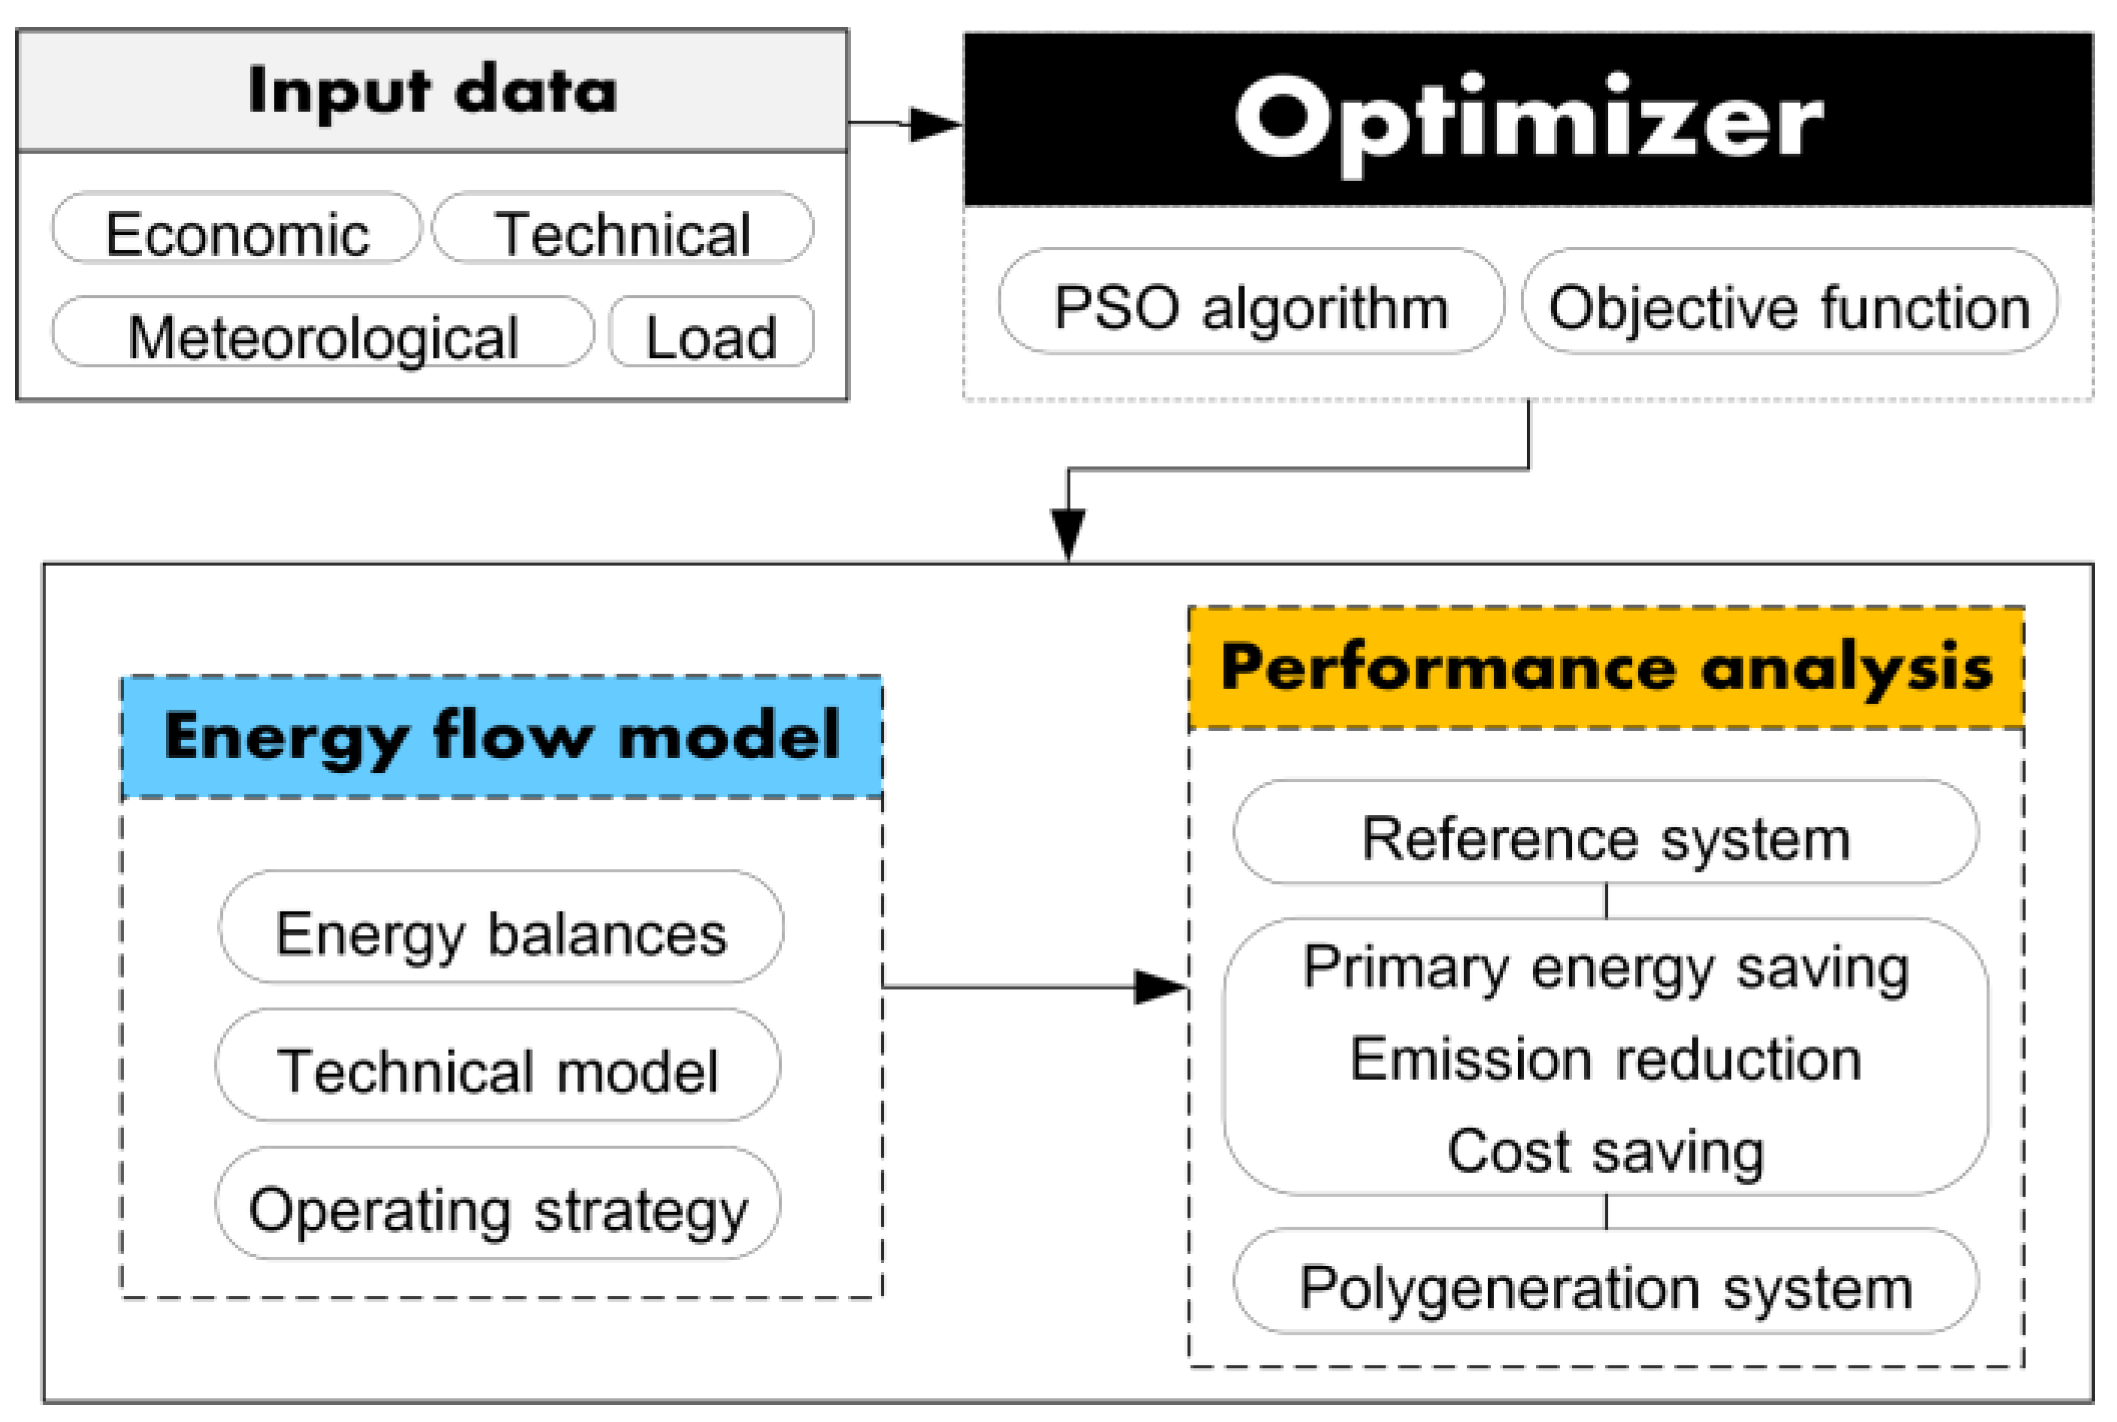
3. Optimization Problem Formulation
3.1. Optimization Model Overview
3.2. Objective Function
- At each time-step, the electricty, heating and cooling demand should be covered. The required energy balances are shown in the equations below.where the subscripts, sup and dem, are supply and demand, respectively.
- The operation of the CHP is limited to a minimum load factor to increase its efficiency and lifetime and decrease the emissions. This is identified as a constraint in the optimization problem as follows:where, is the part-load factor of the CHP unit.
- The sizes of the components are limited to the identified optimization search space. The values of search space are identified according to the demand and the available area or space for each component.
4. Application to a Case Study
4.1. Case Study Description
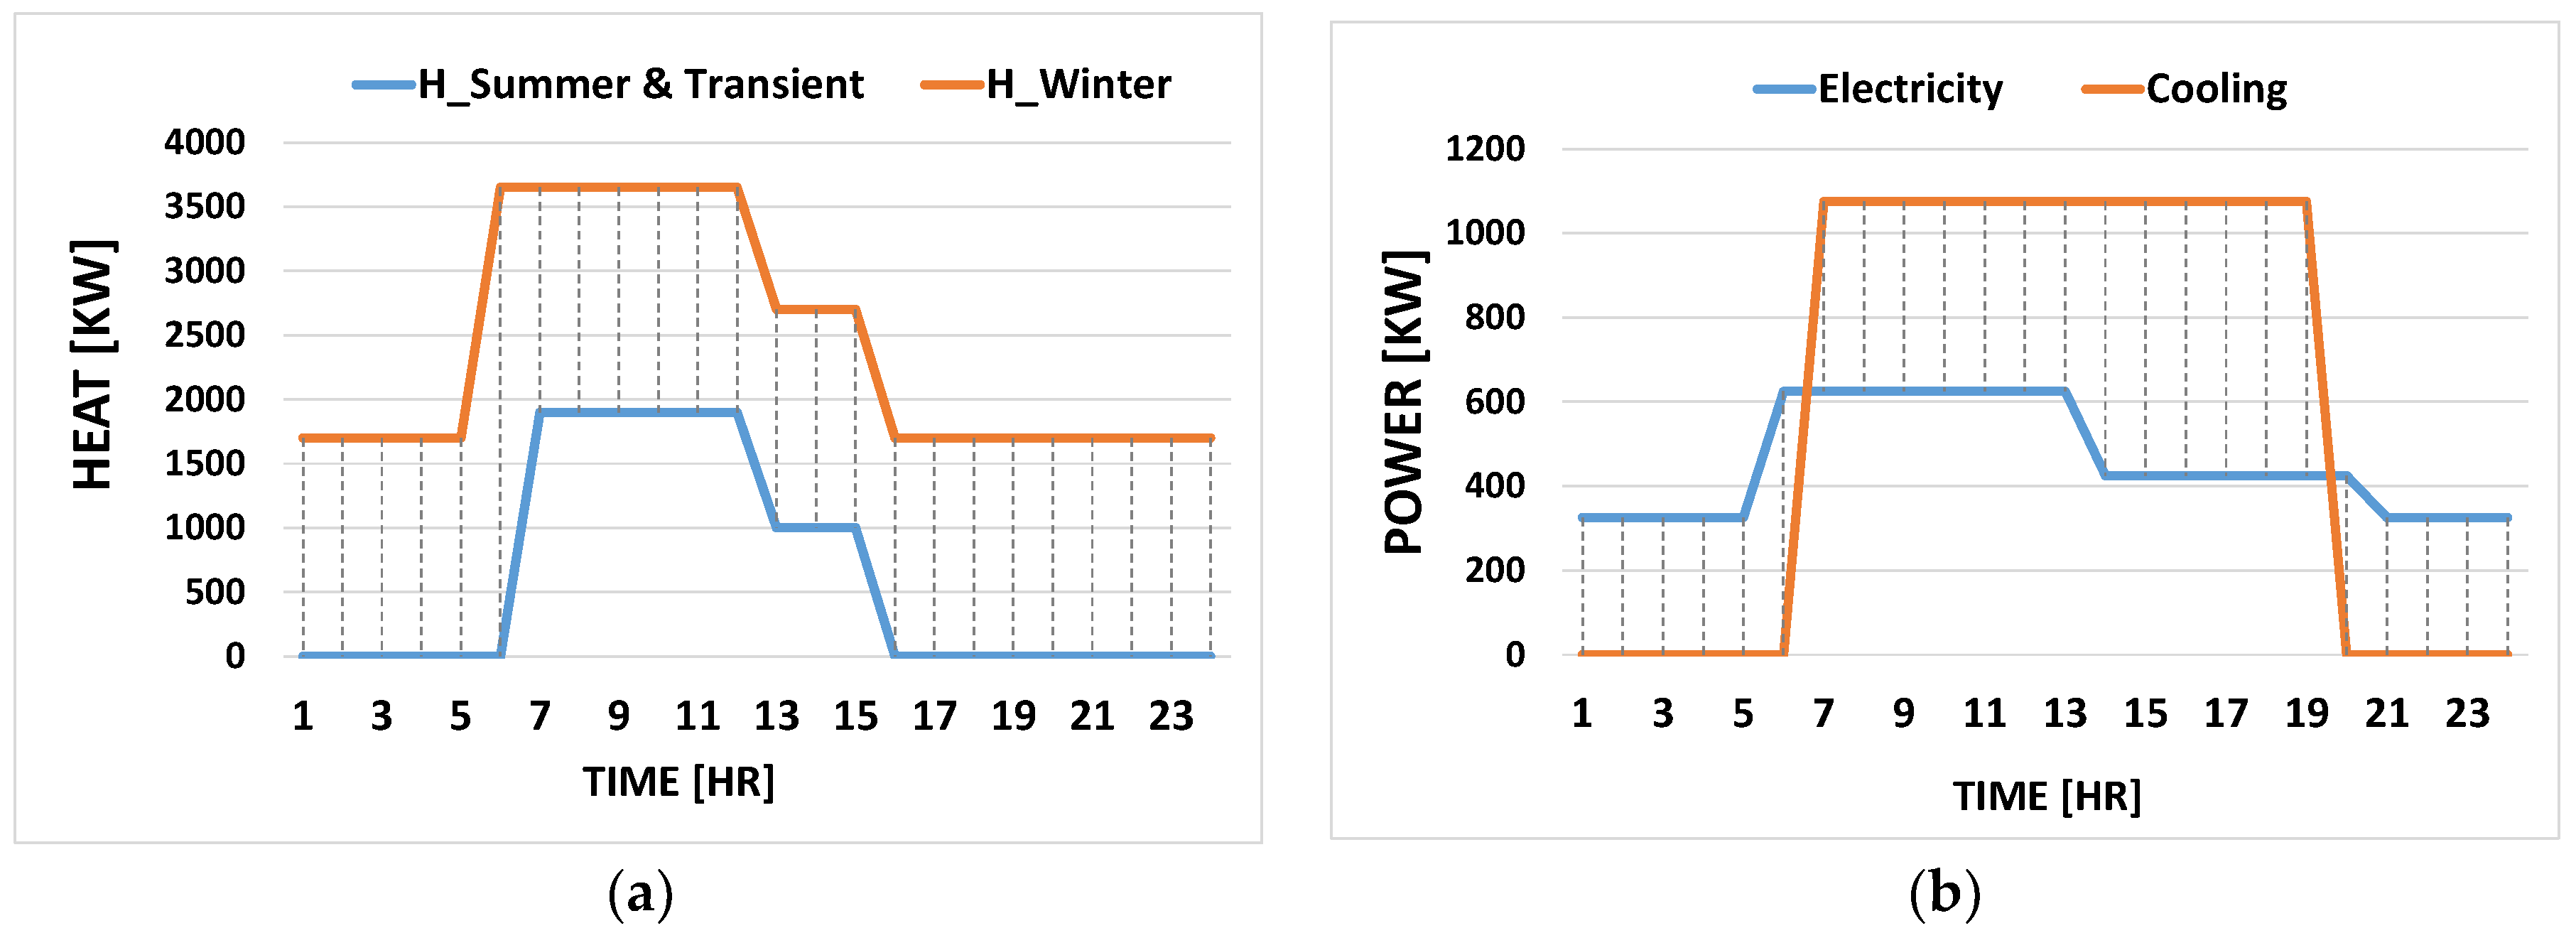
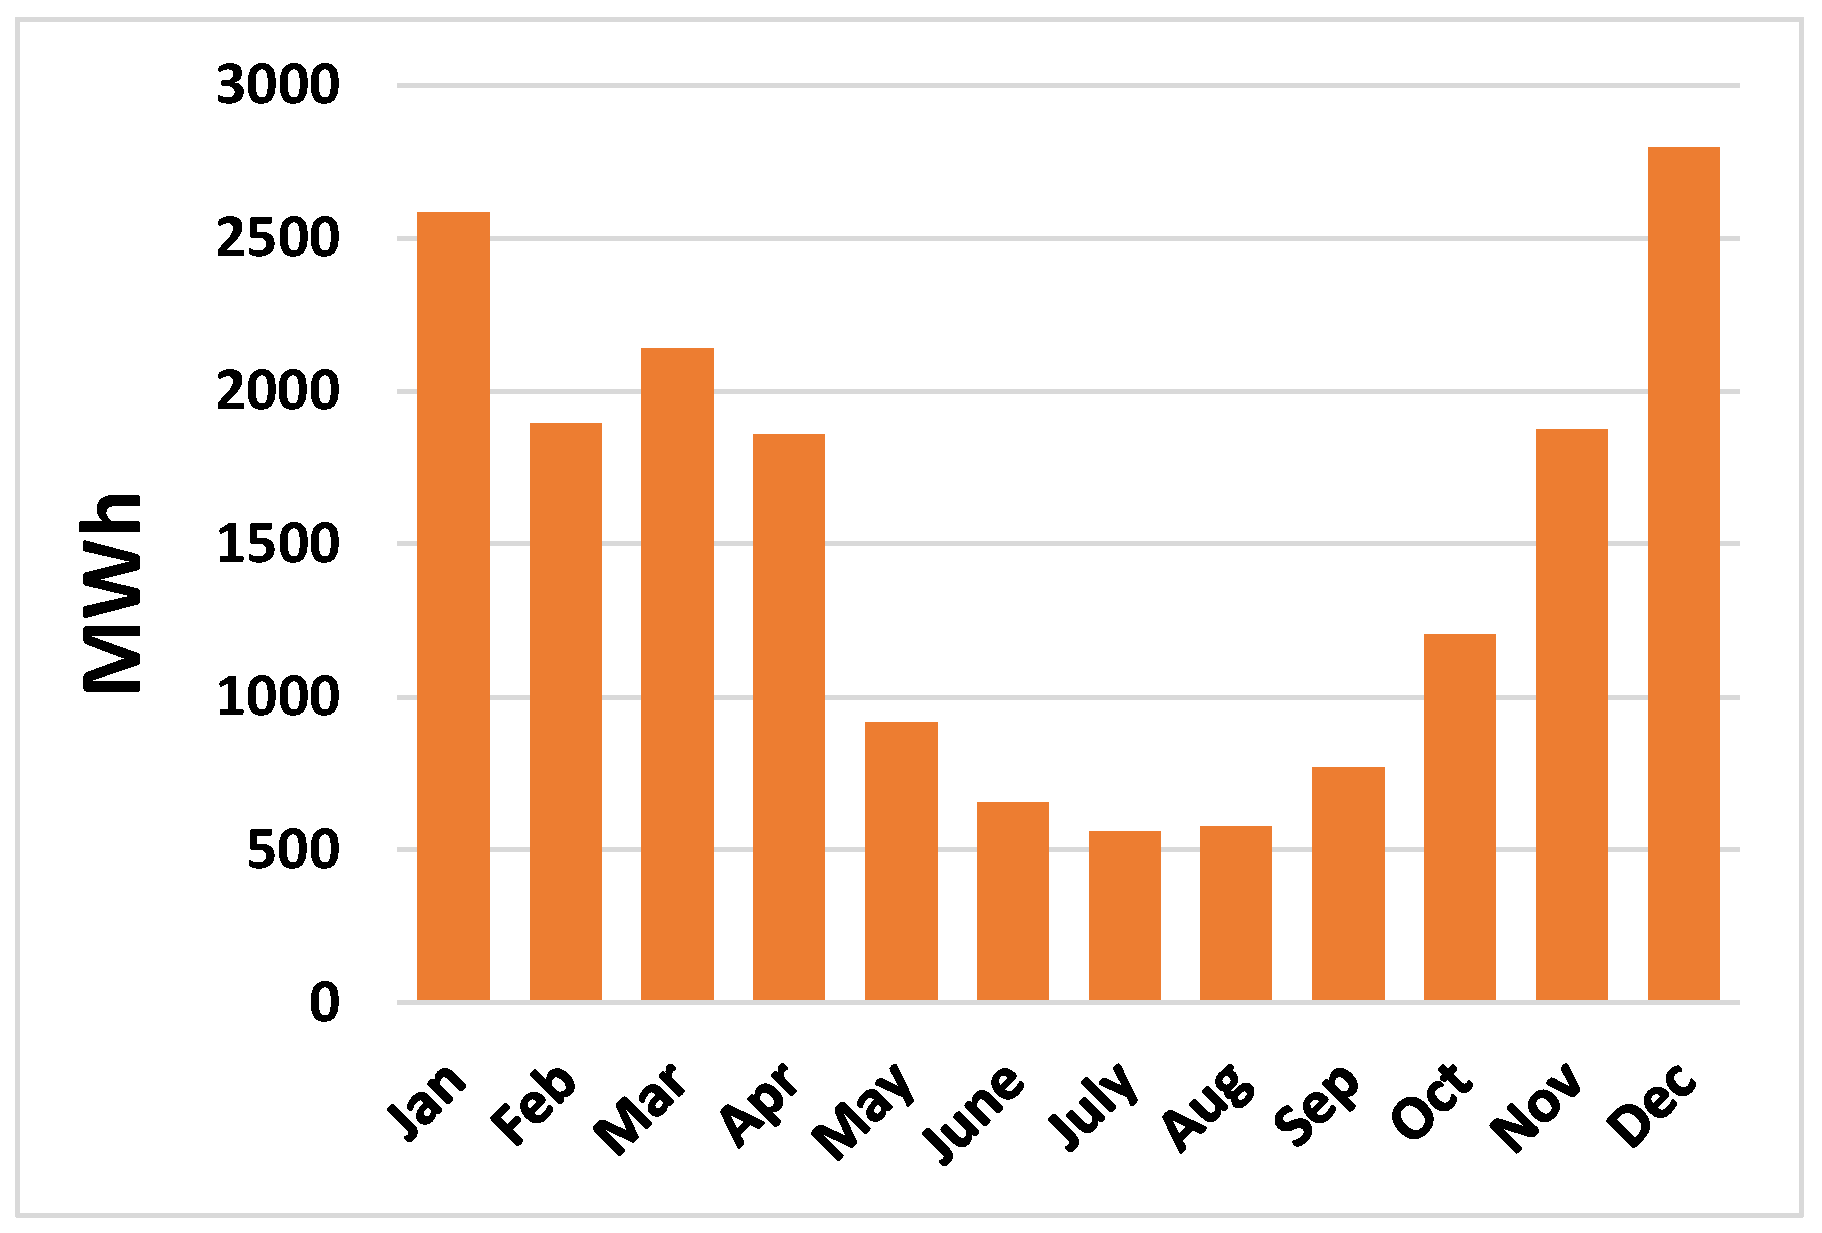
4.2. Input Data
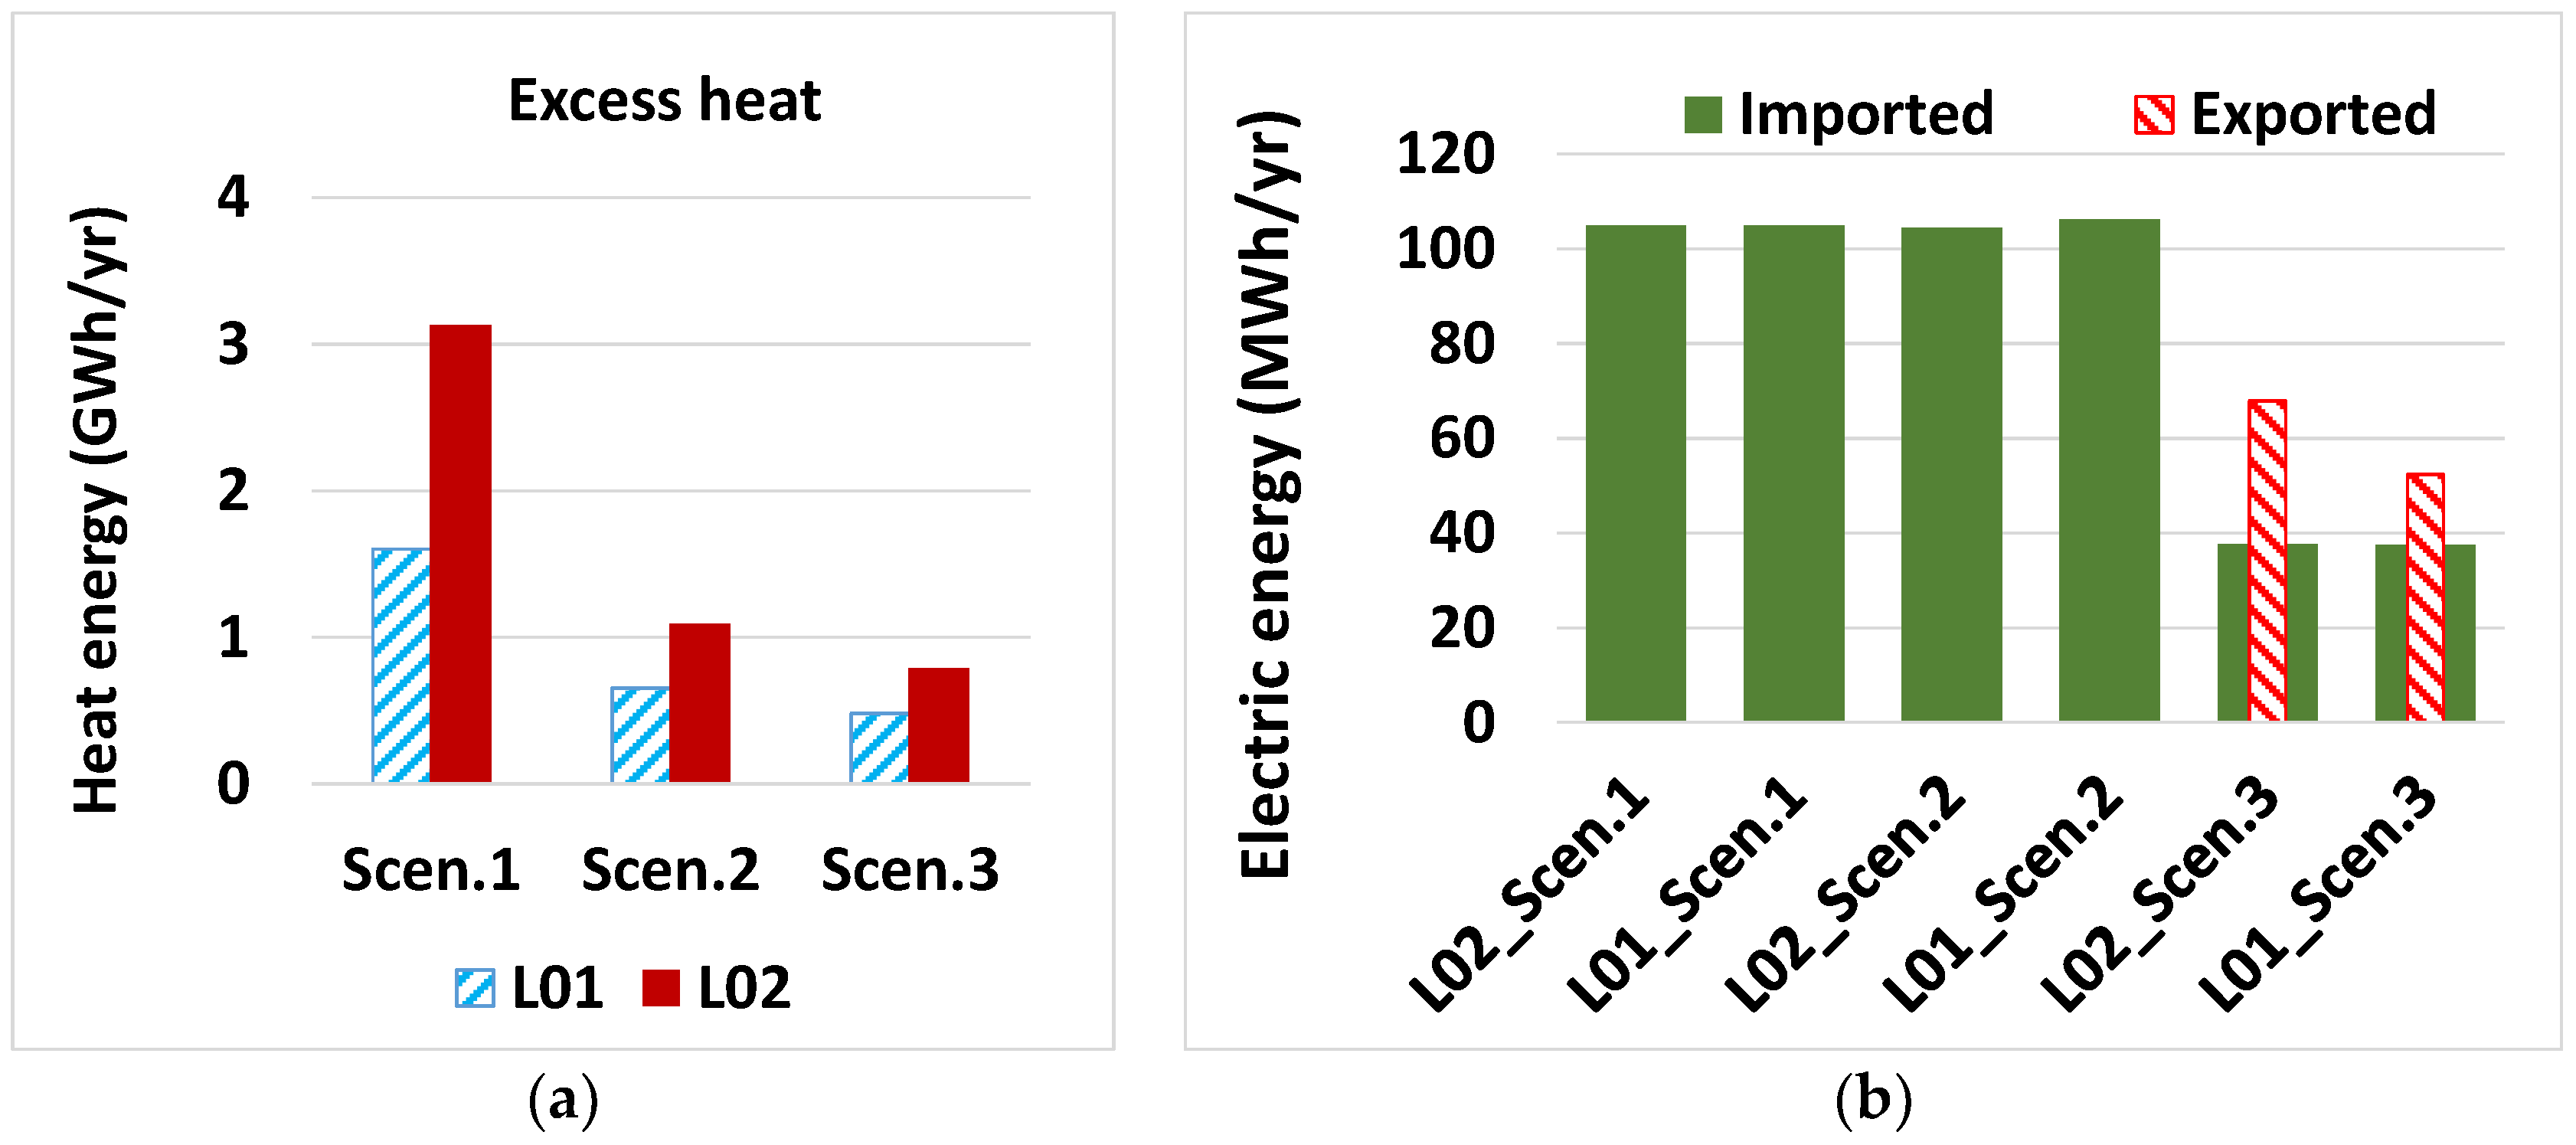
5. Results and Discussions
- size of the components;
- system performance;
- system economy.
5.1. Component Size
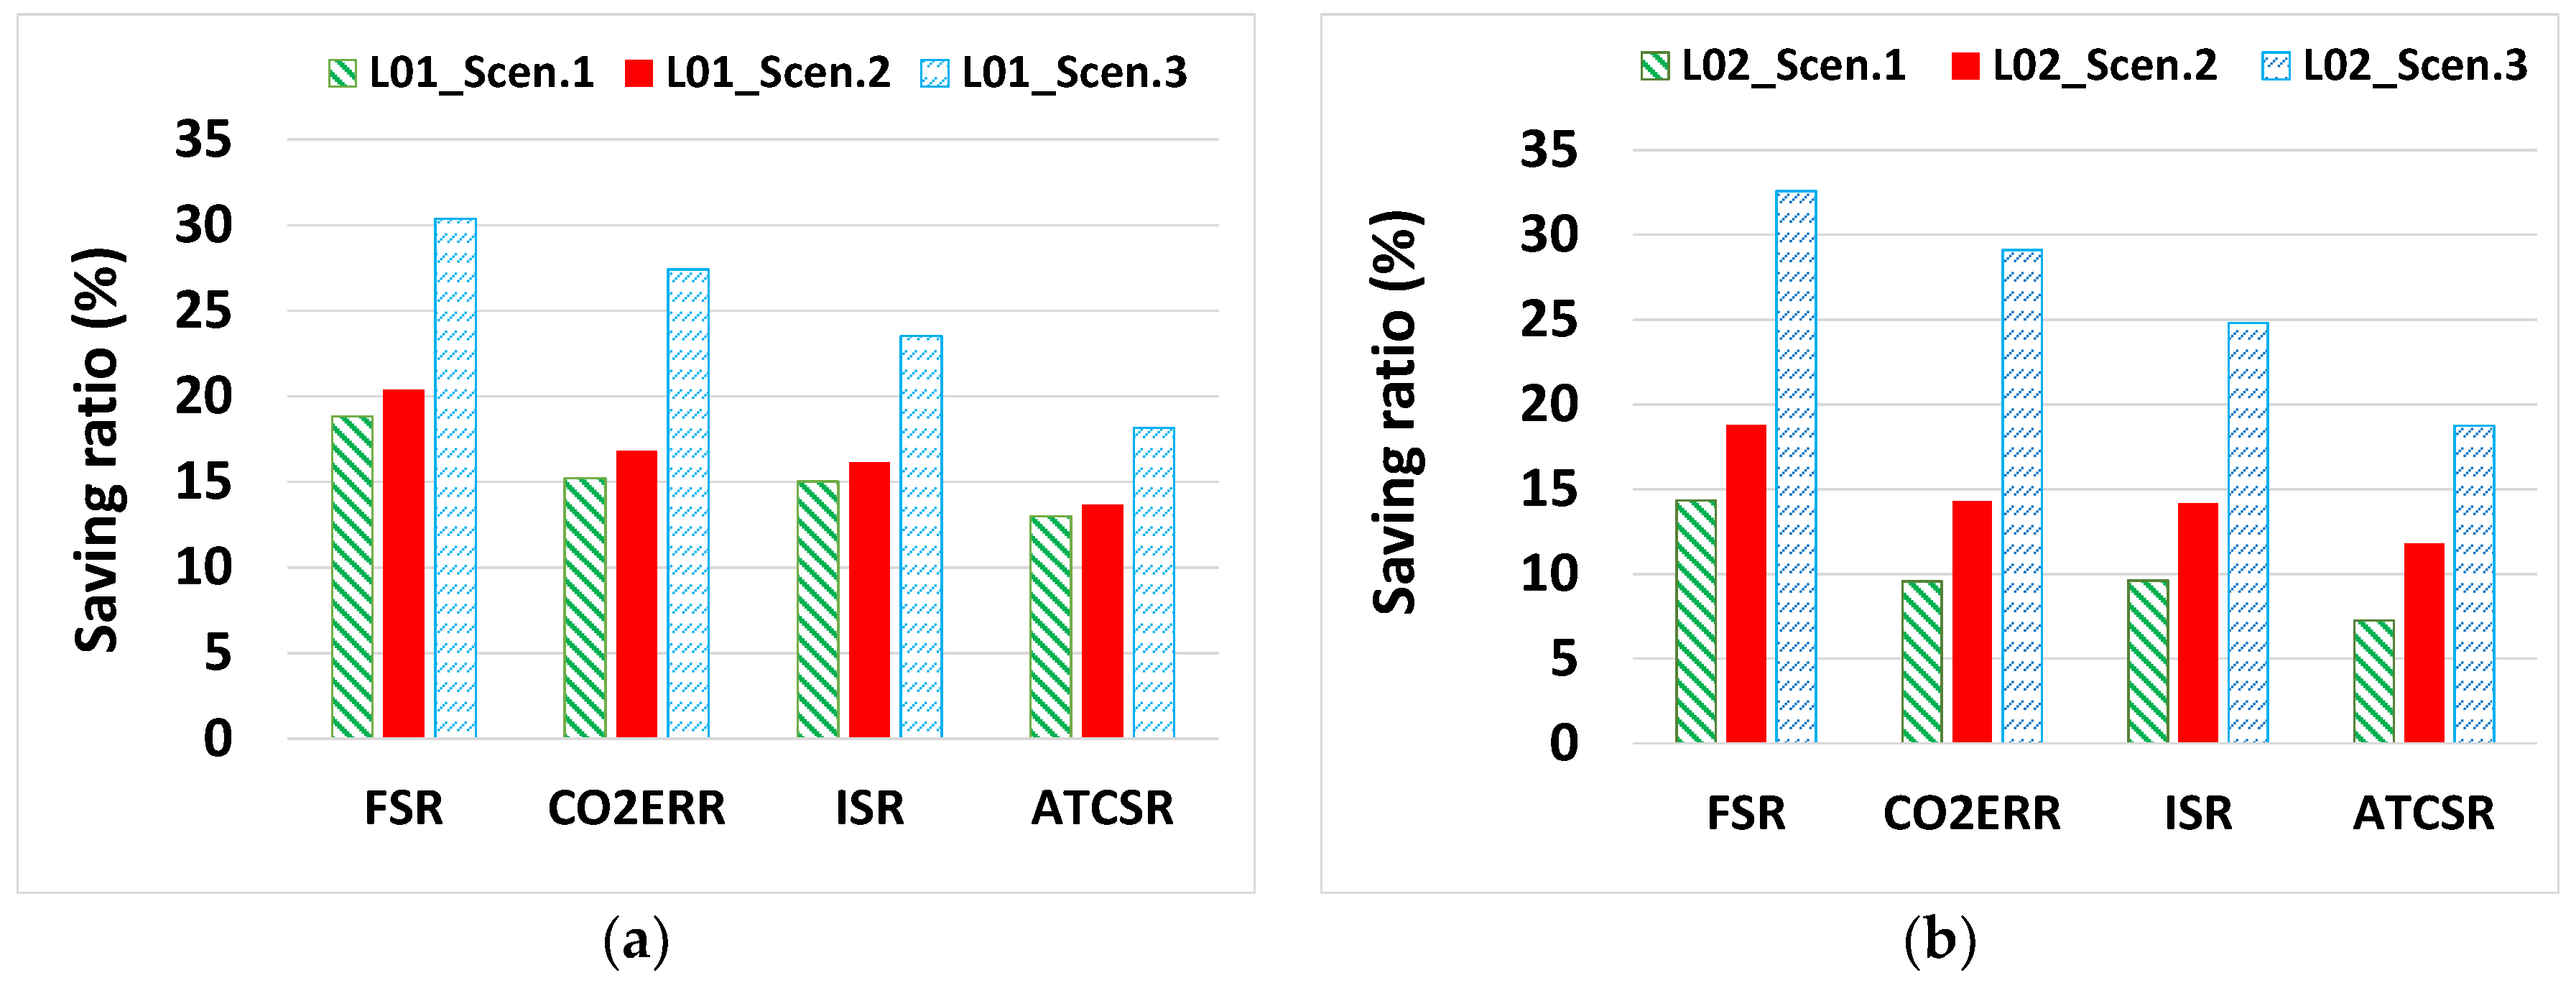
5.2. Performance Analysis
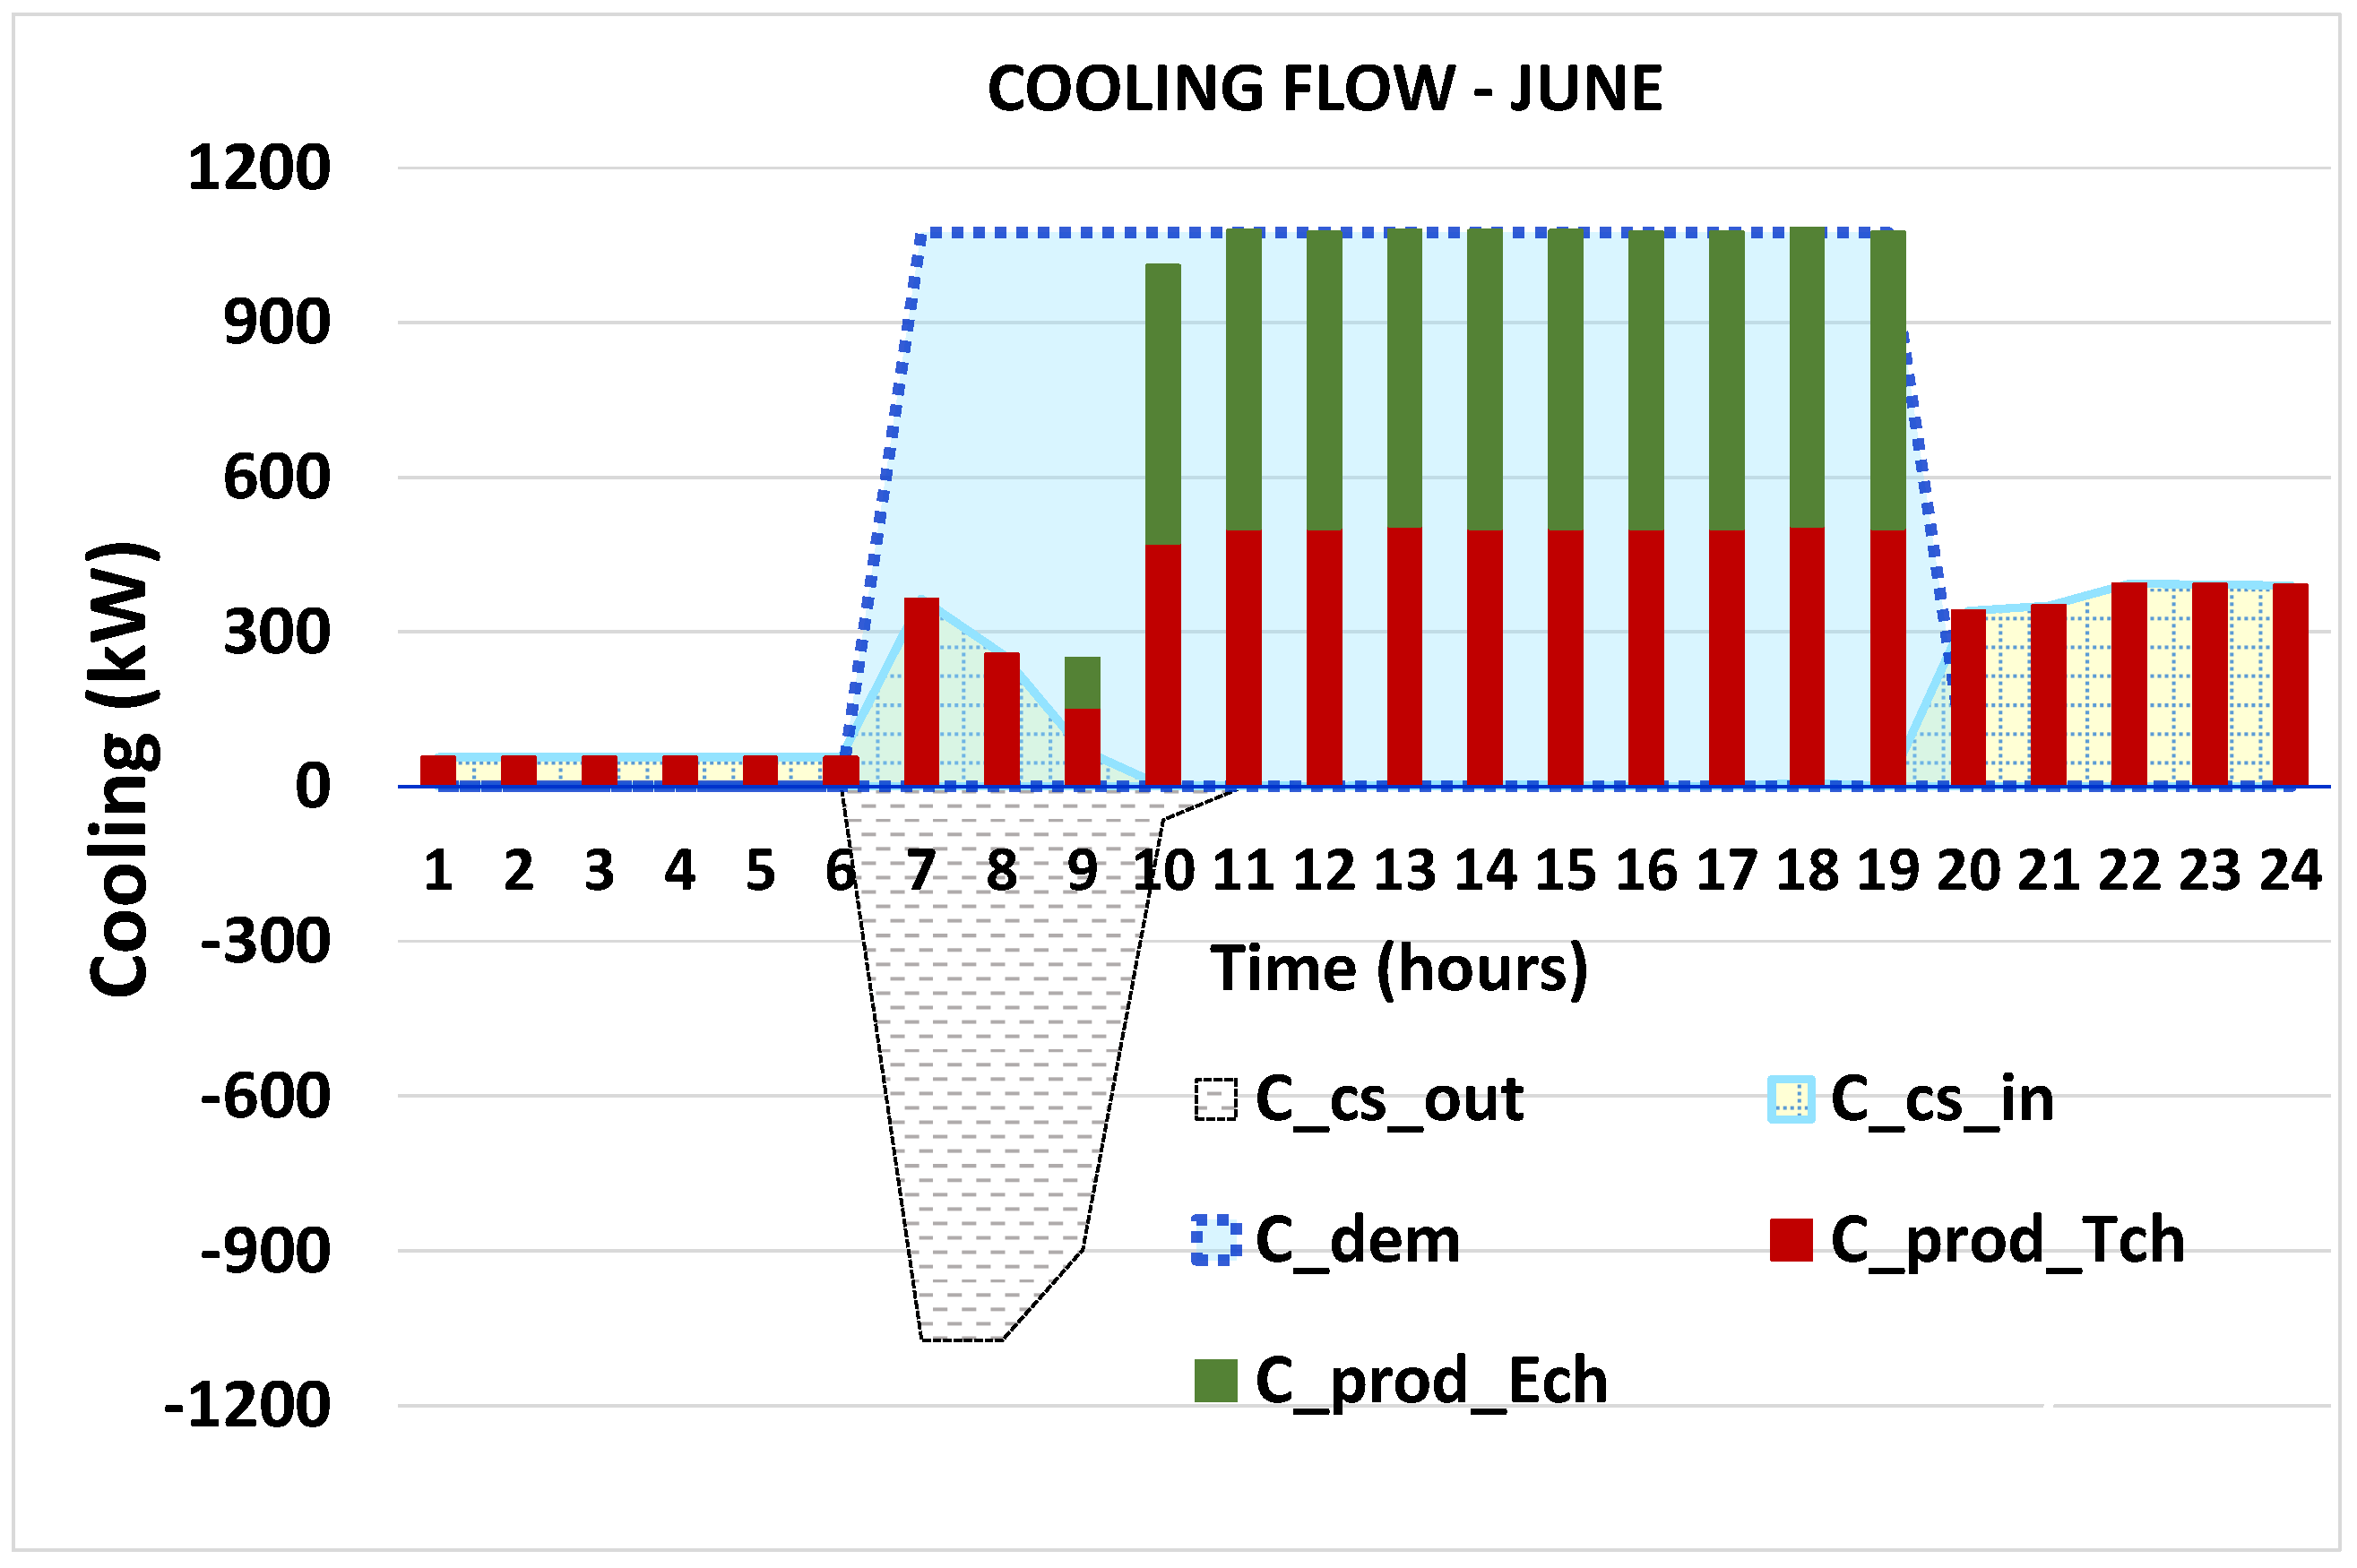
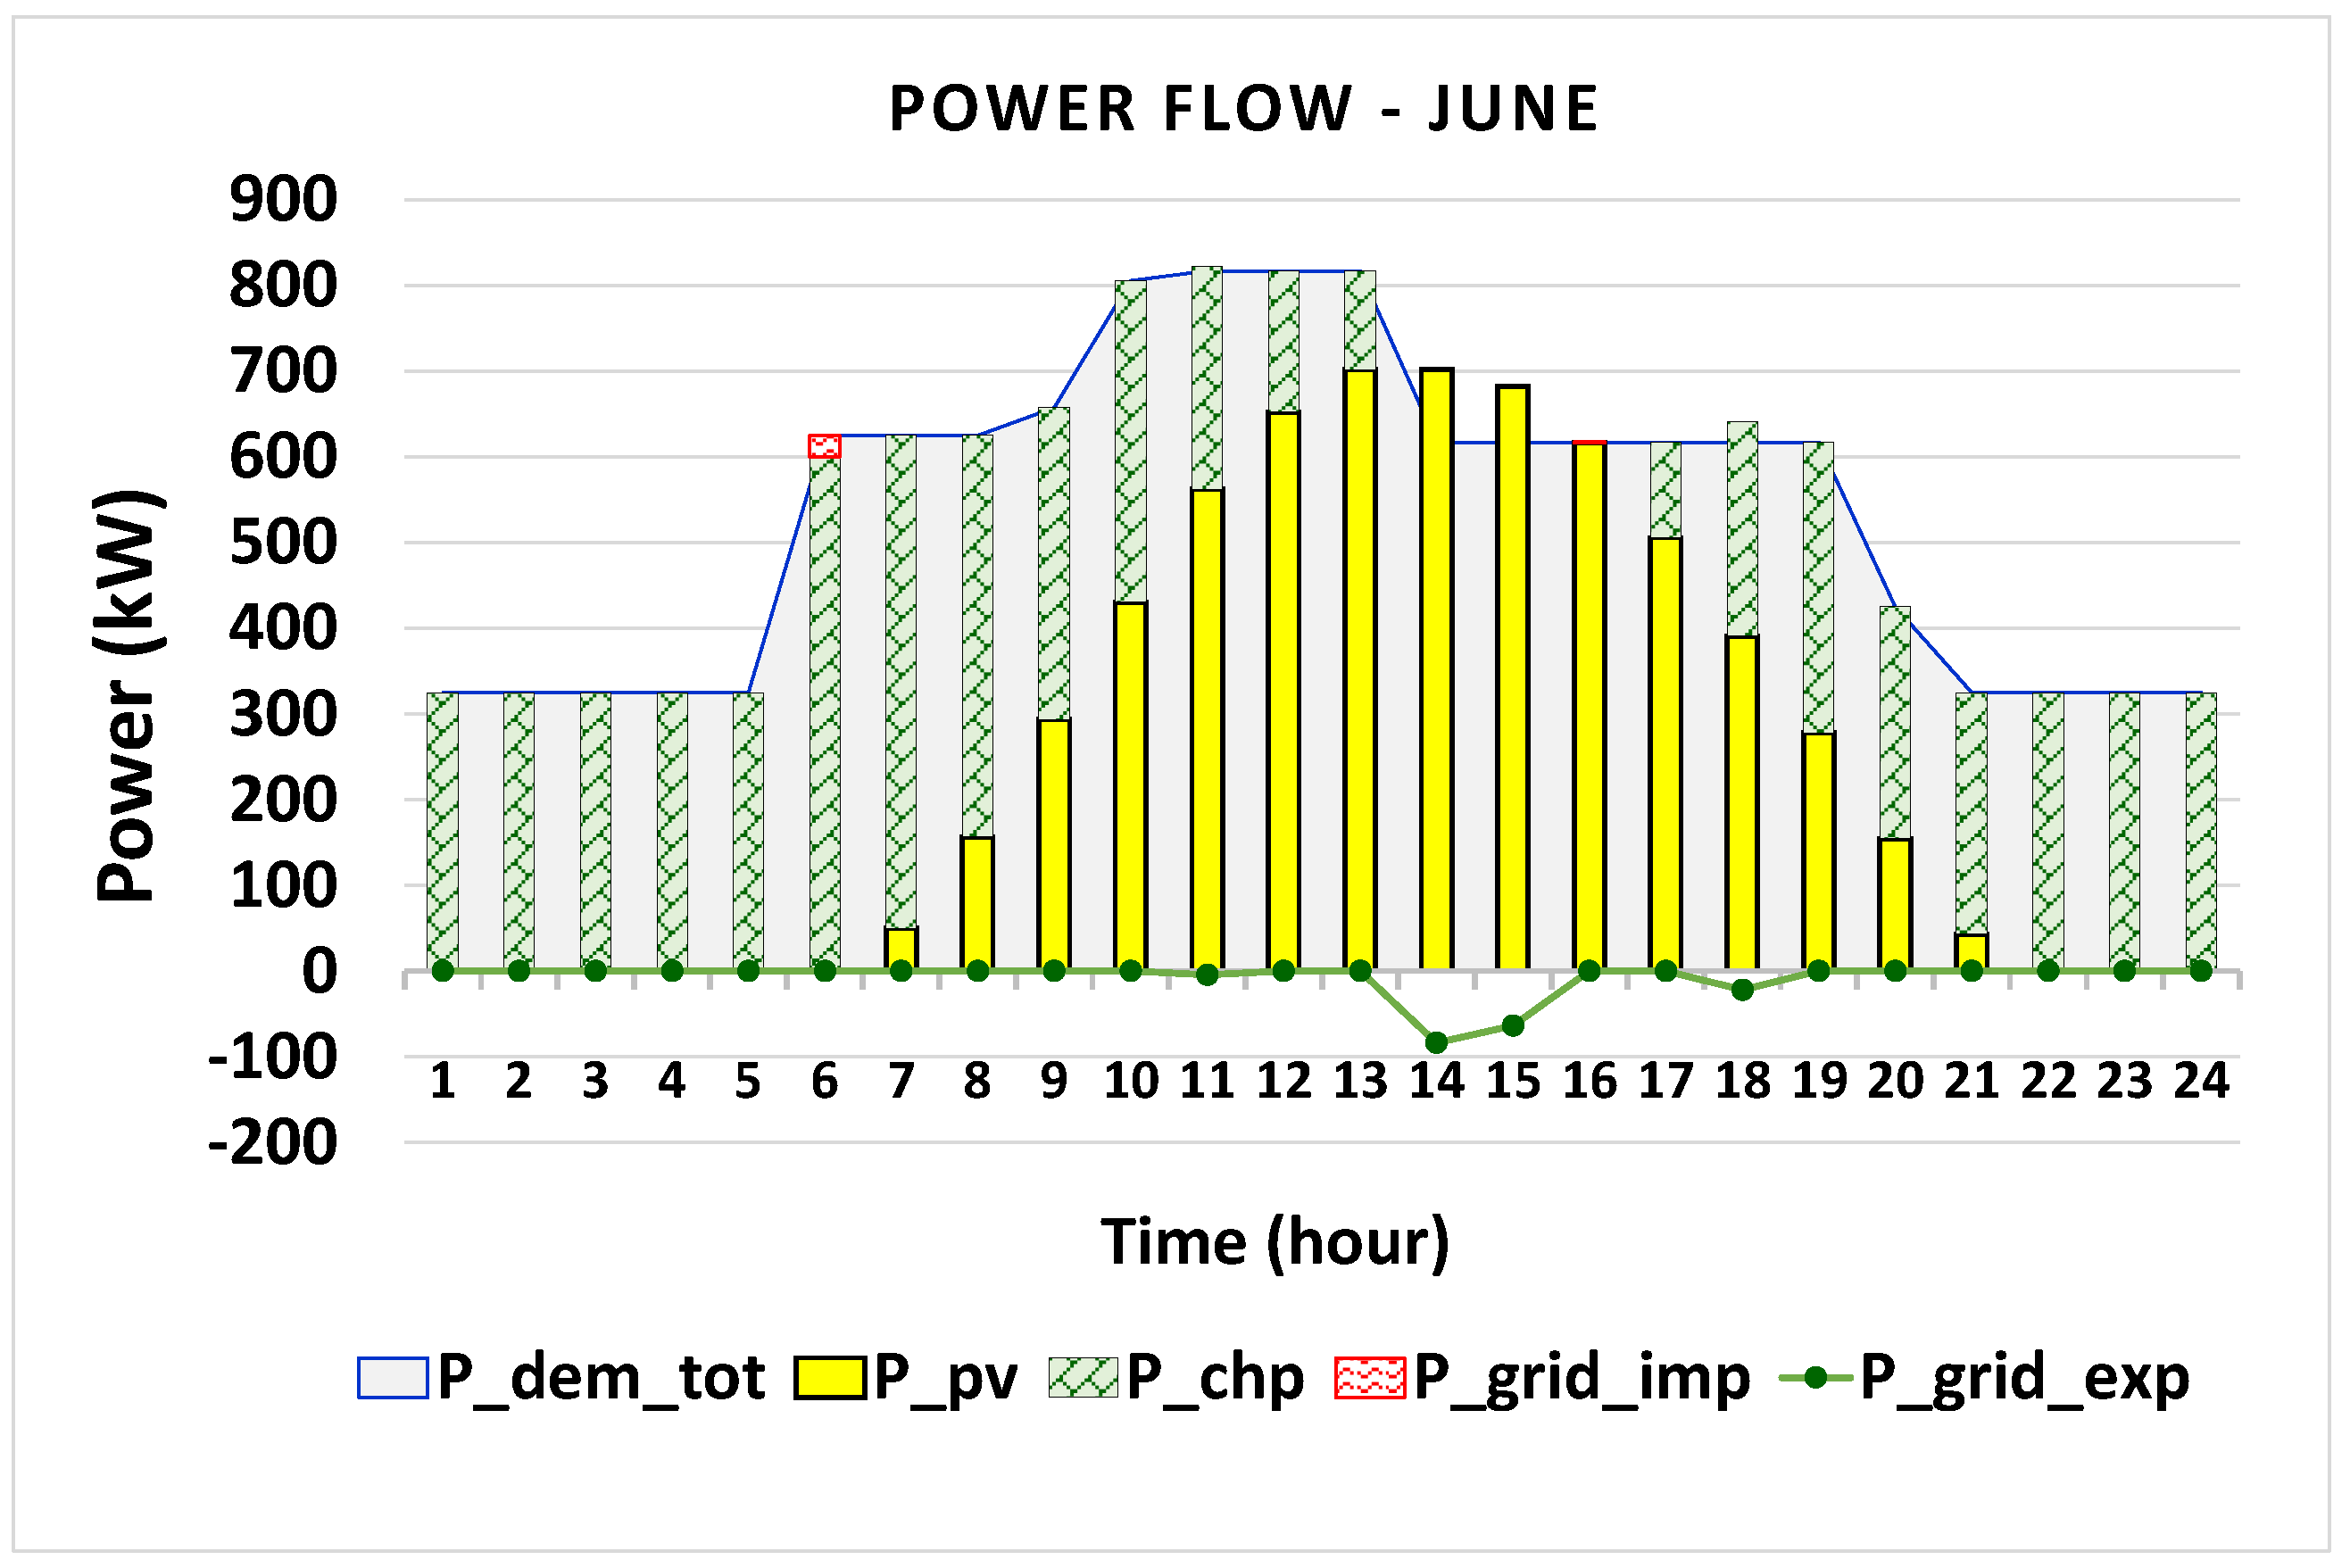
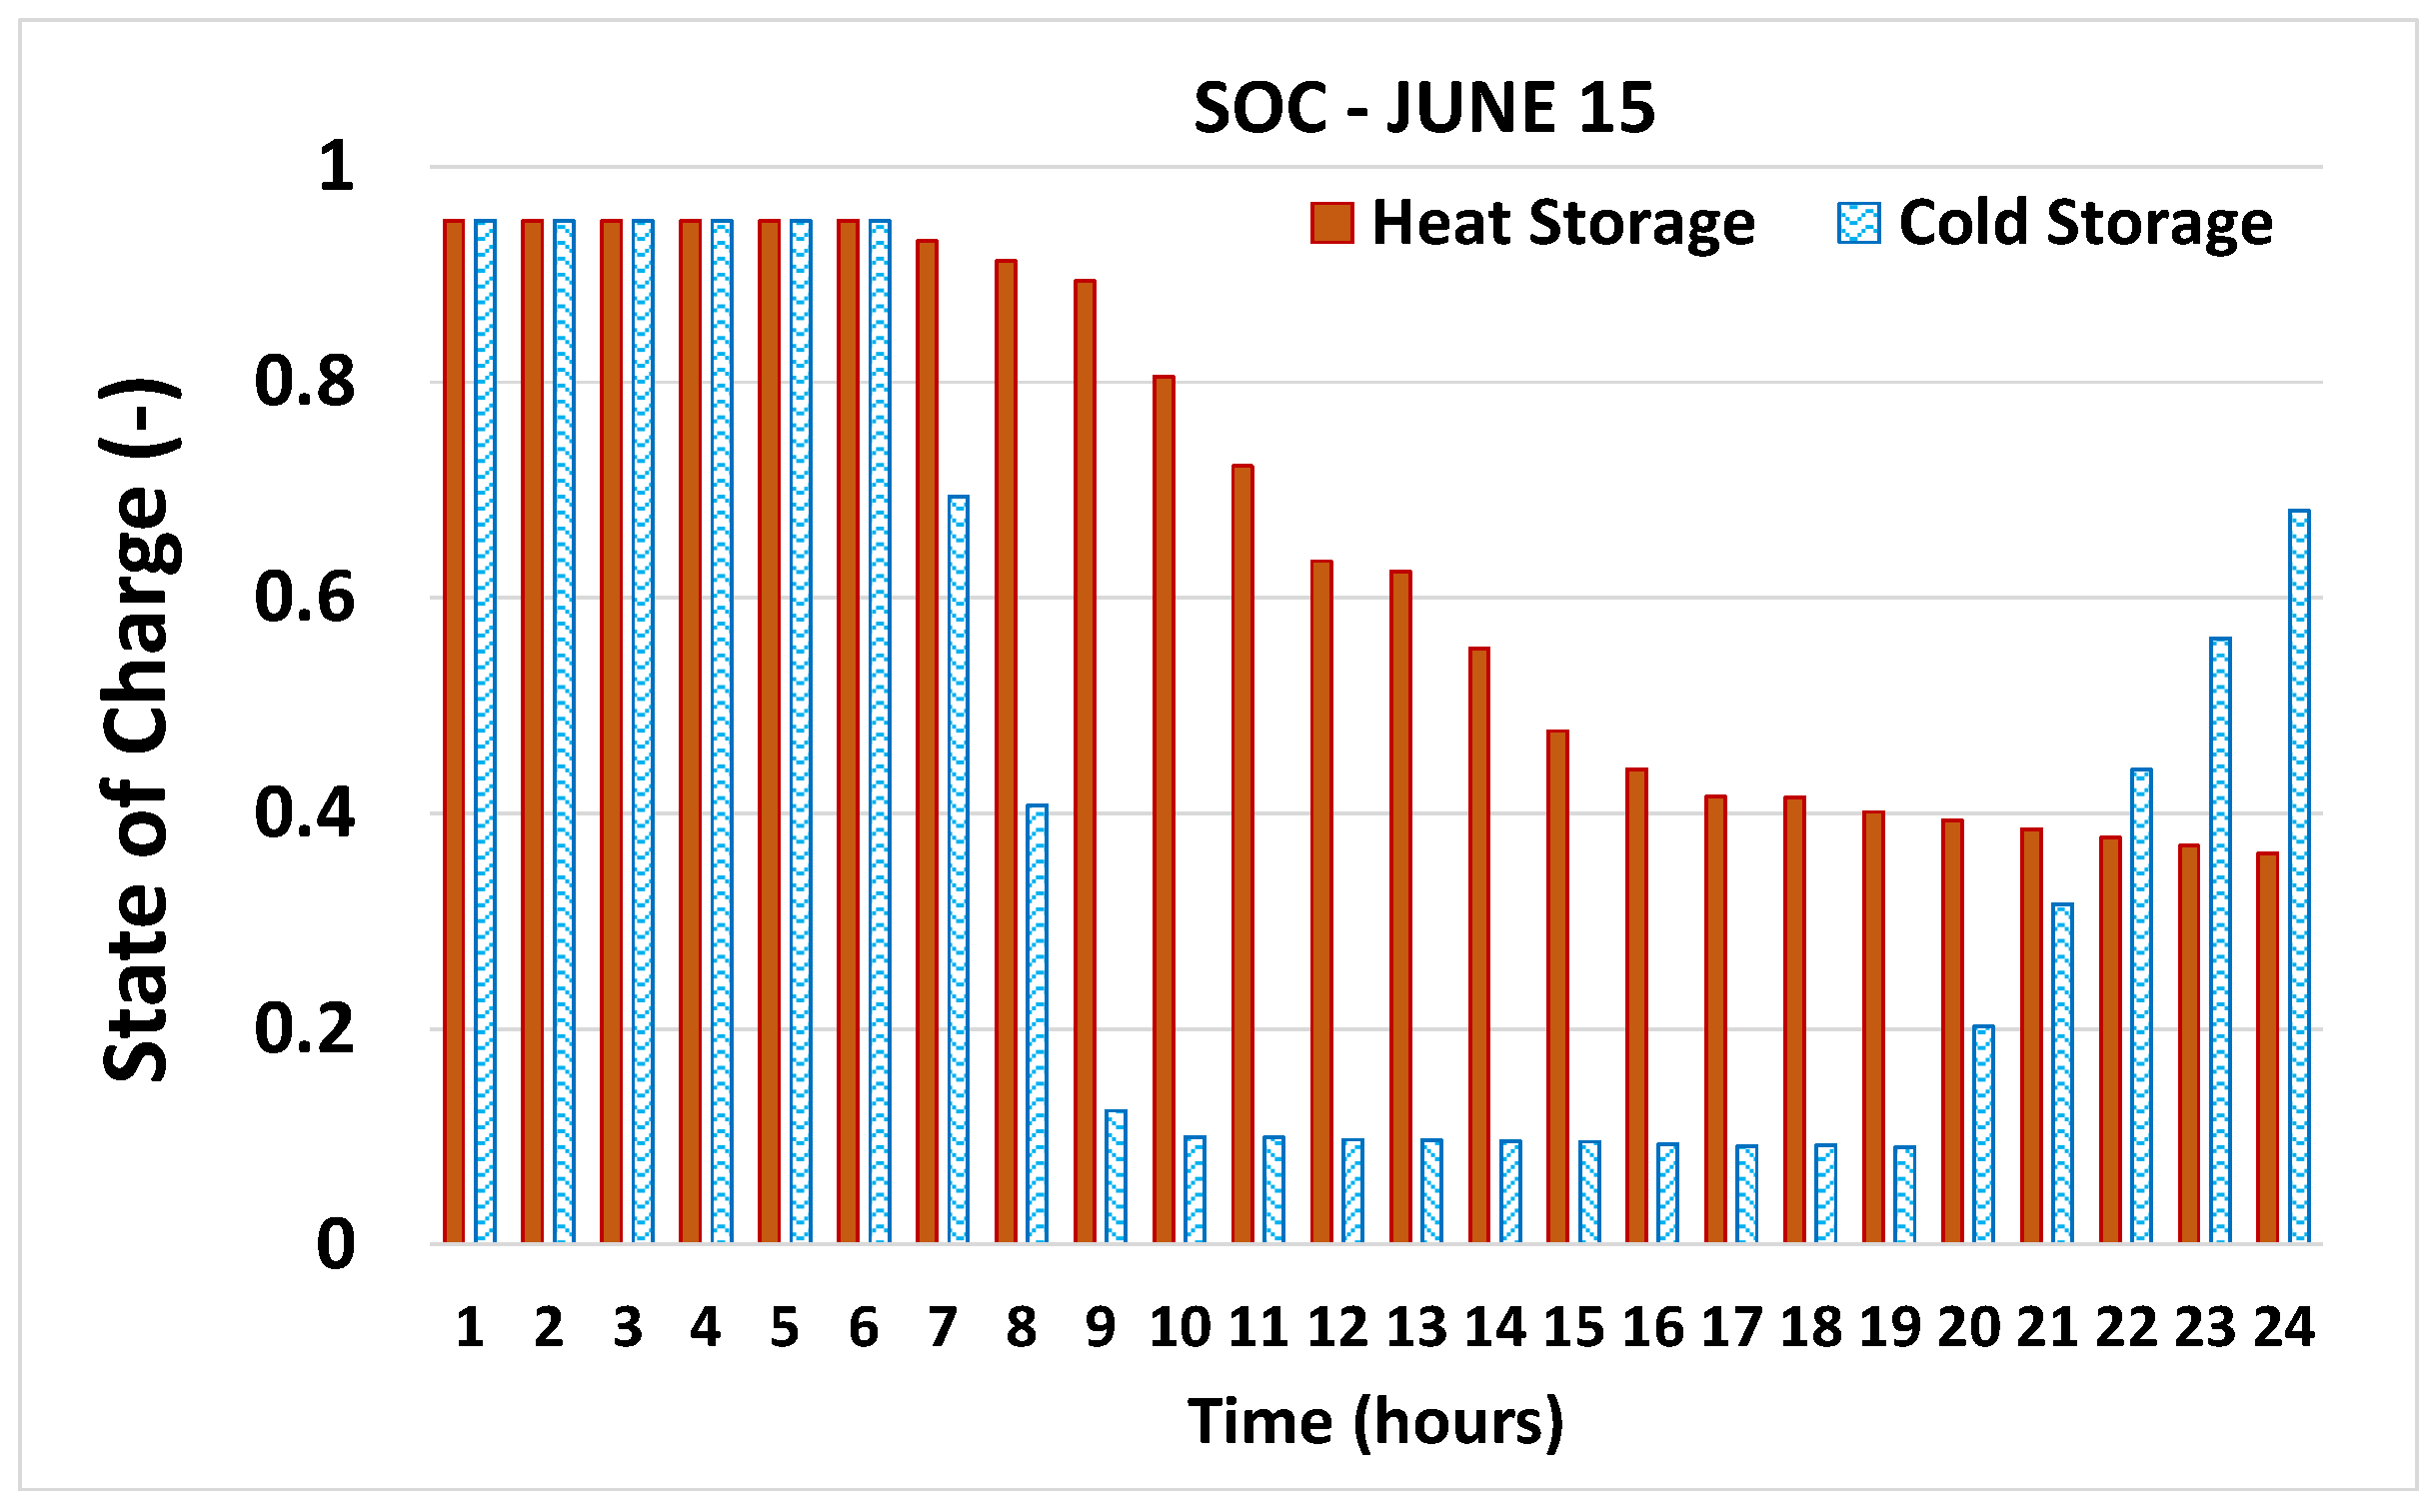
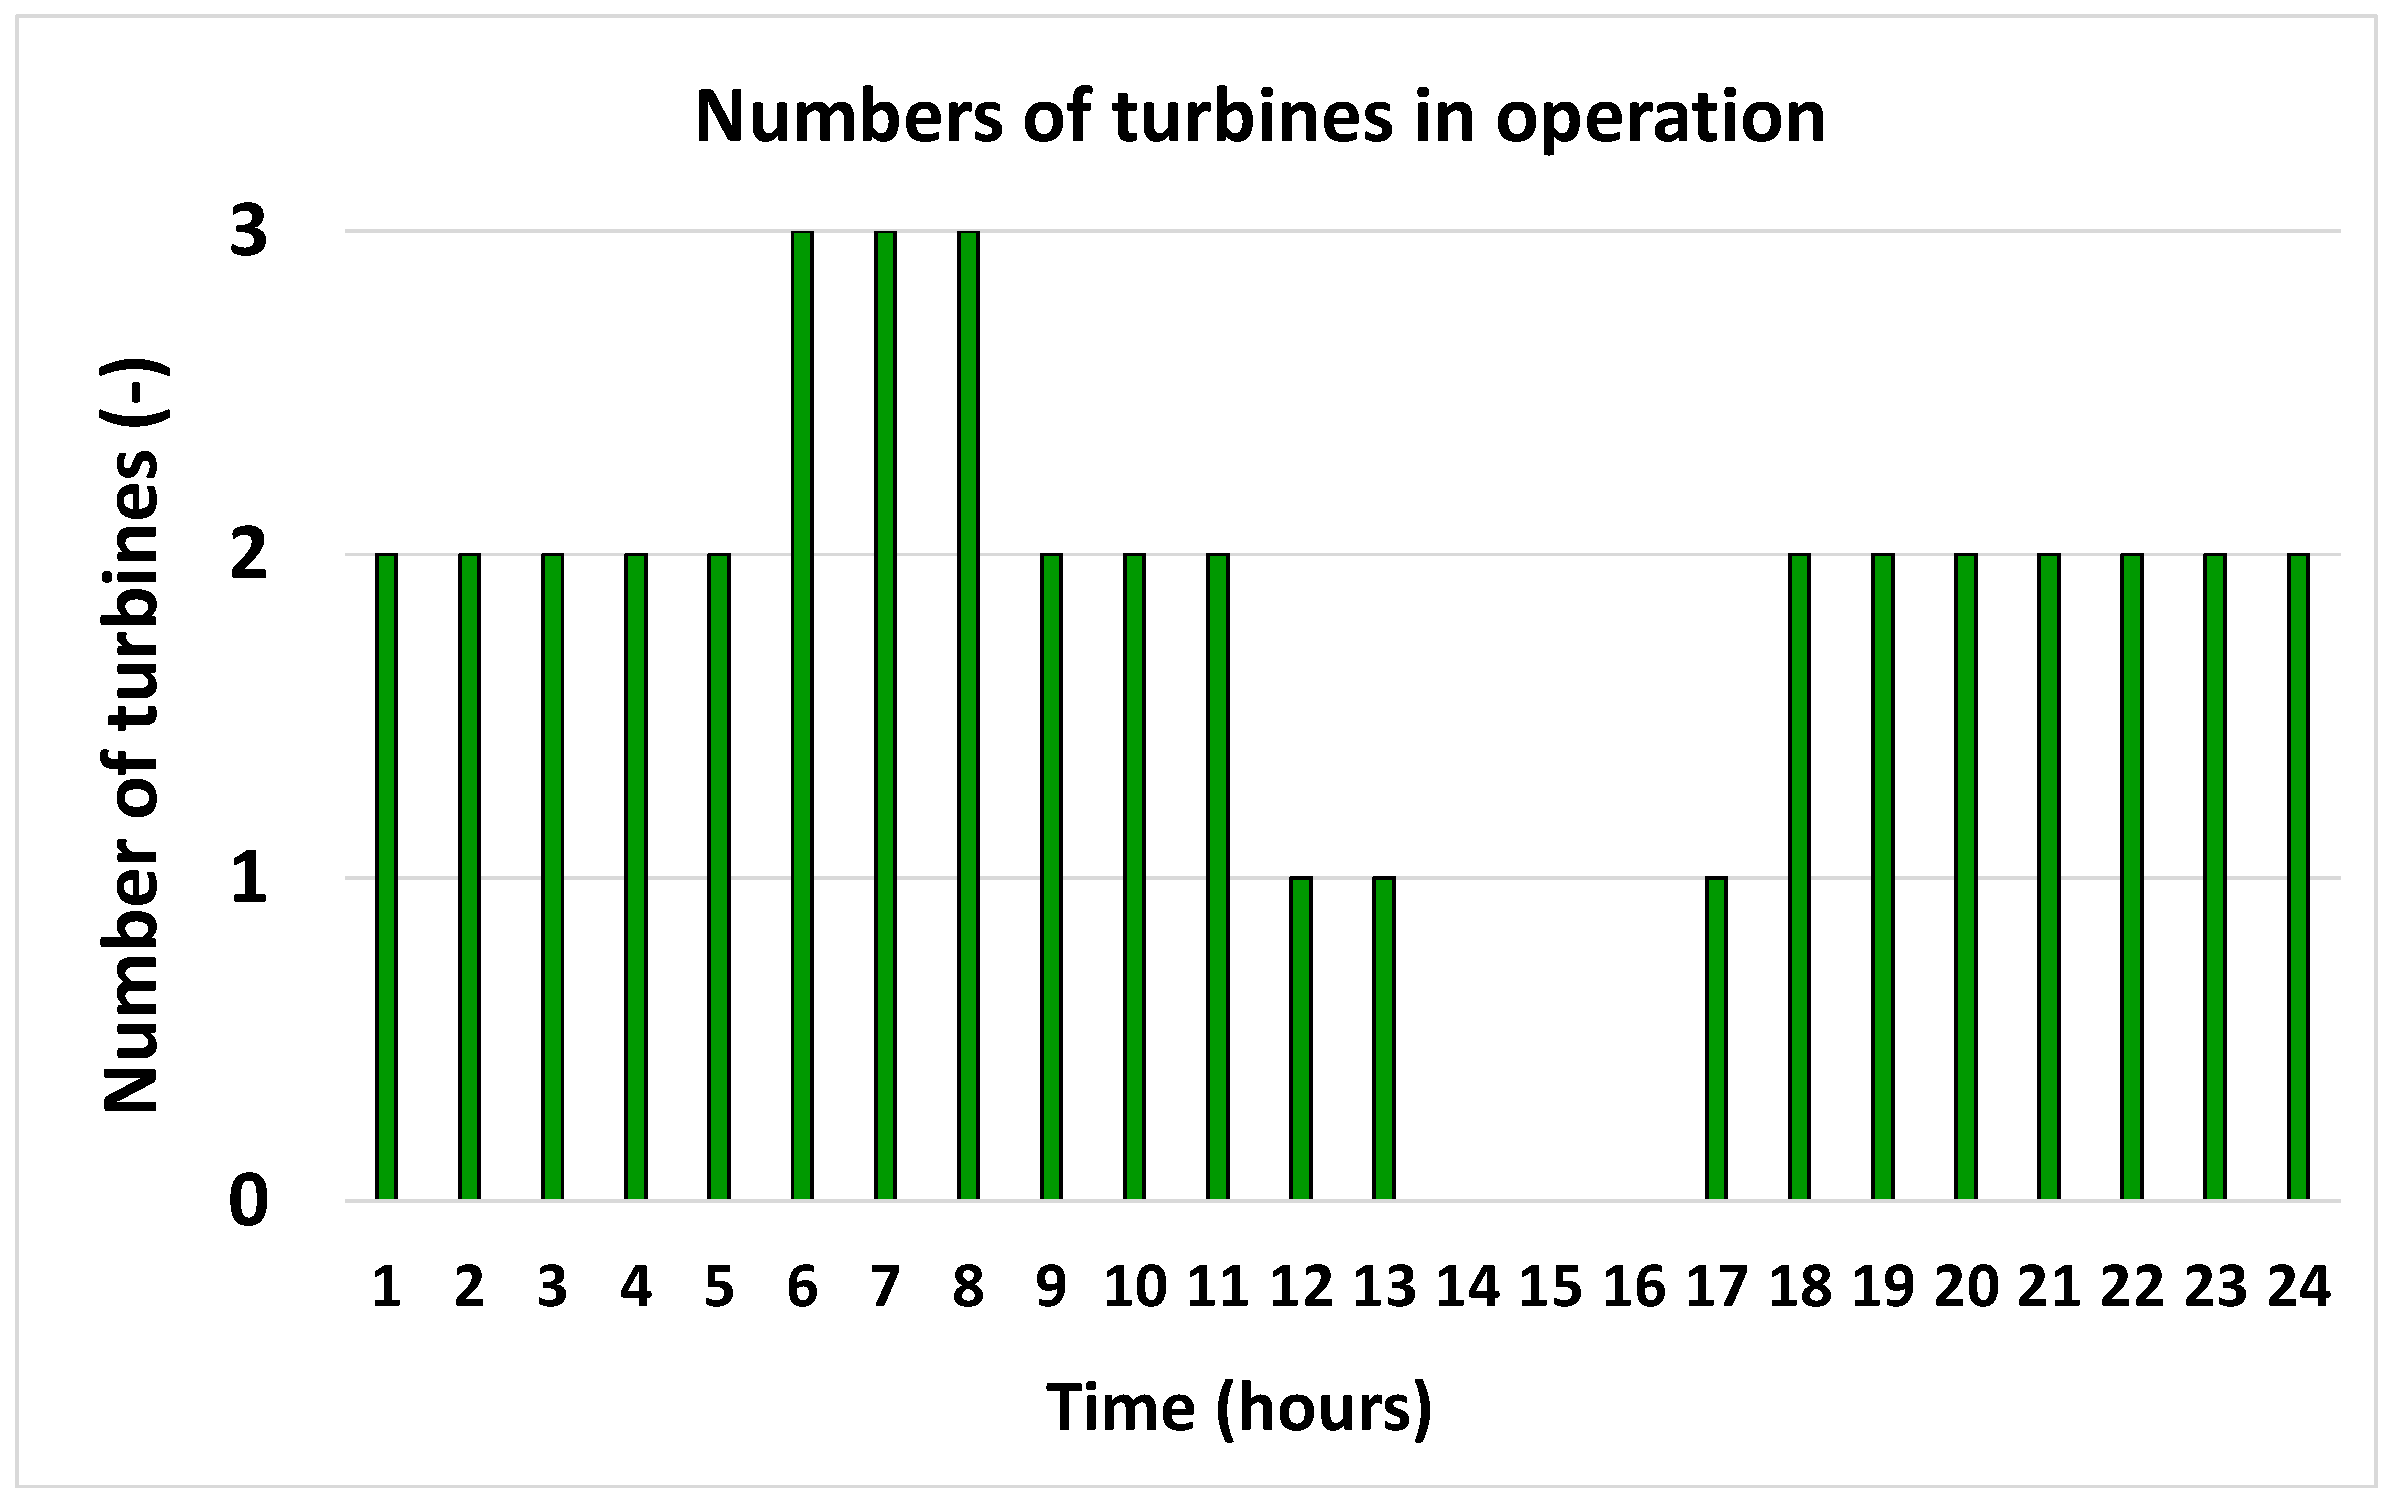
5.3. Hourly Operational Behavior
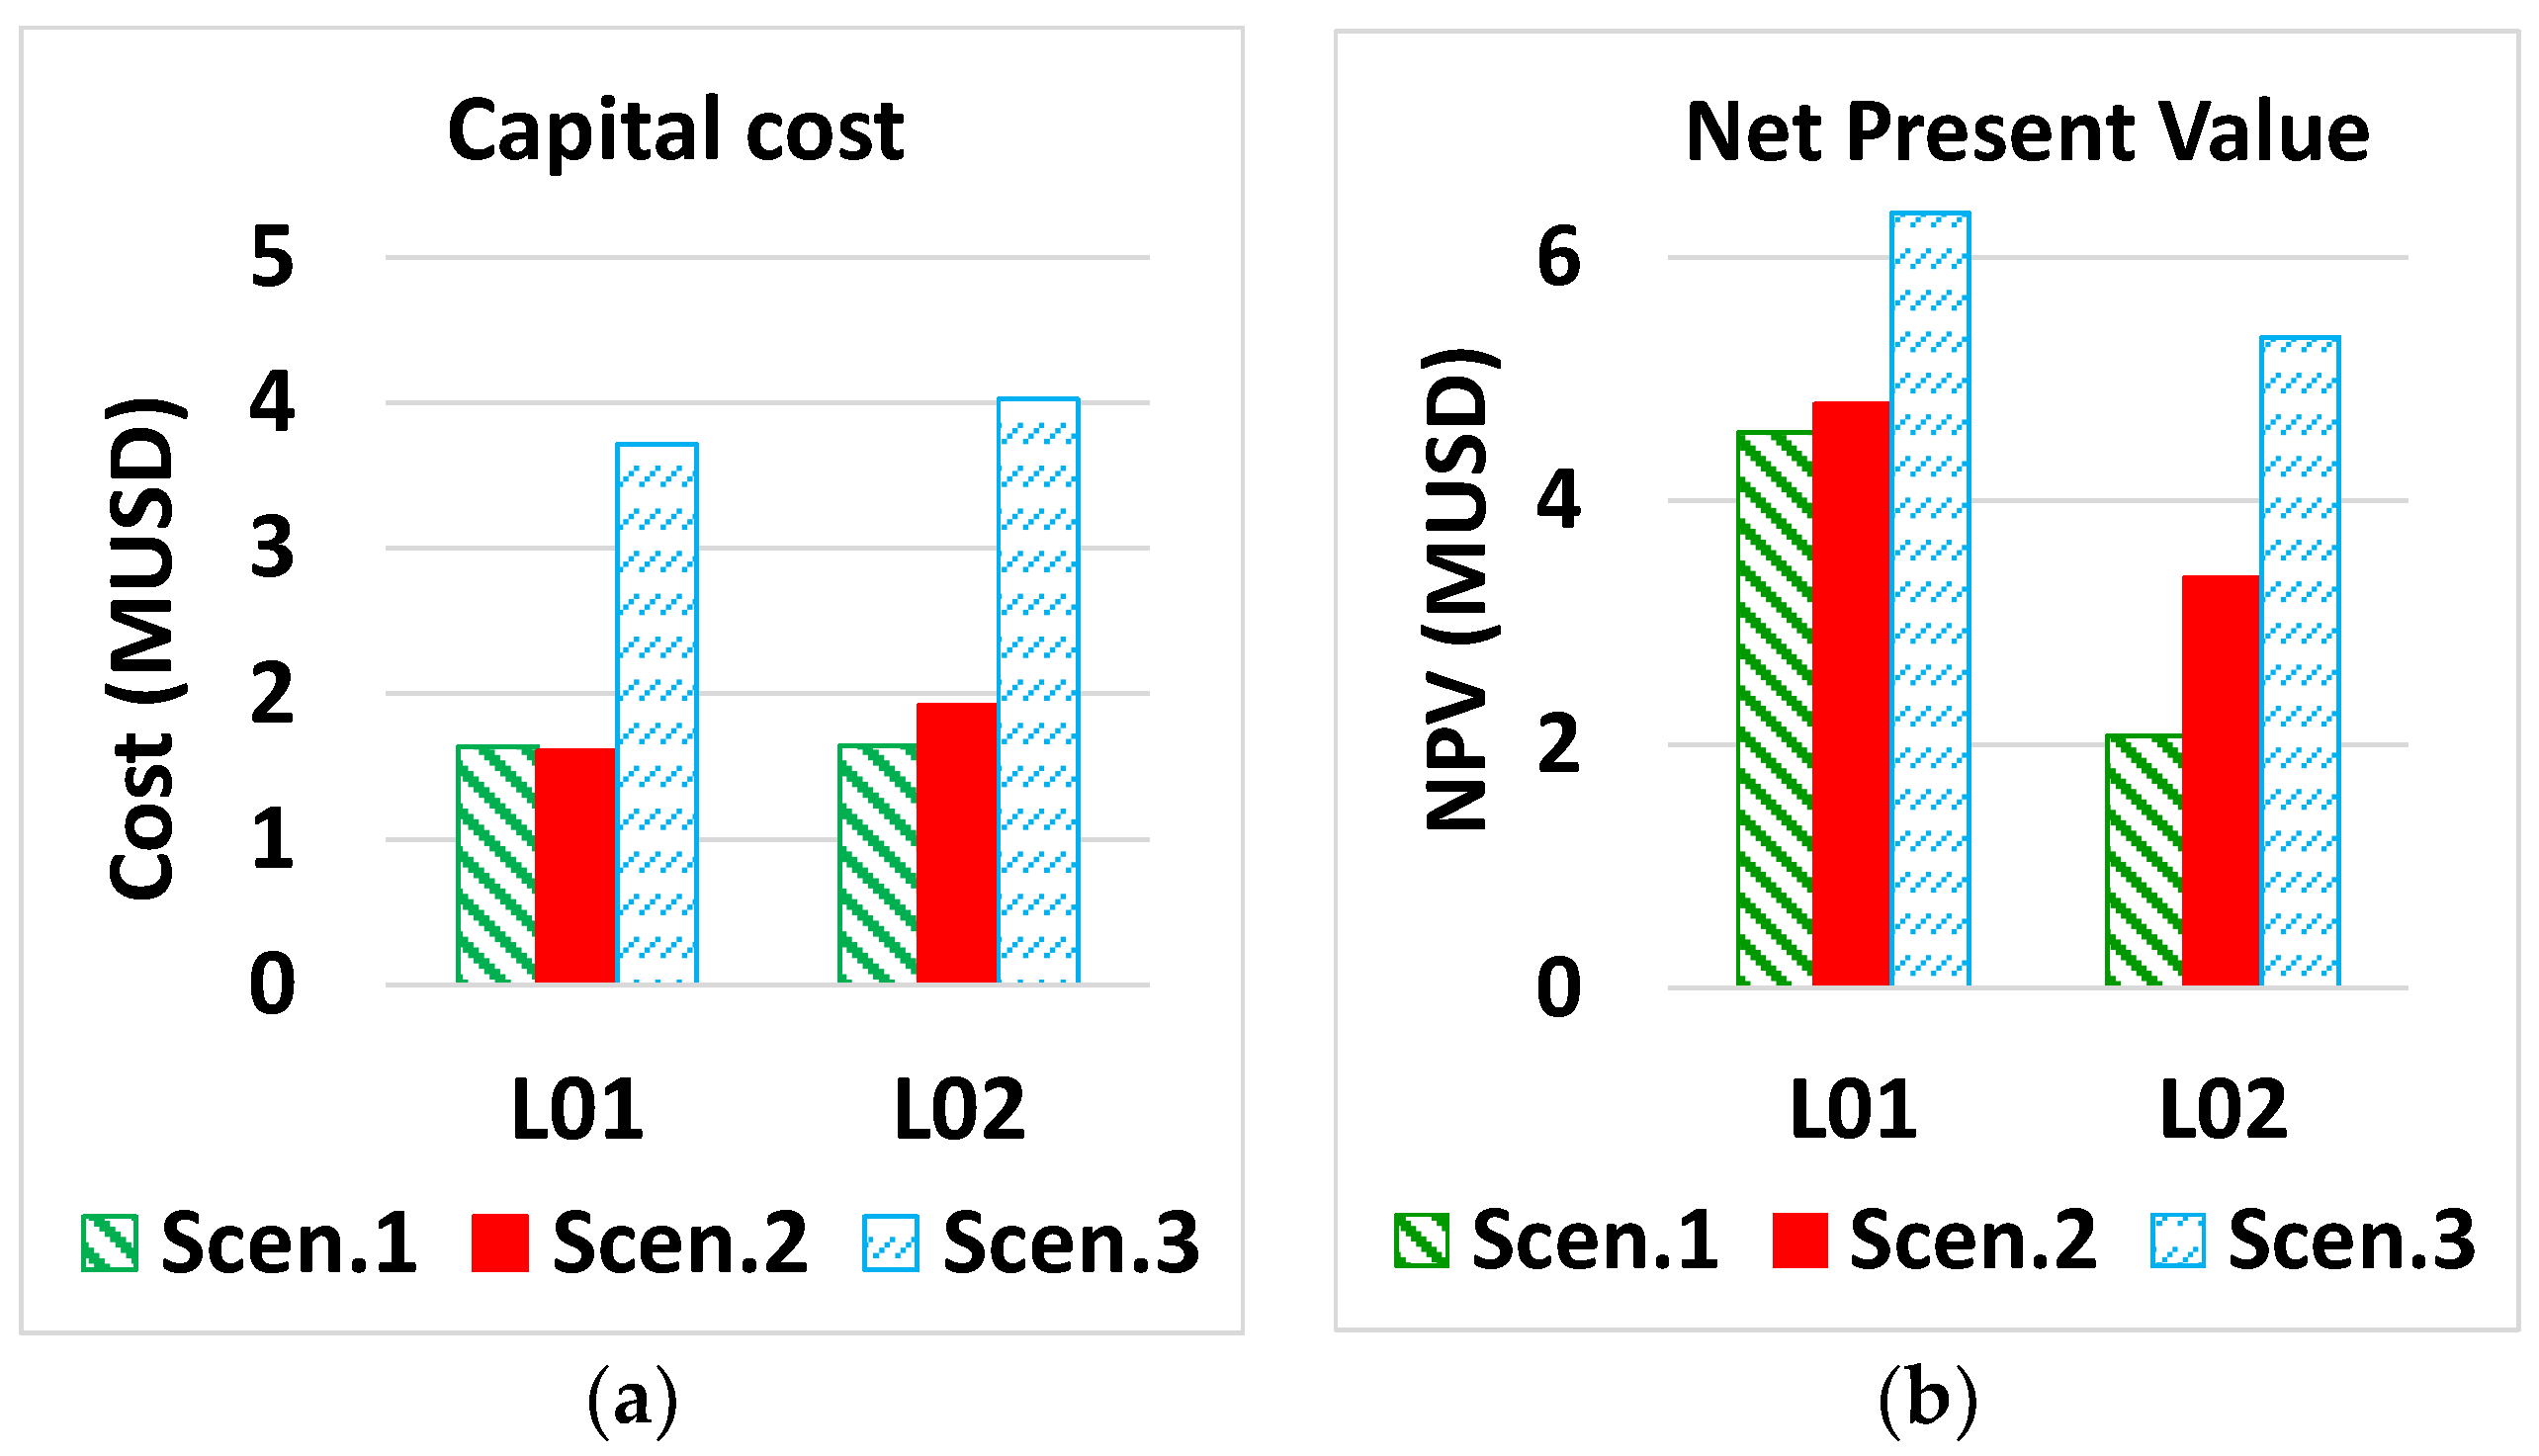
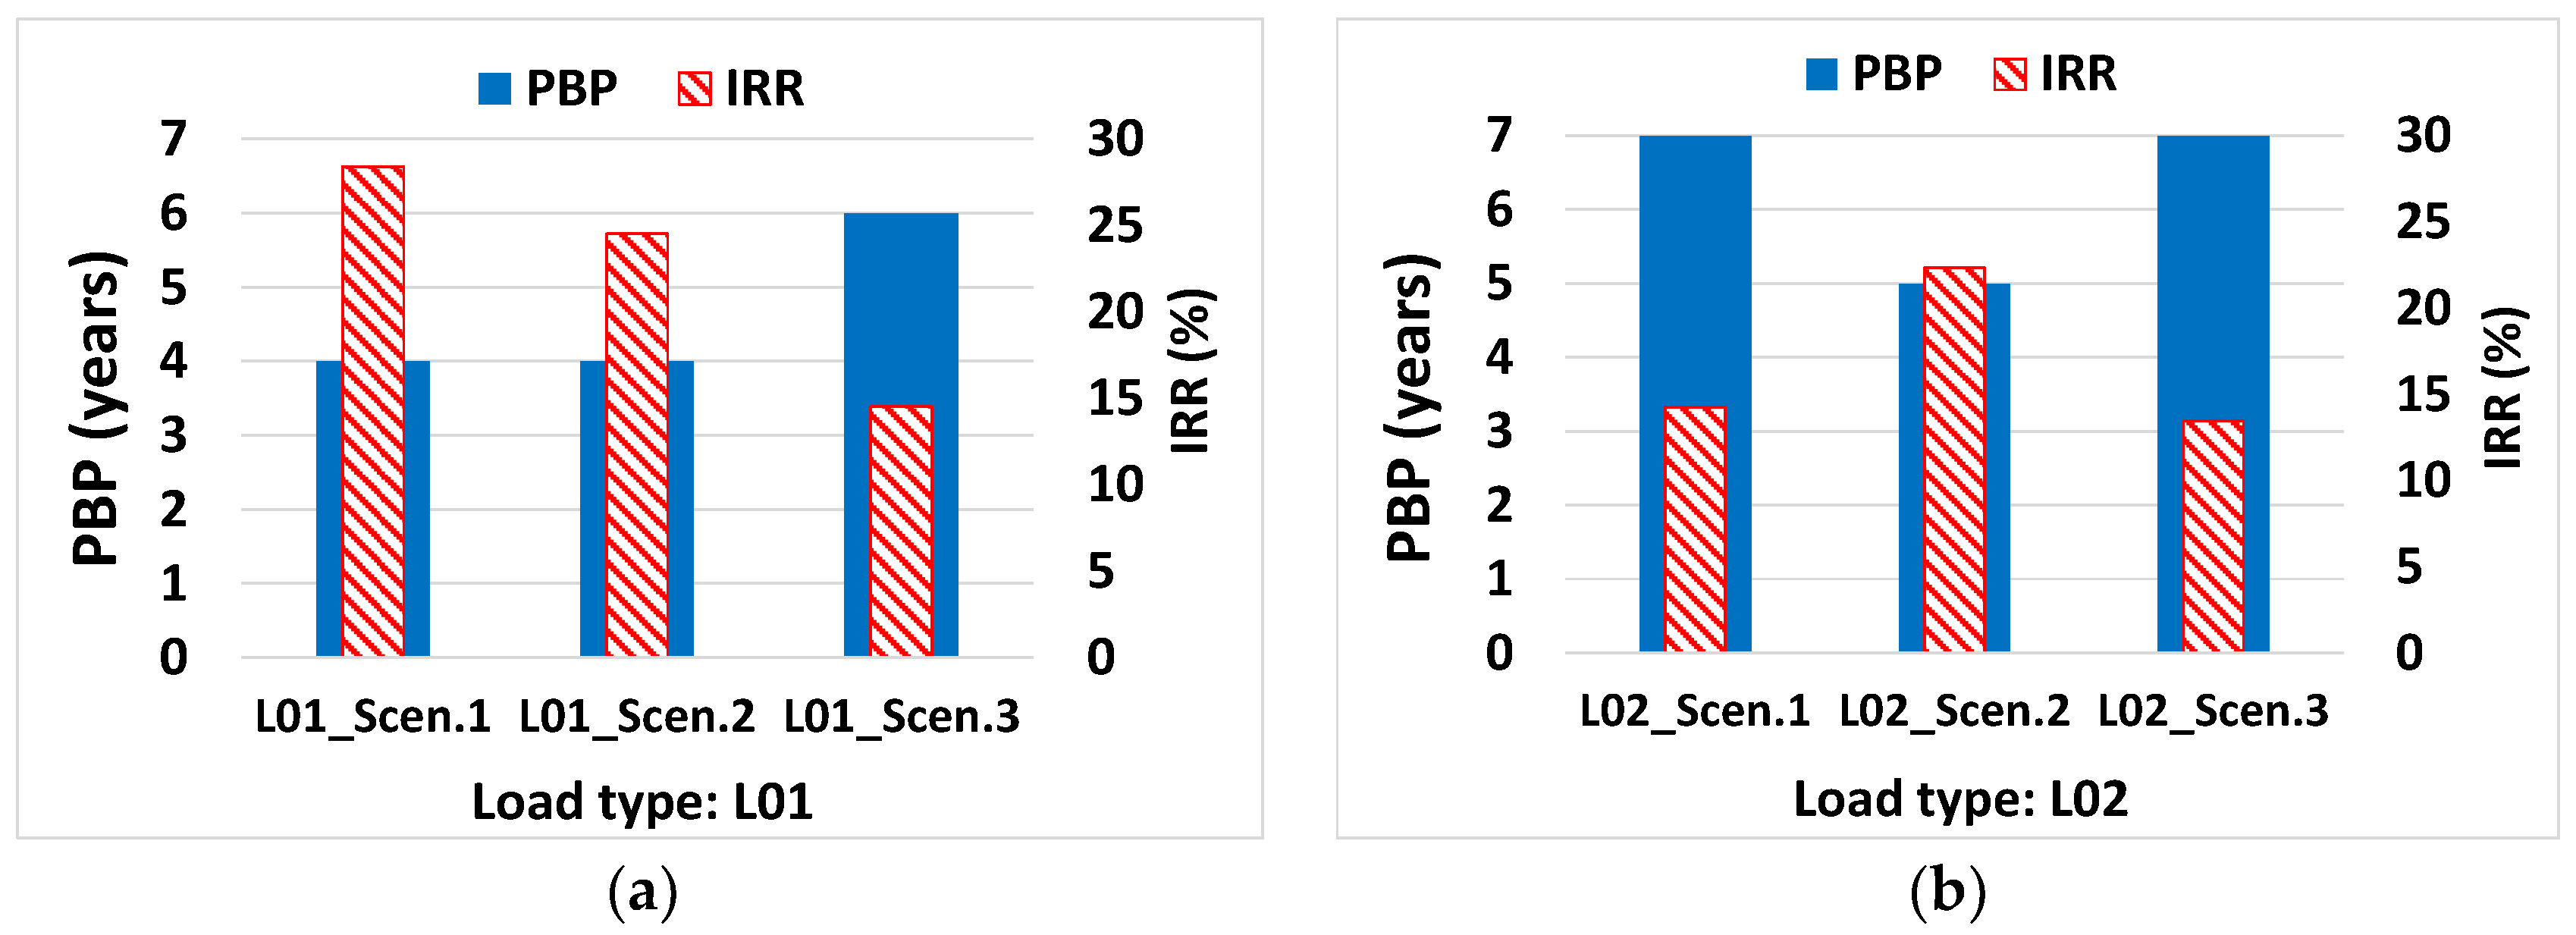
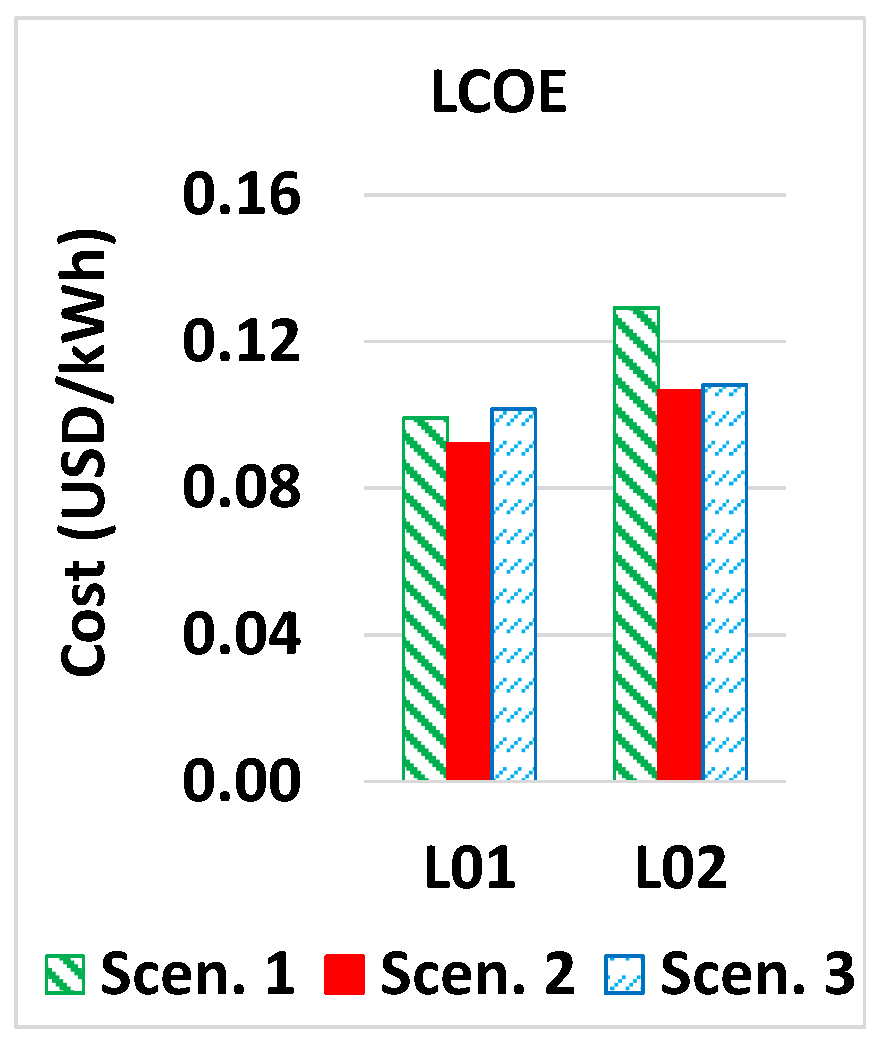
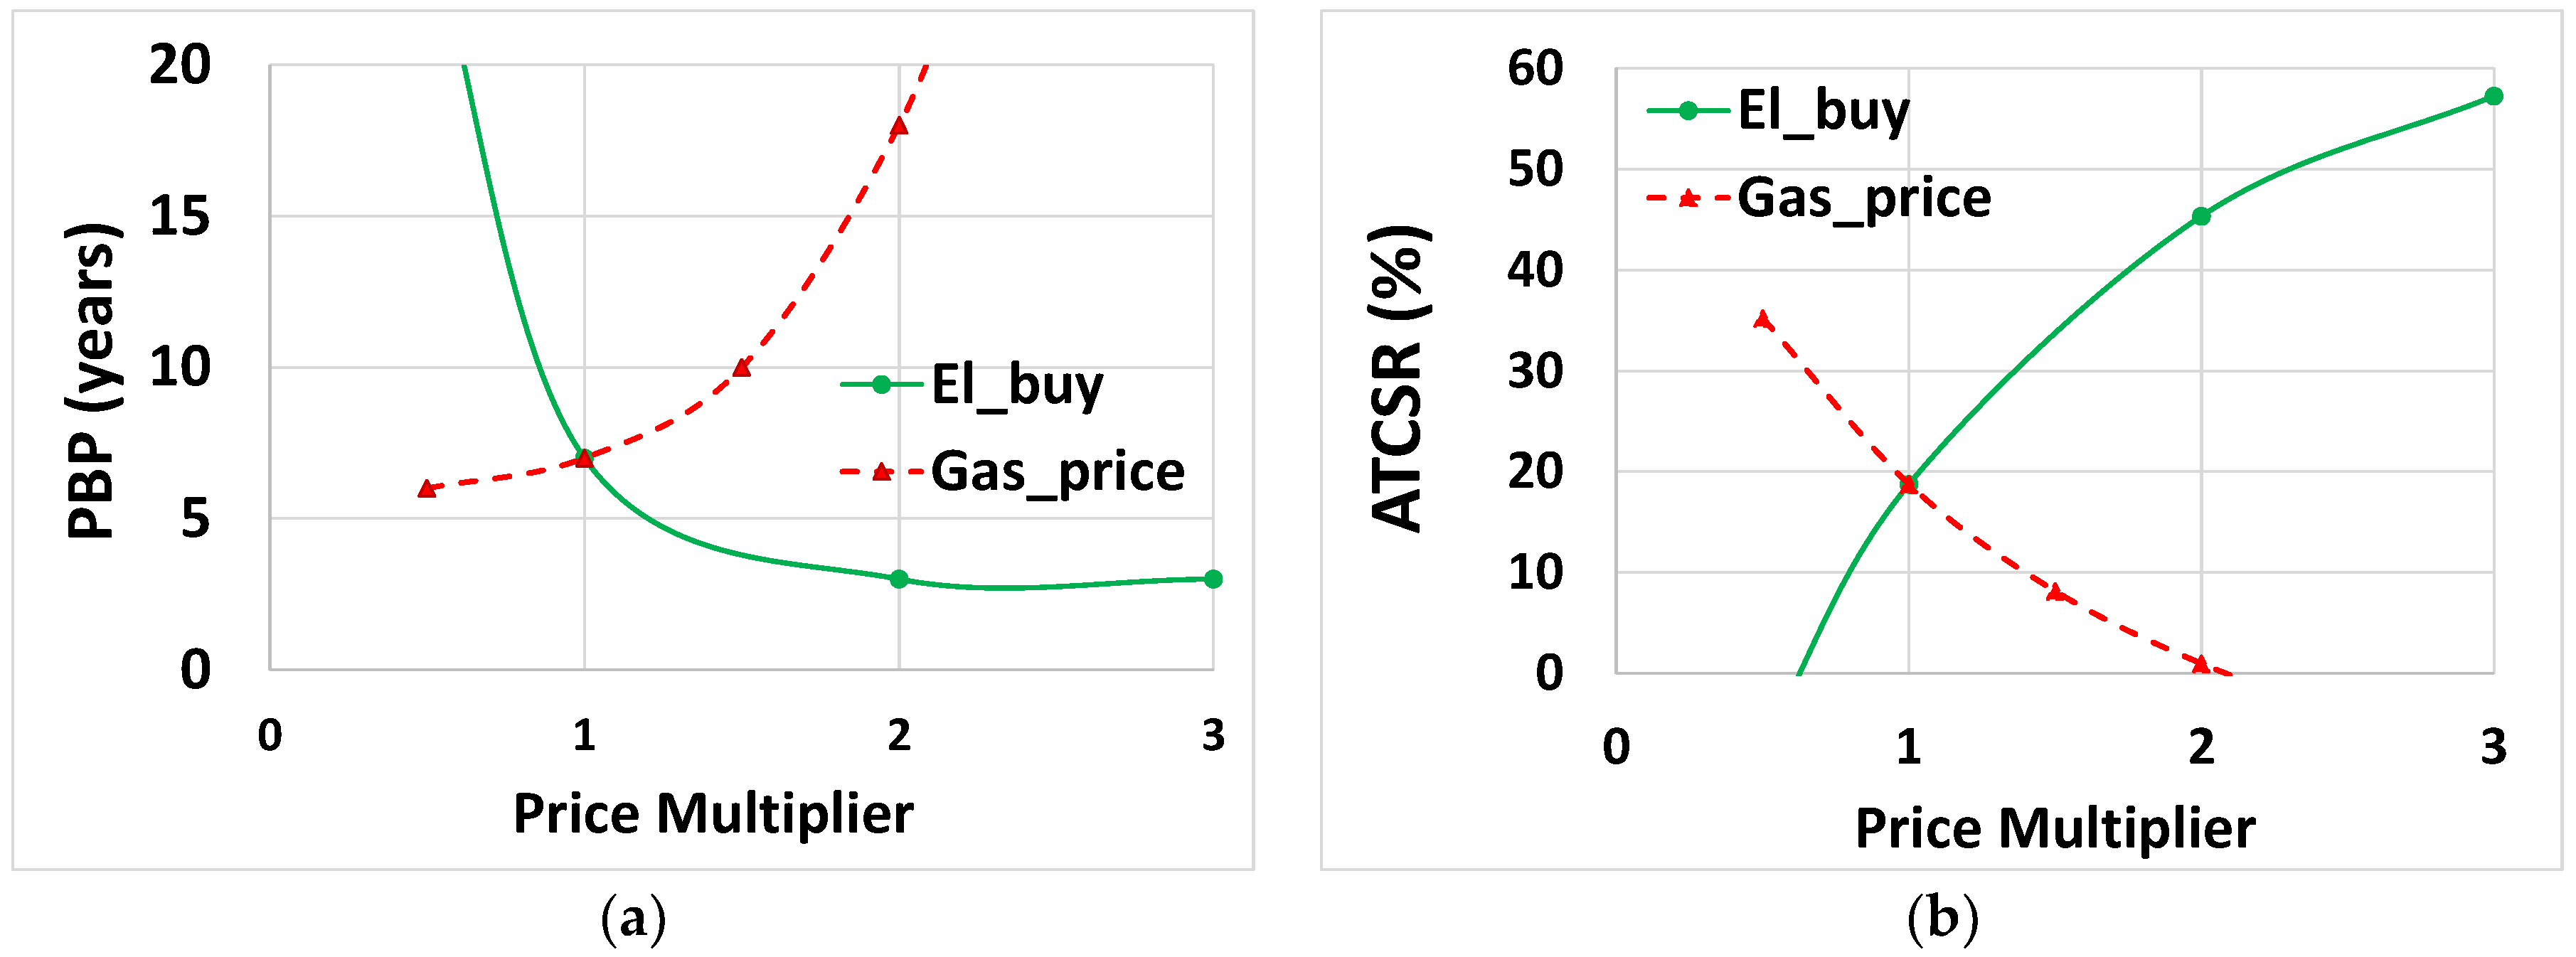
5.4. Economic Analysis
6. Conclusions
Author Contributions
Acknowledgments
Conflicts of Interest
Nomenclature
| ATCSR | Annualized total cost saving ratio (%) | Superscripts | |
| C | Cooling (kW) | Poly | Polygeneration system |
| CCHP | Combined cooling, heating and power | Ref | Reference system |
| CHP | Combined heat and power | Subscripts | |
| CO2ERR | CO2 emission reduction ratio (%) | c | Cooling |
| COP | Coefficient of performance (-) | chp | Combined heat and power |
| CS | Cold storage | cs | Cold storage |
| F | Fuel energy (kWh) | dem | Demand |
| FEL | Following electric load | dl | Distribution line |
| FTL | Following thermal load | Ech | Electric chiller |
| FS | Fuel saving (USD) | el | Electricity |
| FSR | Fuel saving ratio (%) | exp | Export |
| H | Heating (kWth) | f | Fuel |
| Hs | Heat storage | grid | Utility grid |
| IRR | Internal rate of return (%) | hru | Heat recovery unit |
| ISR | Integrated saving ratio (%) | hs | Heat storage |
| LCOE | Levelized cost of electricity | imp | Import |
| MBL | Modified base load | in | Input |
| NPV | Net present value | pv | Photovoltaic panel |
| P | Power (kWel) | ||
| PV | Photovoltaic | shu | Solar heater unit |
| PBP | Payback period (year) | sup | Supply |
| PL | Part-load (%) | Tch | Thermal chiller |
| PSO | Particle swarm optimization | ||
| t | Time | th | Thermal |
| T | Temperature (°C) | tot | Total |
| ToU | Time of Use | wind | Wind turbine |
| W | Weighting factor | ||
| Greek letters | |||
| µ | Emission factor(g/kWh) | ||
| ƞ | Efficiency (%) | ||
References
- U.S. Energy Information Administration (EIA). International Energy Outlook 2016; U.S. Energy Information Administration (EIA): Washington, DC, USA, 2016.
- Dean, B.; Dulac, J.; Petrichenko, K.; Graham, P. Towards Zero-Emission Efficient and Resilient Buildings Global Status Report 2016; United Nations Environment Programme (UNEP): Nairobi, Kenya, 2016. [Google Scholar]
- European Commission Directorate-General for Energy. Communication from the Commission to the European Parliament, the Council, the European Economic and Social Committee and the Committee of the Regions: An EU Strategy on Heating and Cooling; European Commission, Directorate General for Energy: Brussels, Belgium, 2016.
- Calise, F.; D’Accadia, M.D. Simulation of polygeneration systems. Energies 2016, 9, 925. [Google Scholar] [CrossRef]
- International Energy Agency (IEA); Fraser, P. Distributed Generation in Liberalised Electricity Markets; OCEA/IEA: Paris, France, 2002; ISBN 9789264198029. [Google Scholar]
- El-Khattam, W.; Salama, M.M.A. Distributed generation technologies, definitions and benefits. Electr. Power Syst. Res. 2004, 71, 119–128. [Google Scholar] [CrossRef]
- Pepermans, G.; Driesen, J.; Haeseldonckx, D.; Belmans, R.; D’haeseleer, W. Distributed generation: Definition, benefits and issues. Energy Policy 2005, 33, 787–798. [Google Scholar] [CrossRef]
- Al Moussawi, H.; Fardoun, F.; Louahlia-Gualous, H. Review of tri-generation technologies: Design evaluation, optimization, decision-making, and selection approach. Energy Convers. Manag. 2016, 120, 157–196. [Google Scholar] [CrossRef]
- Mancarella, P. MES (multi-energy systems): An overview of concepts and evaluation models. Energy 2014, 65, 1–17. [Google Scholar] [CrossRef]
- Jana, K.; Ray, A.; Majoumerd, M.M.; Assadi, M.; De, S. Polygeneration as a future sustainable energy solution—A comprehensive review. Appl. Energy 2017, 202, 88–111. [Google Scholar] [CrossRef]
- Ghaem Sigarchian, S.; Malmquist, A.; Martin, V. Optimal planning and design method for complex polygeneration systems: A case study for a residential building in Italy. Energy Convers. Manag. under revision.
- Moya, M.; Bruno, J.C.; Eguia, P.; Torres, E.; Zamora, I.; Coronas, A. Performance analysis of a trigeneration system based on a micro gas turbine and an air-cooled, indirect fired, ammonia-water absorption chiller. Appl. Energy 2011, 88, 4424–4440. [Google Scholar] [CrossRef]
- Romero Rodríguez, L.; Salmerón Lissén, J.M.; Sánchez Ramos, J.; Rodríguez Jara, E.Á.; Álvarez Domínguez, S. Analysis of the economic feasibility and reduction of a building’s energy consumption and emissions when integrating hybrid solar thermal/PV/micro-CHP systems. Appl. Energy 2016, 165, 828–838. [Google Scholar] [CrossRef]
- Calise, F.; Dentice d’Accadia, M.; Piacentino, A.; Vicidomini, M. Thermoeconomic optimization of a renewable polygeneration system serving a small isolated community. Energies 2015, 8, 995–1024. [Google Scholar] [CrossRef]
- Yousefi, H.; Ghodusinejad, M.H.; Kasaeian, A. Multi-objective optimal component sizing of a hybrid ICE + PV/T driven CCHP microgrid. Appl. Therm. Eng. 2017, 122, 126–138. [Google Scholar] [CrossRef]
- Di Somma, M.; Yan, B.; Bianco, N.; Graditi, G.; Luh, P.B.; Mongibello, L.; Naso, V. Multi-objective design optimization of distributed energy systems through cost and exergy assessments. Appl. Energy 2017, 204, 1299–1316. [Google Scholar] [CrossRef]
- Arcuri, P.; Florio, G.; Fragiacomo, P. A mixed integer programming model for optimal design of trigeneration in a hospital complex. Energy 2007, 32, 1430–1447. [Google Scholar] [CrossRef]
- Li, L.; Mu, H.; Gao, W.; Li, M. Optimization and analysis of CCHP system based on energy loads coupling of residential and office buildings. Appl. Energy 2014, 136, 206–216. [Google Scholar] [CrossRef]
- Rubio-Maya, C.; Uche, J.; Martínez, A. Sequential optimization of a polygeneration plant. Energy Convers. Manag. 2011, 52, 2861–2869. [Google Scholar] [CrossRef]
- Ghaem Sigarchian, S.; Malmquist, A.; Martin, V. The choice of operating strategy for a complex polygeneration system: A case study for a residential building in Italy. Energy Convers. Manag. 2018, 163, 278–291. [Google Scholar] [CrossRef]
- Calise, F.; D’Accadia, M.D.; Libertini, L.; Quiriti, E.; Vicidomini, M. A novel tool for thermoeconomic analysis and optimization of trigeneration systems: A case study for a hospital building in Italy. Energy 2017, 126, 64–87. [Google Scholar] [CrossRef]
- Buonomano, A.; Calise, F.; Ferruzzi, G.; Palombo, A. Dynamic energy performance analysis: Case study for energy efficiency retrofits of hospital buildings. Energy 2014, 78, 555–572. [Google Scholar] [CrossRef]
- Buonomano, A.; Calise, F.; Ferruzzi, G.; Vanoli, L. A novel renewable polygeneration system for hospital buildings: Design, simulation and thermo-economic optimization. Appl. Therm. Eng. 2014, 67, 43–60. [Google Scholar] [CrossRef]
- Barbieri, E.S.; Spina, P.R.; Venturini, M. Analysis of innovative micro-CHP systems to meet household energy demands. Appl. Energy 2012, 97, 723–733. [Google Scholar] [CrossRef]
- Ehyaei, M.A.; Mozafari, A. Energy, economic and environmental (3E) analysis of a micro gas turbine employed for on-site combined heat and power production. Energy Build. 2010, 42, 259–264. [Google Scholar] [CrossRef]
- Bianchi, M.; De Pascale, A.; Spina, P.R. Guidelines for residential micro-CHP systems design. Appl. Energy 2012, 97, 673–685. [Google Scholar] [CrossRef]
- Wang, J.; Zhai, Z.J.; Jing, Y.; Zhang, C. Particle swarm optimization for redundant building cooling heating and power system. Appl. Energy 2010, 87, 3668–3679. [Google Scholar] [CrossRef]
- Wang, J.-J.; Zhang, C.-F.; Jing, Y.-Y. Multi-criteria analysis of combined cooling, heating and power systems in different climate zones in China. Appl. Energy 2010, 87, 1247–1259. [Google Scholar] [CrossRef]
- Kennedy, J.; Eberhart, R. Particle Sawrm Optimization. In Neural Networks Proceedings, Proceedings of the IEEE International Conference on Computational Intelligence, Anchorage, AK, USA, 4–9 May 1998; IEEE: Piscataway, NJ, USA, 1995; pp. 1943–1948. [Google Scholar]
- Ghaem Sigarchian, S.; Orosz, M.S.; Hemond, H.F.; Malmquist, A. Optimum design of a hybrid PV-CSP-LPG microgrid with Particle Swarm Optimization technique. Appl. Therm. Eng. 2016, 109, 1031–1036. [Google Scholar] [CrossRef]
- Hu, X. Particle Swarm Optimization. Available online: http://www.swarmintelligence.org (accessed on 15 May 2015).
- IEA EBC Annex 54. Methodologies for the Performance Assessment of Micro Hybrid Polygeneration Systems; IEA EBC Annex 54 Integration of Micro-Generation and Related Energy Technologies in Buildings, Technische Universität München: München, Germany, 2014; Volume 10. [Google Scholar]
- Capstone Technical Support Technical Reference Capstone C30 Microturbine 2006. Available online: https://www.capstoneturbine.com (accessed on 15 February 2016).
- Capstone Technical support Capstone Turbine Corporation, Capstone C1000 Series Microturbine Systems 2011. Capstone Turbine Corporation: Chatsworth CA, USA, 2011. Available online: https://www.capstoneturbine.com (accessed on 15 February 2016).
- Capstone Technical Support Technical Reference Capstone C200 Microturbine 2009. Available online: https://www.capstoneturbine.com (accessed on 15 February 2016).
- Tang, T.; Villarreal, L. Guideline: Absorption Chillers; New Buildings Institute: Fair Oaks, CA, USA, 1998. [Google Scholar]
- Polaris America, LLC. Available online: http://www.polarisamerica.com/turbines/20kw-wind-turbines/ (accessed on 15 Jnuary 2017).
- Beerepoot, M.; International Energy Agency (IEA). Technology Roadmap: Solar Heating and Cooling; OECD/IEA International Energy Agency IEA Publishing: Paris, France, 2012. [Google Scholar]
- Wu, D.W.; Wang, R.Z. Combined cooling, heating and power: A review. Prog. Energy Combust. Sci. 2006, 32, 459–495. [Google Scholar] [CrossRef]
- Majeski, J. Stirling Engine Assessment; EPRI, Energy International, Inc.: Bellevue, WA, USA, 2006; Volume 1, pp. 1–170. [Google Scholar]
- Angrisani, G.; Roselli, C.; Sasso, M. Distributed microtrigeneration systems. Prog. Energy Combust. Sci. 2012, 38, 502–521. [Google Scholar] [CrossRef]
- Simader, G.; Krawinkler, R.; Trnka, G. Micro CHP Systems: State-of-the-Art; Österreichische Energieagentur—Austrian Energy Agency: Vienna, Austria, 2006; Volume 8. [Google Scholar]
- Cogeneration Observatory and Dissemination Europe. Micro-CHP Potential Analysis European Level Report Partner Name: Energy Matters; European Commission (Intelligent Energy Europe—IEE): Brussels, Belgium, 2014. [Google Scholar]
- NREL Distributed Generation Renewable Energy Estimate of Costs. Available online: http://www.nrel.gov/analysis/tech-lcoe-re-cost-est.html (accessed on 15 January 2017).
- Capehart, B.L. Microturbines. Available online: https://www.wbdg.org/resources/microturbines.php (accessed on 15 May 2017).
- Eicker, U.; Pietruschka, D. Design and performance of solar powered absorption cooling systems in office buildings. Energy Build. 2009, 41, 81–91. [Google Scholar] [CrossRef]
- Selection, M.; Manual, D. BROAD X Absorption Chiller Model Selection & Design Manual; Broad Air Conditioning: Changsha, China, 2008. [Google Scholar]
- Faninger, G. Thermal Energy Storage; Facaulty of Interdiciplinary Research and Continuing Education, IFF-University of Klagenfurt: Klagenfurt, Austria, 2013. [Google Scholar]
- IEA-ETSAP and IRENA Technology Brief E17. Thermal Energy Storage Technology Brief. 2013. Available online: https://cleanenergysolutions.org/es/resources/thermal-energy-storage-technology-brief (accessed on 15 May 2016).
- Roth, K.; Zogg, R.; Brodreick, J. Cool thermal energy storage. ASHRAE J. 2006, 48, 94–96. [Google Scholar]
- Hampson, A.; Deaver, P.; Neff, B.; Bender, S.; Oglesby, R.; ICF International Inc. Combined Heat and Power: Policy Analysis and 2011–2030; California Energy Commission: Sacramento, CA, USA, 2012.
- Itron Inc. 2010–2012 WO017 Ex Ante Measure Cost Study Final Report; California Public Utilities Commission: Oakland, CA, USA, 2014.
- Torchio, M.F. Comparison of district heating CHP and distributed generation CHP with energy, environmental and economic criteria for Northern Italy. Energy Convers. Manag. 2015, 92, 114–128. [Google Scholar] [CrossRef]
- Eurostat Natural Gas Price Statistics. Available online: http://ec.europa.eu/eurostat/statistics-explained/index.php/Natural_gas_price_statistics (accessed on 15 October 2017).
- Eurostat Electricity Price Statistics. Available online: http://ec.europa.eu/eurostat/statistics-explained/index.php/Electricity_price_statistics (accessed on 15 October 2017).
- European Union. How to Develop a Sustainable Energy Action Plan (SEAP)—Guidebook; European Commission, Covenant of mayors, Publications Office of the European Union: Luxembourg, 2010. [Google Scholar]
- Greening, B.; Azapagic, A. Domestic solar thermal water heating: A sustainable option for the UK? Renew. Energy 2014, 63, 23–36. [Google Scholar] [CrossRef]
- Berk, J.; Peter, D. Corporate Finance, Global Edition, 3rd ed.; Pearson: New York, NY, USA, 2013; ISBN 9780273792062. [Google Scholar]


| Components | Scenarios | ||
|---|---|---|---|
| 1 | 2 | 3 | |
| CHP unit | x | x | x |
| Boiler | x | x | x |
| Electricity from/to grid | x | x | x |
| Electric chiller | x | x | x |
| Thermal chiller | _ | x | x |
| Heat storage | x | x | x |
| Cold storage | _ | x | x |
| Solar photovoltaic (PV) | _ | _ | x |
| Solar heating unit | _ | _ | x |
| Battery | _ | _ | x |
| Wind Turbine | _ | _ | x |
| Component | Parameter | Value |
|---|---|---|
| CHP system | Nominal electrical efficiency (%) [33,34,35] | 26–34 |
| Heat recovery unit thermal efficiency (%) | 85 | |
| Heat loss in the CHP unit (%) | 3 | |
| Auxiliary boiler | Thermal efficiency (%) | 80 |
| Heat/cooling distribution | Cooling coil thermal efficiency (%) | 98 |
| Heating coil thermal efficiency (%) | 98 | |
| Battery storage | Round trip Efficiency (%) | 90 |
| Minimum/maximum state of charge (%) | 20/90 | |
| Thermal chiller [36] (single stage absorption chiller) | Coefficient of performance (COP) | 0.7 |
| Electric chiller | Coefficient of performance (COP) | 3 |
| Solar thermal | Optical efficiency at standard condition | 0.8 |
| Thermal storage | Loss coefficient of the storage at each time-step (%) | 2 |
| Solar PV system | Module efficiency (%) | 16 |
| Inverter efficiency (%) | 98 | |
| Wind turbine | Nominal power of one turbine (kWel) | 20 |
| Cut-in/out/rated speed (m/s) [37] | 4/16/11 |
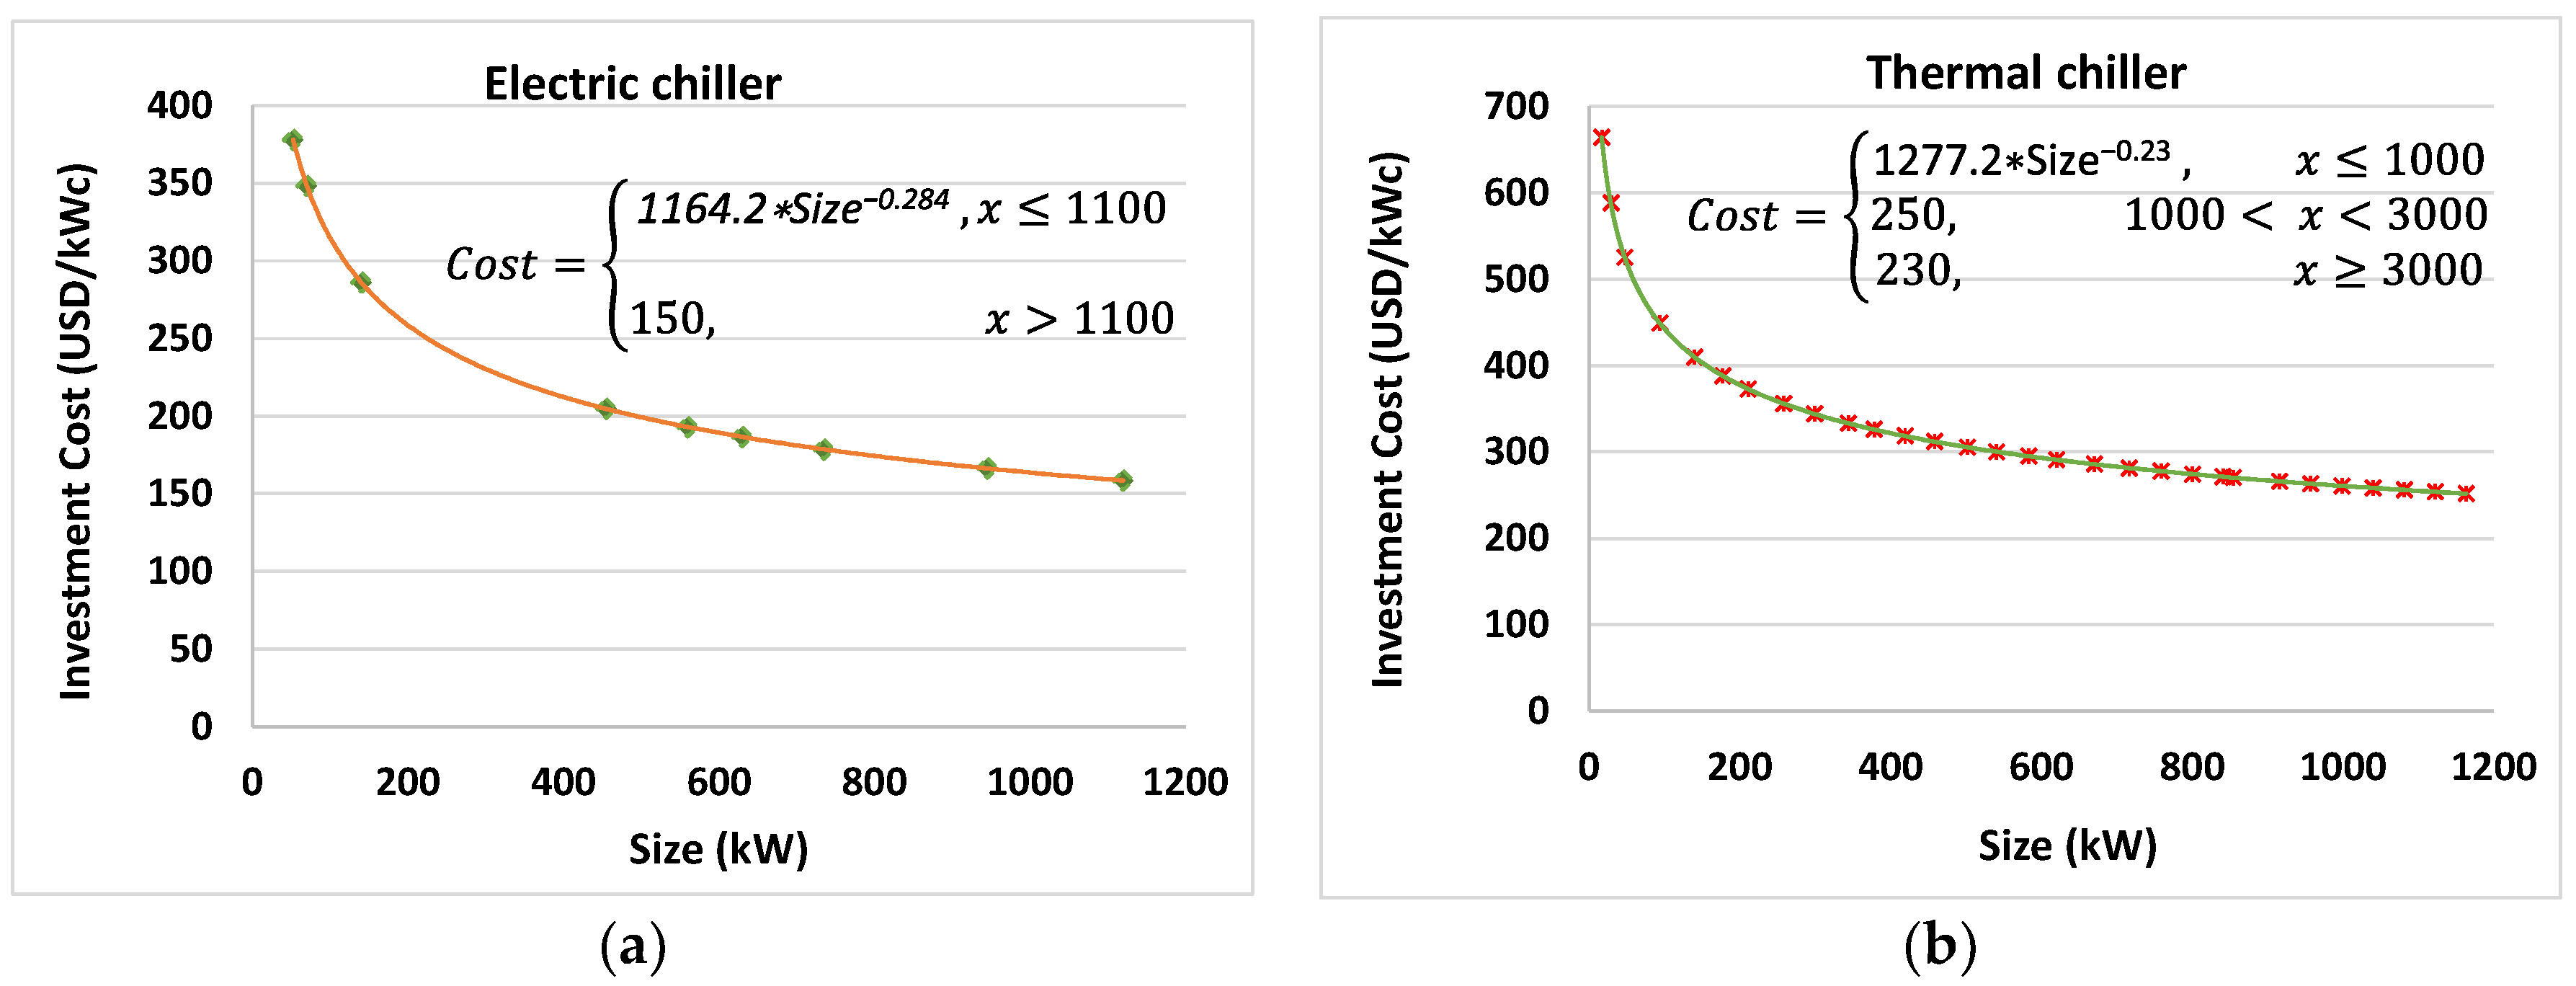
| Component | Capital Cost | Unit | Maintenance Cost | Unit |
|---|---|---|---|---|
| Solar PV | 2000 | USD/kWel | 4 | USD/kWyr |
| Solar collector [38] | 250 | USD/m2 | 0.5 | USD/m2yr |
| Wind turbine | 4000 | USD/kWel | 25 | USD/kWyr |
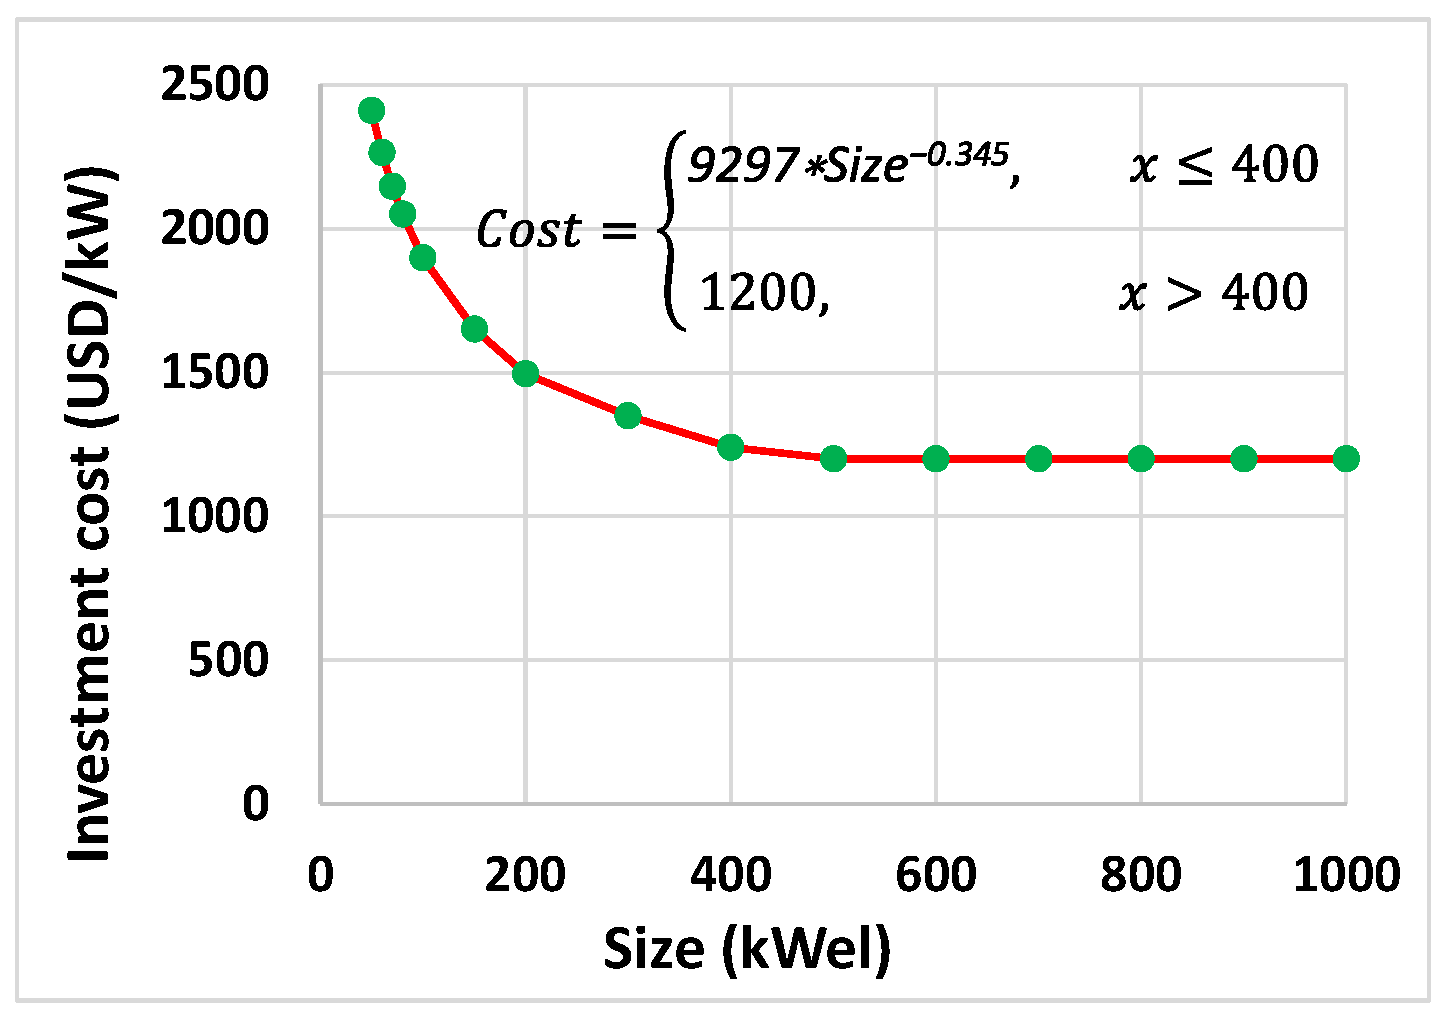
| CHP (Micro gas turbine) [16,45] | 1200–2450 | USD/kWel | 0.005–0.016 | USD/kWhel |
| Auxiliary boiler | 80 | USD/kWth | 0.003 | USD/kWth |
| Battery storage | 350 | USD/kWth | 0.002 | USD/kWhel |
| Thermal chiller [16,47,51] | 230–700 | USD/kWc | 0.001 | USD/kWc |
| Electric chiller [51,52] | 150–380 | USD/kWc | 0.001 | USD/kWc |
| Heat storage [49] | 20 | USD/kWh | 0.002 | USD/kWhyr |
| Cold storage [50] | 30 | USD/kWh | 0.002 | USD/kWhyr |
| Commodity | Hourse | Unit Price (USD/kWh) |
|---|---|---|
| Electricity purchase | ||
| (22:00–5:00) (8:00–11:00) | 0.18 | |
| (5:00–8:00) (11:00–17:00) | 0.22 | |
| (17:00–22:00) | 0.24 | |
| Electricity sell | - | 0.12 |
| Natural gas [53,54] | - | 0.08 |
| Item | Standard Emission Factor (kg CO2/kWh) |
|---|---|
| Natural gas [56] | 0.202 |
| CHP (natural gas driven) [56] | 0.202 |
| Grid (Italy) [56] | 0.485 |
| Component | Search Space | |
|---|---|---|
| Min | Max | |
| PV units (kWel) | 0 | 920 |
| Solar collector (kWth) | 0 | 1400 |
| Wind turbine (kWel) | 0 | 500 |
| CHP (micro gas turbine) | 0 | 2000 |
| Auxiliary boiler | 0 | 5000 |
| Battery storage | 0 | 500 |
| Thermal chiller | 0 | 2000 |
| Electric chiller | 0 | 2000 |
| Thermal storage | 0 | 3000 |
| Cold storage | 0 | 3000 |
| Components | Load Type L01 | Load Type L02 | ||||
|---|---|---|---|---|---|---|
| Scenarios | Scenarios | |||||
| 1 | 2 | 3 | 1 | 2 | 3 | |
| Solar PV (kWel) | 0 | 0 | 920 | 0 | 0 | 920 |
| Wind | 0 | 0 | 0 | 0 | 0 | 0 |
| CHP (kWel) | 1000 | 1000 | 800 | 1000 | 800 | 600 |
| Auxiliary boiler (kWth) | 2721 | 2721 | 3130 | 2694 | 2708 | 3002 |
| Battery (kWhel) | 0 | 0 | 20 | 0 | 0 | 0 |
| Electric chiller (kWc) | 1101 | 1101 | 1101 | 1101 | 312 | 613 |
| Thermal chiller (kWc) | 0 | 689 | 519 | 0 | 777 | 542 |
| Cooling ratio (-) | 1 | 1 | 1 | 1 | 0.29 | 0.49 |
| Heat storage (kWhth) | 3000 | 3000 | 3000 | 2992 | 3000 | 3000 |
| Cold storage (kWhc) | 0 | 3000 | 3000 | 0 | 2815 | 3000 |
| Solar heating unit (kWhth) | 0 | 0 | 1400 | 0 | 0 | 1400 |
© 2018 by the authors. Licensee MDPI, Basel, Switzerland. This article is an open access article distributed under the terms and conditions of the Creative Commons Attribution (CC BY) license (http://creativecommons.org/licenses/by/4.0/).
Share and Cite
Ghaem Sigarchian, S.; Malmquist, A.; Martin, V. Design Optimization of a Complex Polygeneration System for a Hospital. Energies 2018, 11, 1071. https://doi.org/10.3390/en11051071
Ghaem Sigarchian S, Malmquist A, Martin V. Design Optimization of a Complex Polygeneration System for a Hospital. Energies. 2018; 11(5):1071. https://doi.org/10.3390/en11051071
Chicago/Turabian StyleGhaem Sigarchian, Sara, Anders Malmquist, and Viktoria Martin. 2018. "Design Optimization of a Complex Polygeneration System for a Hospital" Energies 11, no. 5: 1071. https://doi.org/10.3390/en11051071
APA StyleGhaem Sigarchian, S., Malmquist, A., & Martin, V. (2018). Design Optimization of a Complex Polygeneration System for a Hospital. Energies, 11(5), 1071. https://doi.org/10.3390/en11051071