1. Introduction
With increasing penetration of inverter-based renewable generation, wind power plants (WPPs) will be expected to take on more responsibility for providing ancillary services in order to ensure stable and sustainable operation of future power systems [
1]. Among these services, frequency support, which includes both inertial response and primary frequency control, has a key role in preserving frequency stability of power systems in case of severe imbalances between generation and consumption [
2,
3]. For frequency stability, system inertia is an important property that overcomes the immediate imbalance between generation and consumption while allowing the primary frequency control of conventional power plants to react properly. Due to displacement of conventional power plants, which can contribute inherently to system inertia, total system inertia is expected to decrease in the future [
4]. This decrease might endanger frequency stability due to reduced stability margin and high frequency sensitivity [
5]. Therefore, synthetic inertial response (SIR) from WPPs can be a crucial support for power systems with large shares of wind power.
SIR from WPPs refers to the active power contribution that can be temporarily released by variable speed wind turbines (VSWTs) in WPPs equipped with an appropriate control by exploiting the stored kinetic energy in rotating masses of VSWTs [
3]. In the literature and the grid codes, SIR is defined using varied terminology, such as synthetic inertia, emulated inertia, fast frequency response, or enhanced frequency control [
6,
7,
8,
9]. With appropriate SIR controllers, WPPs can contribute to system inertia during frequency deviations before the primary frequency control allocates the frequency containment reserve (FCR). Consequently, in this paper SIR is particularly defined to represent a short-term, temporary (i.e., duration less than 30 s), active power increase following a contingency event, and accordingly, it can be dependent on a predefined value, frequency deviation, or rate of change of frequency (
RoCoF).
Over the past 20 years, SIR of WPPs has been thoroughly investigated in academia and industry [
10]. In these investigations, the developed approaches can be categorized according to the control methodology and the source of power allocation. There are two control methodologies, which consider frequency dependency and fixed response. The frequency-dependent methodology has been realized by implementing individual or combinations of proportional and derivative controls that determine the additional power reference value for a certain amount of time [
7]. This type of control emulates the inertial response by the derivative control while the proportional control is employed for fast frequency control provision similar to the primary frequency control. In the second control methodology, the active power reference value is defined as a percentage of the available or installed capacity of the VSWT prior to activation [
3]. In this predefined power provision, the active power reference is not dependent on the frequency deviation and can be realized as an open-loop response. For both methodologies, the active power is released by a triggering mechanism that detects the frequency excursion and then enables the additional active power reference to the active power control of the VSWT. Furthermore, besides the control methodology and the triggering mechanism, the required active power for SIR can be extracted from VSWTs by two approaches: either enabling overproduction of VSWT [
3,
7] or employing the reserve active power [
3,
11]. In the first approach, the VSWT operates at the available power and the additional power is released by operating the VSWT in overproduction mode [
3]. This approach does not require allocation of any active power reserve. However, for below-rated wind speeds, after SIR, a recovery period can occur due to the reduction of rotational speed in the VSWT. There is a challenge in how to extract the optimum energy for the provision of SIR considering this recovery period [
12]. For above-rated wind speeds, the additional active power can be extracted from excess wind power by pitch control, causing generator and converter overload. In the second approach, the active power reference value, which is determined by the control methodology, is supplied from the reserve power. The disadvantage of this approach is that the VSWT should be operated in de-loaded mode, which increases the cost of the operation.
This paper aims to present and analyze optimization of SIR from WPPs by employing the frequency-dependent control methodology with the overproduction mode approach, such as releasing the stored kinetic energy of VSWTs at below-rated wind speeds and extracting the excess wind power at above-rated wind speeds. With this focus, SIR is dependent on both wind speed conditions and wind power penetration level [
3,
13]. Therefore, wind speeds are varied in the present study, from a medium (6 m/s) to a high (14 m/s) wind speed region considering a general wind speed distribution. According to [
13], special attention should be given to overcoming challenges such as second frequency dips in system frequency due to these dependencies. Therefore, distinct and careful tuning of control parameters under different wind speed and power system conditions (i.e., various wind power penetration levels) is needed to support frequency stability during large frequency deviations.
Previous studies [
3,
7,
8,
11] focused on control implementation of SIR without specifically conducting tuning studies for the proposed controllers considering both the dynamics of VSWTs and the frequency control performance of power systems. In [
14], a heuristic optimization approach, the genetic algorithm (GA), was used to tune the parameters of SIR from all WPPs in the power system as an aggregated optimized response. However, the dynamics of the VSWT were not specifically taken into account due to the system-level approach with a focus on geographically distributed WPPs. In [
15], a predefined power provision for the SIR was optimized using the particle swarm optimization (PSO) method considering both the frequency dynamics of the power system, as in [
14], and the dynamics of the VSWT. However, without employing the frequency-dependent control during frequency deviation, the results of the tuning approach in [
15] might be limited and difficult to apply to various power system conditions and wind power penetration levels. Therefore, there is a clear need for an optimization approach to identify the SIR requirements of a power system considering the limitations of VSWTs, power system frequency control dynamics, and different wind speed conditions.
The objective of this study is to investigate and optimize SIR of WPPs in power systems with large shares of wind power considering the limitations of VSWTs and the frequency control dynamics of power systems. By employing different wind speeds, the proposed optimization study aims to analyze the capability of WPPs to provide SIR support and to identify SIR tuning considerations for the given power system. The GA is employed as the optimization method to improve the frequency nadir, the second frequency dip, and the time to reach the quasi–steady-state frequency by tuning the SIR parameters. The contribution of this paper is further enhanced by conducting sensitivity analyses of the optimal SIR parameters under different contingencies and wind power penetration levels. Such sensitivity analyses have not been considered in previous studies.
The paper is organized as follows:
Section 2 briefly describes a benchmark power system model with an aggregated WPP model. In
Section 3, an optimization study for SIR is presented and performed by a set of simulations for various wind speeds at high wind power penetration level. Sensitivity analyses of SIR for different contingencies and wind power penetration levels are introduced in
Section 4. Accordingly,
Section 5 discusses the optimization results and related implications from the perspective of previous studies and current grid codes. Finally, conclusive remarks are reported in
Section 6, where the track for future work regarding SIR from WPPs is suggested.
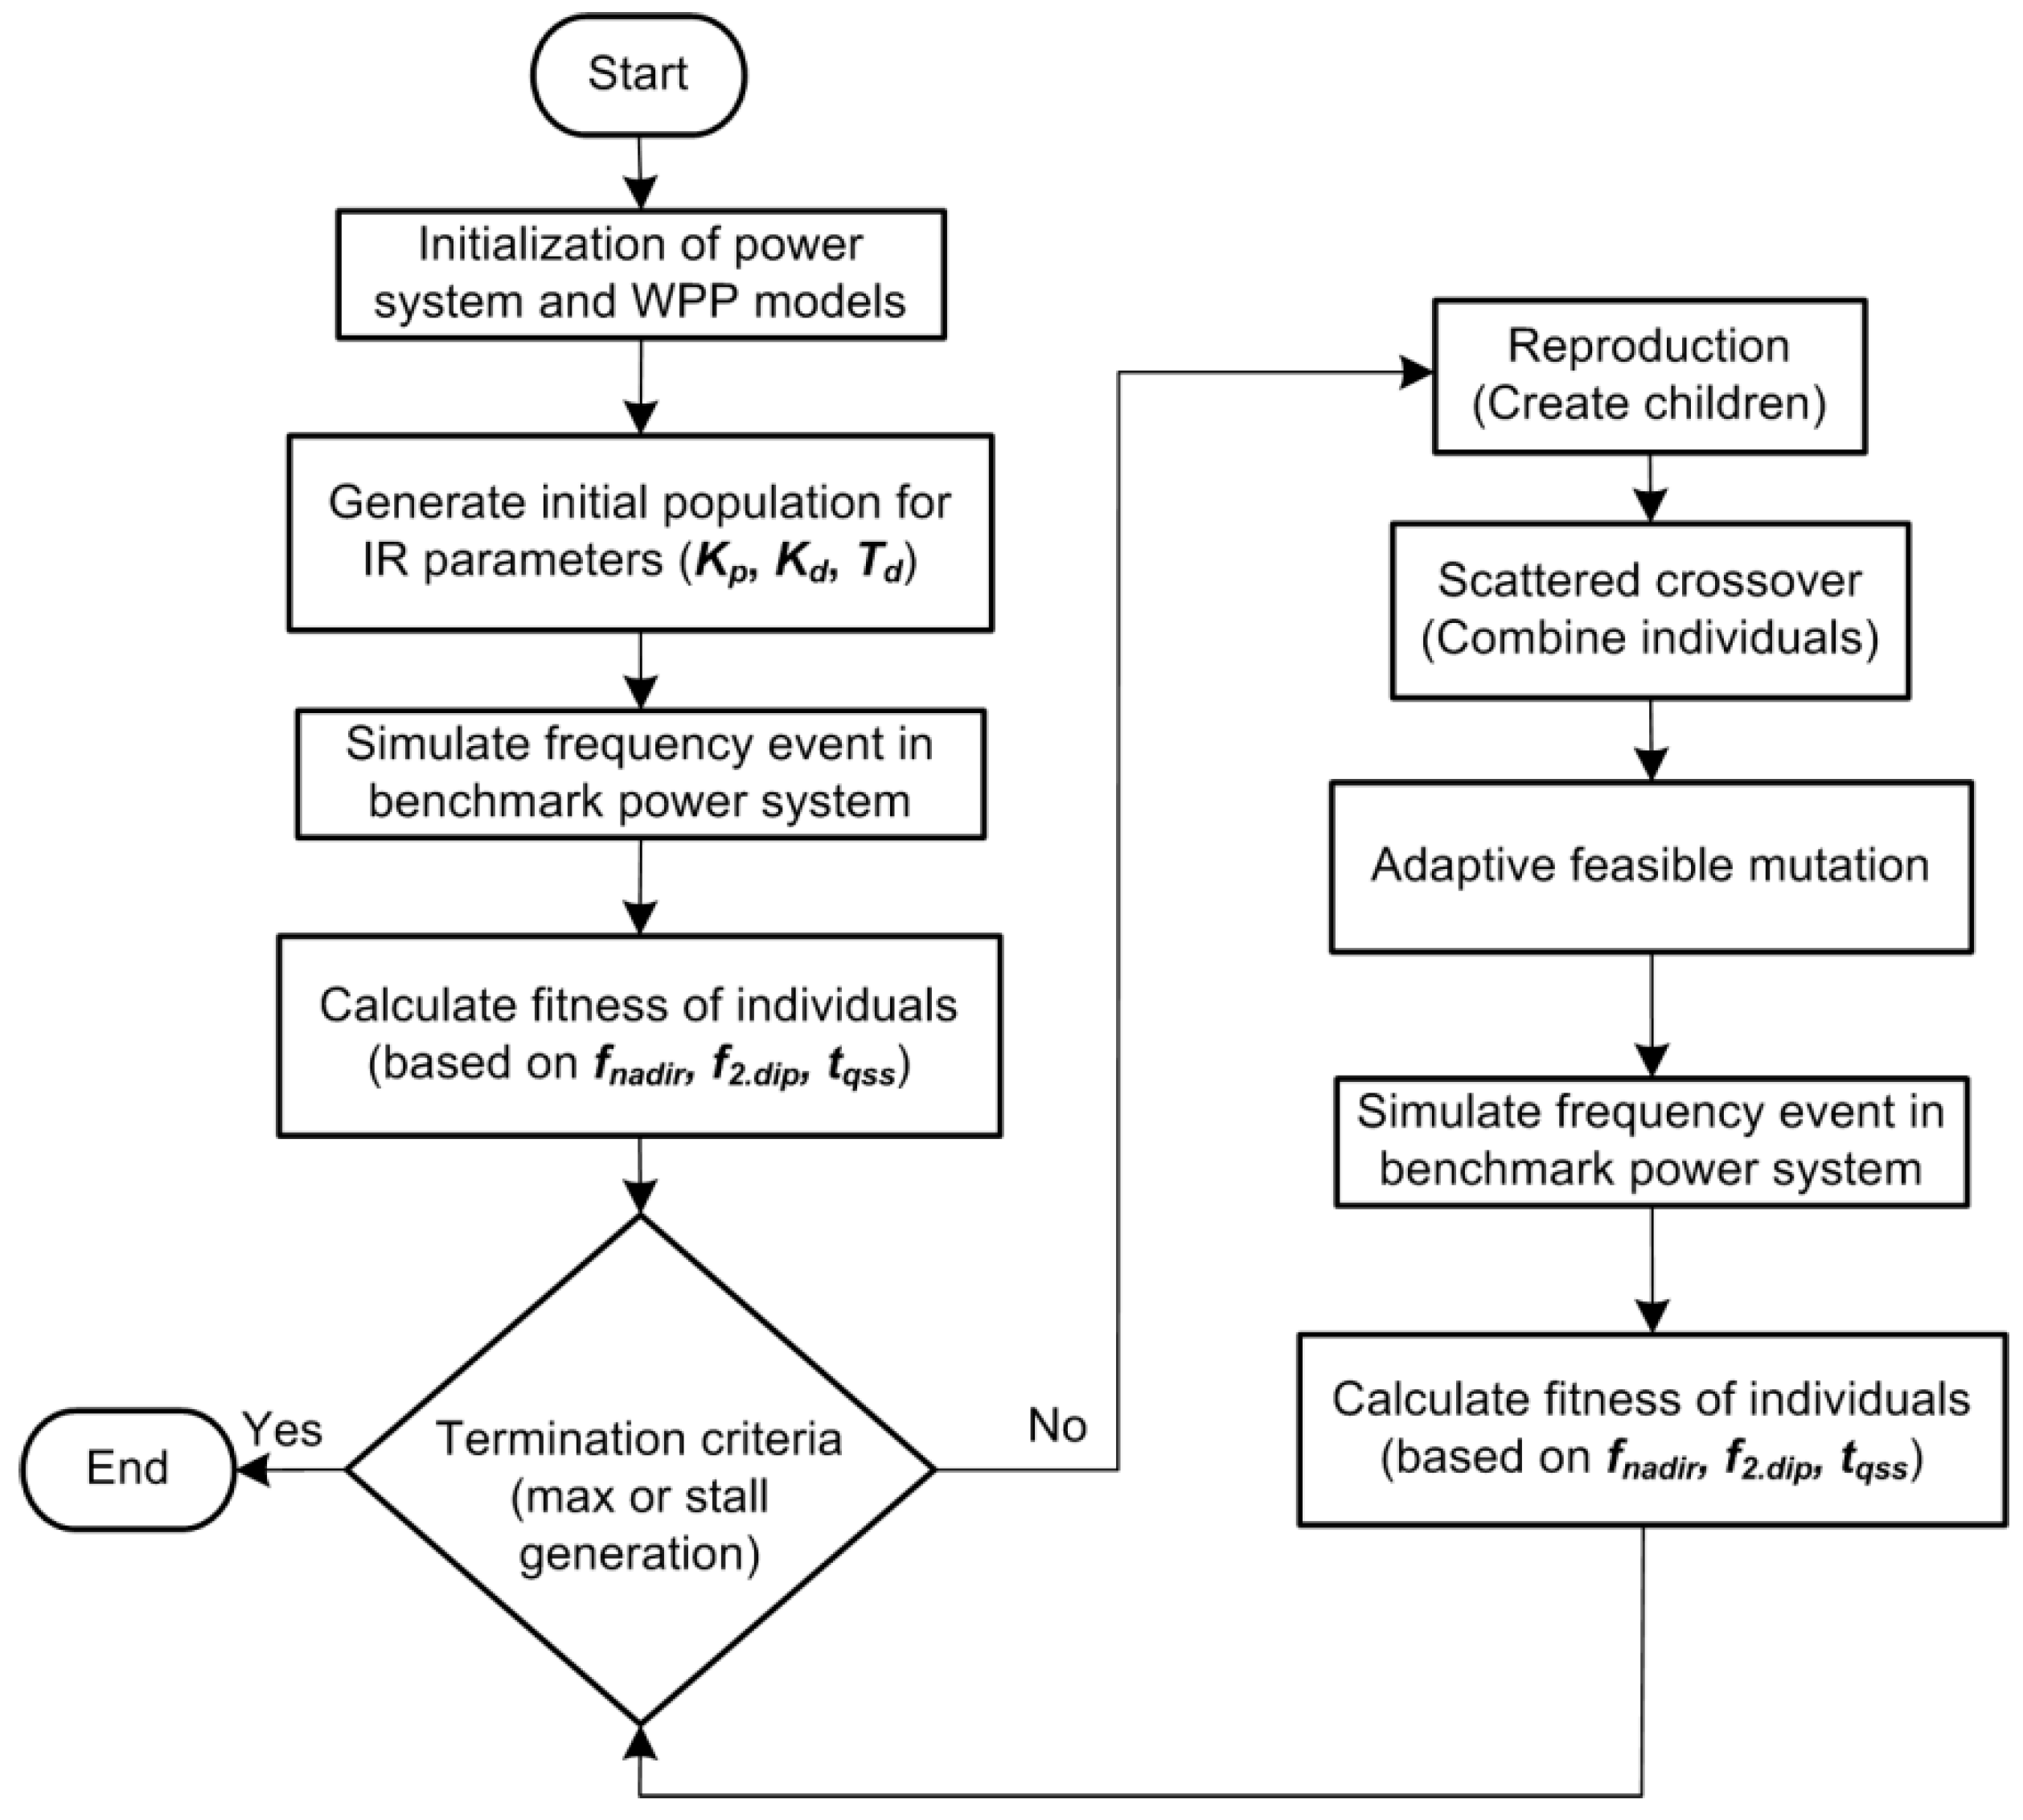
3. Optimization of Synthetic Inertial Response
In this section, an optimization methodology for SIR using the GA is proposed for the generic benchmark model. Using this benchmark model and focusing on the high wind power penetration level, optimization of SIR from WPPs is carried out at different wind speeds to represent the capability of WPPs with the impact on the frequency response of the power system. The proposed methodology, including selection and a flowchart of the GA, is described with the statement of the optimization problem. The objective function of the problem is formulated depending on frequency control dynamics, taking into account limitations of VSWTs in the generic WPP model. Accordingly, the impact of decision variables specified as parameters of SIR is briefly discussed. Following the description of the methodology, the optimization results are presented for different wind speeds at 50% wind power penetration. It should be noted that the optimal parameter tuning task is nontrivial due to nonlinearities in the WPP and power system models.
3.1. Problem Statement and Optimization Methodology
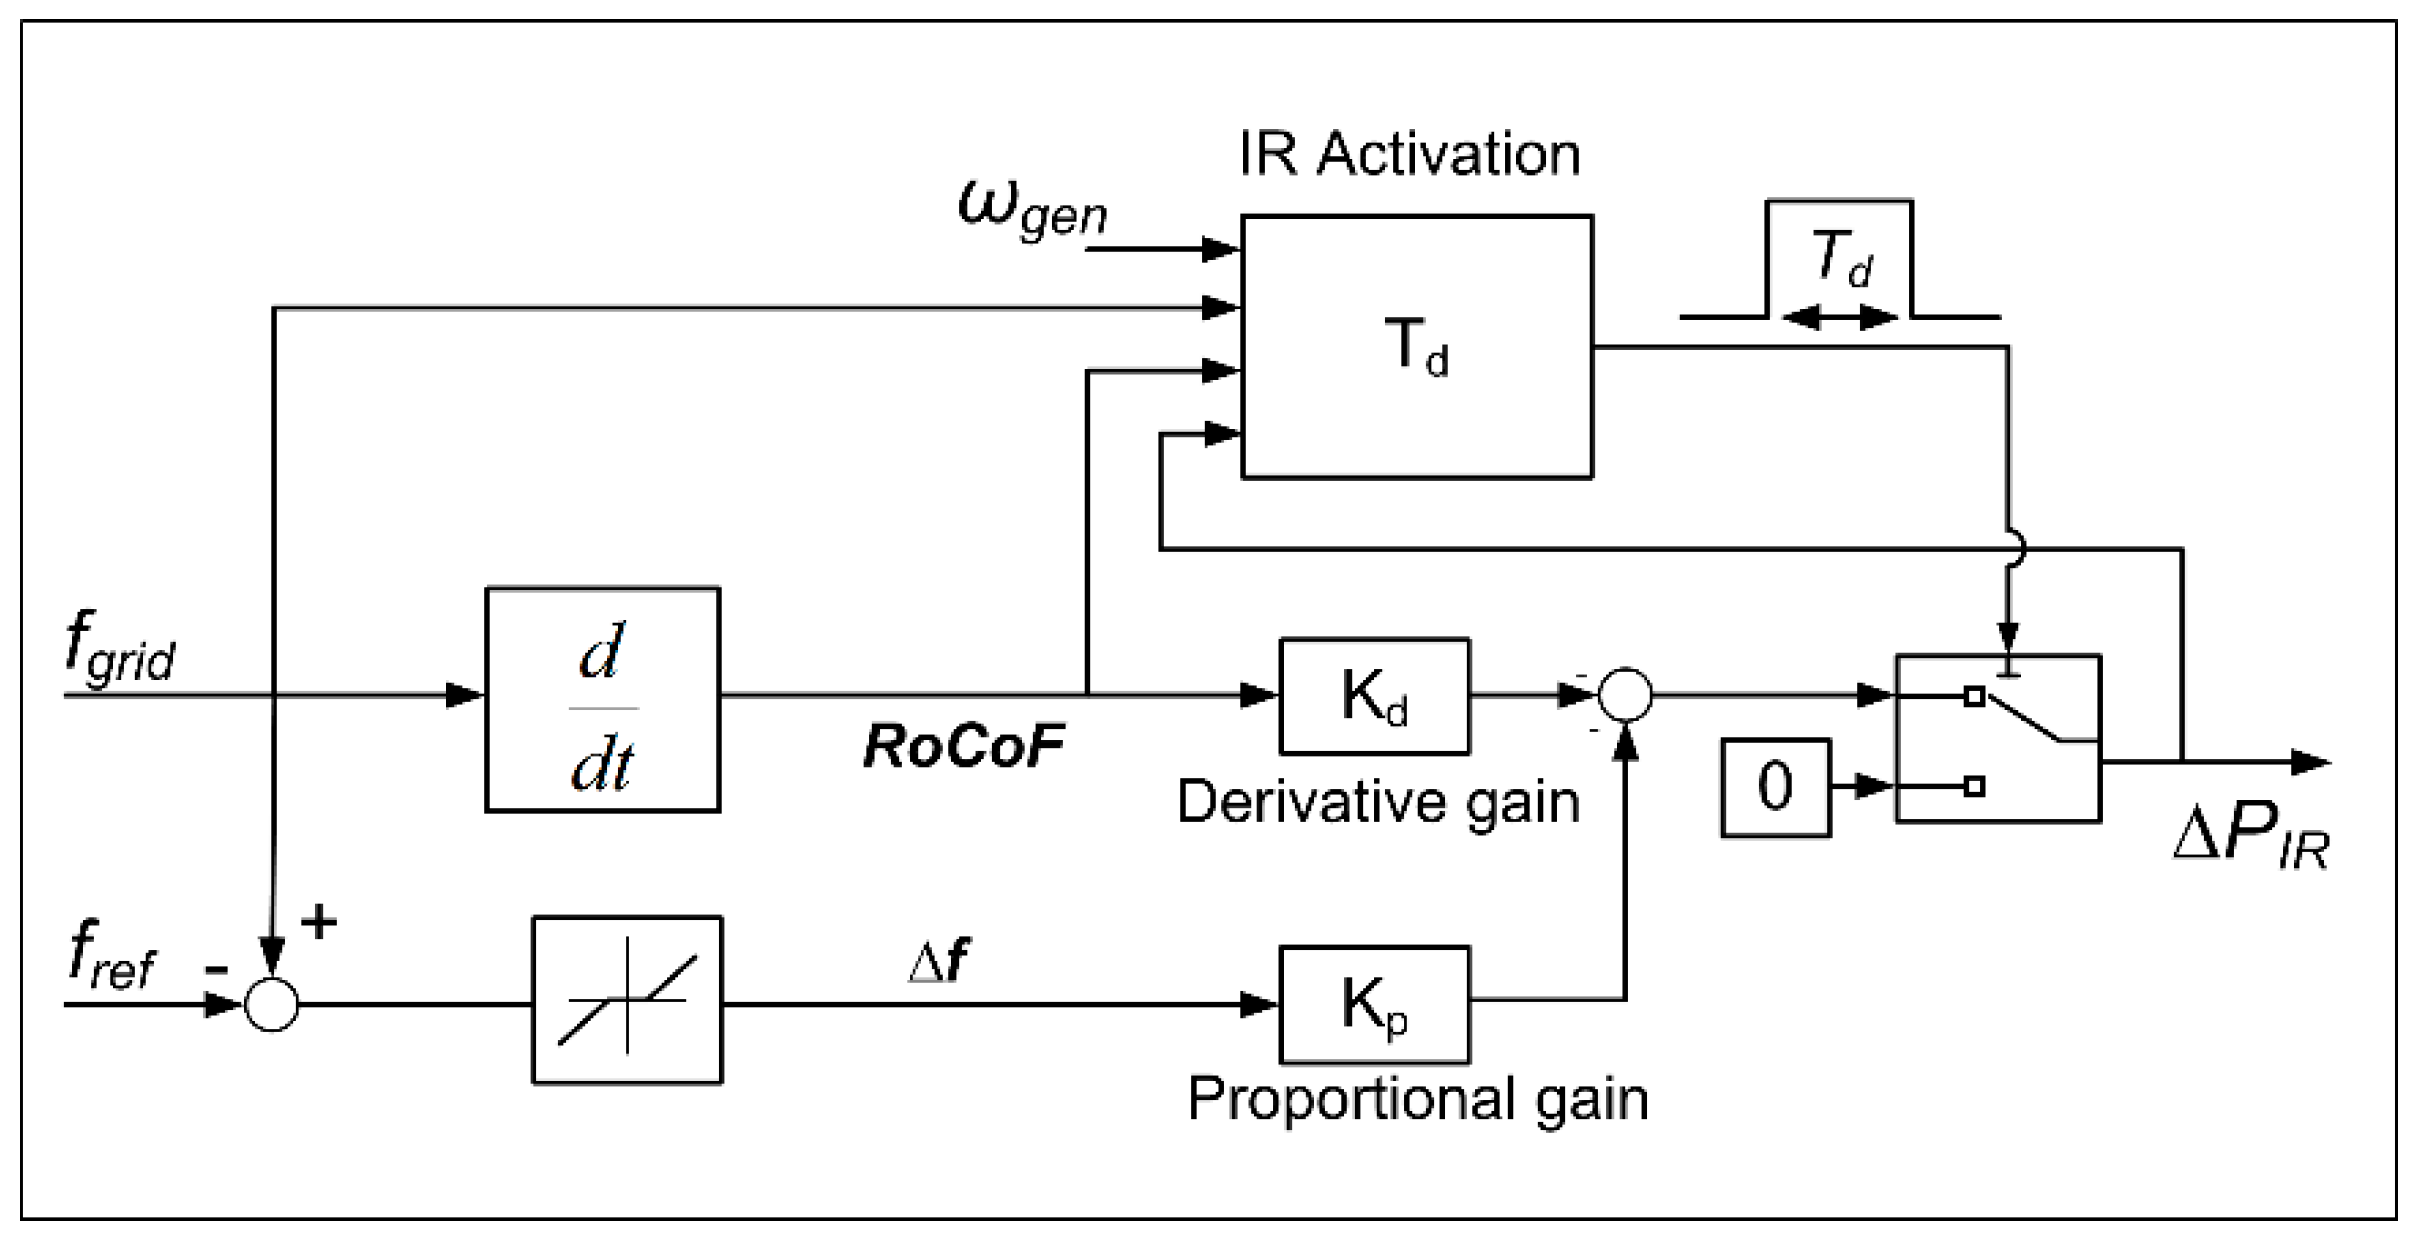
As mentioned above, the SIR approach is dependent on the frequency measurements (∆
f and
RoCoF), and during activation of the response, the generated active power set point (∆
PIR in
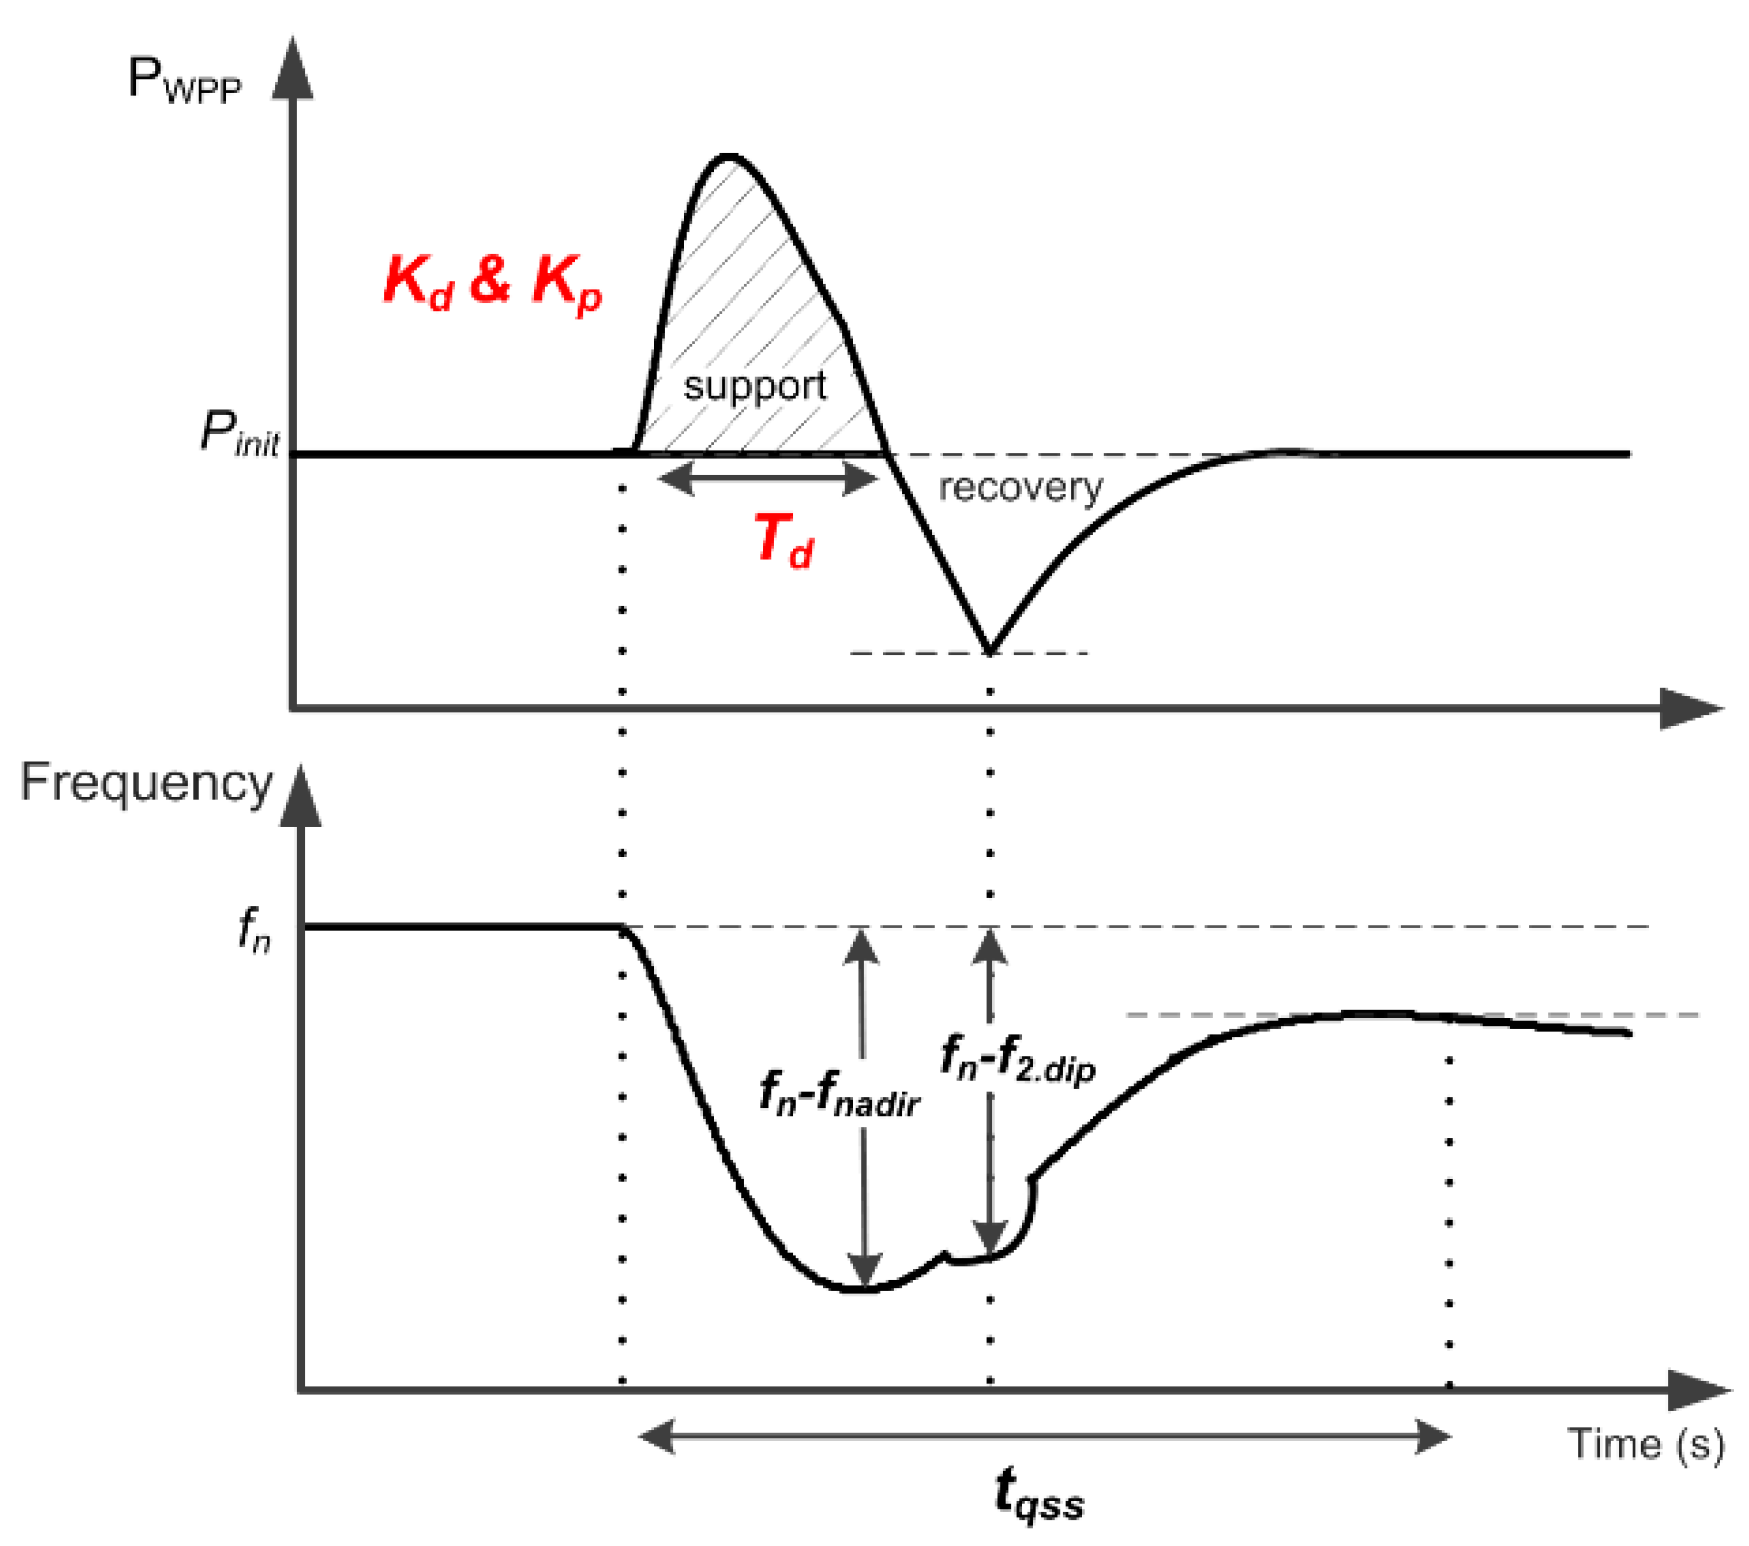
Figure 3) is sent to the active power control. Released active power supports the power system and improves the frequency performance during period
Td (
Figure 4). During
Td, the requested electrical power by SIR is higher than the aerodynamic power, and thus the rotor speed decelerates. After the support is completed, the electrical power is reduced to a nonoptimal value by maximum power point tracking (MPPT) control. With this reduced electrical power value, the rotor speed accelerates and the active power reaches the optimum value (i.e., initial point before SIR) after some time. This recovery period might create another dip in the frequency profile of the power system, compromising its security and making it vulnerable to the frequency instability. The recovery period and possible impact on the frequency response are illustrated in
Figure 4. Therefore, tuning of SIR parameters should be carefully performed in order to limit the initial power system
RoCoF and the frequency nadir (
fnadir) without causing a second frequency dip (
f2.dip). Moreover, to improve the overall power system frequency response, time to reach the quasi–steady-state frequency (
tqss) is included in the problem statement. For this problem statement, traditional linear optimization methods are not suitable, since the response is highly nonlinear, as evident from
Figure 4. It should also be emphasized that these nonlinearities are even more difficult to model due to their dependencies on different system conditions.
The GA is a well-established heuristic method in the literature based on the mechanism of natural selection to constitute search and optimization procedures [
24,
25]. It can produce high-quality solutions because it is independent of the choice of initial configuration of the problem. The optimal solution is sought from a population of solutions using a random process. A new generation is created from the current population by applying three operators: reproduction, crossover, and mutation. The GA has the additional advantages of managing the aforementioned nonlinearities and providing the global optimum. The GA is selected to effectively solve the present optimization problem, since the benchmark power system model is nonlinear and the problem statement is multiobjective and dynamic. Furthermore, the GA has the advantage of being able to handle different WPP and power system models. The flow chart of the GA employed for this optimization problem is presented in
Figure 5.
In order to solve this multiobjective and dynamic optimization problem, the goal programming approach is employed, where the multiobjective problem is converted to a single-objective problem with the weighted aggregation technique [
24]. In the goal programming approach, the objective function is a linear combination of the objectives (
fnadir,
f2.dip, and
tqss) with weighting factors. Accordingly, the approach aims to minimize each objective according to goal set values. In this study, the set values are defined according to grid code requirements and empirical assumptions. The formulation of the objective function is given in Equation (1). It can be seen in the proposed objective function that the first set value for the frequency nadir is 0.8 Hz [
2], the second set value is 0.45 Hz (quasi–steady-state frequency value corresponding released FCR) for the second frequency dip, and the third set value is selected as 30 s [
2] for the time to reach quasi–steady-state frequency. Moreover, the weighting factor (
αi) is selected as 0.33, assuming equal priority in the frequency response of the benchmark power system model.
With these three objectives, a “fish hook” shape of the frequency response (
Figure 4) can be characterized depending on total inertia, governor, prime mover dynamics, and droop value of the power system. Therefore, the optimization tries to minimize the error between the designed and actual frequency response. In practice, transmission system operators (TSOs) should define these objectives and their prespecified values. This methodology is designed to be as generic as possible so that it can be applied to any power system with any type of WPP model. The selected weighting factors and goal set values can be rearranged based on the TSO’s performance criteria or the characteristics of the power system under investigation. The decision variables,
Kp,
Kd, and
Td, have an impact on each objective.
Kp can directly influence the frequency nadir and time to reach the quasi–steady-state frequency. Similarly,
Kd can limit initial
RoCoF and improve the frequency nadir. However, high
Kd and
Kp values can create a second frequency dip due to the recovery period and increase the settling time of the frequency response (i.e., time to reach the quasi-steady state,
tqss). Finally,
Td has the potential to affect all of the objectives. After defining the objective function, boundaries for decision variables are included in the GA to not mechanically stress the VSWT beyond permissible limits [
3,
26].
3.2. Optimization Results
As mentioned previously, 50% wind power penetration is the focus for the optimization study with different wind speeds. With this consideration of wind speed, the capability of WPPs can be revealed in terms of SIR parameters and improvement of system frequency performance. The wind speed is varied between 6 m/s and 14 m/s. Medium-wind cases (6 m/s–8 m/s) can be assumed as “low wind–low load” situations and corresponding high-wind cases (12 m/s–14 m/s) can be considered “high wind–low load” situations. These assumptions are conservative and accepted as boundaries of power system operation in order to highlight the needs of power systems regarding wind speed conditions.
Optimization results as optimal SIR parameters for different wind speeds are given in
Table 2. According to these results, three operation ranges can be seen for the optimized SIR. High wind speed conditions (i.e., above rated wind speed) such as 12 m/s to 14 m/s have the highest capability to minimize the objective function. At medium wind speed range (6 m/s–8 m/s), the optimized response can also improve the objectives; however, the recovery period limits SIR support. Consequently, an operation region close to the rated wind speed (9 m/s–11 m/s) cannot contribute sufficient SIR compared to the other regions. The reason is that VSWT operates at the linear region of the MPPT curve for these wind speeds. Thus, the deceleration of rotor speed can immediately reduce the active power reference, leading to a nonoptimal operation. This conclusion might be important for TSOs and WPP developers in designing and coordinating SIR.
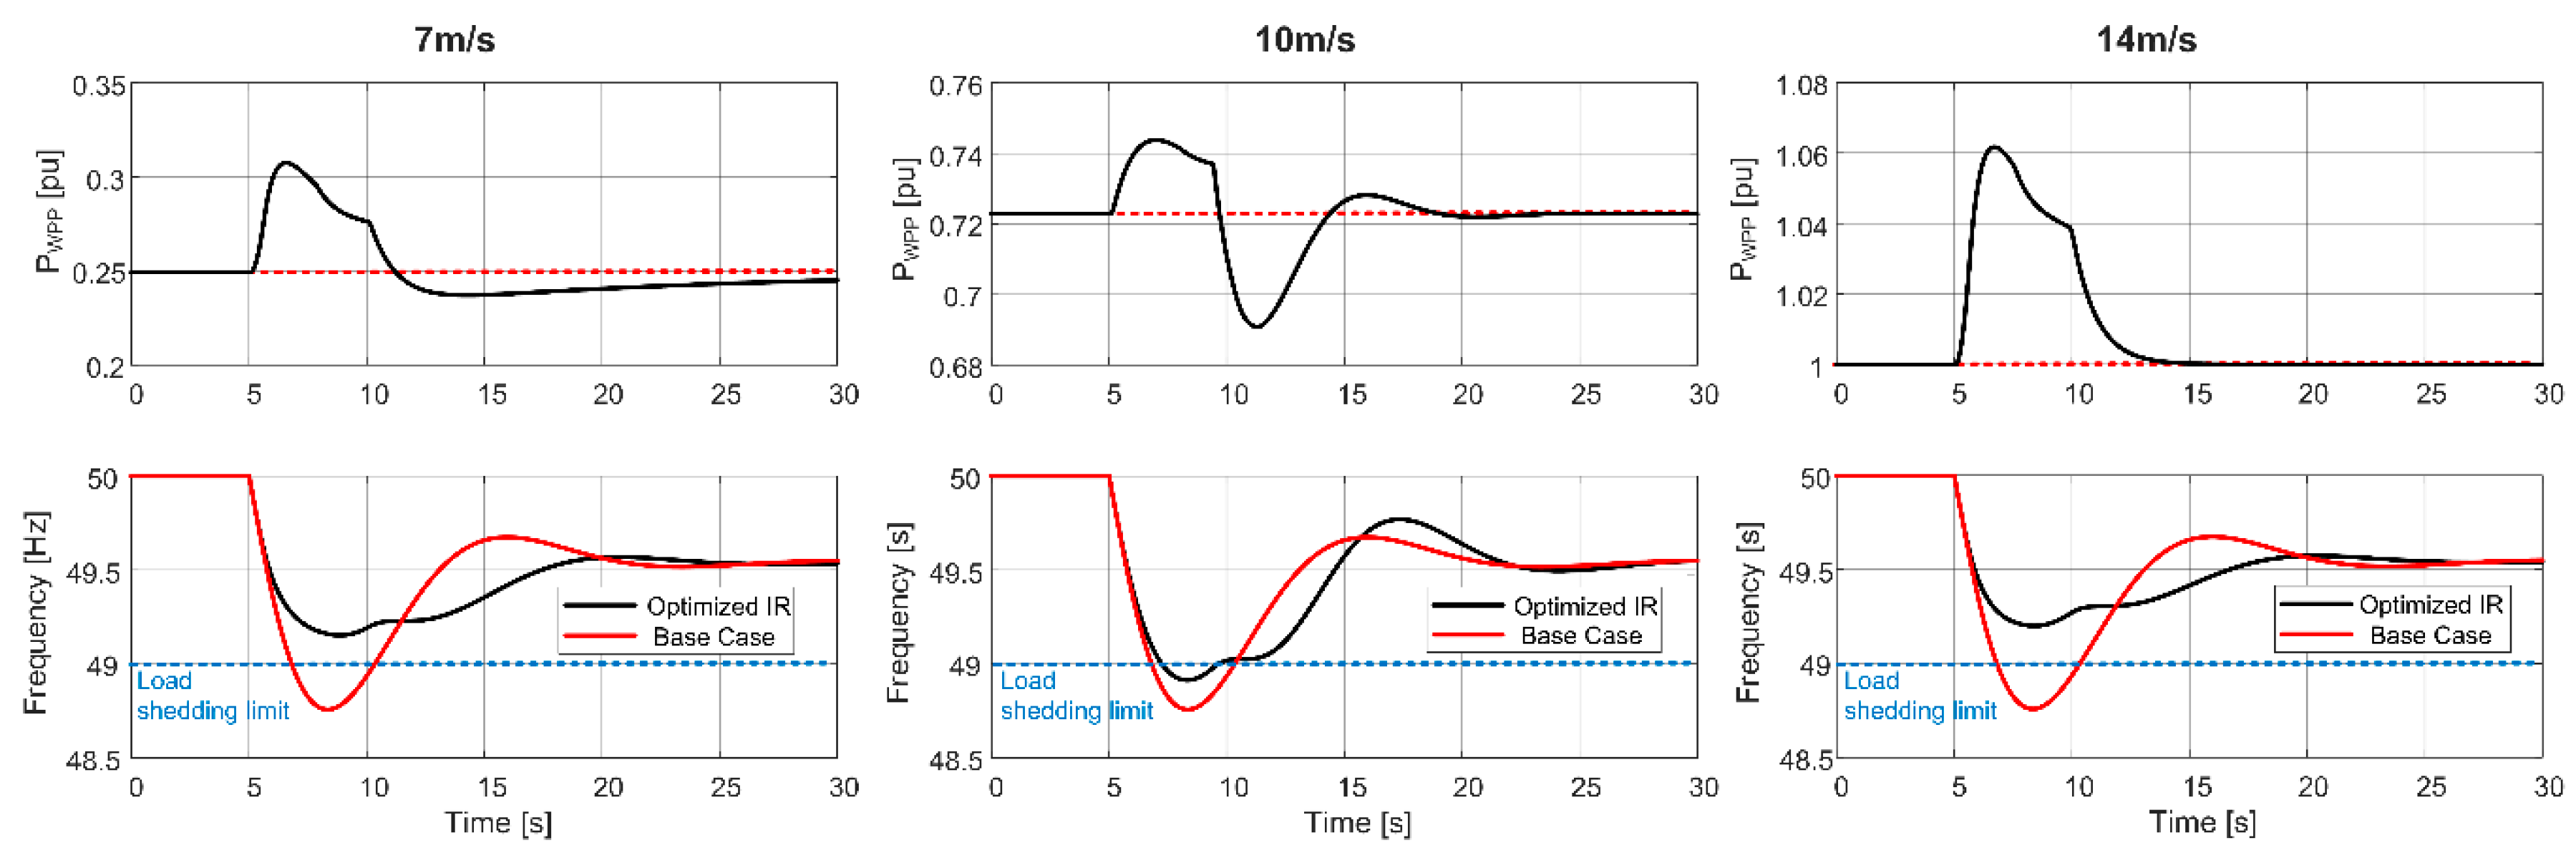
The optimal parameter sets for medium and high wind speed regions are very similar. The simulation results based on these optimal parameter sets are presented in
Figure 6 for 7 m/s, 10 m/s, and 14 m/s wind speeds. These representative wind speeds are selected in order to compare the three regions. The base case in
Figure 6 represents the power system frequency response without SIR at 50% wind power penetration. The behavior of WPPs after approximately 5 s creates a second frequency dip in both medium and high wind speed cases for different reasons. In the medium wind speed case, the recovery period causes a drop in active power output. However, in the high wind speed case, due to the high
Kp parameter, SIR contribution indicates high active power output around the frequency nadir. Therefore, the reason is not the existence of the recovery period, but the drop in active power output of the WPP after the frequency nadir. Actually, the ramp-down rate of this drop is the main reason for the second frequency dip. As mentioned earlier, the operating region close to the rated wind speed cannot provide sufficient support to prevent load-shedding action at 50% wind power penetration (
Figure 6, 10 m/s case).
It is also worth noting that the optimized Td value is around 5 s for all wind speed conditions. Therefore, finalizing the SIR around 3 s after the frequency nadir is reasonable, in order to not cause a second frequency dip. Moreover, if the objective function is modified with different weighting factors and goal set values, the system frequency response might change; however, the correlation between different wind speeds and SIR support will remain similar.
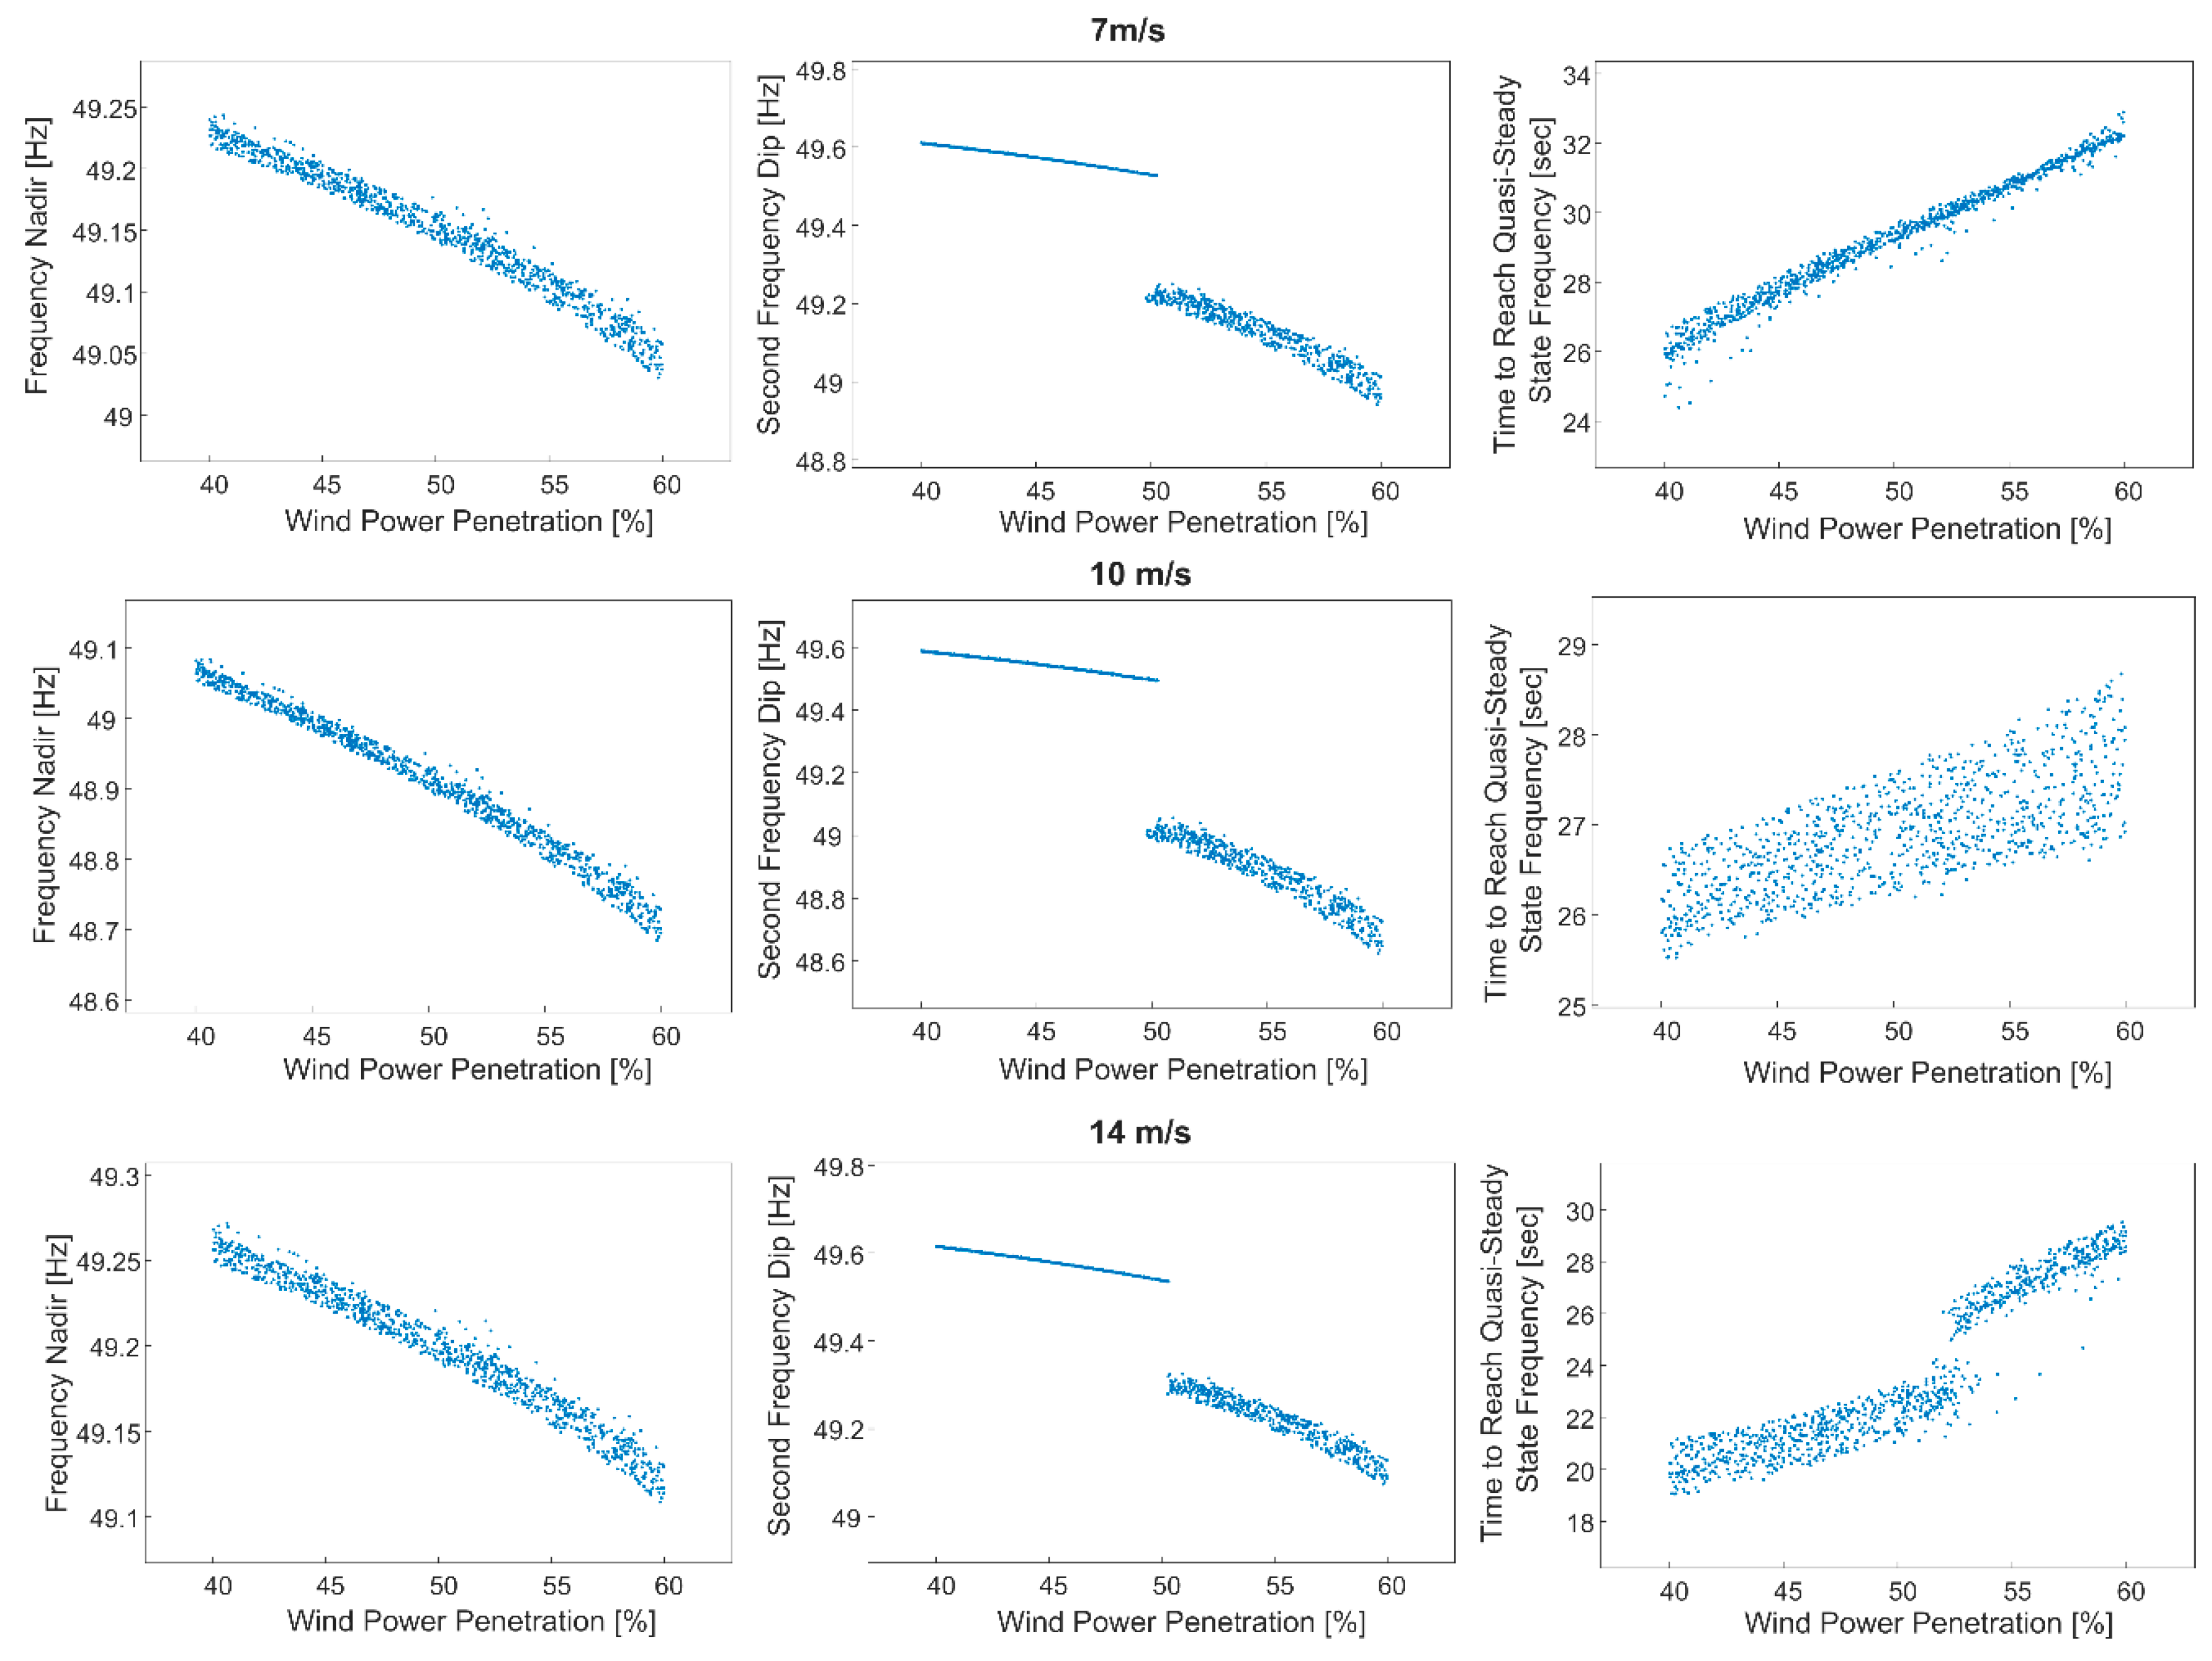
The proposed optimization method can be applied to various power system operation states, such as load conditions (e.g., high/low load) and wind power penetration levels based on the design and planning considerations of TSOs. In the next section, the optimized SIR parameters are employed in sensitivity analyses regarding variation of the contingency (i.e., less than largest infeed loss) and wind power penetration level. The objective of these sensitivity analyses is to assess the impact of optimal SIR parameters, obtained at 50% wind power penetration, on the power system frequency response under different operation situations. Consequently, general conclusions can be made for the SIR parameters and the support capability of WPPs regarding the frequency control performance of the power system.
As indicated in
Section 3.1, the optimization problem for the selection of SIR parameters is nonlinear, dynamic, and multiobjective. When dealing with such a problem, the notion of optimality changes. Instead of finding the “global optimum,” it is aimed at finding the best solution available and acceptable for TSOs considering good compromises among the objectives, as presented in
Table 2. Alternatively, depending on the power system and wind power plant model, linear and nonlinear conventional optimization methods cannot search the solution space like heuristic optimization methods can. In order to employ conventional methods, all the implemented models should be linearized, which may lead to a loss of accuracy and performance of the responses. The choice of heuristic method may only impact the accuracy and computational performance of the optimization without a substantial difference in SIR support. Although it is not within the scope of this paper to compare different optimization methods, in order to validate this statement, particle swarm optimization (PSO) is implemented and simulated with the same objective function. Consequently, the results are very close to those of the GA in
Table 2.
5. Discussion
The proposed optimization methodology is generic and can be applied to any kind of power system with various wind power penetration levels. With flexible implementation of the objective function, the optimal parameters and active power profile of SIR can be explored depending on the TSO’s requirements. In order to enable SIR from WPPs, these requirements and performance indices are important concerns at the design and planning stage for the frequency response of power systems with large shares of wind power. In the present grid codes and guidance documents from TSOs, these performance indices and general requirements are not clearly stated. Besides, frequency measurement and calculation of RoCoF should be addressed as part of SIR design specifications, such as measurement delay, accuracy, and generic control structure.
Based on the assumptions mentioned in
Section 2, the active power control does not affect the operation of VSWTs’ voltage/reactive power control, DC-link voltage control, and inner current control during SIR. The specified limitations in the implemented WPP model include current and active power control performance. Based on the VSWT’s specifications, an investigation study can be performed to analyze the DC capacitor capacity and voltage/reactive power control capability while SIR is active. Furthermore, a detailed WPP model can be developed, including a wake model to represent realistic wind speed inputs to each VSWT. These future studies are a kind of impact assessment and refinement of SIR capability inside WPPs.
It is seen in the optimization results that the ramp-down rate of SIR and the amount of active power reduction have an impact on the frequency response, especially the second frequency dip. This interesting finding appears to contradict the statement that only the recovery period is responsible for this frequency dip. TSOs can define ranges for ramp-down rates of SIR based on the primary frequency control performance of conventional power plants in their system.
During the sensitivity analysis, it was observed that the generation mix and total system inertia had an impact on the frequency response with nonoptimal SIR parameters. Future scenarios with high wind power penetration levels should be determined and considered carefully, if SIR from WPPs will be required in these scenarios. In these scenarios, key factors such as droop value, generic governor and prime mover characteristics, and total inertia can be used to properly tune the SIR parameters or at least decide on a general required profile. Bearing in mind the variability of wind power in future scenarios, the variable SIR issue might be discussed with wind speed/power forecast by TSOs. Accordingly, contingencies leading to large frequency excursions should also be addressed in detail for interconnected power systems, split situations in interconnected power systems, and islanded power systems. According to the sensitivity analysis results, an optimization study can be conducted for the highest wind power penetration level of the power system under investigation. A thousand cases were examined to verify this conclusion in the present study. However, in these cases, the technology of conventional power plants and the parameter settings of the governor controllers were not changed, only the generation mix and total inertia varied. In order to make general conclusions and identify specific requirements, future scenarios with possible contingencies can be described in detail for sustainable SIR from WPPs.
6. Conclusions
In this paper, optimization of synthetic inertial response from wind power plants considering variable speed wind turbine limitations and power system frequency response dynamics is described and investigated in detail. Frequency response of a power system following a frequency contingency event is improved by optimizing synthetic inertial response parameters using the genetic algorithm. In the optimization approach, an objective function is proposed considering frequency nadir, second frequency dip, and time to reach quasi–steady-state frequency. Accordingly, the decision variables are selected as the derivative and proportional gain with the response duration of the synthetic inertial response. The optimization study was performed at 50% wind power penetration for different wind speeds, covering below- and above-rated wind speed regions. Optimization results show that synthetic inertia from wind power plants can support the frequency response of power systems to avoid load shedding for reduced inertia situations. The support capability is dependent on wind speed, which can be categorized into three regions: medium, close to rated, and above rated wind speed. These regions are considered to define requirements for each wind power plant and coordinate different wind power plants. Although the frequency nadir can be improved with sufficient synthetic inertial response support, a second frequency dip might occur or the time to reach quasi–steady-state frequency might increase according to the operating conditions of wind power plants. Sensitivity analyses provide insight into the assessment of selected optimal parameters at different contingencies and wind power penetration levels. According to the sensitivity analyses results, the selected parameters can be employed below 50% wind power penetration for contingencies less than the largest infeed loss without any drawbacks.
This work can be used as a starting point in the design and planning of synthetic inertial response provision of wind power plants for transmission system operators and wind power plant developers. Since the focus in this article is on the technical system-level offline analysis of synthetic inertial response, studies regarding the economics and impact of synthetic inertial response on VSWTs should be performed.


