Article

Multi-Saliency Aggregation-Based Approach for Insulator Flashover Fault Detection Using Aerial Images

1
Department of Automation, North China Electric Power University, Baoding 071003, China
2
College of Electrical Engineering, Zhejiang University, Hangzhou 310027, China
*
Author to whom correspondence should be addressed.
Energies 2018, 11(2), 340; https://doi.org/10.3390/en11020340
Submission received: 3 January 2018 / Revised: 31 January 2018 / Accepted: 31 January 2018 / Published: 2 February 2018
(This article belongs to the Section F: Electrical Engineering)

Abstract

:
Accurate and timely detection of insulator flashover on power transmission lines is of paramount importance to power utilities. Most available solutions mainly focus on the exploitation of the flashover mechanism or the discharge area detection, rather than the identification of a damaged area due to flashovers using captured aerial images. To this end, this paper proposes a multi-saliency aggregation-based porcelain insulator flashover fault detection approach. The target area of the insulator is determined using the Faster-Pixelwise Image Saliency by Aggregating (F-PISA) algorithm based on the color and structural features. The color model can be established based on the color feature of the damaged areas on the insulator surface, and hence the damaged area can be identified. Based on the information obtained above, the contour information can be extracted. With the preceding process, the fault location can be confirmed with a good accuracy. The performance of the proposed detection approach is assessed through a comparative study with other available solutions. The numerical result demonstrates that the suggested solution can detect the insulator flashover with improved performance in terms of the average detection rate and average efficient detection rate. Additional analysis is carried out to evaluate its robustness and real-time performance, which confirms its deployment feasibility in practice.

1. Introduction

As one of the electrical insulation and mechanical support components of electric power transmission lines, the insulators are of great importance to ensure the reliable and safe operation of electric power systems. However, the insulators are considered fault-prone due to the fact that a large number of overhead transmission lines are located in the wilderness, and the line corridor passes through a variety of climate zones with the insulators exposed to harsh weather conditions. In particular, flashover (an electric discharge over or around the surface of an insulator) often occurs. The flashover can directly affect the performance of insulators, and hence can cause significant power loss, or even lead to power blackout spanning over a large geographical area. Based on such recognition, the characteristics of insulator flashover need to be better understood, and the accurate detection of flashovers on insulators needs to be appropriately addressed to effectively reduce the operational risks of power system assets [1,2,3].
Insulator flashover is generally considered a normal fault form in power transmission infrastructure. Upon the occurrence of flashover, the insulator voltage across the electrodes drops rapidly to zero or nearly zero. The spark or electric arc in the flashover channel causes the partial overheating of the insulation surface, and further leads to carbonization, decoloration, tracking, and damages to the surface of insulators. As a result, safe power transmission cannot be guaranteed if the damaged areas of insulators cannot be detected and replaced in a timely manner [4,5]. However, the accurate and timely detection and location of flashover faults on insulators is non-trivial. In recent years, much research effort has been made to address the challenge of insulator flashover detection from different aspects. Currently, the available solutions and analysis of insulator flashover fault are mainly focused on the area of flashover mechanism and discharge detection, and few studies have been carried out for insulator flashover detection based on visual aerial images. In [6,7,8,9], the feature extraction of the discharge area using ultraviolet images and the corona ultraviolet image segmentation were exploited. However, this solution was observed with an unsatisfactory performance under certain conditions due to a limited hardware processing capability. In [10,11],the authors adopted the Russian Film-6 ultraviolet imager to capture the insulator flashover images, which provided an intuitive benchmark for the analysis of insulator flashover phenomenal characteristics. In [12], the insulator flashover image was processed by the use of morphology and the discharge channel could be extracted, but the detection method of insulator flashover fault was not explicitly addressed. In [13], three types of fault detection methods, i.e., the ultraviolet image-based method, infrared image-based method, and the electric field method, for insulator flashover detection were evaluated and analyzed. The result from this study indicated that the detection method based on ultraviolet images can efficiently identify the fault introduced by the discharge of composite insulators; the infrared images can be used to detect the heat fault, but can hardly identify the short-term insulation flashover faults; and finally, the electric field method can detect serious short-circuit faults on the insulators well, but cannot accurately locate the damaged area.
To the authors’ best knowledge, few studies have been carried out on the detection of surface damage of insulators due to flashovers, e.g., leakage tracking and enamel flaking. To this end, this paper exploited a fault detection method for the flashover of outdoor porcelain insulators using a multi-saliency aggregation technique based on aerial images. The idea behind the proposed solution is depicted in Figure 1. The main technical contributions made in this work can be summarized as follows: (1) this paper presents a multi-saliency aggregation-based algorithmic solution for insulator flashover fault detection using aerial insulator images; and (2) the robustness performance, as well as the real-time performance, of the proposed fault detection solution are further assessed in this study. The rest of the paper is organized as follows: Section 2 presents the insulator target detection based on the F-PISA algorithm proposed flashover fault detection approach based on the aerial images of insulators; Section 3 exploits the fault location of insulator flashover based on the saliency of color feature; in Section 4, the proposed flashover fault detection algorithmic solution is evaluated through a set of experiments and the numerical results are presented and discussed in detail, and the robustness and real-time performance of the fault detection are also further studied; finally, conclusive remarks are given in Section 5.

2. Insulator Target Detection Based on F-PISA Algorithm

2.1. F-PISA Algorithm

It is well-known that the saliency of a region in an image depends on the difference between its own characteristics and the surrounding environment. Thus, the faster pixelwise image saliency aggregating (F-PISA) detection algorithm [14] based on the fusion of color feature and structure feature is firstly adopted to determine the target area of insulators.
Based on the saliency knowledge of color and structure, as well as the spatial prior knowledge, the PISA algorithm can accurately process the saliency detection for the whole image (each pixel) through the use of the aggregating complementary method. However, the computational complexity introduced by such a process can be prohibitive, and even unfeasible, in practice. Based on such recognition, the F-PISA algorithm is used to process the sampled image instead of the overall image to accelerate the image processing, and hence improve the real-time performance of fault detection. Firstly, a gradient-driven subsampling for the input image I is performed. A 3 × 3 pixels rectangular patch is used as the sampling unit, and the pixels with the largest gradient magnitude on the regular image grid are selected to form the sparse image matrix Il. For matrix Il, the saliency value of the structure contrast is defined and calculated to construct the color-based saliency model. The saliencies of the image can be detected from two different aspects, i.e., color feature and structure feature, which can be integrated to obtain the initial sparse saliency image S ˜ l of the sparse image Il. In order to obtain the full size saliency image S, propagating the saliency values between pixels is performed in the regions of a similar appearance and the same cross support. The initial sparse saliency image S ˜ l is expressed by the following equation:
S ˜ l ( p ) = U c ( p ) D c ( p ) + U g ( p ) D g ( p )
where S ˜ l is the initial sparse saliency image, p is the pixel, and U c ( p ) is the saliency value based on the color features. U g ( p ) is the saliency value based on the structure feature, while D c ( p ) and D g ( p ) are the spatial prior knowledge based on the color and structure features, respectively.
The full size saliency image S is described by the following equation:
S ( q ) = 1 m i = 1 m α q p i S ˜ l ( p i )
where S ( q ) is the saliency value of the image; q is the pixel; m is the total number of pixels; and α q p i is the high weight to support pixels with a shorter spatial distance to pixel q for p i I l , the cross support region, defined as q Ω p i .

2.1.1. Color Feature of Target

As one of the most widely used visual features in image retrieval, color feature is closely related to the objects or scenes contained in the image [15]. Compared with other visual features, e.g., size, direction, and view angle, it is considered that less dependence exists among different color features, which implies that better robustness can be achieved.
In [16], an efficient region detection method based on global color contrast was proposed. In the method, through extracting the nonparametric color distribution from the local adaptive uniform region, the color contrast can be obtained. In order to obtain a better-proportioned color distribution, the Lab color space is used to quantify the H component of the image into 12 levels. Through a local observation window W P , the color histogram h c ( p ) of each pixel P can be obtained. Then, the pixels with similar color histograms are grouped into the same clusters by using the K-means clustering algorithm. The color feature space of the entire input image is divided into K c clusters as { φ 1 , , φ K C } , where φ p represents the cluster to which the pixel P belongs. The saliency value of the pixel P based on the color feature can be obtained as:
U c ( p ) = U c ( h c ( p ) ) = i = 1 K c ω i h c ( φ i ) , h c ( φ p )
where ω i represents the weight of the cluster relative to the other clusters in terms of color contrast and the value is the number of pixels in cluster φ i , h c ( φ i ) is the average color histogram for cluster φ i , and h c ( φ p ) is the average color histogram for cluster φ p .

2.1.2. Structure Feature of Target

In practice, only using the color saliency feature does not permit researchers to detect the object from the image background effectively. In this work, a saliency based on the structure feature which can be obtained by modeling the gradient direction, as well as gradient values of the pixels in the image [17,18], is adopted. Similar to the color contrast method, the structural feature is quantized into eight levels according to the pixel histogram of the image gradient distribution, and the gradient histogram h g ( p ) of each pixel P can be obtained through a local observation window W p . The K-means clustering algorithm is utilized to divide the structure feature space of the image into K g clusters as { φ 1 , , φ K g } . Hence, the saliency value of the pixel P based on the structural feature can be described as:
U g ( p ) = U g ( h g ( p ) ) = i = 1 K g ω i h g ( φ i ) , h g ( φ p )
where ω i represents the weight of the cluster relative to other clusters in terms of structural contrast, and the value is the number of pixels in cluster φ i . h g ( φ i ) is the average gradient histogram for cluster φ i , while h g ( φ p ) is the average gradient histogram for cluster φ p .

2.1.3. Generation of Final Saliency Image

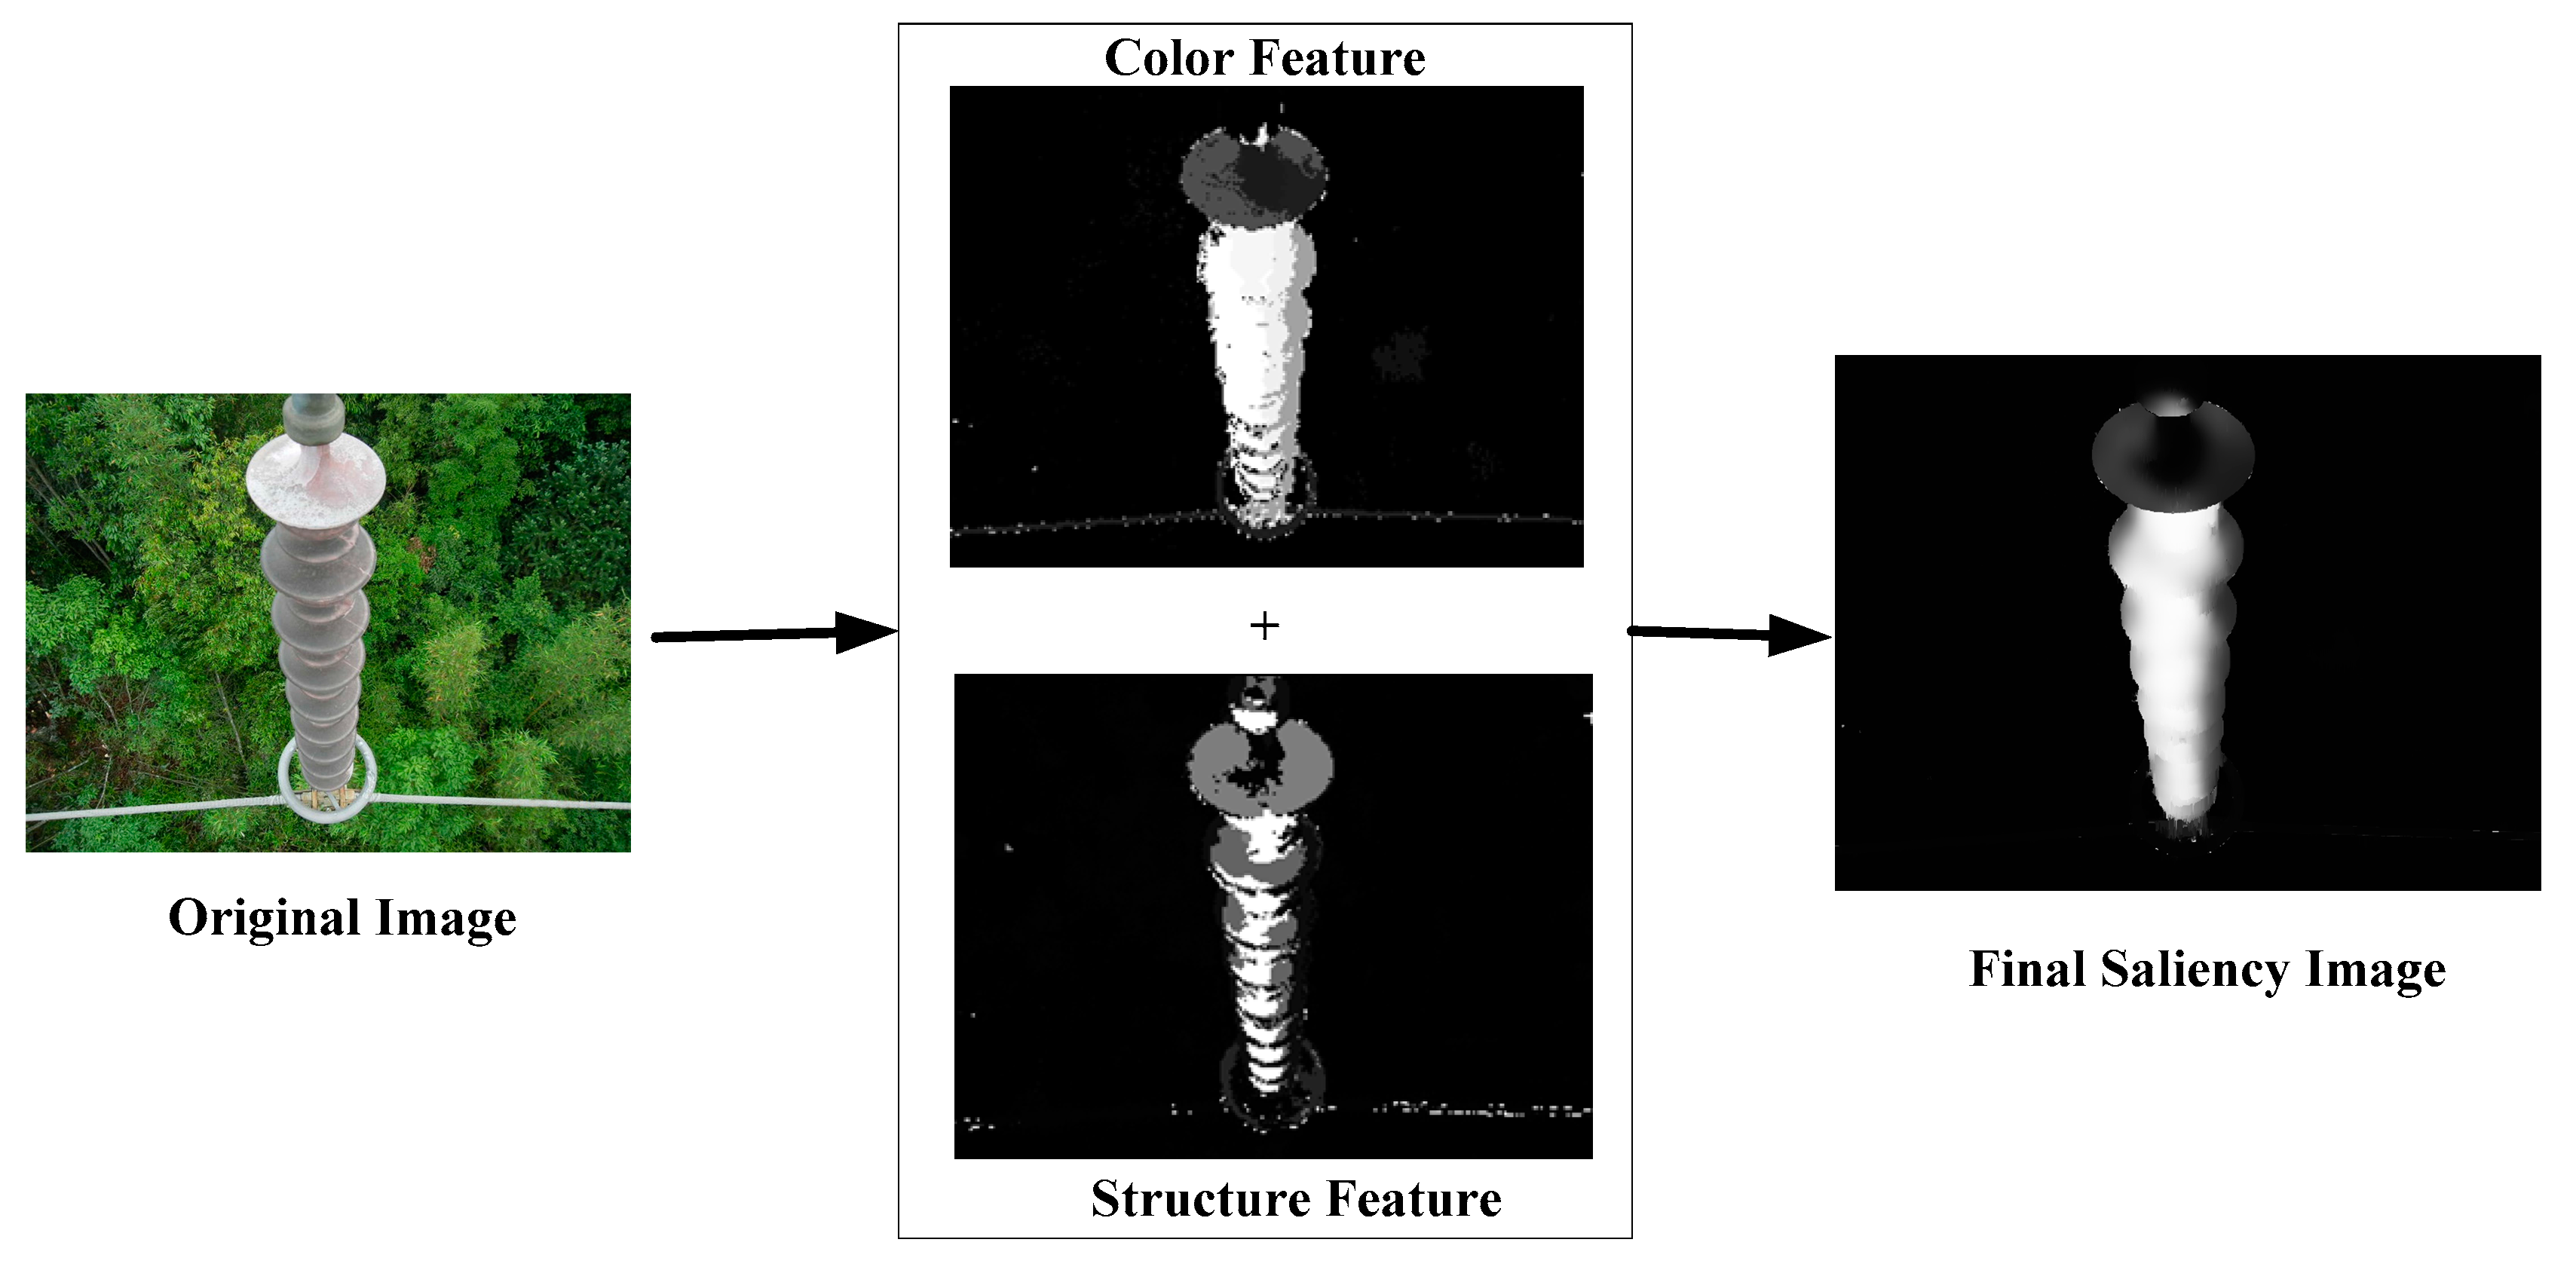
With the obtained saliency values of U c ( p ) and U g ( p ) based on the color and structural features in place, these two saliencies can be integrated to produce the final saliency test result by the use of the F-PISA algorithm, as illustrated in Figure 2.
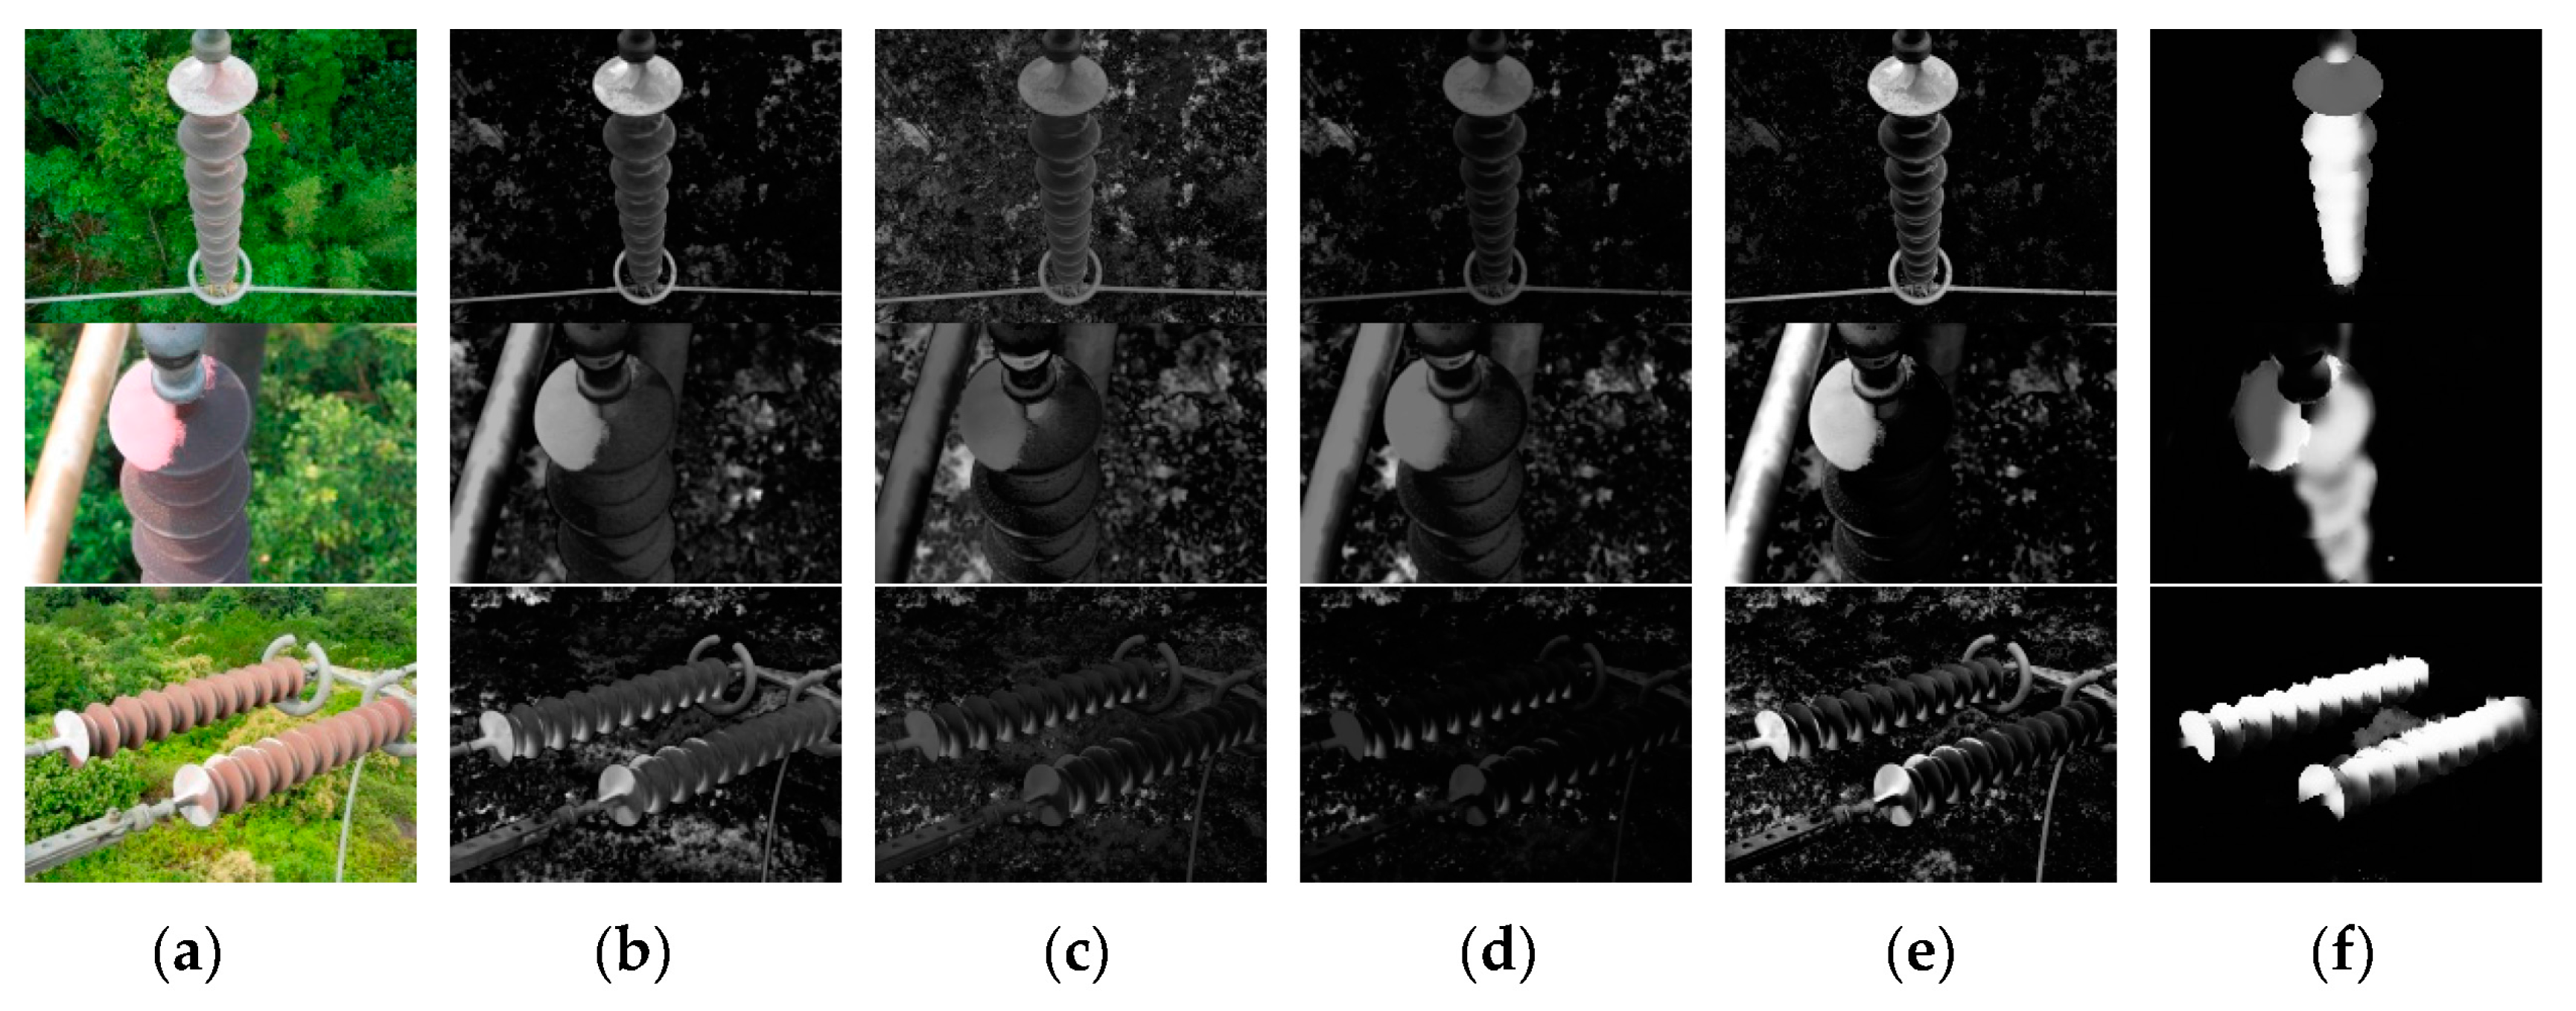
The F-PISA algorithm can provide improved performance to remove the interferences from the complex background and highlight the target area compared with conventional saliency detection algorithms. Figure 3 compares the result obtained from the F-PISA algorithm against FT (frequency-tuned), AC (achanta), HC (histogram-based contrast), and LC (luminance Contrast) algorithms.

2.2. Morphological Processing

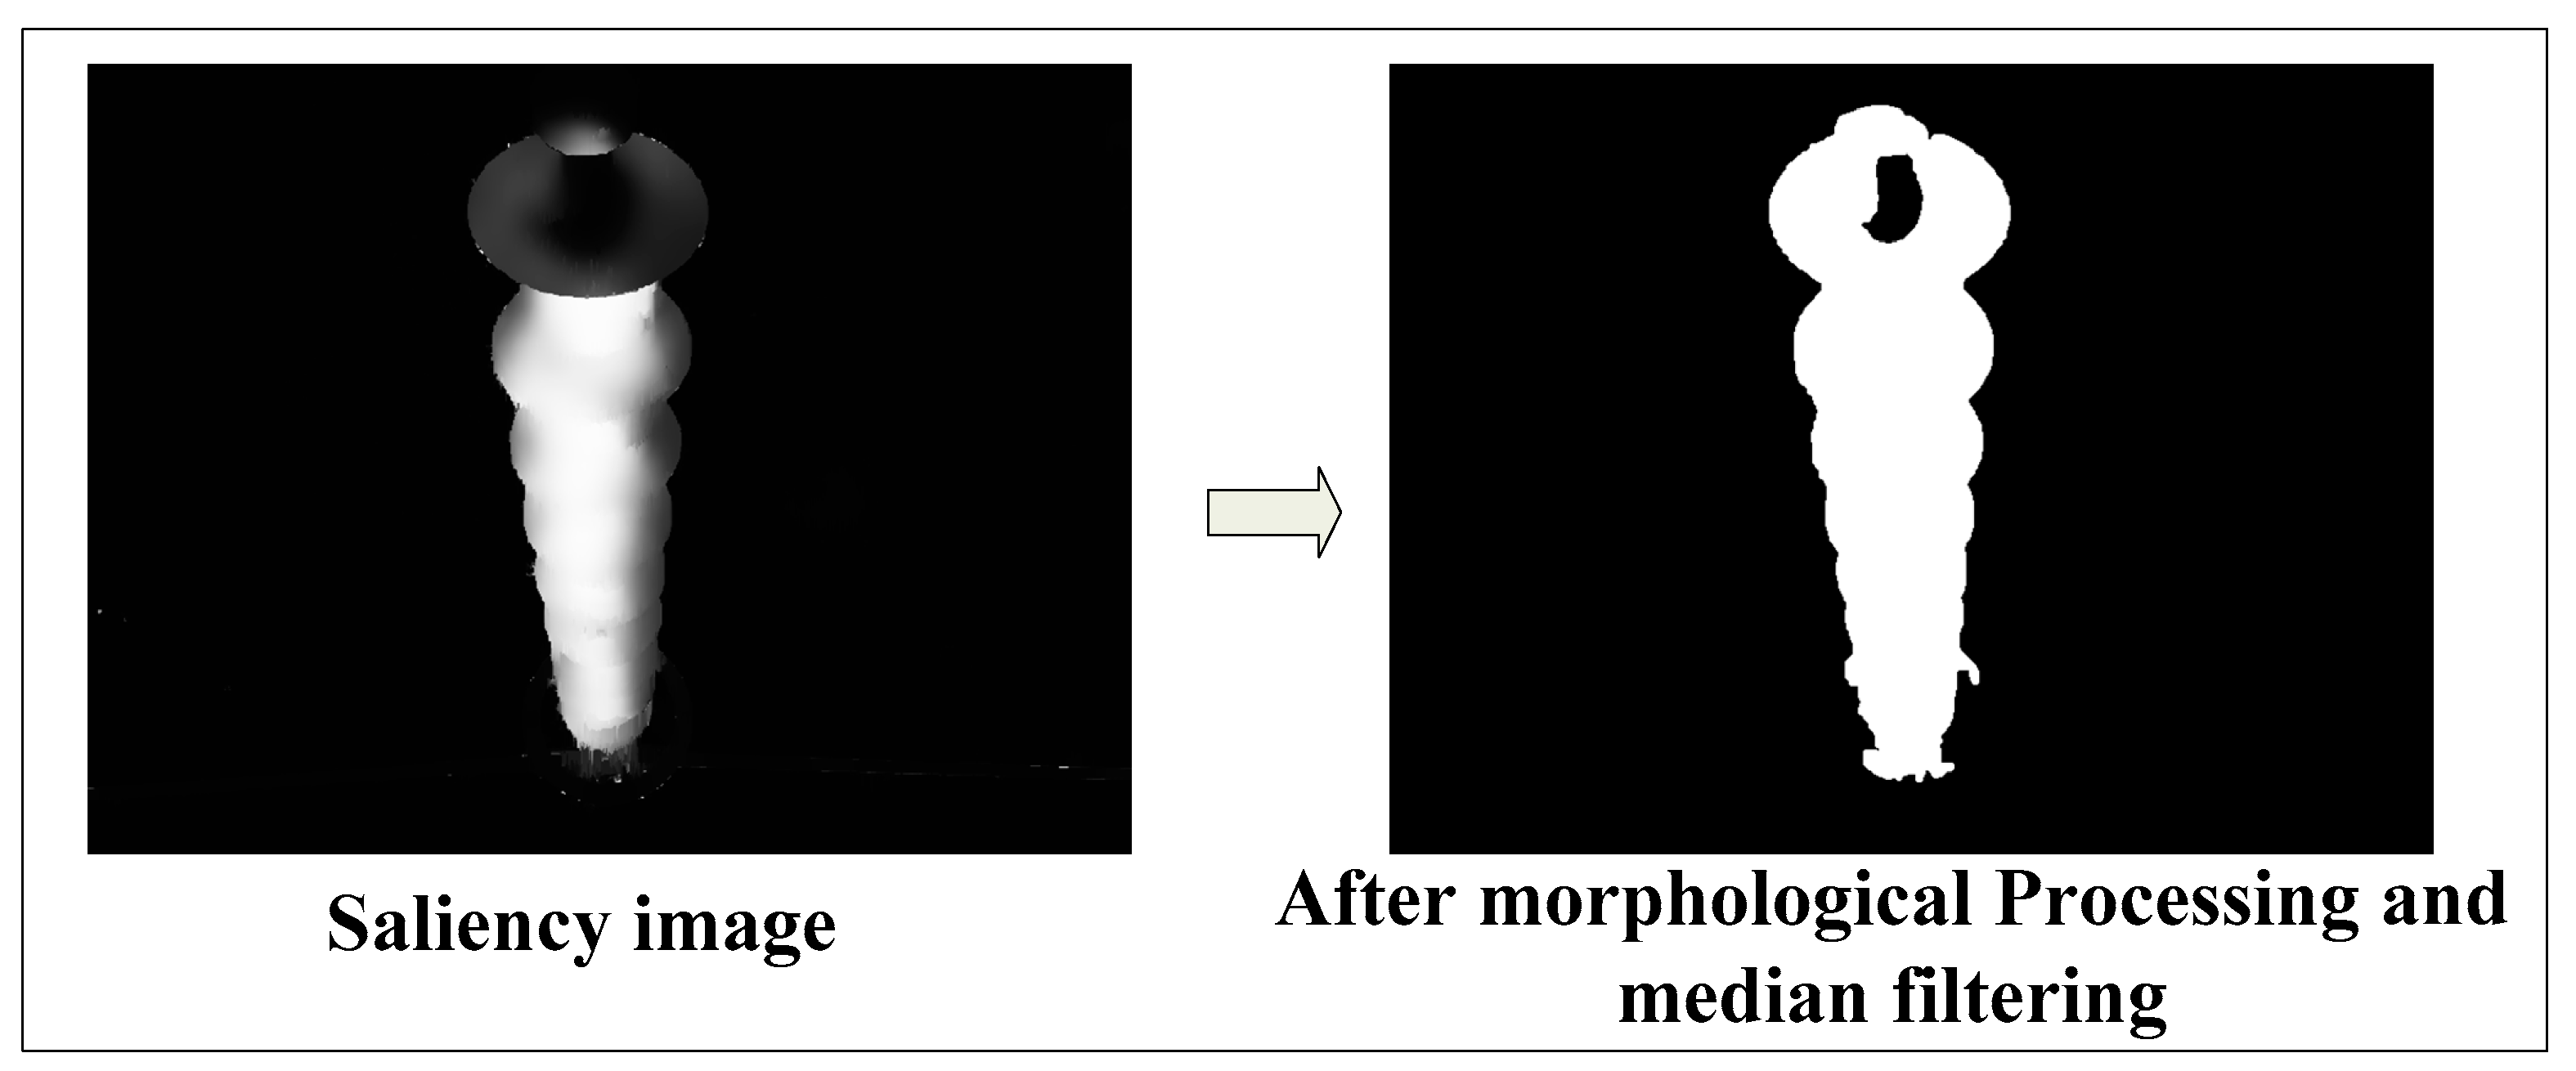
Based on the obtained saliency image of the insulator, an appropriate threshold needs to be selected for the binary segmentation of the saliency image to highlight the contour of the insulator. Here, to clearly identify the target area of the insulator, the open operation of morphology is adopted to eliminate the isolated points adjacent to the target region, and median filtering is also carried out to eliminate the isolated noise and smooth the image, as illustrated in Figure 4.

2.3. Determination of Target Area

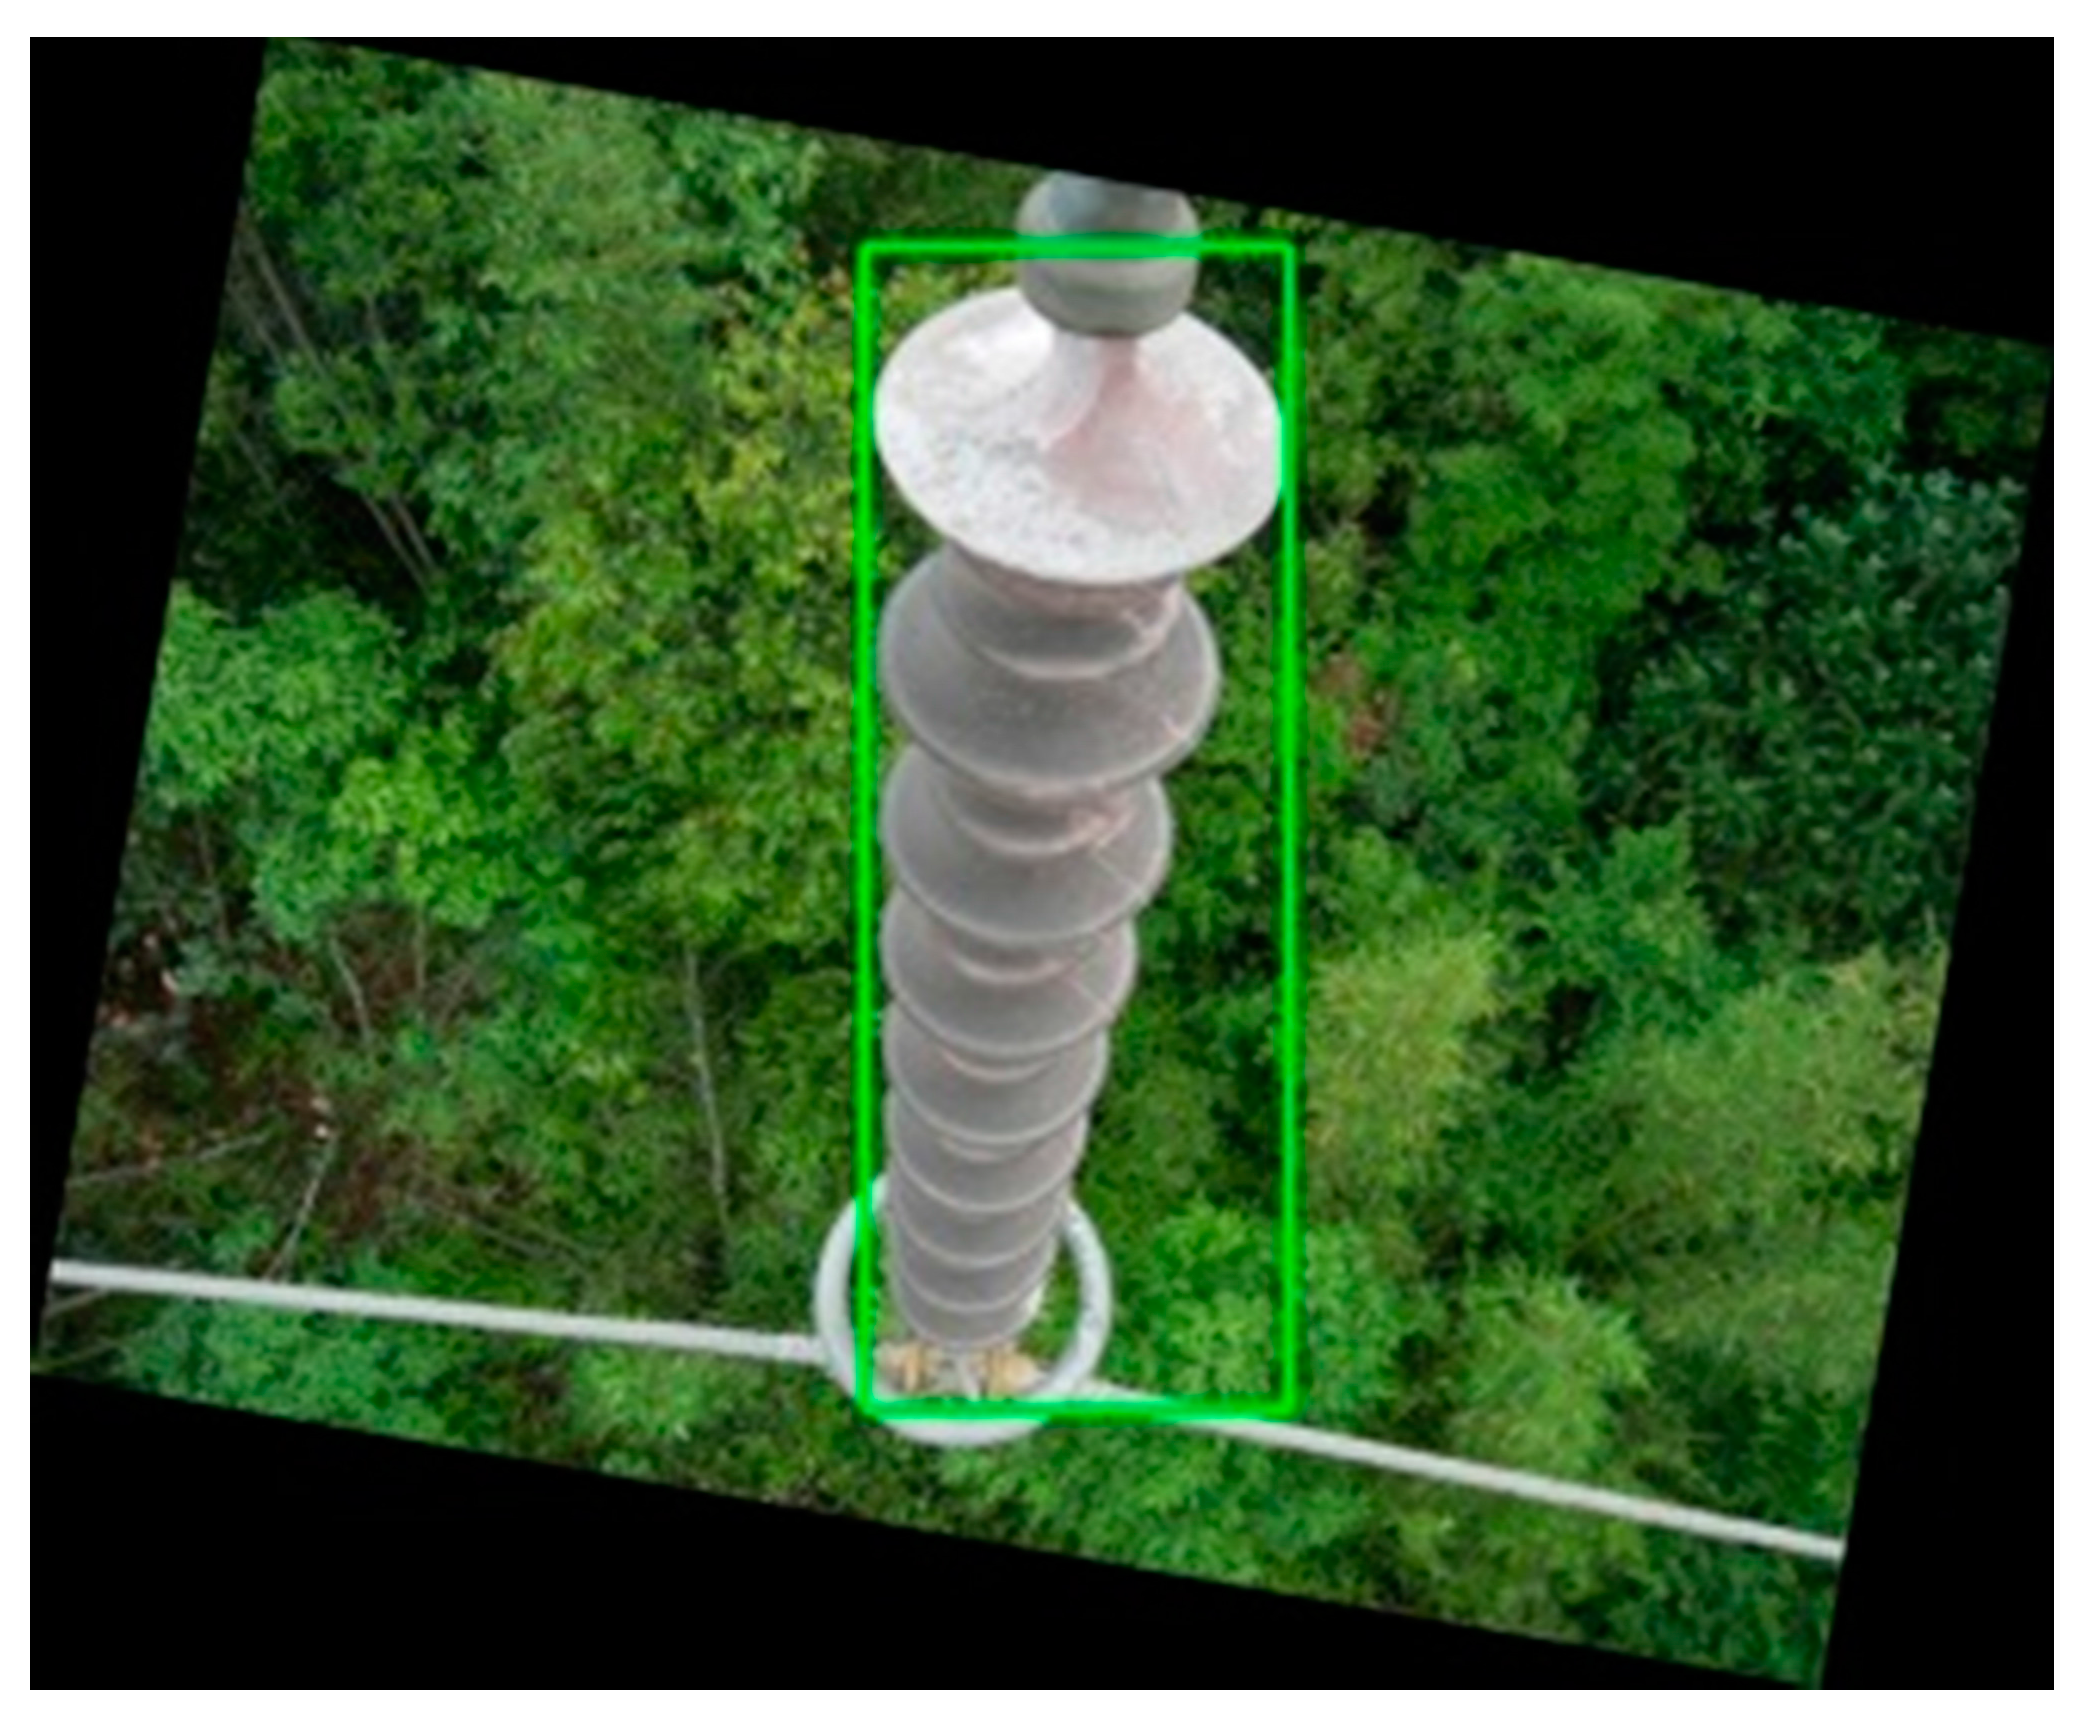
In this subsection, the determination of the target area is introduced. The connected domain preserved after morphological processing and filtering can be taken as the target region. Then, tilt correction needs to be carried out so as to frame the target area and make preparations for acquiring the damaged part of the insulator.
The key steps of determination of the target area are given as follows: firstly, the tilt correction is applied to the aerial images to obtain the rotation angle; then, the connected domain of the rotated image is marked and the coordinates of the two points of the smallest circumscribed rectangle of the connected domain are obtained; finally, the connected domain is further filtered to remove the interference of the small area which belongs to non-insulator parts of the connected domain and the final target area on the rotated image can be framed and identified. The target area of the insulator can thus be identified, as shown in Figure 5.

3. Location of Insulator Flashover Based on Saliency of Color Feature

In reality, most insulator flashovers occur on the porcelain insulators, whose surface may strip off, and as a result some spots and burning marks and porcelain glaze may emerge. Through examining the obtained insulator flashover images, it can be found that there exists a significant color difference between the damaged insulators (or areas) and the normal ones. Therefore, a color model can be established for the framed target area to differentiate the damaged areas from the normal insulators.

3.1. Color Determination

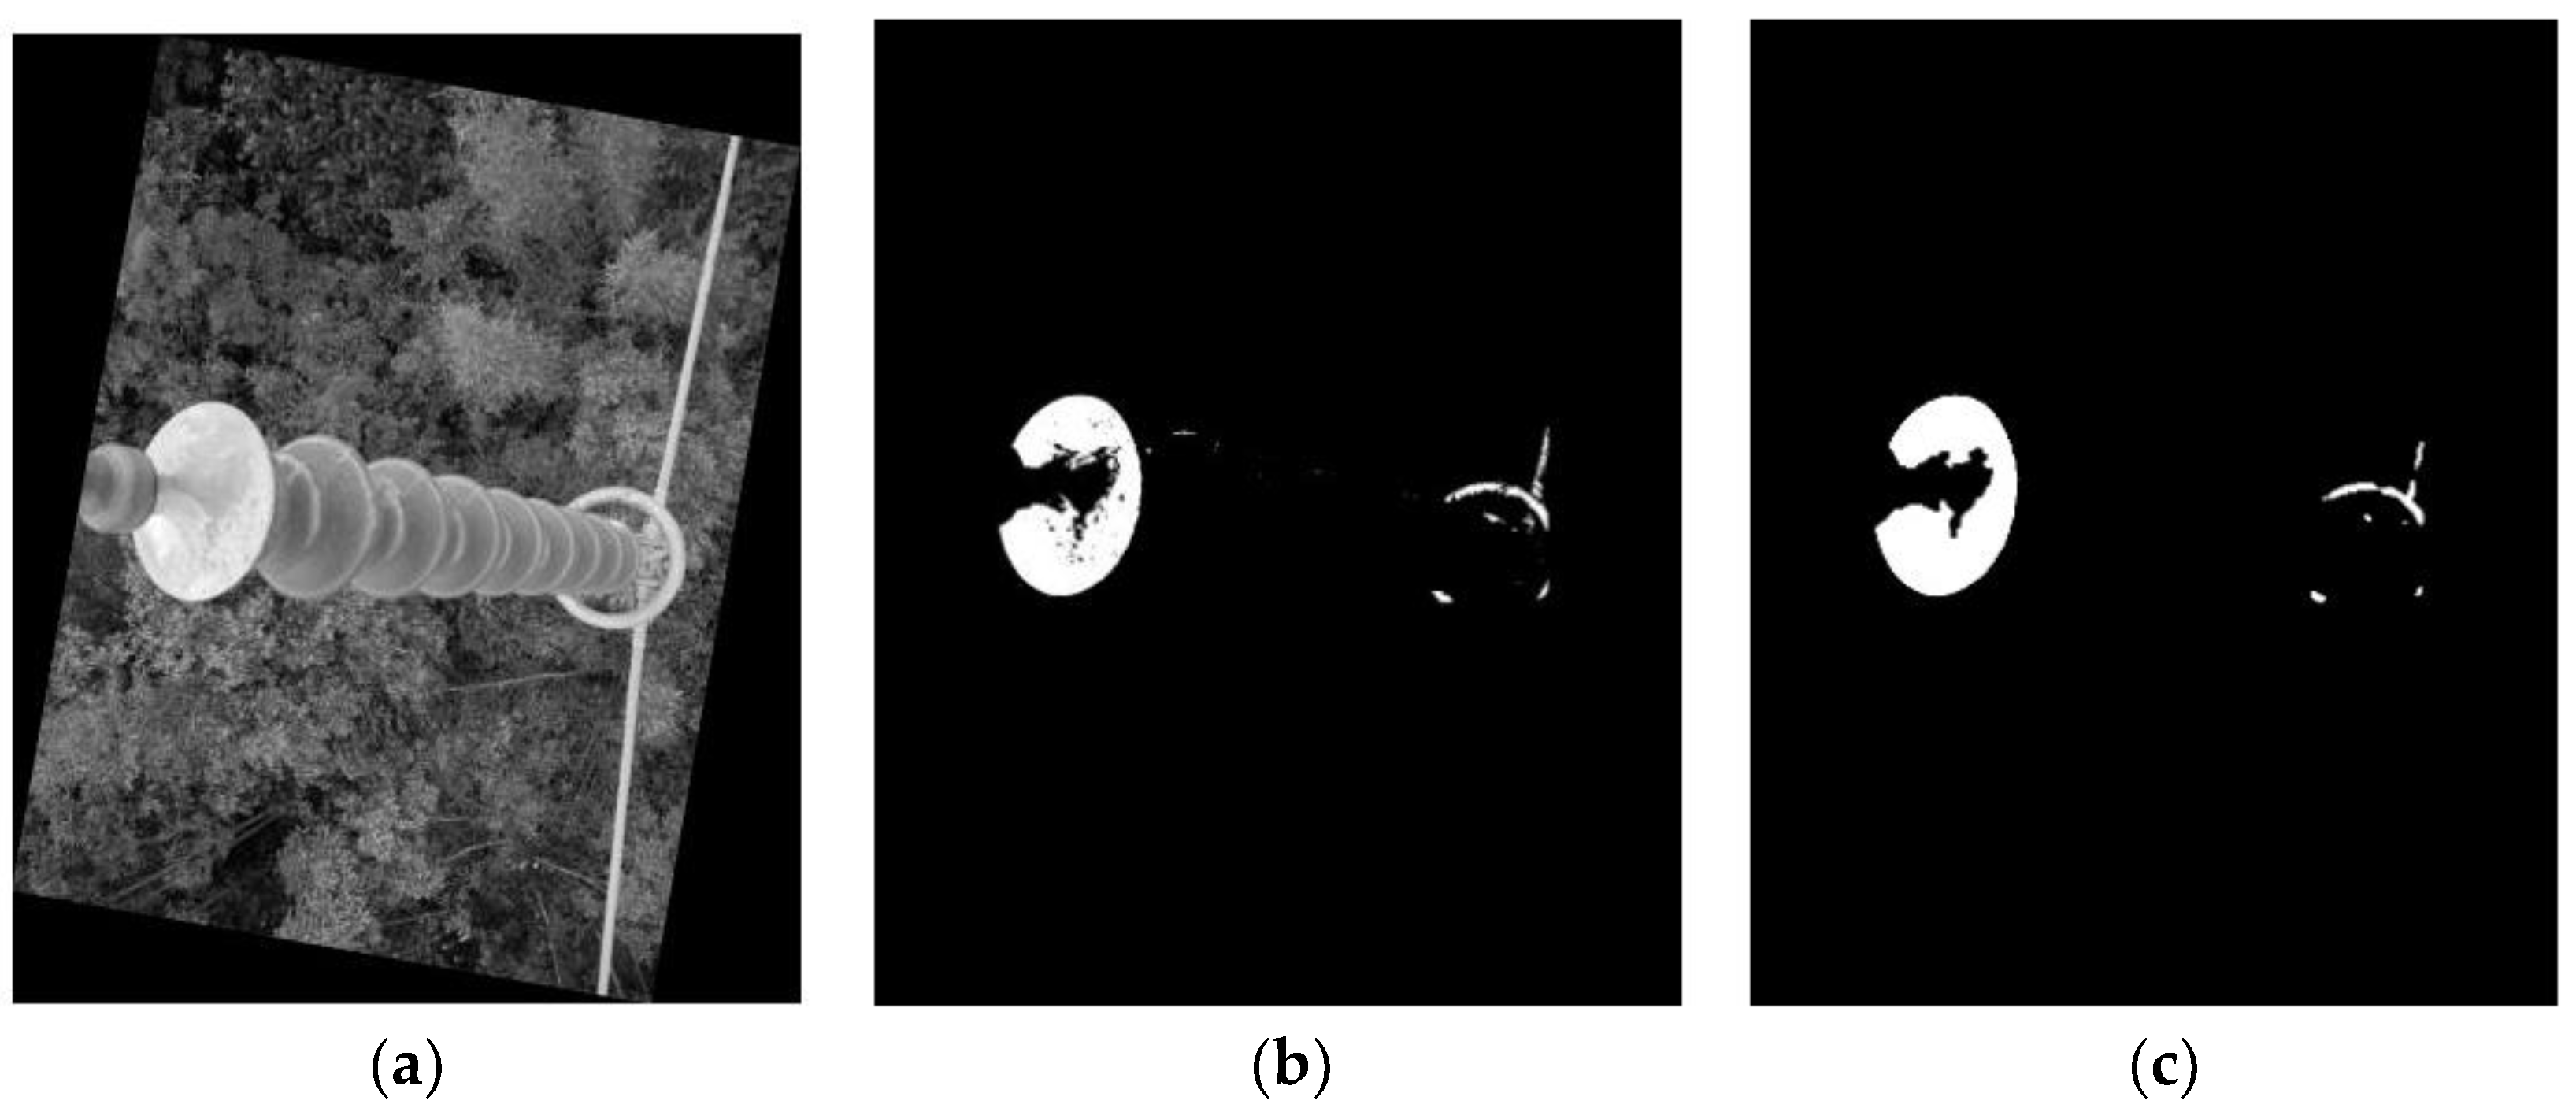
Here, the detailed process of color determination is introduced. Firstly, the original image of the insulator after tilt correction is processed with gray scale. The flashover position can be distinguished from other parts, as shown in Figure 5. By analyzing the color distribution, the rule of color judgment can be concluded and the formula is given in Equation (5):
G ( i , j ) = i m g R g b R o t a t e G r a y ( i , j ) { G > = 200 ,   G = 255 ; G < 200 ,   G = 0 .
where i and j are the pixel coordinates of the gray scale graph.
The color determination is performed on the target area according to the above color judgment. If the judgment holds, the area is determined to be the damaged area, and the pixel value here is set to the maximum of 255; otherwise, it is set to 0. In order to avoid the influence of isolated noise, the median filter is adopted to process the image after color determination. Taking a damaged insulator image as an example, the results after color determination are demonstrated in Figure 6.

3.2. Detection of Fault and Location of Damaged Area

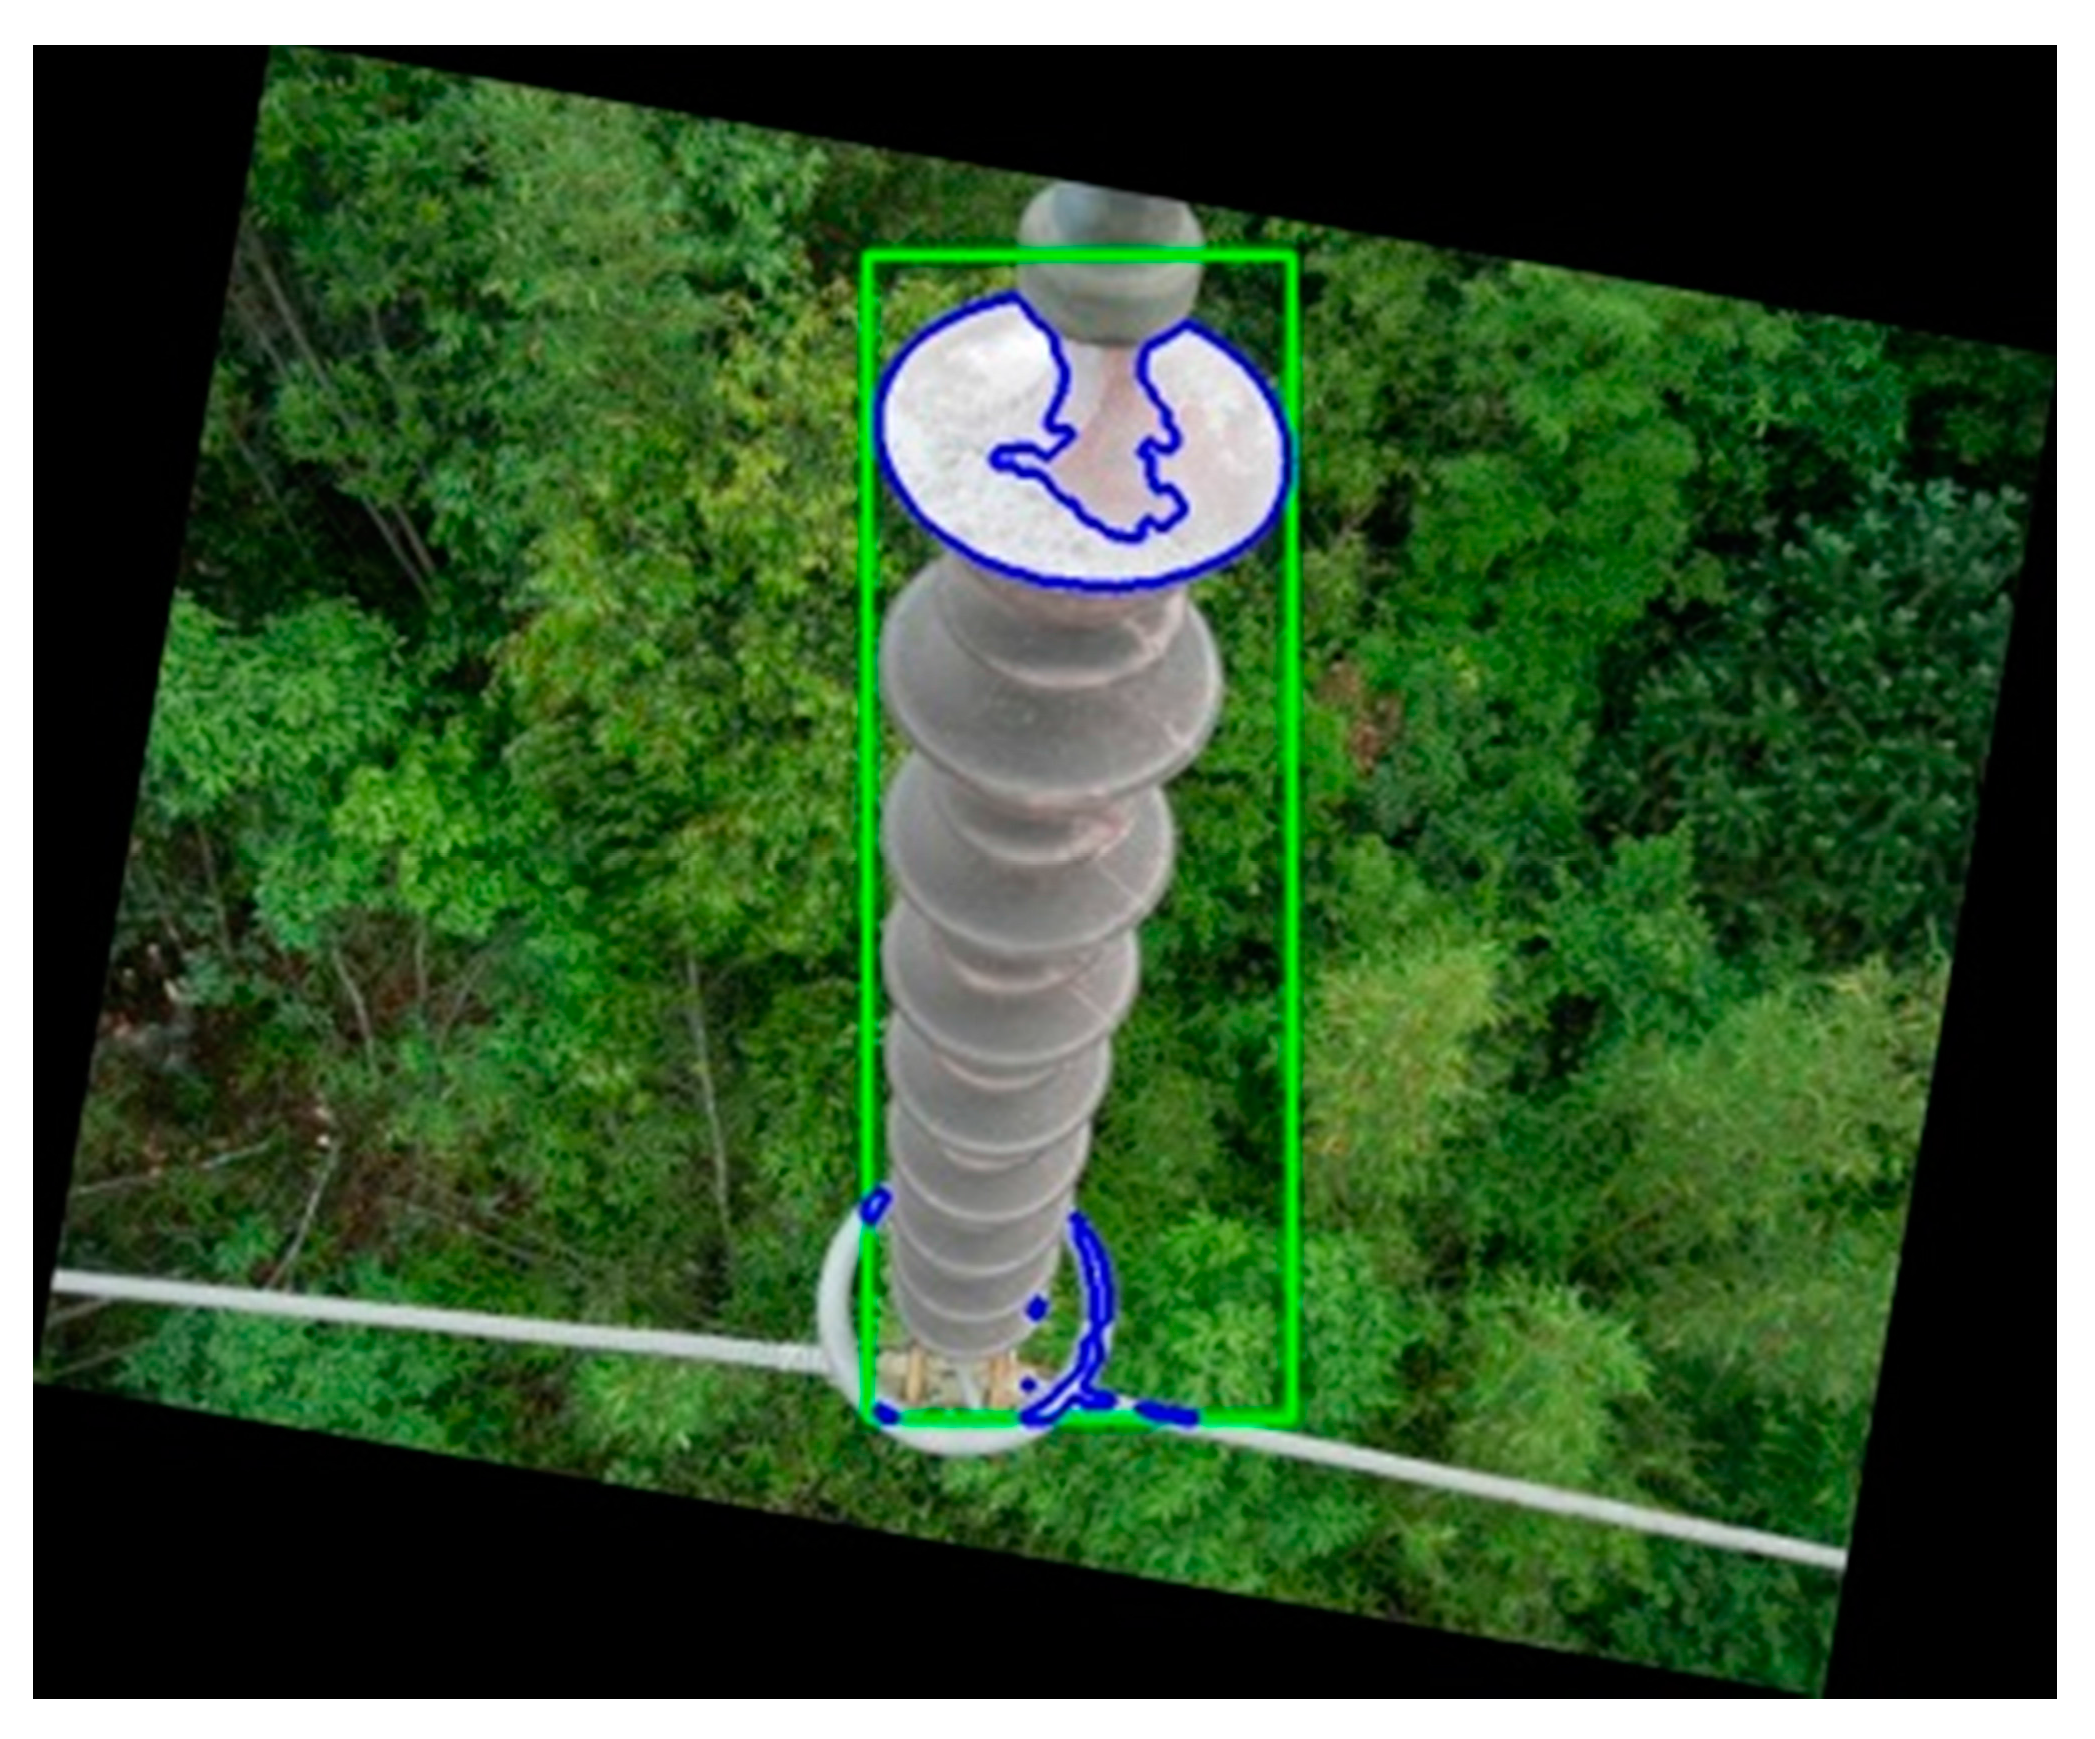
After color determination and filtering, the damaged parts of the insulator chip caused by flashover are highlighted. In order to clearly indicate the location of the fault in the original image, we extracted the contour of the connected domain and displayed it in the original image, which can accurately locate the fault site in the original image (i.e., the selected part of the insulator highlighted in blue). The identified flashover fault location is illustrated in Figure 7.

4. Experimental Results and Performance Analysis

4.1. Experimental Results

In this work, most of the aerial images are captured by unmanned aerial vehicle (UAV) systems (SR-100, State Grid Hebei Electric Power Supply Co., Ltd. Maintenance Company, Shijiazhuang, China) under complex backgrounds, so the image under experiment in this subsection is the one collected by the UAV system. The testing environments include the Windows 7 operating system and Microsoft Visual Studio 2010. The main frequency of CPU is 2.50 GHz, and the memory is 4.00 GB.
Figure 8 presents the experimental result of the proposed solution for individual steps. The subfigures from left to right are the original image obtained by the aerial target area, saliency image after insulator target detection, image after morphology and filtering processing, saliency image of flashover location after color determination and filtering, and final obtained image after contour extraction, respectively.

4.2. Robustness Analysis

4.2.1. Insulators with Indistinct Fault Features

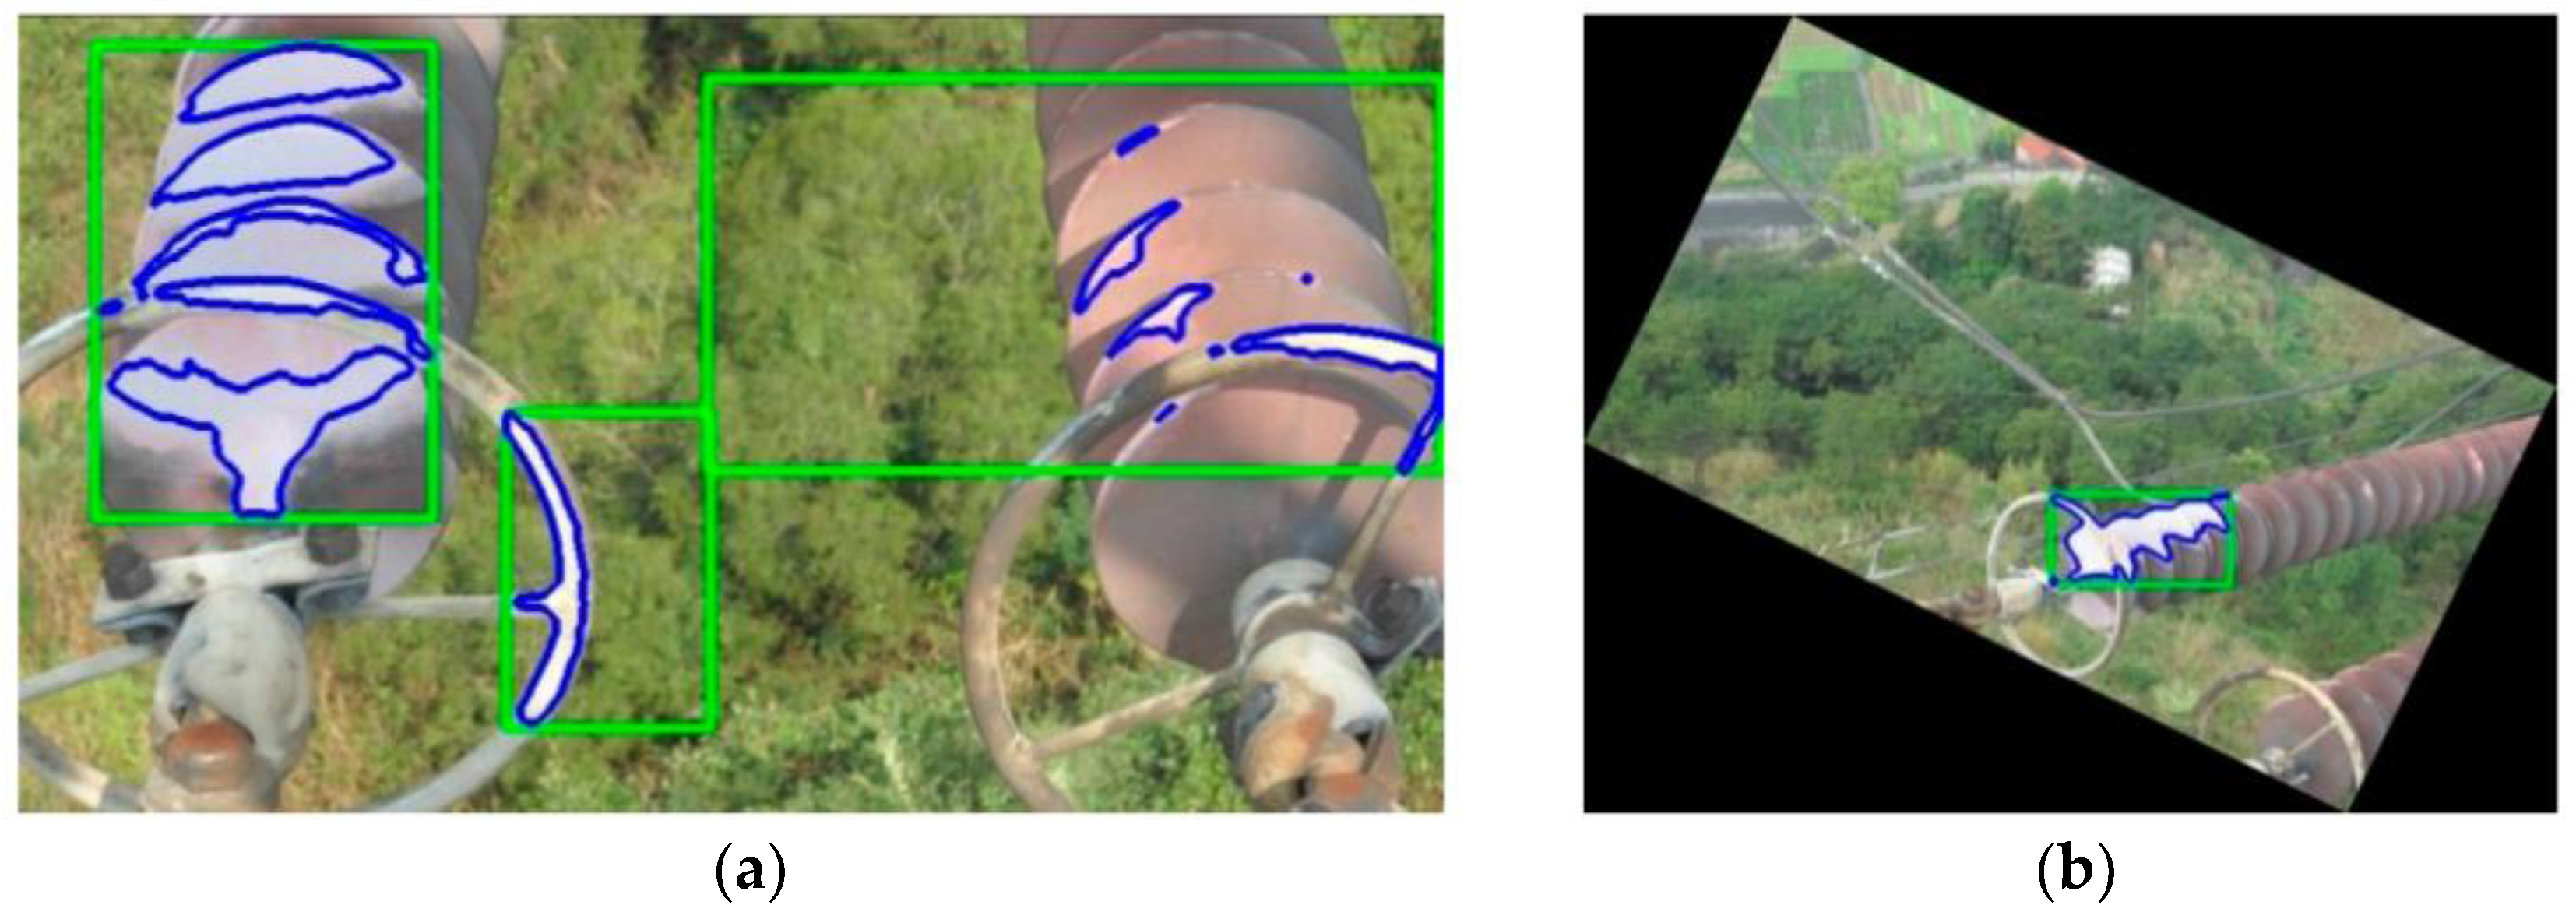
In practice, in the case that the aerial images are captured from a long distance, the boundary between the damaged part and the normal part of the insulator may be not obvious. Also, the damaged area on insulators may be relatively small, so it is difficult to identify the location of the damaged parts, which may lead to a false detection. Through the adoption of the proposed algorithmic solution, the flashover faults in the above two cases can be accurately located, which demonstrates the strong robustness of the fault detection algorithm with insulator images of different shooting angles. The performance in terms of robustness is demonstrated in Figure 9.

4.2.2. Aerial Images with Different Shooting Distances

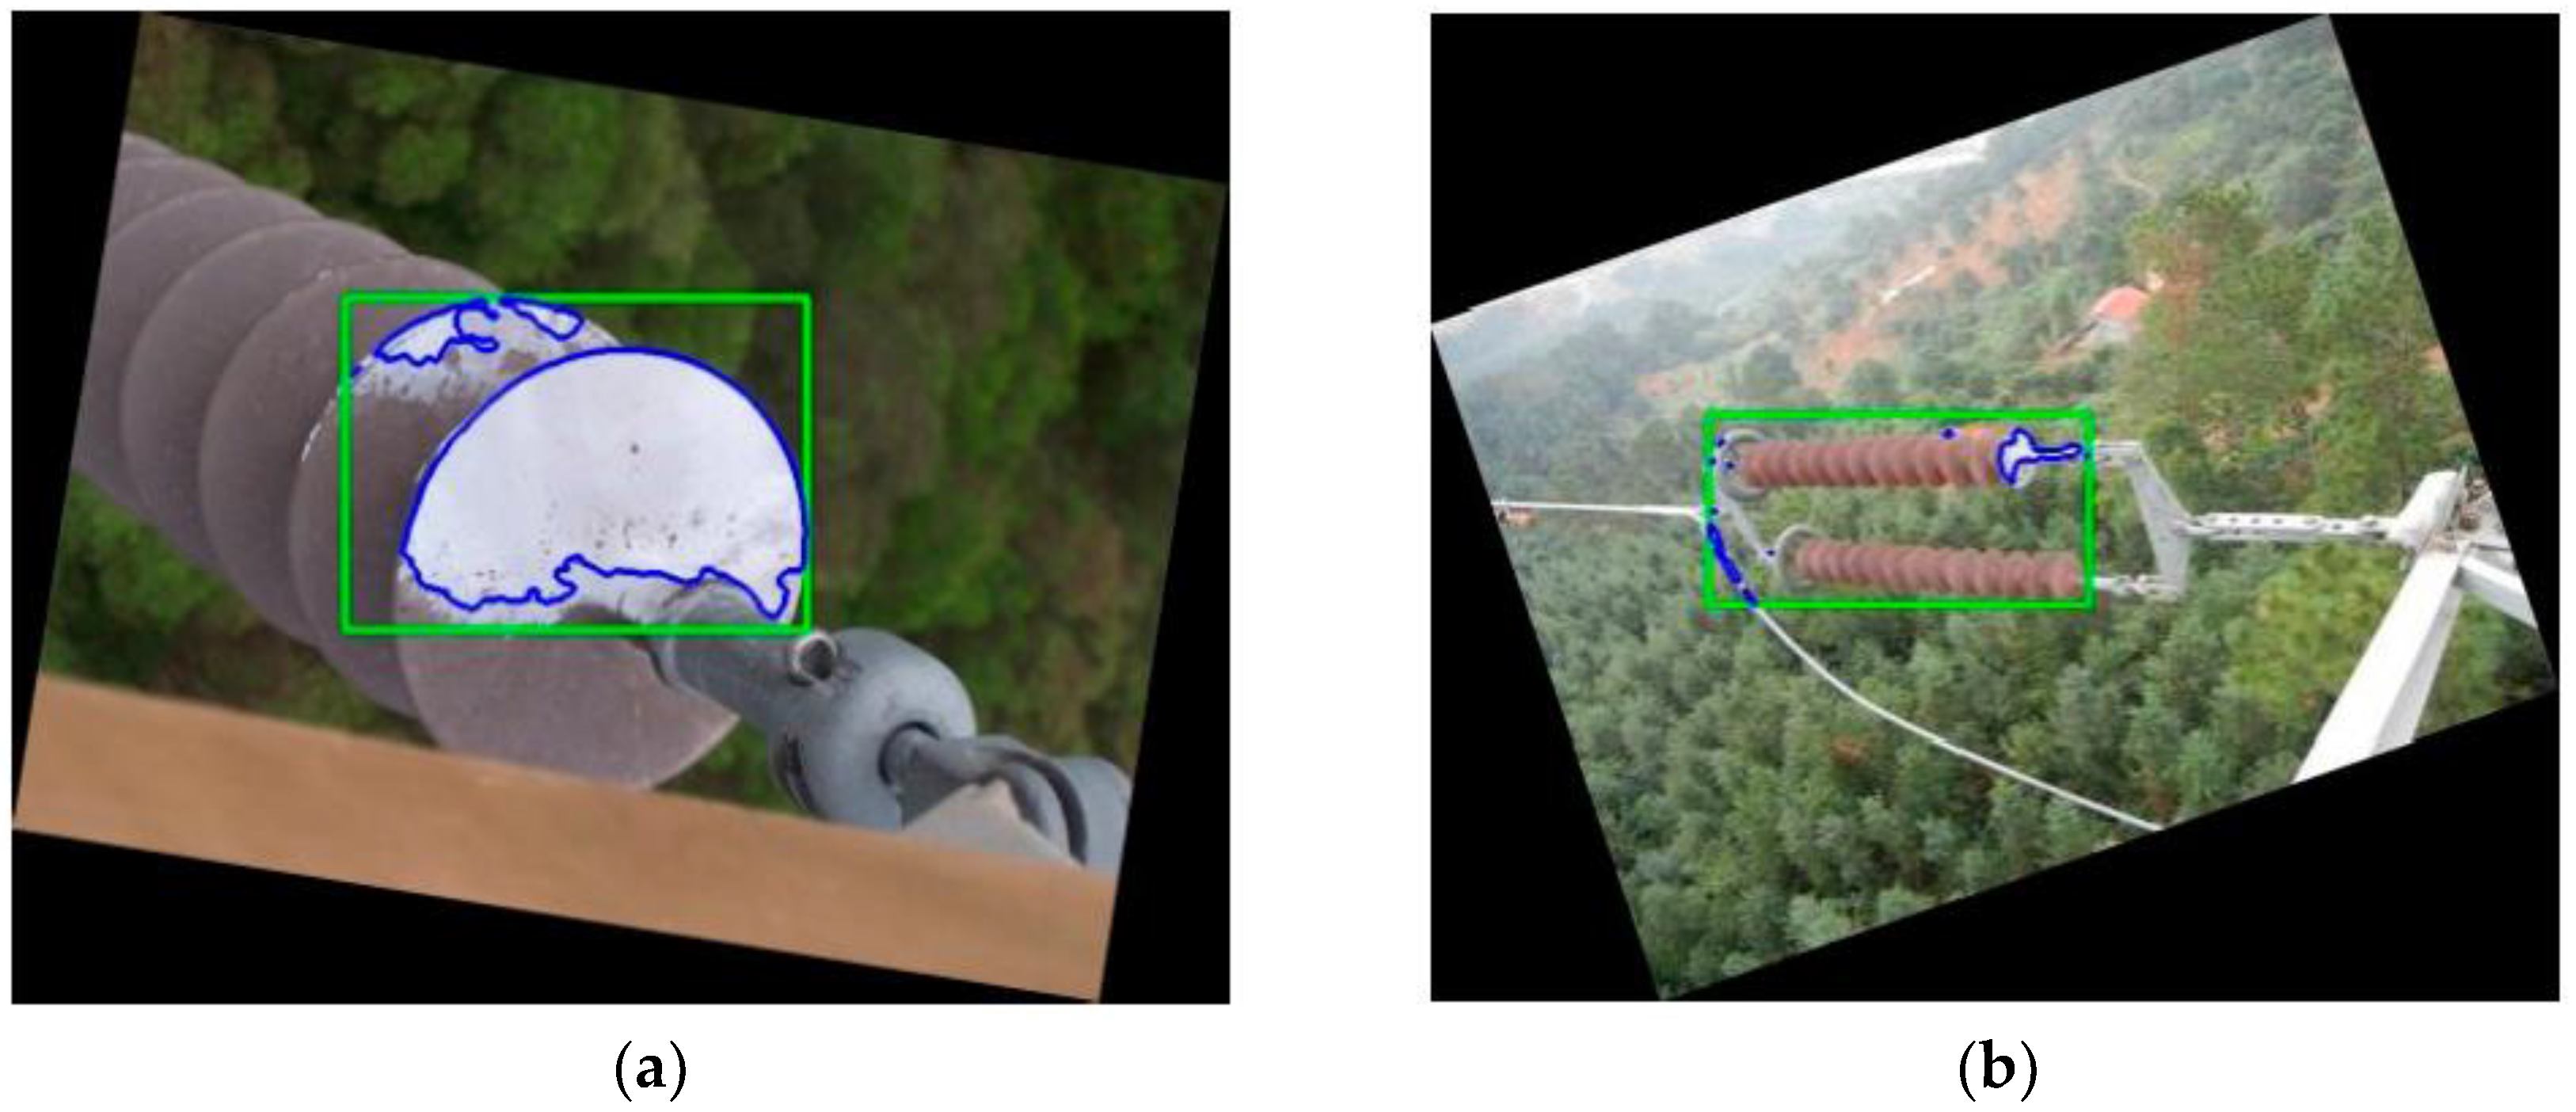
The aerial images captured by aerial vehicles can be collected with different shooting distances, and hence the robustness of the proposed solution needs to be further evaluated. The performance results are presented in Figure 10, which confirms that the proposed solution can accurately identify the flashover faults for both close-up shot images and the long-range shot images.

4.2.3. Performance Comparison against the Edge Contour Algorithm

The proposed method is compared with the algorithm which simply uses the edge contour to detect and locate the damaged position. Due to the interference of complex backgrounds, the edge of the damaged parts detected by the simple edge detection algorithm is not sufficiently clear, and there exist a large number of false detected areas, as can be seen in Figure 11a. Based on the proposed solution, the extracted edge contour is much clearer with less false detected areas, as illustrated in Figure 11b.
From the aforementioned performance evaluation, it can be observed from the result that the proposed algorithm can perform well in identifying the flashover faults with sufficient robustness based on the obtained aerial images of electric power transmission lines under different conditions.

4.3. Real-Time Performance Assessment

Now, the real-time performance of the proposed detection solution is further assessed. In this work, the performance is evaluated and analyzed through the detection of 100 insulator flashover images, each of which contains more than one flashover fault. The time consumptions of flashover fault detection are counted, and then the average time-consumption is calculated to analyze the efficiency of the algorithm. The statistics of the number of flashover faults and damaged parts are processed and the detection rate is calculated, as described by Equation (6). Finally, the efficient detection rate can be calculated, as expressed by Equation (7).
Q J = n N × 100 %
Q Z = m n × 100 %
where Q J is the detection rate, Q Z is the efficient detection rate, N is the total number of samples, n is the number of samples that can be detected, and m is the number of samples of which the damaged parts can be correctly located.
The performance of the proposed algorithmic solution is evaluated by using the edge contour algorithm as the comparative benchmark. The edge contour algorithm uses the edge contour to detect and orientate the damaged part of flashover. The comparative study is carried out in a number of performance metrics, including the average detection time for each image, average detection time for each flashover, detection rate, and effective detection rate. Table 1 presents the numerical results and indicates that the average time spent by the proposed algorithm is relatively short; and the detection rate and efficient detection rate are higher compared to that of the edge contour algorithm.

5. Conclusions and Future Work

This paper presented a novel and efficient algorithmic solution of flashover fault detection for a porcelain insulator based on a saliency and morphology technique. From this study, a number of insights can be obtained and summarized as follows:
  • Strong robustness. The proposed algorithmic solution can accurately identify the flashover faults based on the aerial images captured with different shooting distances and angles.
  • Good detection accuracy. The flashover fault can be accurately detected even when the boundary between the damaged part and the normal part is not obvious, or the area between the insulator and the partially damaged area is small. The average detection rate can reach up to 92% and the efficient detection rate of the fault location can reach up to 85%.
  • Good real-time performance. No complicated calculation is needed by the proposed algorithm, and only the multi-saliency algorithm and the simple mathematical morphology algorithm are used, which ensures the detection effectiveness and minimizes the calculation time at the same time. In addition, the proposed method opens up the possibility of real-time detection for future applications.
The proposed solution can successfully meet the requirement of timely and accurate identification of flashover faults on transmission lines using unmanned aerial vehicles. It is noted that the solution proposed in this paper is only able to detect the flashover fault for porcelain insulators, and the flashover fault detection of glass and RTV/polymeric insulators remains to be further studied.
With respect to future work, a number of research directions are considered worthy of further research exploitation. Firstly, the integration of various significant features, especially the integration of different structural features, needs to be further exploited in the case that the color features are not obvious. Due to the fact that the internal faults of insulators (e.g., short circuit) can be hardly detected using the proposed solution, the exploitation of integrating more advanced techniques are required. Moreover, the detection performance of the proposed algorithmic solution using the saliency feature extraction technique needs to be further validated through more extensive field experiments considering different conditions, e.g., air pollution and bird streamers.

Acknowledgments

This study is supported by National Natural Science of Foundation of China (61773160, 51777183), and National Natural Science Foundation of Hebei Province (F2017502016), the Natural Science Foundation of Zhejiang Province (No. LZ15E070001), and the Natural Science Foundation of Jiangsu Province (No. BK20161142).

Author Contributions

Yongjie Zhai, Rui Chen, and Qiang Yang developed the system modeling and algorithm design; Haiyan Cheng and Xiaoxia Li performed the experiments; Rui Chen and Haiyan Cheng analyzed the experimental data; Yongjie Zhai, Rui Chen, and Qiang Yang wrote the paper.

Conflicts of Interest

The authors declare no conflict of interest.

References

  1. Han, Z.X.; Qiao, Y.H.; Sun, Y.; Li, W. Research on image recognition based insulator fault detection method for UVA transmission line. Mod. Electron. Tech. 2017, 40. [Google Scholar] [CrossRef]
  2. Wang, L.; Wang, H.G. A survey on insulator inspection robots for power transmission lines. In Proceedings of the 4th International Conference on Applied Robotics for the Power Industry (CARPI), Jinan, China, 11–13 October 2016; pp. 1–6. [Google Scholar] [CrossRef]
  3. Yan, T.T.; Yang, G.D.; Yu, J.Z. Feature fusion based insulator detection for aerial inspection. In Proceedings of the 36th Chinese Control Conference (CCC), Dalian, China, 26–28 July 2017; pp. 10972–10977. [Google Scholar] [CrossRef]
  4. Koo, J.H.; Shin, W.J.; Oh, D.H.; Hwang, R.; Lee, B.W. Comparison of Surface Flashover Characteristics of Rod and Rib Type Post Insulator for Extra-High Voltage Superconducting Fault Current Limiter. IEEE Trans. Appl. Supercond. 2017, 27, 1–5. [Google Scholar] [CrossRef]
  5. Kezunovic, M. Smart Fault Location for Smart Grids. IEEE Trans. Smart Grid 2011, 2, 11–22. [Google Scholar] [CrossRef]
  6. Saranya, K.; Muniraj, C. Separation of transmission line insulator flashover from a three phase fault using synchronous measurements for a Smart Grid. In Proceedings of the International Conference on Energy Efficient Technologies for Sustainability (ICEETS), Nagercoil, India, 7–8 April 2016; pp. 503–508. [Google Scholar] [CrossRef]
  7. Sun, X.L.; Zhong, H.H.; Xun, T.; Zhang, J. Effects of surface “micro-holes” on the flashover properties of a disk-type ceramic-vacuum insulator. Vac. J. Cit. Rep. 2017, 141, 124–129. [Google Scholar] [CrossRef]
  8. Yang, X.L.; Li, Y.Q.; Liu, Y.P.; Lv, F.C. Ultraviolet Image Extraction of Power Equipment Discharge Region Based on Mathematical Morphology. Power Syst. Technol. 2008, 32, 96–99. [Google Scholar] [CrossRef]
  9. Wang, S.H.; Guo, W.Y.; Lv, F.C.; Liu, Y.P. Quantitative Relation of Ultraviolet Imaging Parameters of Corona Discharge. High Volt. Appar. 2013, 49, 16–20. [Google Scholar] [CrossRef]
  10. Lei, H.C.; Zang, C.Y.; Jiang, Z.L.; He, S.; Zhao, X.J.; Ye, H.S.; Yin, X.G.; He, Y.J. Detecting Breakage Defect of Post Insulator with Ultraviolet Imaging Method. High Volt. Appar. 2009, 45, 87–91. [Google Scholar] [CrossRef]
  11. Yin, L.M.; Zhang, D.J.; Tao, Y.Z. Study on Processing Method of Corona Day Blind UV Image Based on Mathematical Morphology. J. Northeast Electr. Power Univ. 2013, 33, 148–151. [Google Scholar]
  12. Wang, S.H.; Lu, F.C.; Li, H.M.; Yang, X.L. Study of corona UV image segmentation and its application based on mathematical morphology. J. North China Electr. Power Univ. 2009, 36, 18–22. [Google Scholar]
  13. Jia, B.Y.; Geng, H.R.; Fang, C.H.; Hu, C.; Wang, B.Z. Influence of wind speed and Direction on Flashover Characteristics of Composite Insulators. High Volt. Technol. 2012, 38, 75–81. [Google Scholar]
  14. Shi, K.Y.; Wang, K.; Lu, J.B.; Lin, L. PISA: Pixelwise Image Saliency by Aggregating Complementary Appearance Contrast Measures with Spatial Priors. In Proceedings of the 2013 IEEE Conference on Computer Vision and Pattern Recognition, Portland, OR, USA, 23–28 June 2013; pp. 2115–2122. [Google Scholar] [CrossRef]
  15. Pang, M.X.; Ye, X.N.; Ling, Z.H. Saliency Detection Based on Color and Gradient Boolean Feature. J. East China Univ. Sci. Technol. 2016, 42, 91–96. [Google Scholar] [CrossRef]
  16. Lie, M.M.I.; Borba, G.B.; Neto, H.V.; Gamba, H.R. Fast Saliency Detection Using Sparse Random Color Samples and Joint Upsampling. In Proceedings of the 29th SIBGRAPI Conference on Graphics, Patterns and Images (SIBGRAPI), Sao Paulo, Brazil, 4–7 October 2016; pp. 217–224. [Google Scholar] [CrossRef]
  17. Cong, R.; Lei, J.; Fu, H.; Huang, Q.; Cao, X.; Hou, C. Co-Saliency Detection for RGBD Images Based on Multi-Constraint Feature Matching and Cross Label Propagation. IEEE Trans. Image Process. 2018, 27, 568–579. [Google Scholar] [CrossRef] [PubMed]
  18. Kachore, R.N. Detections of salient region by using fast pixelwise image saliency aggregation (F-PISA). In Proceedings of the International Conference on I-SMAC (IoT in Social, Mobile, Analytics and Cloud) (I-SMAC), Palladam, India, 10–11 February 2017; pp. 629–633. [Google Scholar] [CrossRef]
  19. Achanta, R.; Hemami, S.; Estrada, F.; Susstrunk, S. Frequency-tuned salient region detection. In Proceedings of the IEEE Conference on Computer Vision and Pattern Recognition, Miami, FL, USA, 20–25 June 2009; pp. 1597–1604. [Google Scholar] [CrossRef]
  20. Achanta, R.; Estrada, F.; Wils, P.; Süsstrunk, S. Salient region detection and segmentation. In International Conference on Computer Vision Systems (ICVS); Springer: Berlin/Heidelberg, Germany, 2008; Volume 5008, pp. 66–75. [Google Scholar]
  21. Cheng, M.M.; Zhang, G.X.; Mitra, N.J.; Huang, X.; Hu, S.M. Global contrast based salient region detection. In Proceedings of the 2011 IEEE Computer Vision and Pattern Recognition (CVPR), Providence, RI, USA, 20–25 June 2011; pp. 409–416. [Google Scholar] [CrossRef]
  22. Zhai, Y.; Shah, M. Visual attention detection in video sequences using spatiotemporal cues. In Proceedings of the 14th Annual ACM International Conference on Multimedia, Santa Barbara, CA, USA, 23–27 October 2006; pp. 815–824. [Google Scholar] [CrossRef]
Figure 1. Flowchart of the proposed insulator flashover detection approach.
Energies 11 00340 g001
Figure 2. Result of saliency detection.
Energies 11 00340 g002
Figure 3. Comparison of F-PISA with some traditional saliency detection algorithms: (a) original aerial image; (b) FT algorithm [19]; (c) AC algorithm [20]; (d) HC algorithm [21]; (e) LC algorithm [22]; and (f) F-PISA algorithm.
Energies 11 00340 g003
Figure 4. Results of morphological processing.
Energies 11 00340 g004
Figure 5. Target area of insulator after tilt correction.
Energies 11 00340 g005
Figure 6. Process of color determination: (a) gray scale; (b) color determination; (c) after filtering.
Energies 11 00340 g006
Figure 7. Results of flashover fault location.
Energies 11 00340 g007
Figure 8. Performance evaluation results: (a) original image; (b) saliency image; (c) morphological processing; (d) color determination; (e) final result.
Energies 11 00340 g008
Figure 9. Test results in two cases: (a) detection results with an indistinct and small damaged area of the insulator; (b) detection results with no obvious demarcation between the damaged part and the normal part.
Energies 11 00340 g009
Figure 10. Test results of different shooting distances: (a) close-up shot image; (b) long-range shot image.
Energies 11 00340 g010
Figure 11. Performance comparison result: (a) edge contour algorithm; (b) the proposed algorithm.
Energies 11 00340 g011
Table 1. Comparison of time consumption and detection rate of algorithms.
Different AlgorithmAverage Detection Time for Each Image (s)Average Detection Time for Each Flashover (s)Detection RateEffective Detection Rate
Proposed Algorithm2.3220.34792.7%85%
Edge contour Algorithm4.6580.48670%64.2%