Article

Design Considerations for Parallel Differential Power Processing Converters in a Photovoltaic-Powered Wearable Application

Ulsan National Institute of Science and Technology, 50 UNIST-gil, Ulsan 44919, Korea
*
Author to whom correspondence should be addressed.
Energies 2018, 11(12), 3329; https://doi.org/10.3390/en11123329
Submission received: 12 November 2018 / Revised: 26 November 2018 / Accepted: 27 November 2018 / Published: 29 November 2018
(This article belongs to the Special Issue Power Electronics for Energy Saving)

Abstract

:
Solar photovoltaic (PV) power is a widely used to supply power to the electric grid but can also be used in lower-power emerging applications, like in wearables or the internet of things. One fundamental challenge of using PV power in flexible wearable applications is that individual PV modules point at various angles, thus receiving different light intensities. Using a series configuration for the PV modules greatly decreases power utilization under uneven irradiance conditions. Parallel differential power processing (DPP) converters are employed to address this power reduction problem, while maintaining individual PV control and maximizing output power. Two parallel DPP configurations, with and without a front-end converter, are analyzed and compared for a target battery-charging application. The DPP system without a front-end converter shows consistently high performance and operates properly over a wider range of lighting conditions. Maximum power point tracking (MPPT) algorithms are also examined for parallel DPP systems. When the MPPT parameters are properly calibrated, simulation results indicate that voltage-offset resistive control is the most effective at maximizing PV power under unbalanced lighting conditions.

1. Introduction

As renewable energy generation increases in popularity, solar photovoltaic (PV) power is becoming more widely used around the world. PV systems are most commonly used to provide solar energy to the electric grid. Recent advancements in PV power systems include the integration of energy storage with PV systems to increase their reliability and cost-effectiveness [1]. Additionally, both policies and technological advancements are focused on reducing power consumption by increasing efficiency at the consumer level, such as switching to LED lighting [2]. At the same time, the concept of wearable devices is also gaining attention, in particular, devices like smart watches, fitness trackers, and smart clothing [3]. At the intersection of these trends is the concept of using PV cells to power wearable applications. However, there are a number of challenges of using PV power for wearables that can be overcome with effective design of the power conversion system.
For grid-connected systems, PV modules are typically connected in series strings with one main central converter to control and process the power. With the series string configuration, it is well known that imbalances in the PV cell powers can result in extremely low system efficiency [4,5,6,7]. Imbalances or mismatch can occur among the PV cells due to manufacturing variance, dust accumulation, partial shading, aging, etc. [8,9]. Thus, great effort is taken to ensure that PV cells are well-matched within modules, to keep the surface free of dust, and to locate modules on roof tops or open locations to prevent partial shading.
Because PV modules are typically connected in series, PV systems are generally thought to be most appropriate for applications where lighting is expected to be uniform. However, this work focuses on enabling PV power for emerging applications where non-uniform light intensities are expected over the PV modules. The key to enabling PV power for non-uniform lighting applications, like wearables, is to reinvestigate the PV module and power converter configuration. Here, a parallel connection, rather than a series one, and the concept of differential power processing (DPP) are utilized to enable PV power for wearable applications.
As mentioned, series-connected PV modules are typically connected to a power converter, which controls a PV string using maximum power point tracking (MPPT) to optimize output power [10,11,12]. In the string, all cells must operate at the same current, but this current is limited by the PV cell receiving the lowest amount of light. Thus, all PV cells cannot operate at their own maximum power point (MPP) when PV cells receive different light intensities and, as a result, output power decreases severely. This power reduction problem commonly occurs in PV systems with long strings of PV cells controlled by one central converter [5,7].
Various converter architectures have been proposed to overcome the output power reduction problem under unbalanced light conditions. Previously, module-integrated converters (MICs) [13,14] and direct current (DC) optimizers [15,16,17] were introduced, where each PV module provides power through a power converter that operates each module individually and independently. An example MIC architecture is shown in Figure 1a. Each PV module can operate at its own MPP regardless of the light imbalance among PV modules. However, the PV module is connected to the grid through the MIC, so the input–output voltage step-up ratio is relatively high. Alternatively, DC optimizers can be used, as shown in Figure 1b. The PV modules are controlled by the DC optimizers, but their outputs are connected in series such that the voltage ratio from the DC optimizer output to the grid is lower than for MICs. MICs and DC optimizers are full power processing (FPP) converters [18,19], where all the power passes through the converter and losses are proportional to the total PV power.
More recently, differential power processing (DPP) converters [20,21,22,23,24,25,26] were introduced as a solution that allows for independent MPPT for each PV module, while decreasing the total input power to the power converters. One of the series DPP configurations for series-connected PV modules is shown in Figure 1c, referred to as series DPP. The majority of the existing literature is for series DPP, where the fundamental connection of the PV modules is in series. Series DPP converters are able to compensate for even extreme light differences, but in some cases the DPP converters process a significant amount of power to achieve individual MPPT [27], which is a limitation of the architecture.
An alternative DPP architecture is to use parallel DPP converters, as shown in Figure 1d. Based on the operating characteristics of PV cells, the voltage characteristics are less sensitive to extreme light differences than the current characteristics [28,29,30]. This indicates that when extreme light differences are expected, parallel connection is more advantageous for maximizing the power from each cell. Some potential converter topologies for parallel DPP converters have been explored in Reference [31], but the design, implementation, and control methods still need in-depth investigation.
This work focuses on the system design and analysis of a PV-powered wearable bag application to charge battery-powered consumer devices [32]. This paper explains and analyzes the operation of the target parallel DPP system, including the battery load impedance characteristics, PV modules, and system control considerations, in Section 2. Section 3 shows detailed simulation results of the system to determine the most effective DPP configuration and control strategy. The findings are summarized and concluded in Section 4.

2. Design and Methodology

In this section, the basic concept of the PV-powered bag is introduced and power loss in two parallel DPP converter configurations are compared. The characteristics of the battery load and PV modules are also analyzed. Potential MPPT control algorithms for the PV system are introduced.

2.1. PV-Powered Bag Application

The target wearable application is a 5 W PV-powered bag used to charge mobile devices, such as a phone or portable battery. The basic PV-powered bag concept is shown in Figure 2, where small PV modules are placed on the outside of a fabric bag and power converters and a charging cable are installed inside the bag. The PV-powered bag consists of four 1.23 W PV modules that together produce approximately 4.9 W under standard test conditions (air mass of 1.5, solar irradiance of 1000 W/m 2 , and cell temperature of 25 C). The nominal output voltage is 5 V and the load is a portable battery that is connected to the PV-powered bag through a standard USB connector.
Due to the flexible nature of the bag material, the PV modules may point in different directions and receive different light intensity levels. Further, some of the PV modules may be shaded by the user’s arm or experience partial shading during use. In other words, wearable applications cannot avoid lighting mismatch. If a traditional series string configuration is implemented, the output power will be extremely low due to light irradiance mismatch.
This mismatch problem can be overcome in the power converter system design using DPP converters. Previous work in Reference [33], compared both series and parallel architectures with and without DPP converters for this PV-powered wearable bag application. It was found that the parallel DPP converter architecture, shown in Figure 1d, exhibited the highest system efficiency among several configurations, when tested in various realistic cases. This DPP architecture maximizes the system output with the highest overall system efficiency under unbalanced lighting conditions.
There are multiple approaches to implementing parallel DPP converters. The authors in Reference [31] explored two main configurations for the parallel DPP architecture: with and without a front-end converter. The purpose of the front-end converter is to bring down the DC bus voltage to a middle voltage so that the duty ratio of each converter is not too low. With a front-end converter, a buck converter topology can be used because it allows for high efficiency and small size. Without a front-end converter, a flyback converter can be used where the turns ratio is utilized to avoid extremely low duty ratios. The parallel DPP system without a front-end converter is shown in Figure 3a and the system with a front-end converter is shown in Figure 3b. The decision of whether or not to use a front-end converter in a target wearable application requires further analysis to determine the best approach.

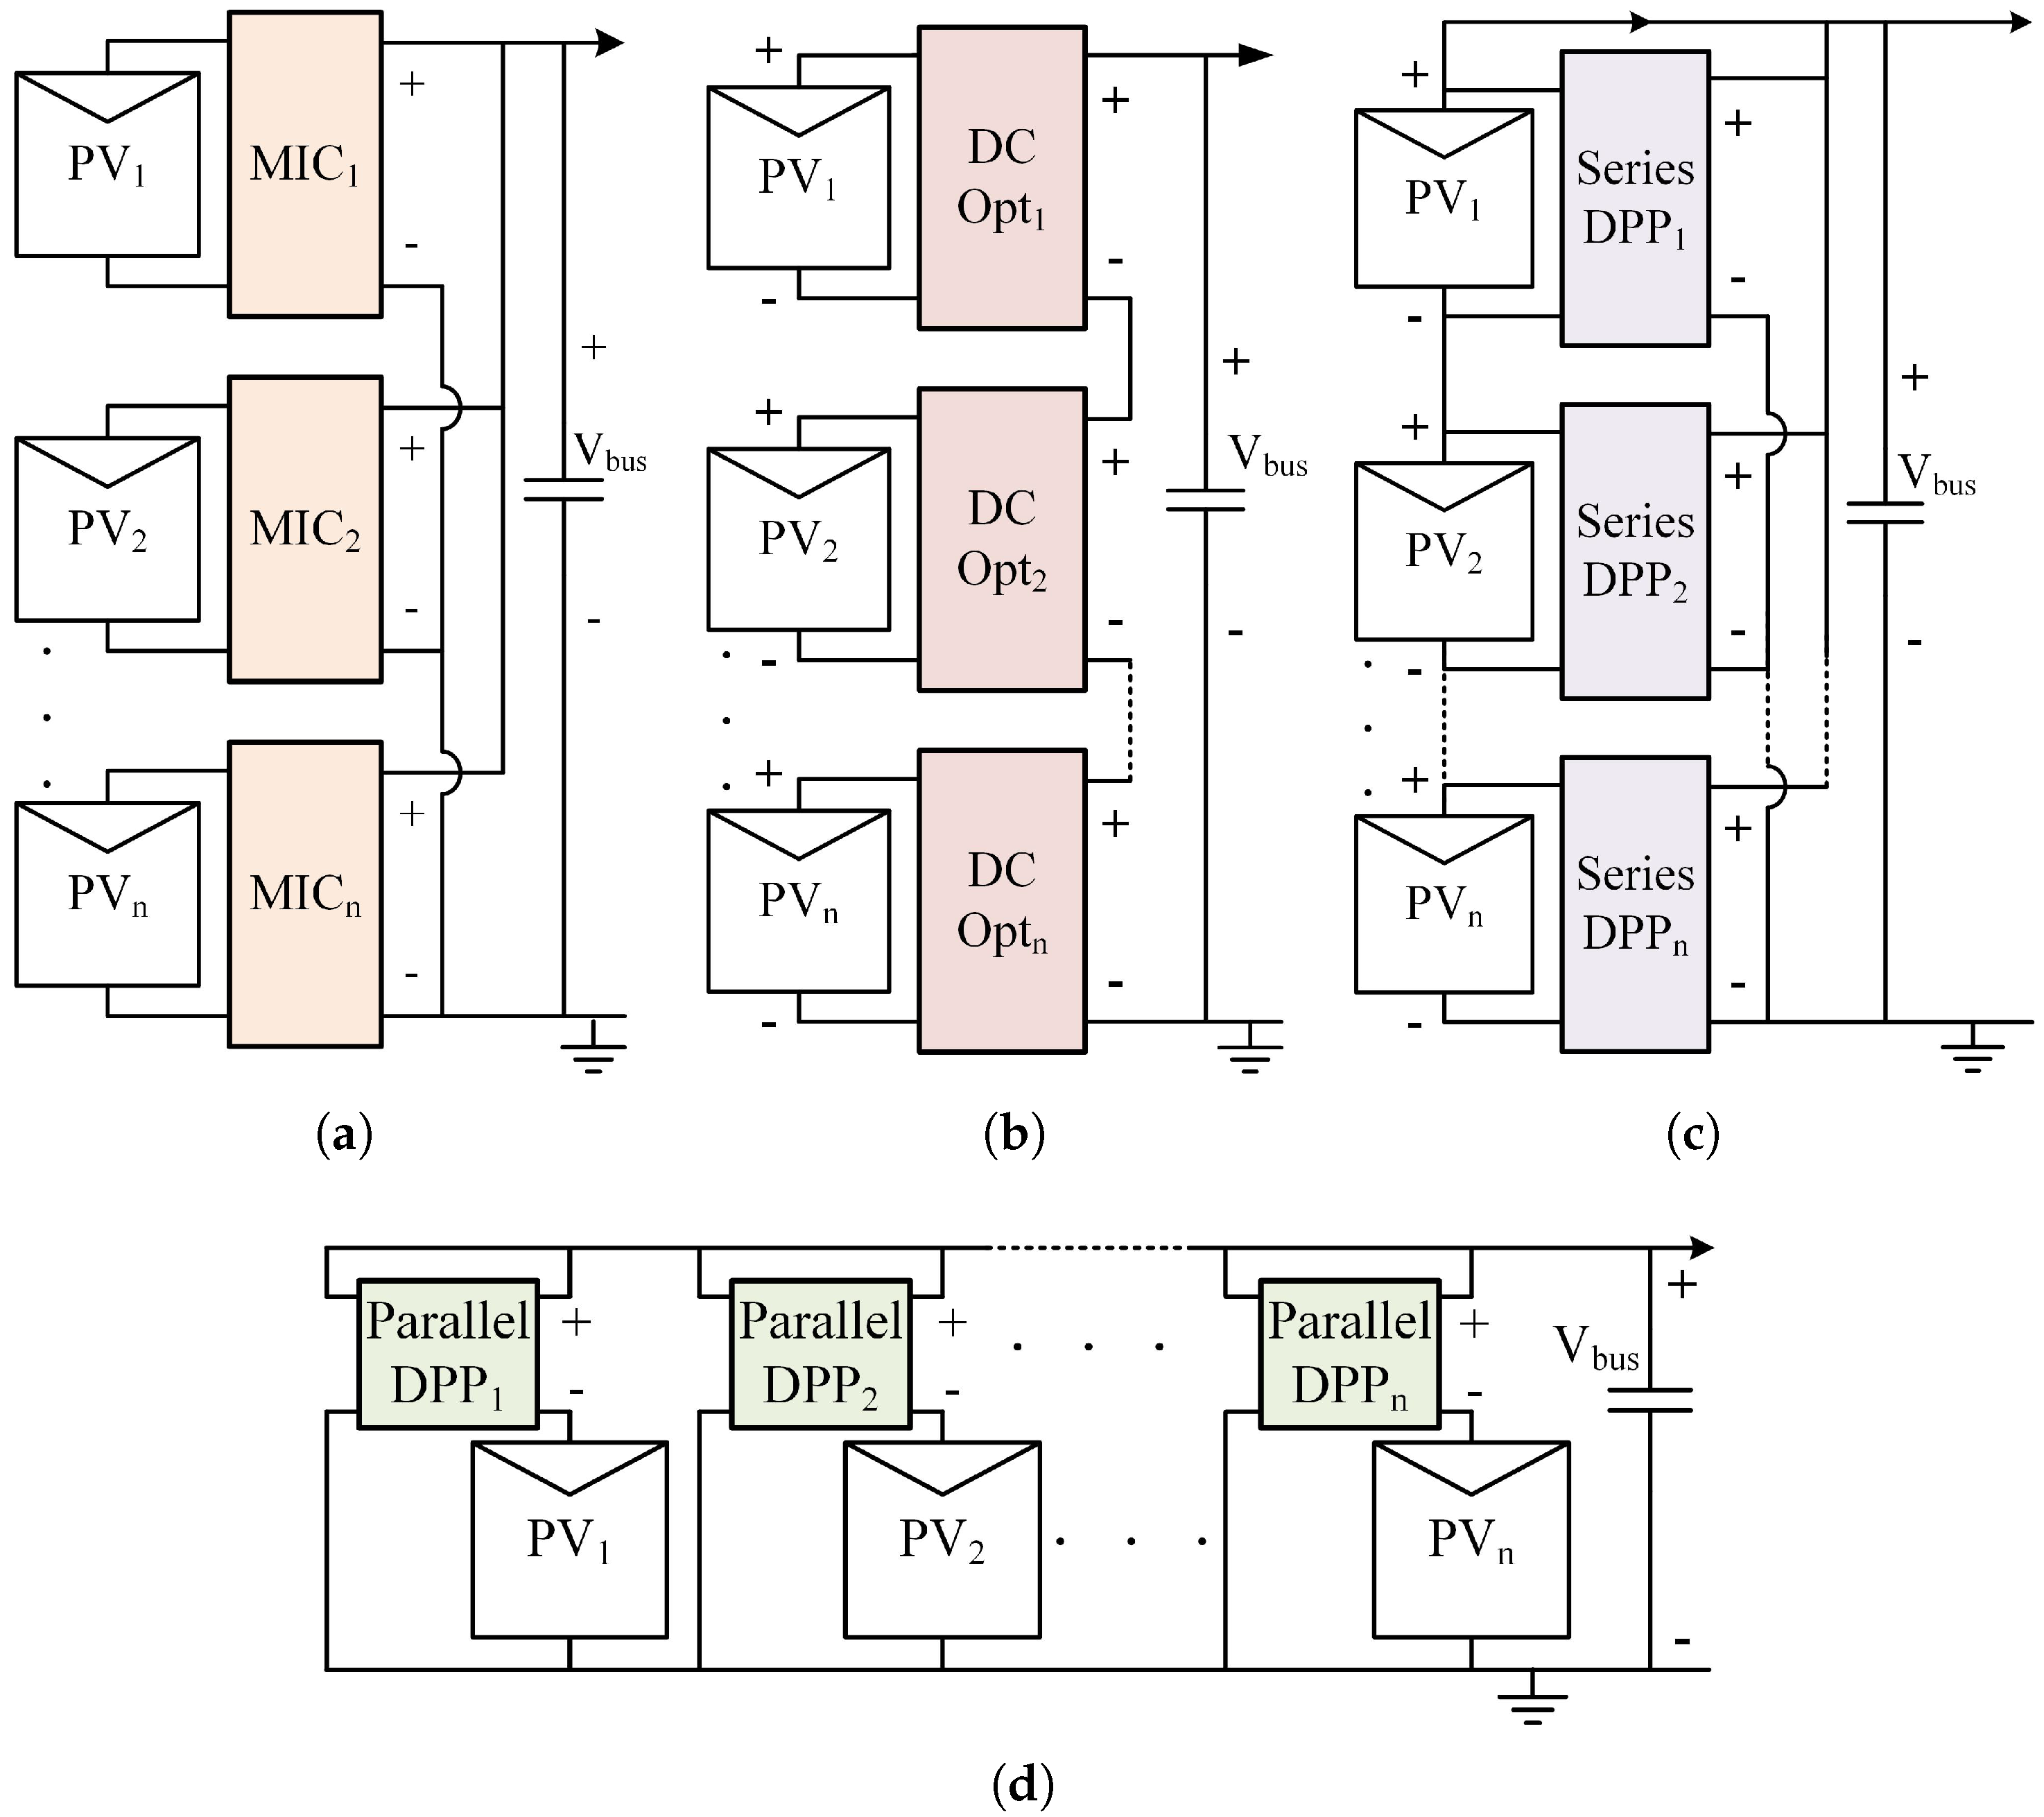
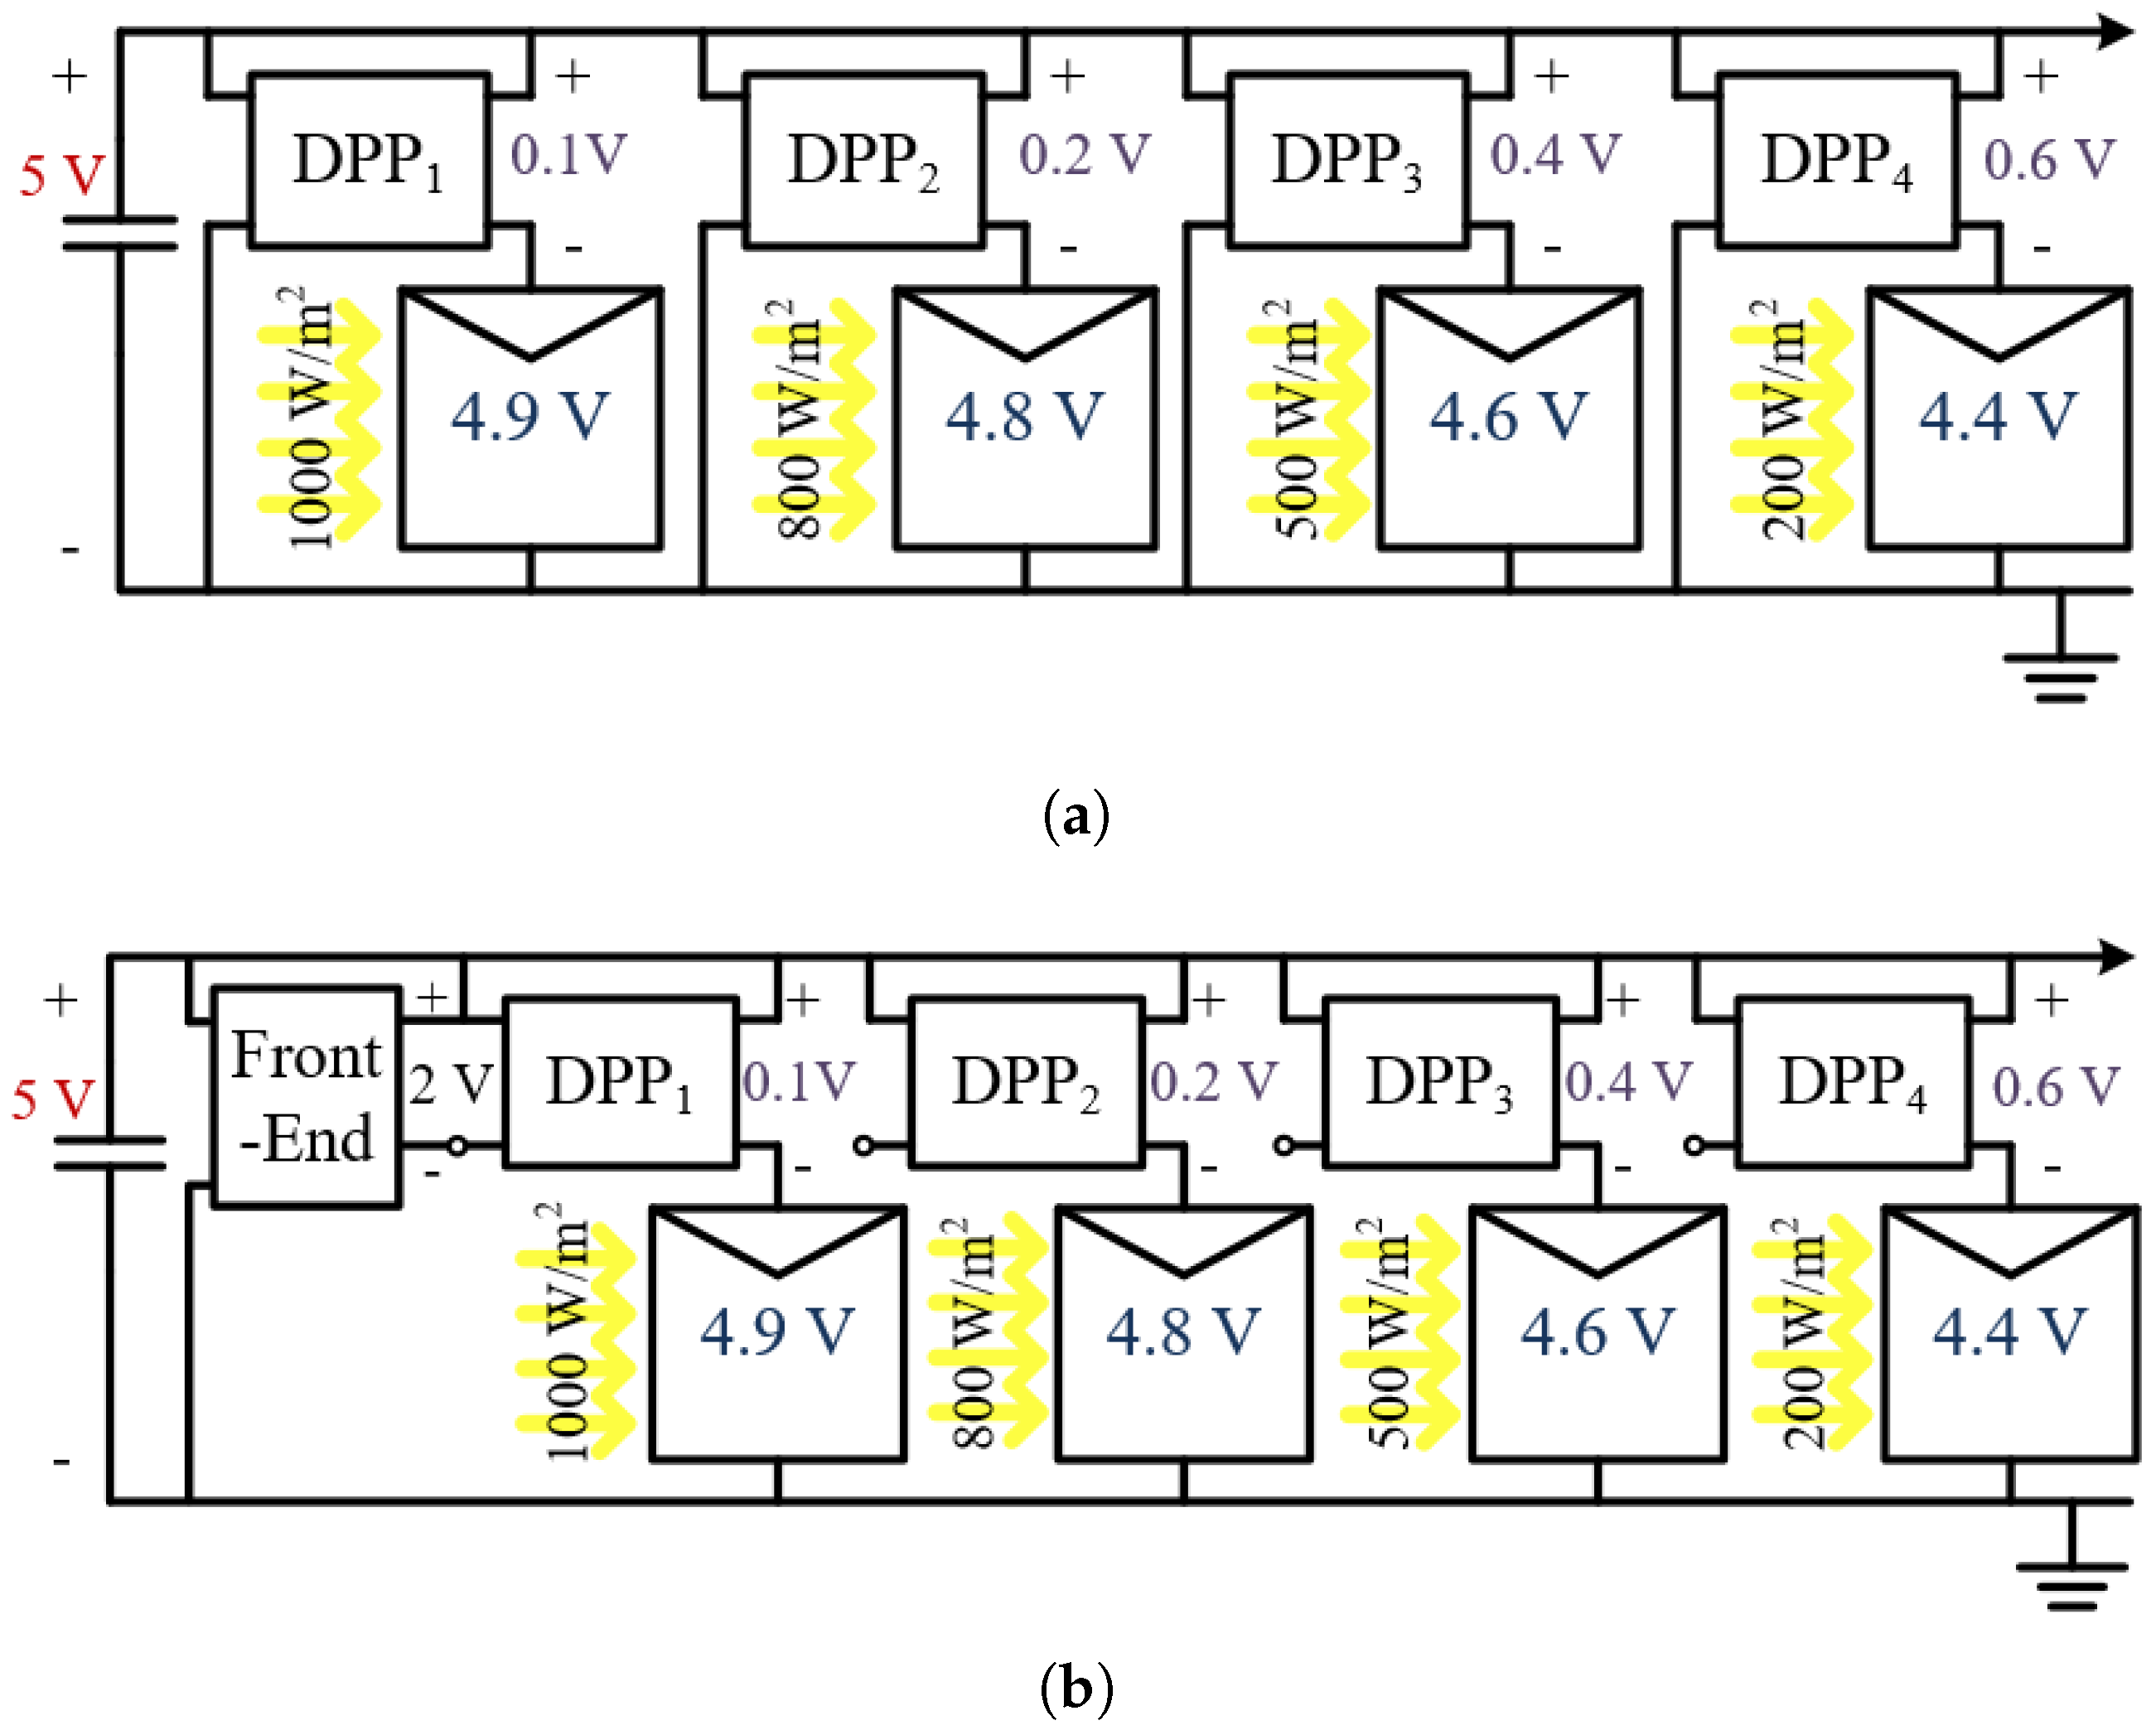
2.2. Parallel DPP System Analysis

The main advantage of DPP systems is that they have high system efficiency because each PV module is able to operate at its MPP under any sunlight condition, while the processed power and resulting power loss in the converters is very small. MIC and DC optimizers are FPP converters, such that the converter power loss [33] is:
P l o s s , f p p = V p v I p v ( 1 η c o n v ) ,
where V p v is the PV voltage, I p v is the PV current, and η c o n v is converter efficiency. For the parallel DPP architecture, shown in Figure 3, the power loss generated in the DPP converter is:
P l o s s , d p p = ( V d c V p v ) I p v 1 η c o n v η c o n v ,
where V d c is DC bus voltage. According to Equation (2), when the voltage difference between V d c and V p v is small, the power loss is also small. For the parallel DPP configuration with a front-end converter, shown in Figure 3b, the power loss in the front-end converter [32] is:
P l o s s , f e = 1 η f e η c o n v η f e i = 1 n ( V d c V p v , i ) I p v , i ,
where η f e is the efficiency of the front-end converter. Note that the power loss highly depends on the converter efficiency which, in turn, highly depends on the converter topology and how the specific topology processes power through the components of the converter [34].
As an example, assume the light intensity conditions are as shown in Figure 4, where the intensity is different for each PV module. Each module is controlled by a DPP converter and operates at its individual MPP voltage, which varies with light intensity. Assume that V d c is 5 V and that both η c o n v and η f e are 80%. The PV voltage and current values are based on datasheet values of the PV modules used in the design. In Figure 4b, the front-end converter output voltage is 2 V.
To illustrate the advantages of parallel DPP architectures, power losses for FPP converters, DPP parallel converters without a front-end converter, and DPP parallel converters with a front-end converter are compared based on the example setup given in Figure 4. The PV voltages and currents were calculated based on the different irradiance levels using a PV model implemented in Matlab [29]. The resulting voltages are shown in Figure 4 and the currents are 0.25, 0.20, 0.12, and 0.04 A for PV 1, 2, 3, and 4, respectively.
Table 1 shows the power loss comparison between the FPP and parallel DPP converter configurations. Under the given sunlight condition, it is assumed that every PV module operates at its own MPP. However, the FPP converters process 100% of the PV power such that the total power loss in the FPP converters is much higher than that of the DPP converters. Conversely, DPP converters process only a small fraction of PV power such that the total power loss in the DPP converters is 15 times smaller than the FPP converters. Although the produced power from the PV modules are the same in all cases, the system output power in the parallel DPP systems are significantly higher than the FPP system. Between the two parallel DPP configurations, the system with the front-end converter has an additional power conversion stage, which increases overall losses. However, the additional voltage stage allows the output of the DPP converter to properly operate at very low voltages without control problems due to a very small duty ratio.
For the same irradiance example, the converter efficiency was varied from 60% to 100% in simulation to determine the overall system efficiency. Figure 5 shows how the system efficiency changes for both parallel DPP architectures and the FPP architecture. When the converter efficiency is 80%, the system efficiency of the DPP system without a front-end converter is 98.76% and with the front-end converter is 97.20%. Using the latter as a point of comparison, as shown by the horizontal dotted line in Figure 5, an FPP converter would have to be at least 97% efficient to reach the same system efficiency. On the other hand, the parallel DPP system without a front-end converter would only need to be 64% efficient for the same system efficiency.

2.3. Battery Impedance

The target load for the PV-powered bag is a Li-ion battery in a portable battery or mobile device, requiring nominal 5 V USB voltage. However, the charging characteristics and impedance of the battery depend on the state of charge (SOC). The battery impedance affects the charging characteristics and the DC bus voltage in the system. For safety, a Zener diode is used to prevent the DC bus from exceeding 5.1 V, such that the bus voltage will not over-voltage and damage the load. However, charging can occur at lower voltages, depending on the battery impedance.
In this design, a 6500 mAh portable battery is used as the load and its measured charging characteristics are shown in Figure 6. As shown, the output current must be larger than approximately 0.4 A to begin charging the battery. The minimum charging voltage decreases with decreasing SOC. At 20% SOC the DC bus voltage must exceed 3.8 V to begin charging at 0.37 A, which is 1.4 W of power. Based on the DPP parallel topology, the PV voltage must always be lower than the DC bus voltage. Note that if the the DC bus voltage is lower than the MPP of the PV module, MPPT is not achieved and they may not generate sufficient power to charge the battery. Thus, in order to charge the battery at lower SOC and at lower input power levels (lower irradiance conditions), a PV module with an MPP at or below 3.8 V should be selected.
However, the power loss in DPP converters is proportional to the voltage difference between V d c and V p v , according to Equation (2). From a system-efficiency perspective, it is better to have the PV module MPP voltage just slightly lower than the DC bus voltage, which is nominally 5 V. However, this means that the system may not be able to charge the battery when it is at low SOC or low input power conditions. This is a fundamental trade-off between charging capability and converter loss, which are further analyzed in Section 3.1.

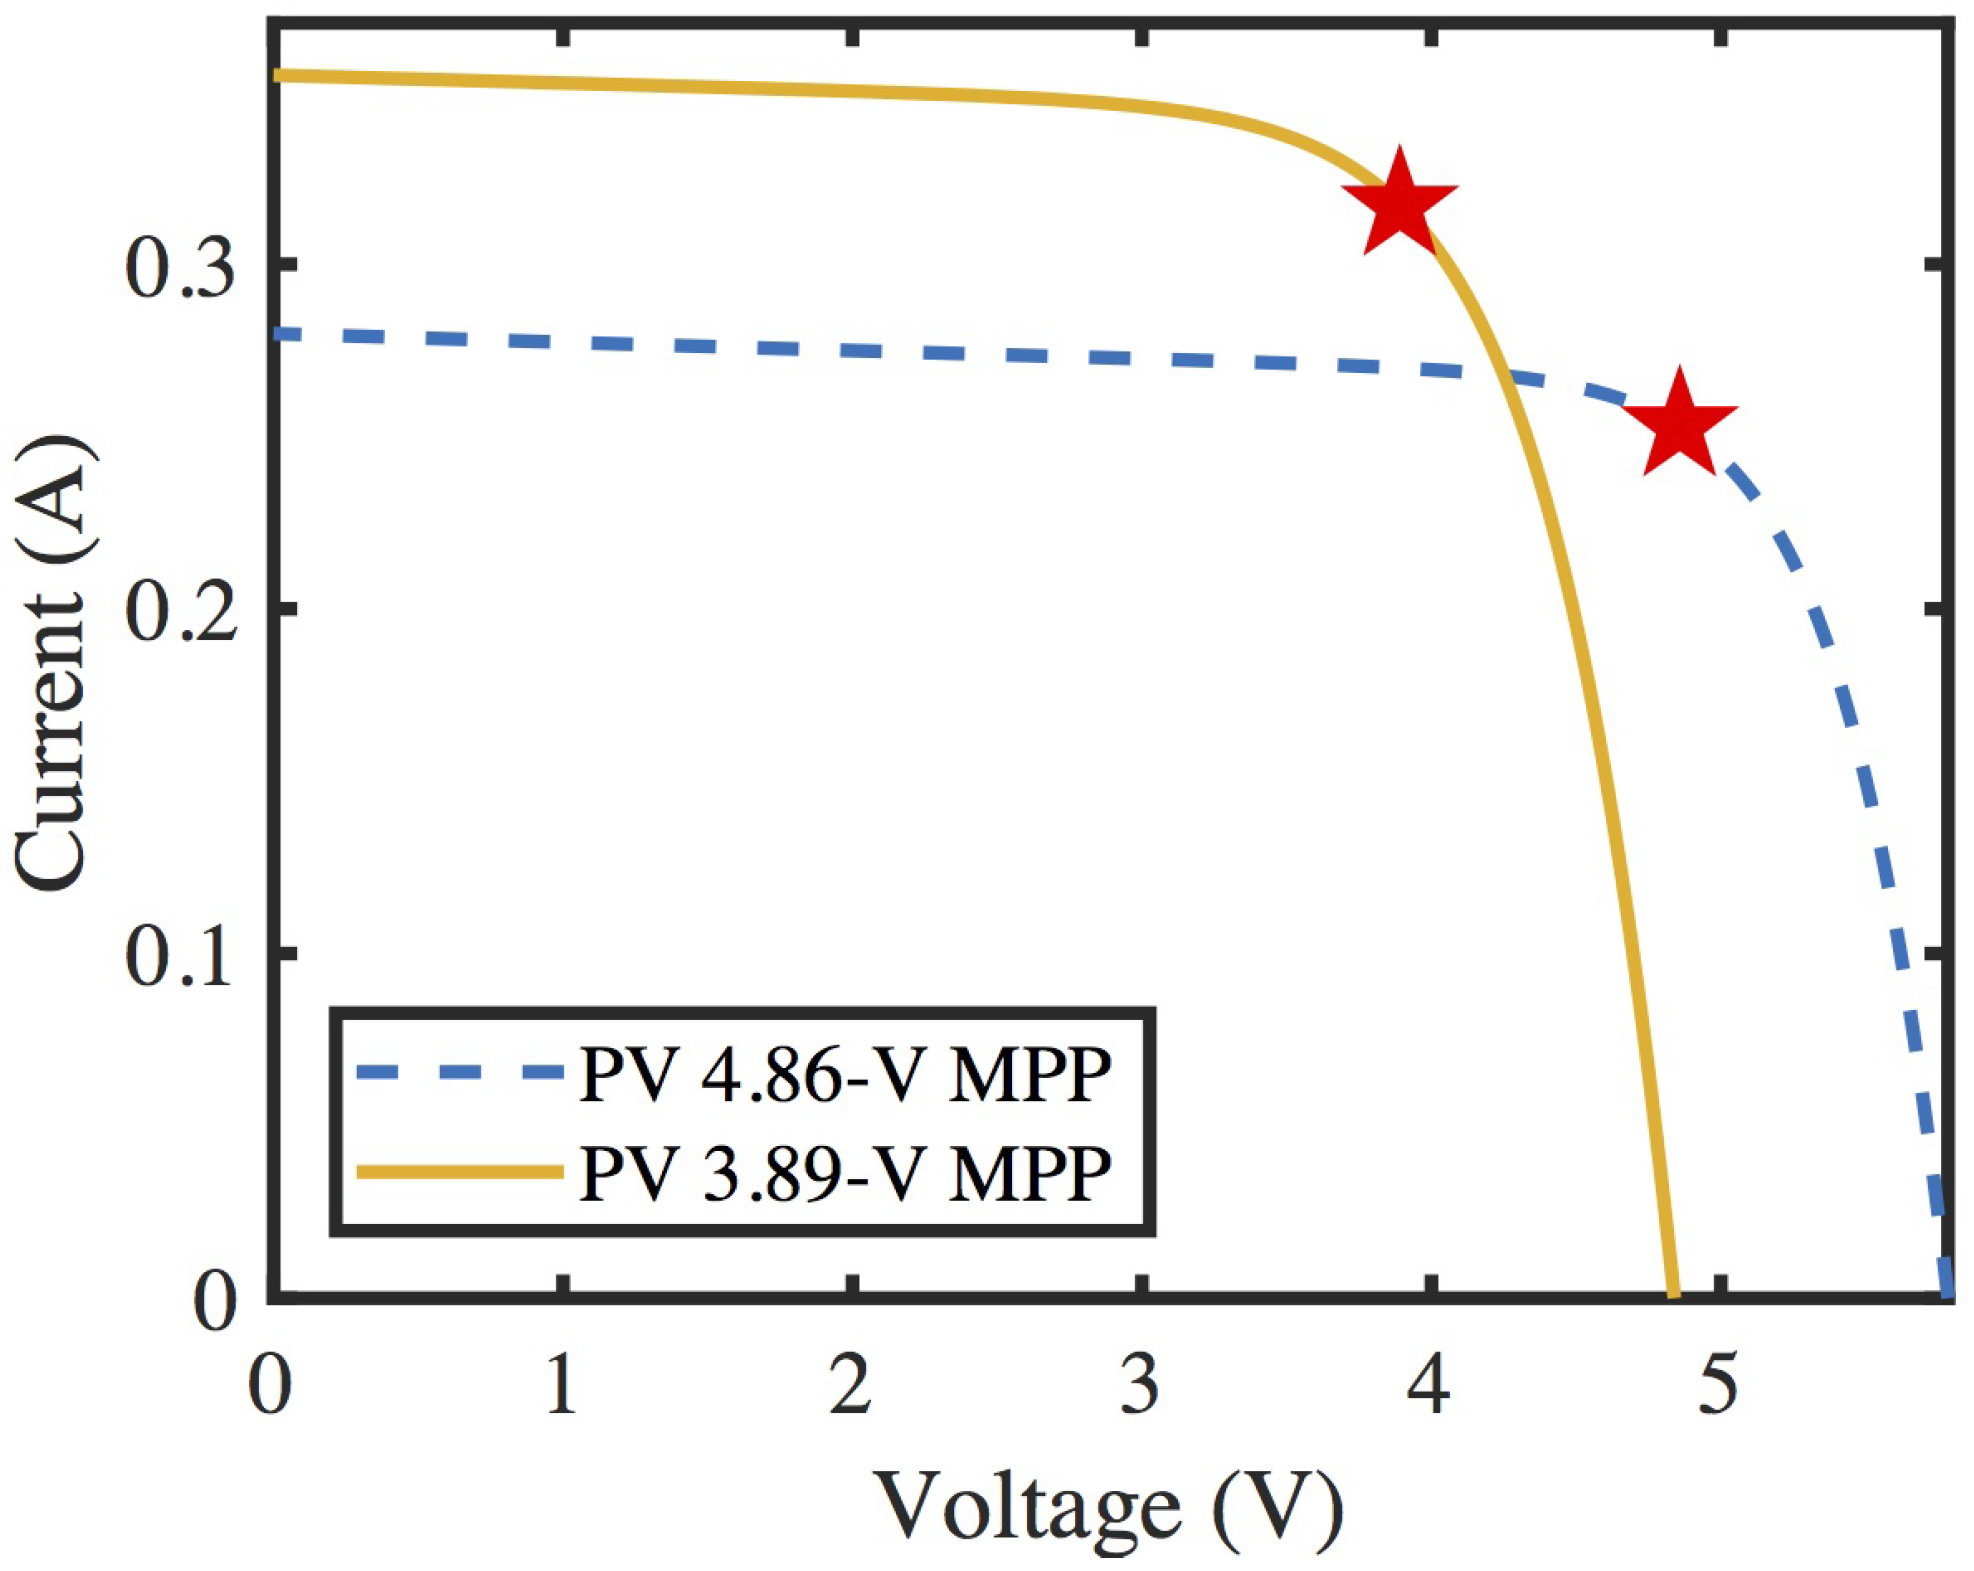
2.4. PV Module Selection

As mentioned, the MPP voltage of the PV modules affects the battery charging voltage range and the system power efficiency. Under nominal sunlight when there is sufficiently high input power, the battery charges near the rated power and the DC bus voltage is close to 5 V. When the PV voltage at MPP is close to the DC bus voltage, power loss in the DPP converters is lower. However, when there is partial shading or low irradiance, the DC bus voltage must be lower to charge the battery at a lower power level, as was shown in Figure 6. In this condition, the DC bus voltage must still be higher than the PV MPP voltages to maximize PV power. If the DC bus voltage is lower than the PV MPP voltage, the PV module still produces power but not at MPP. In some cases, the total produced PV power might be too low to charge the battery.
For the PV-powered bag design, two PV module specifications are considered: (1) a PV MPP voltage close to the nominal DC bus voltage and (2) a lower MPP voltage near the minimum battery charging voltage. Two PV modules types with different current–voltage (I–V) characteristics are selected, as shown in Figure 7. The two PV modules have the same maximum power of 1.23 W under standard testing conditions, but have different MPP voltages, shown with a red star in Figure 7. The first PV has a nominal MPP at 4.86 V and 0.25 A, such that the MPP is close to the 5 V DC bus voltage. The second PV has an MPP at 3.89 V and 0.32 A, such that the MPP is closer to the 3.8 V minimum charging voltage.

2.5. Parallel DPP Configuration Considerations

Two parallel DPP configurations, with and without a front-end converter, were introduced in Section 2.1. The most appropriate DPP configuration depends on the MPP voltage of the selected PV module. For the 4.86 V PV module, if the DPP configuration without the front-end converter is used, the nominal output voltage of the DPP converter is 0.14 such that the step-down voltage ratio is 0.03. This small duty ratio can lead to control challenges, especially with low-cost, lower-performance micro-controllers used in many commercial applications. For this reason, the parallel DPP system with a front-end converter is more appropriate for the higher-voltage PV module. The front-end converter steps down the DC bus voltage to 2 V, which is connected to the input of each DPP converter. Then, the DPP converters step down from 2 V to the voltage difference between V d c and V p v . From the 2 V input voltage, the DPP converter step-down ratio is 0.07, which is more manageable.
For the 3.89 V PV module, if the DPP configuration without the front-end converter is used, the nominal output voltage of the DPP converter is 1.11 V such that the step-down voltage ratio is 0.22. This duty ratio is manageable, such that a front-end converter is not needed. Thus, the parallel DPP configuration with a front-end converter is most appropriate for the lower-voltage PV module. Thus, there are two potential DPP converter designs for the PV-powered bag application: (1) higher-voltage PV module with a front-end converter and (2) lower-voltage PV module without a front-end converter. The most appropriate design is analyzed and discussed in Section 3.1.

2.6. Maximum Power Point Tracking Control

MPPT algorithms are employed in the power converters that control PV modules to maximize generated power. There are numerous MPPT algorithms that vary in terms of accuracy, complexity, number of sensors, and processing power [35]. Algorithms that are simple, require fewer sensors, and have low processing power are more appropriate for PV-powered wearables because they tend to be low-power and low-cost applications. Also, because wearable applications move around in an environment, the irradiance level on the PV modules can change rapidly. An effective MPPT algorithm would quickly adapt to rapid light changes while maintaining PV operation close to the MPP. For the target application, three MPPT algorithms are considered: (1) constant voltage at the rated MPP, (2) perturb and observe (P&O) [35], and (3) voltage-offset resistive control (VRC) [36].
Constant voltage at the rated MPP voltage has one of the simplest implementations. It requires only a voltage sensor and basic feedback control can be employed in the DPP converter to maintain the PV voltage at the set value. However, this type of control does not seek the true MPP of the PV module [12]. If the irradiance or temperature varies from standard test conditions, the MPP will not be exactly at the rated voltage. Further, as the PV cells age or the module surface wears, the PV characteristics will shift away from the rated values. Even if constant voltage control does not maintain operation exactly at the MPP, it is still near the MPP and will produce a majority of the potential PV power. Thus, constant voltage control trades off very simple implementation with sub-optimal PV power output.
P&O is one of the most commonly used MPPT algorithms in commercial PV systems [35]. It can be easily implemented on a digital micro-controller and seeks the true MPP of the PV module. However, it requires both a voltage and current sensor, which increases the implementation cost and power consumption needed for control. P&O works by perturbing the system, usually a step in the voltage reference value, and then observing how the PV power changes. If power increases, the steps continue in the same direction, but if the power decreases, the next step changes to the opposite direction. Accordingly, the operating point is always changing to follow the true MPP of the PV module, but does not maintain operation at the exact MPP. Thus, P&O has fairly simple implementation while operating around the true MPP.
VRC is an MPPT algorithm developed for quickly reacting to fast changes in illumination [36]. It also requires a voltage and current sensor, and can be implemented on a digital micro-controller. VRC operates the PV along a control line that intersects the PV module near the MPP for a range of irradiance values. The control line is determined by an offset voltage value and an equivalent resistance value, which should be calibrated to the specific PV module used in the design. Figure 8 shows the best VRC parameters for the PV module with its MPP at 3.89 V, where the control line follows the changing MPP at different irradiance values. VRC has the same implementation requirements as P&O, but may exhibit sub-optimal PV power output if the PV characteristics shift due to significant temperature changes, aging, or wear. These MPPT algorithms will be further analyzed and compared in Section 3.3.

3. Results and Discussion

The two parallel DPP configurations (with and without a front-end converter) are compared in detail to select the best power converter design for the target application. The three different MPPT algorithms are also compared through simulation and the trade-offs of each are discussed.

3.1. Parallel DPP Configuration Comparison

The two parallel DPP designs are analyzed to compare their performance under various conditions. Six irradiance test cases are chosen for the four PV modules, which are outlined in Table 2. Case 1 represents a sunny day with only slight variation across the modules, to emulate when the bag surface is flat. Case 2 represents a sunny day but with more significant variation across the PV modules, to emulate when the bag surface is rounded. Case 3 represents a sunny day with one PV module heavily shaded, emulating when something is partially blocking the bag surface. Cases 4, 5, and 6 are the same conditions as Cases 1, 2, and 3, respectively, but for a partially cloudy day.
The six irradiance test cases were implemented in Matlab to determine their total system power and efficiency. The parallel DPP design with a front-end converter uses the higher-voltage PV modules (4.86 V/0.25 A) and the system without a front-end converter uses the lower-voltage PV modules (3.89 V/0.32 A). The PV modules are modeled using a basic PV model implemented in Matlab [29]. For a direct comparison, the converter efficiency of both the front-end converter and DPP converters are assumed to be 80%. The battery at SOC 20% is used as the output load, such that the DC bus voltage changes depending on the battery impedance and system output power. Note that if the DC bus voltage is lower than the PV MPP, it is assumed that the corresponding DPP converter is tuned off such that the PV voltage is equivalent to the DC bus voltage.
Figure 9 shows the results of the simulation for each irradiance test case, comparing the two different parallel DPP designs. Figure 9a shows the system’s output power for each case and Figure 9b shows the overall system efficiency, which is the output load power over the total PV input power. The DPP system with a front-end converter shows higher output power and system efficiency for Case 1, when the modules receive near nominal power and fairly uniform light. This is because the higher-voltage PV module voltages are close to the DC bus voltage under nominal irradiance, such that very little power is processed through the DPP converters.
However, the parallel DPP design without a front-end converter shows higher system power and higher efficiency for the remaining cases. This is because Cases 2 to 6 represent situations where the DC voltage bus must be lower to properly charge the battery load at the lower input power level. In these cases, the lower-voltage PV modules operate closer to their MPP, which reduces the amount of power that is processed. Further, differential power is only processed through one power stage (DPP converter), rather than two stages (front-end and DPP converter), reducing converter losses. Note that in Case 5, the required DC bus voltage for the front-end converter design is lower than the minimum charging voltage for the battery such that it cannot charge, but the design without a front-end converter is still able to charge the battery load. Performance aspects for both designs are compared in Table 3.
If the irradiance conditions are at nominal and uniform irradiance, the higher-voltage PV module with a front-end converter is the better design. However, the PV-powered bag application will frequently experience uneven lighting and partial shading. From a usability perspective, it is best to ensure that the system can charge the battery over a wide range of irradiance conditions. Therefore, this analysis shows that the lower-voltage PV modules and parallel DPP system without a front-end converter is the more appropriate design for the PV-powered bag application.

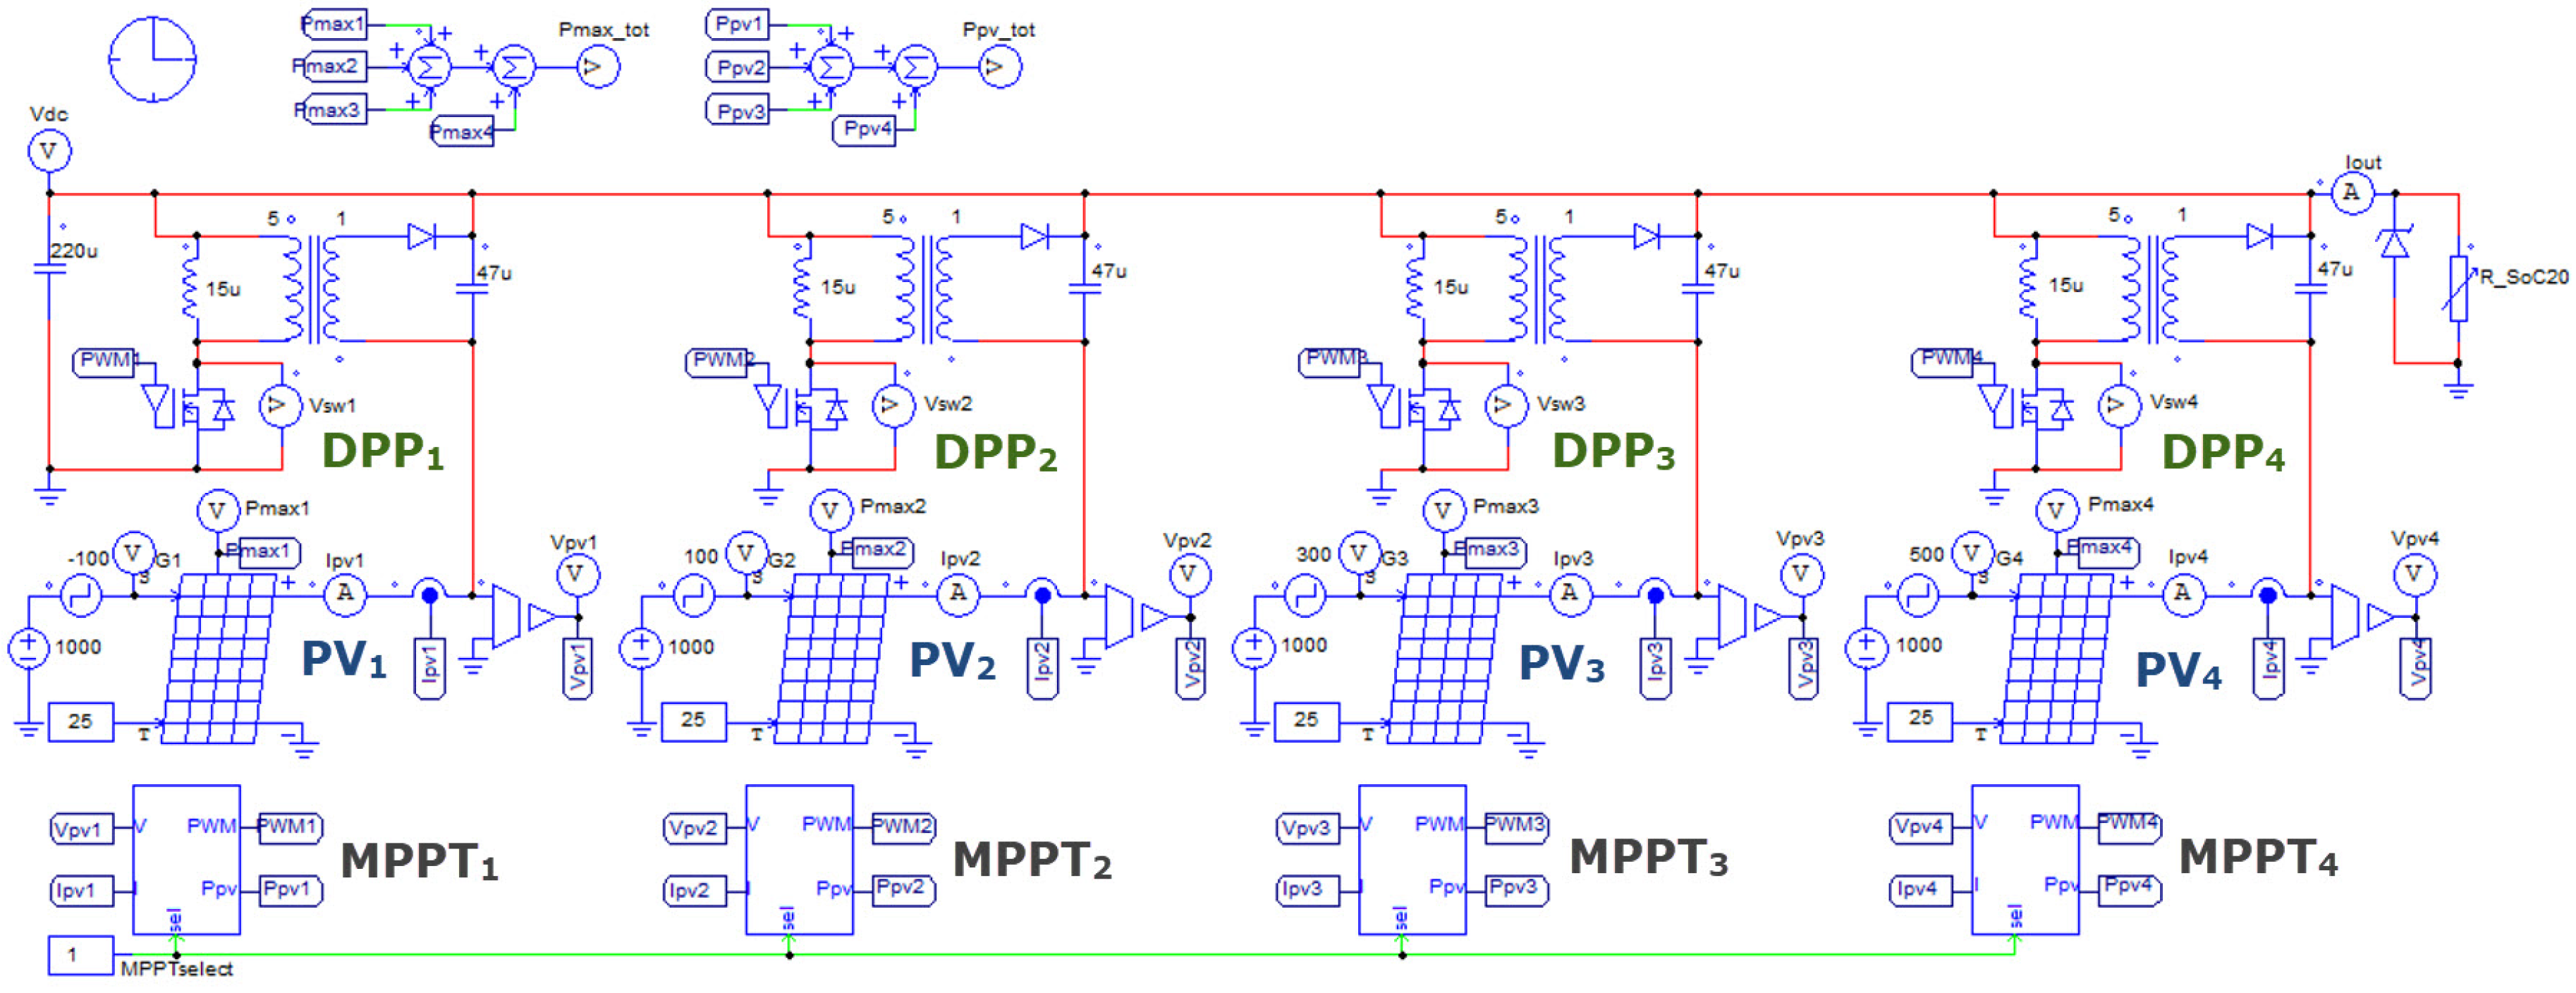
3.2. Simulation Setup

To investigate the parallel DPP system without a front-end converter using the lower-voltage PV modules, dynamic simulations are setup using PSIM software (POWERSIM, Rockville, MD, USA) which is a circuit simulator used for modeling switching power converters. The circuit diagram is shown in Figure 10, where there are four parallel DPP flyback converters switching at 100 kHz, four PV modules modeled using the ‘Solar module (physical model)’ function block with MPP at 3.89 V and 0.32 A, four MPPT controllers, and the output load is a variable resistance that emulates the battery impedance at 20% SOC. The MPPT algorithm is implemented in a code block and either constant voltage, P&O, or VRC can be selected. The constant voltage control is set to the rated MPP voltage of 3.89 V. The P&O algorithm has a voltage step size of 0.1 V and perturbs the voltage reference at a 1 kHz frequency. The VRC algorithm has a voltage offset of 3.4 V and an equivalent resistance of 1.5 Ω .
This simulation setup is used to confirm proper operation of the DPP converters and compare the three MPPT algorithms after a sudden irradiance change. At first, all PV modules receive 1000 W/m 2 irradiance until the DPP converters operate in steady state. After 50 ms, irradiance is changed to 1100 W/m 2 , 900 W/m 2 , 700 W/m 2 , and 500 W/m 2 for PV 1, 2, 3, and 4, respectively. Figure 11 shows the irradiance change used in the simulations.

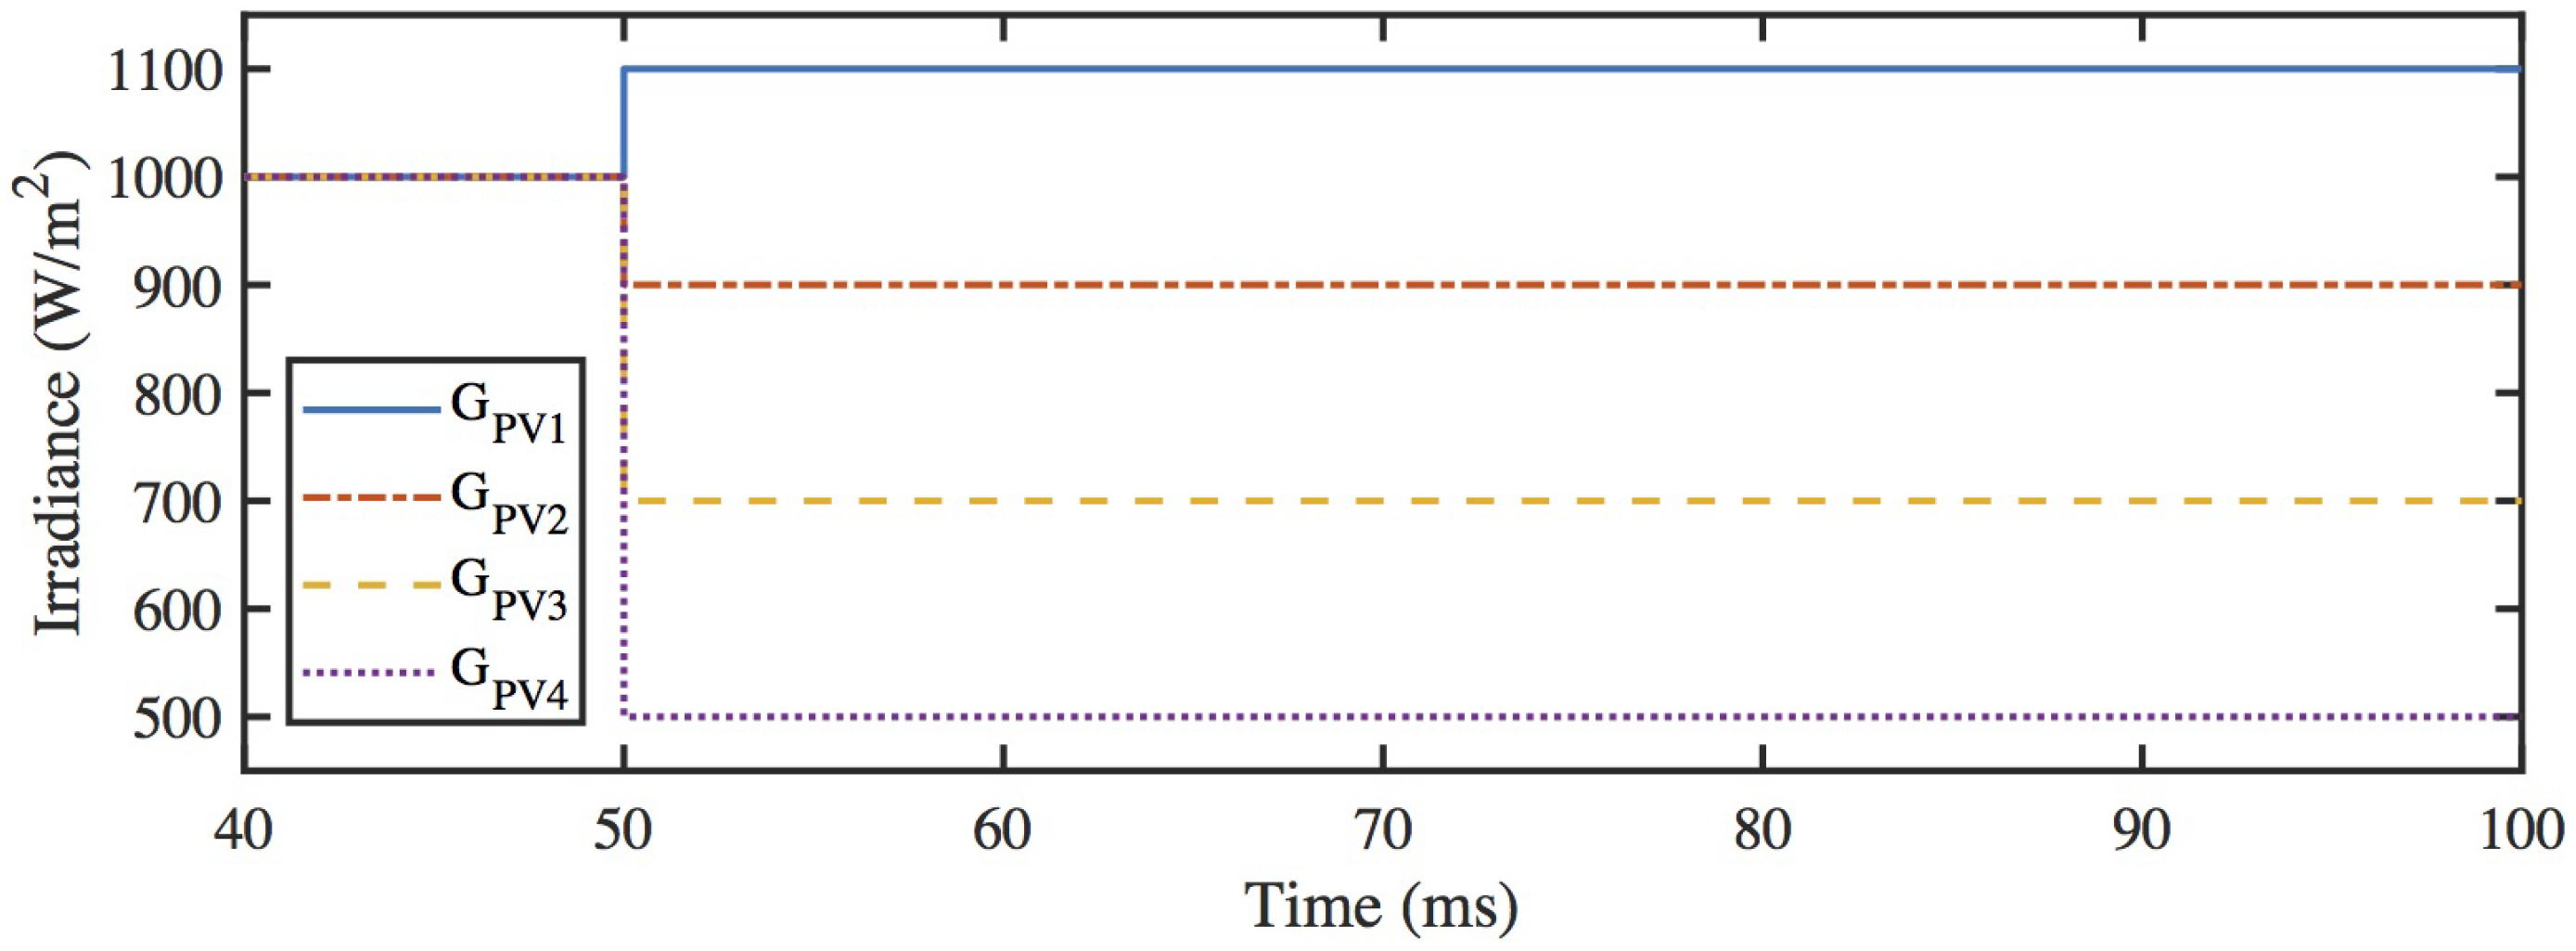
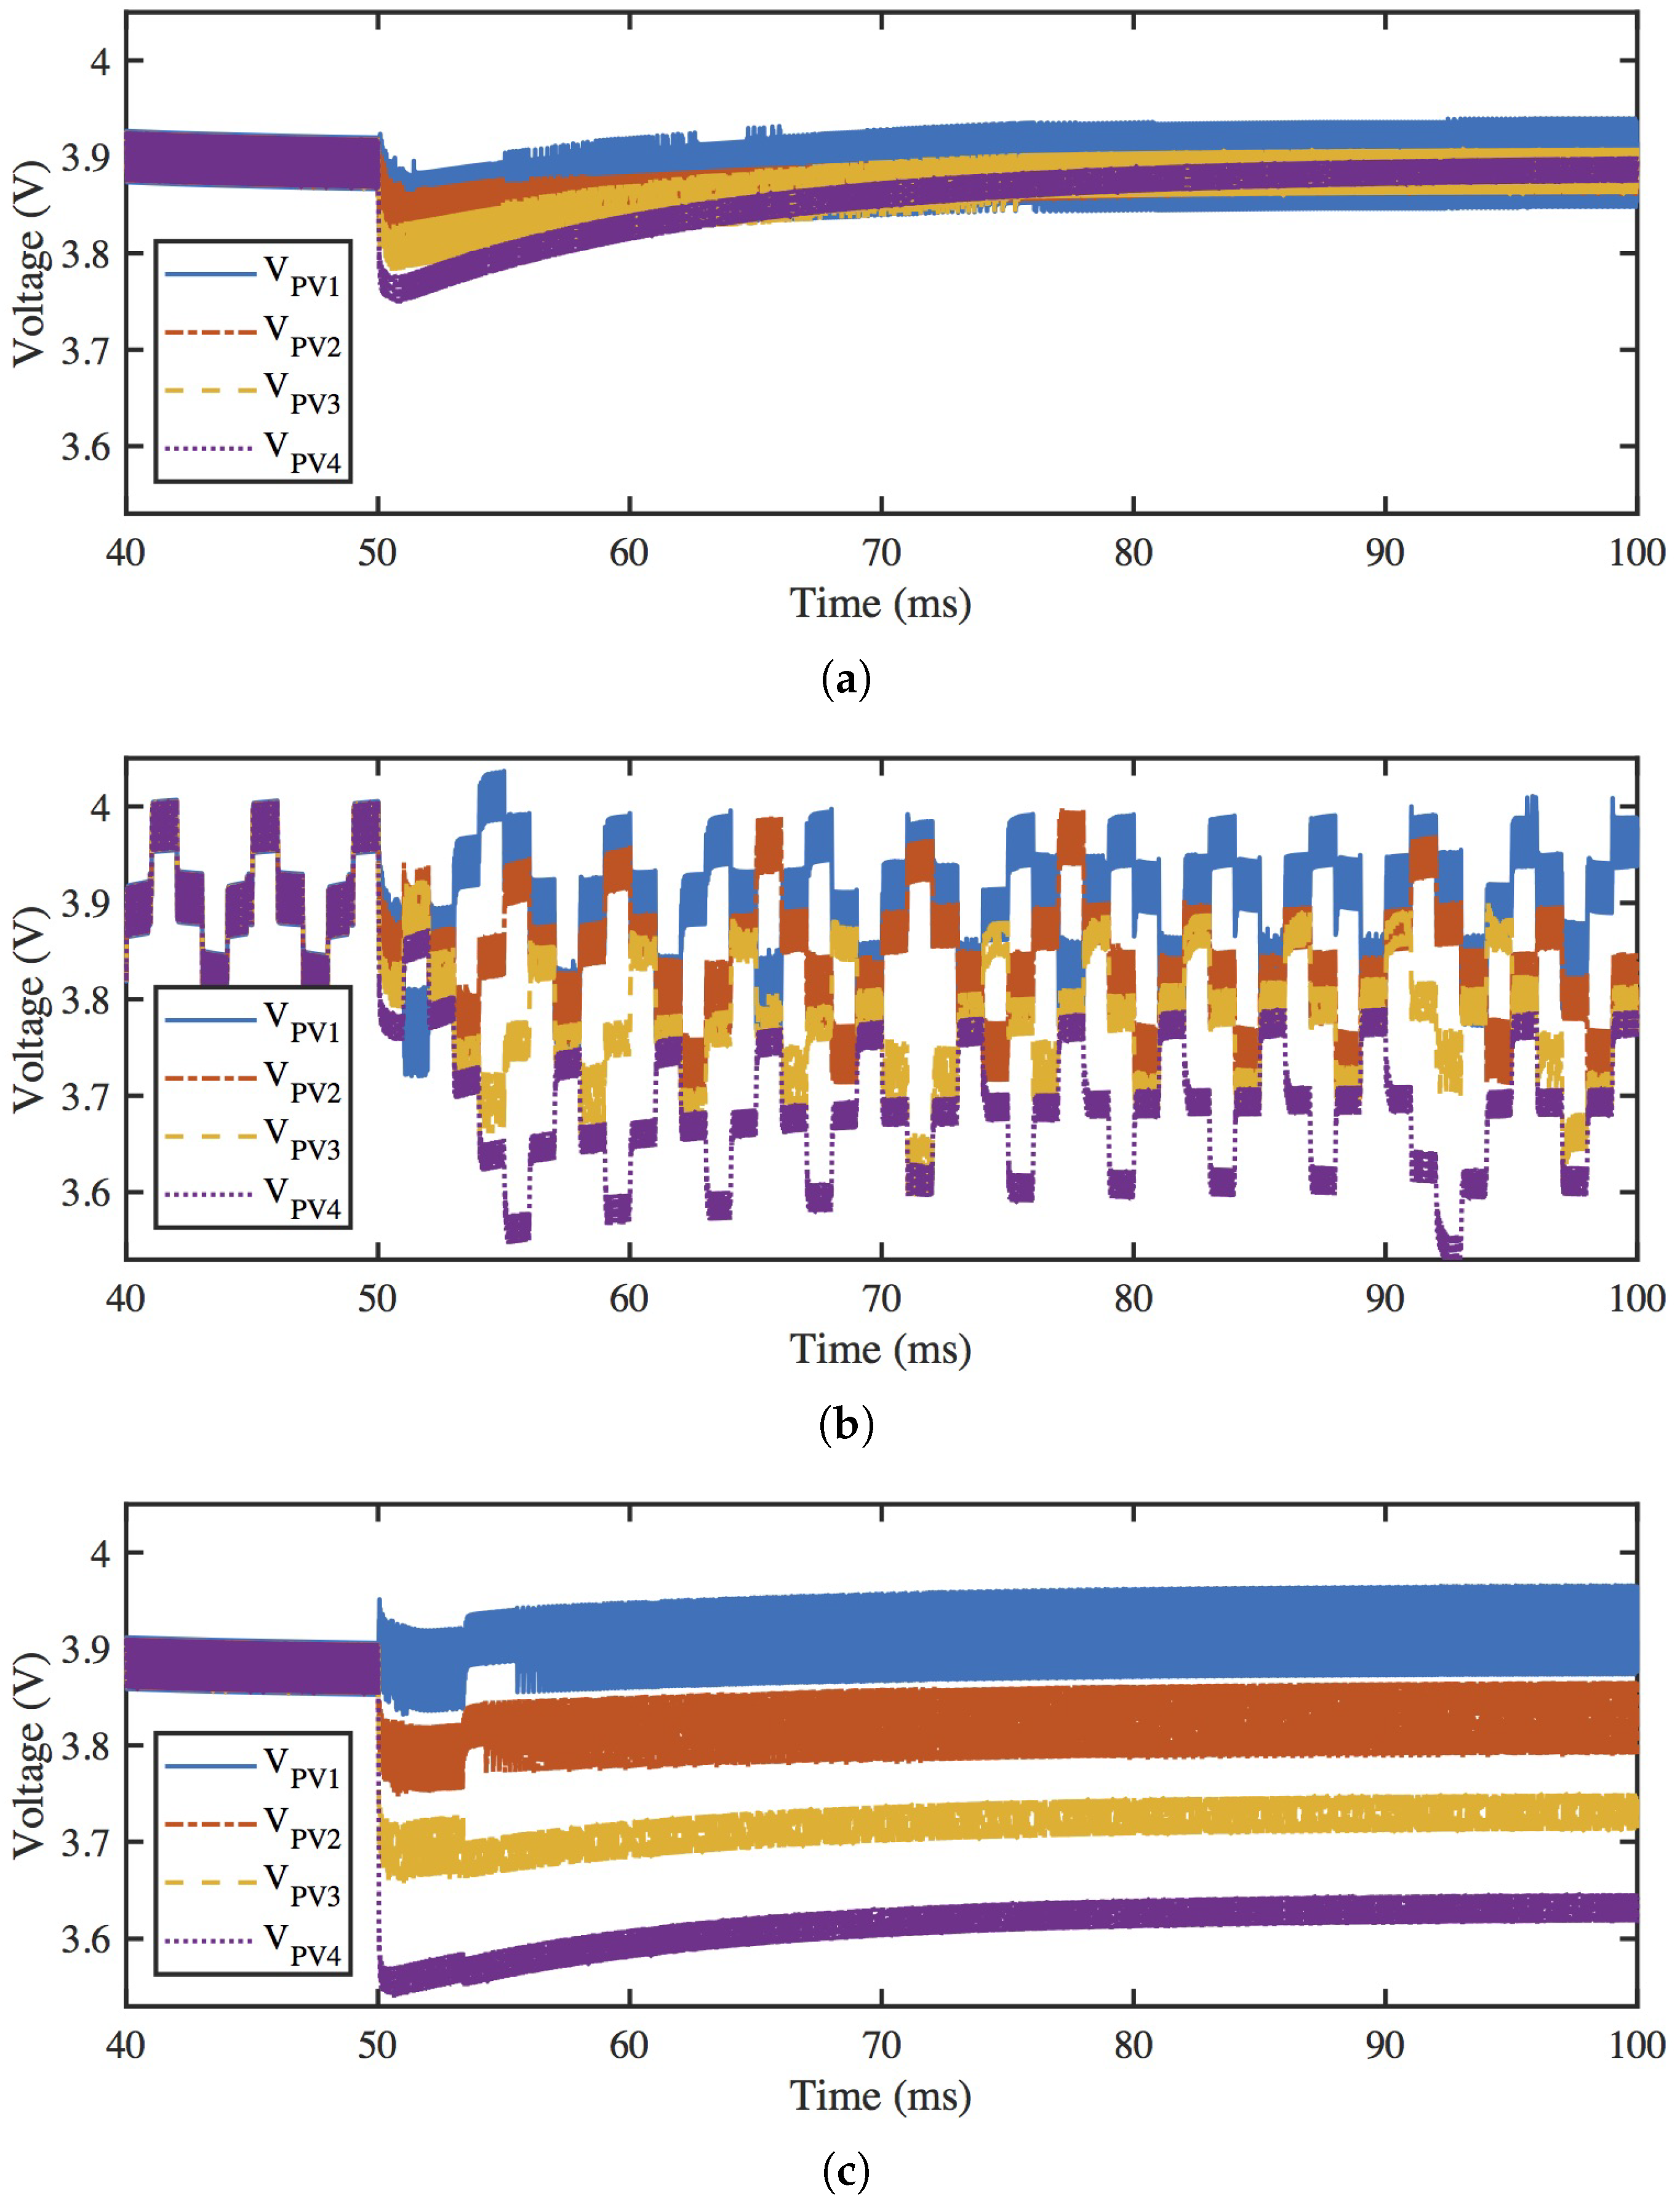
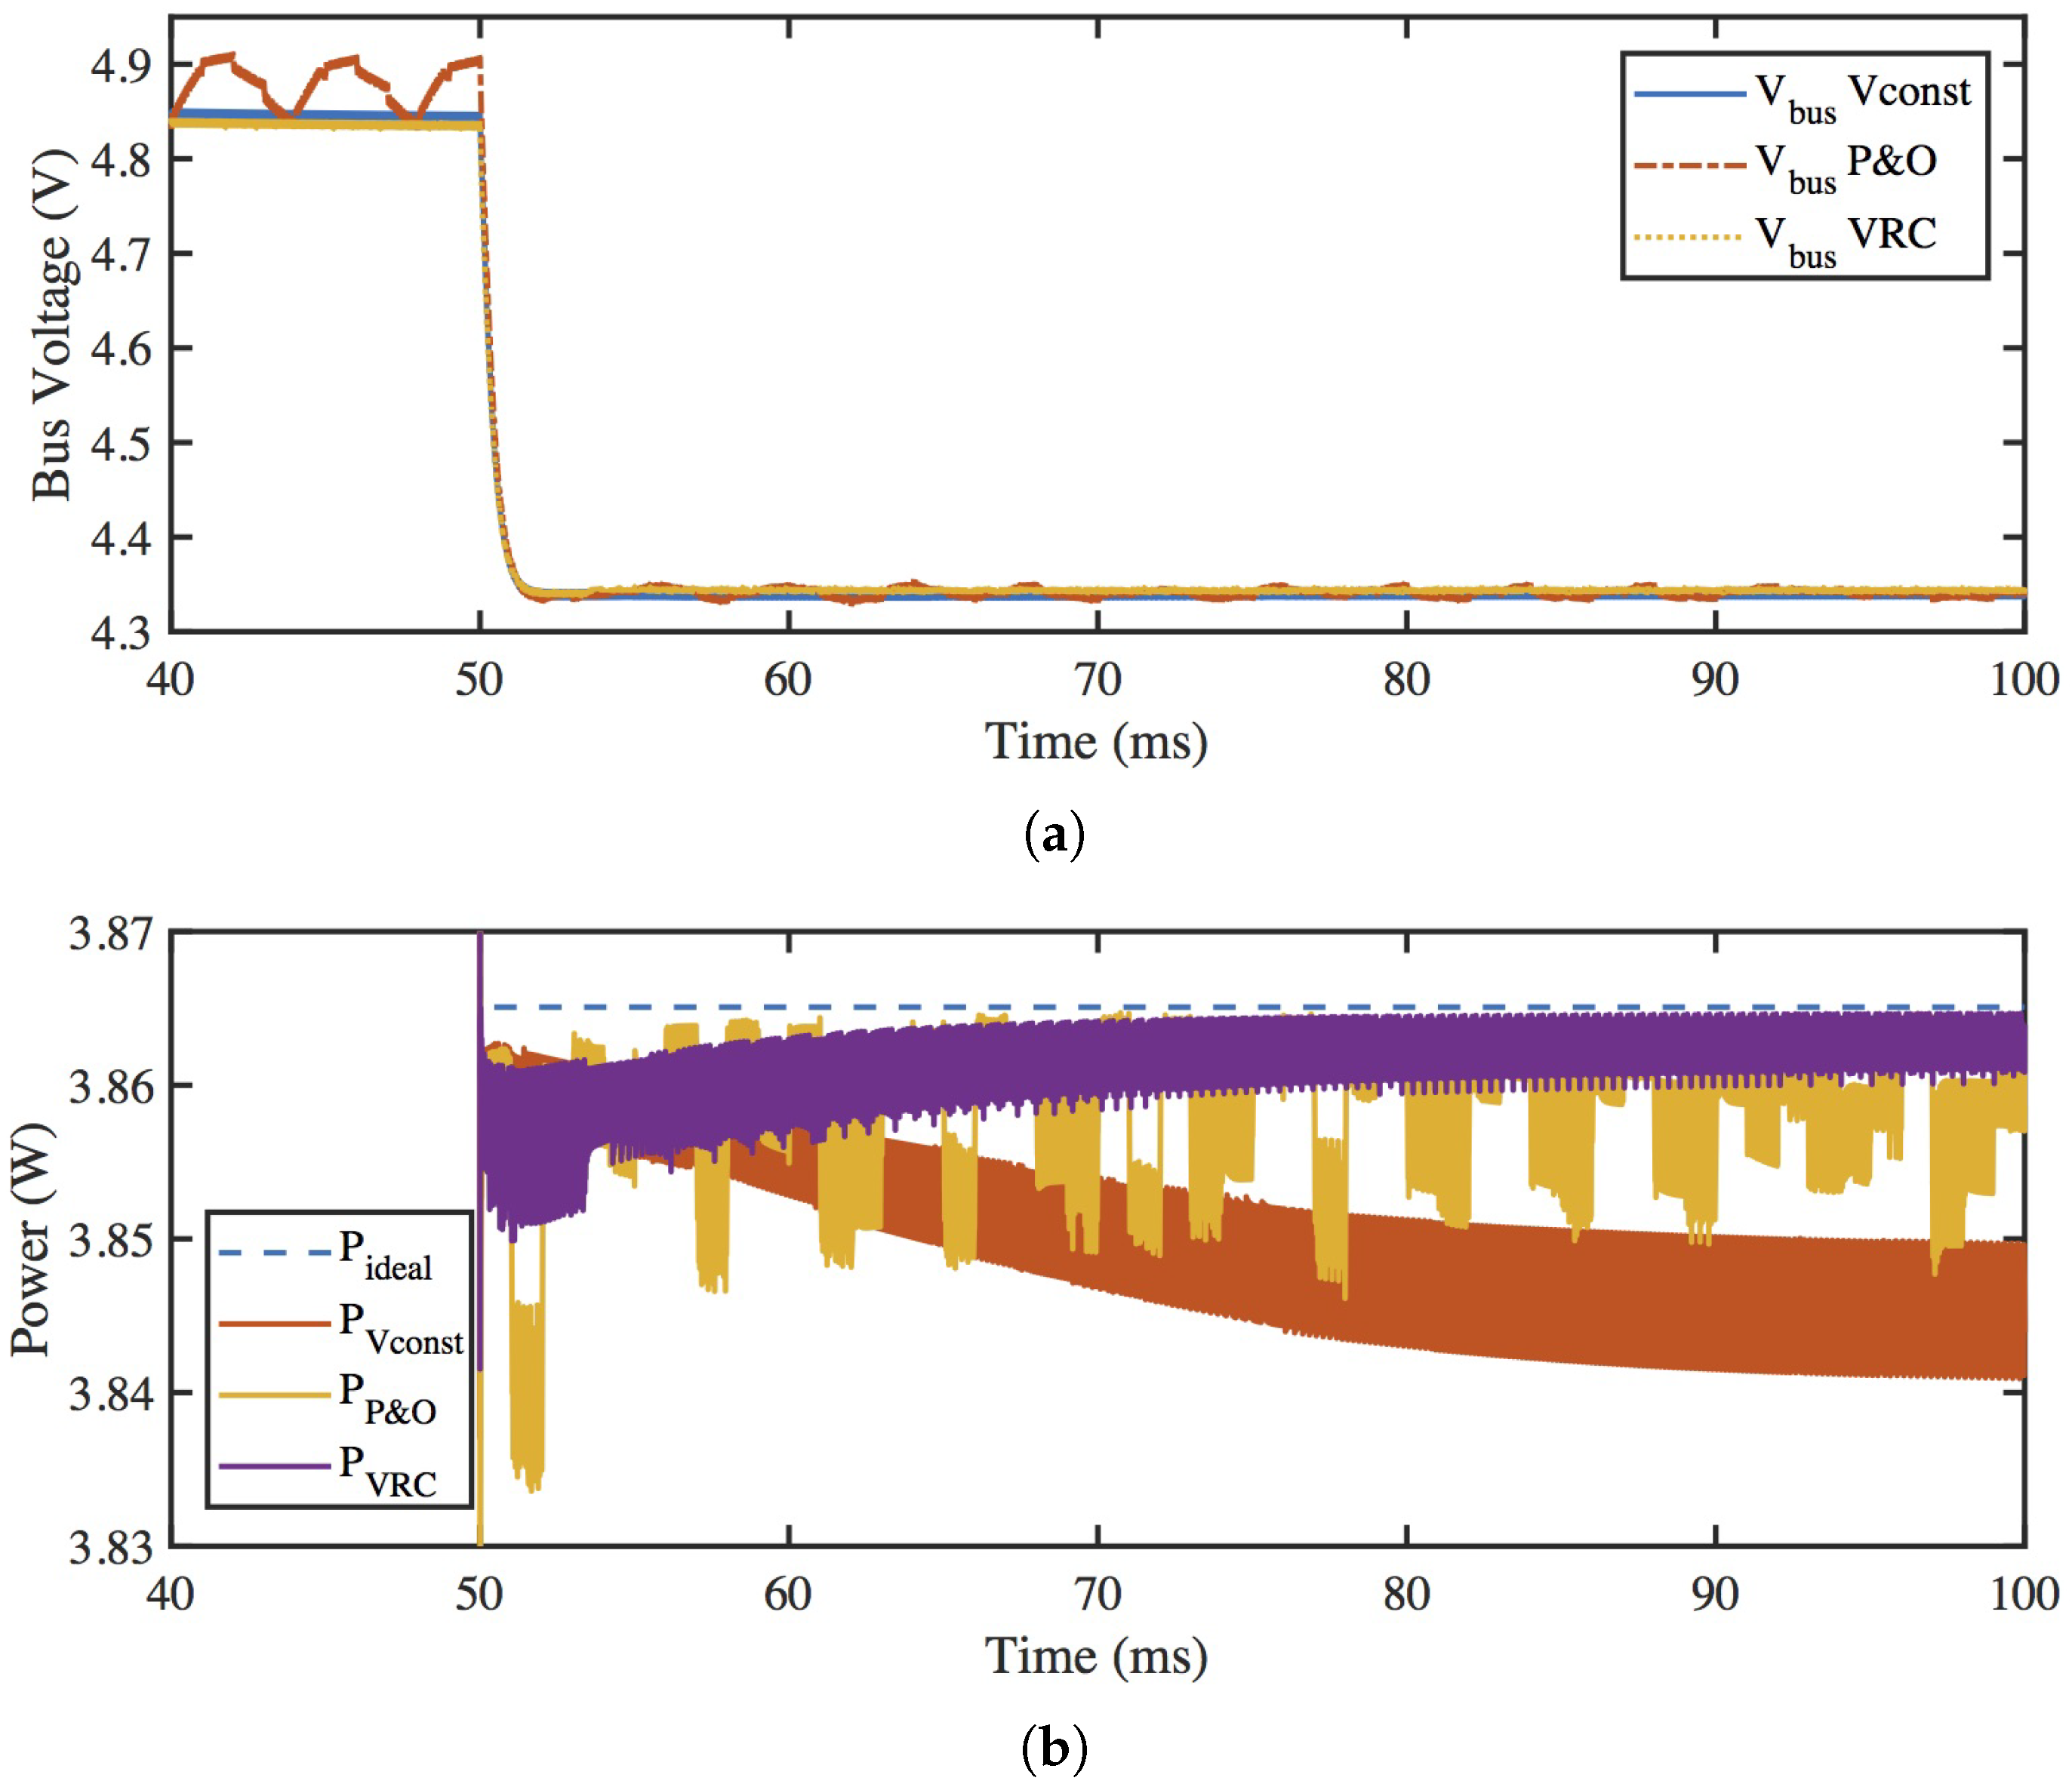
3.3. Simulation Results for MPPT Algorithm Comparison

The simulation with the irradiance change is run for each MPPT algorithm. The voltage waveforms of the four PV modules under constant voltage control of 3.89 V are shown in Figure 12a. After the irradiance changes at 50 ms, the voltages decrease and then slowly increase back toward the constant reference value. Figure 12b shows the PV voltage waveforms for the P&O algorithm. The voltages display clear steps in the reference values and each PV module adjusts to a different voltage level after the irradiance transient, which indicates that the true MPP voltage is different for each of the final irradiance values. The PV voltage waveforms for VRC are shown in Figure 12c. After the irradiance change, each reference voltage immediately changes to a new value based on the VRC parameters, near the true MPP of each PV module.
The simulation results for the DC bus voltage of each MPPT algorithm are shown in Figure 13a. After the irradiance change, the DC bus voltage lowers to approximately 4.35 V to match the battery load characteristics at the lower power. Although the DC bus voltage is lower than 5 V, the portable battery load is still charged effectively. System output power is also compared for the three MPPT algorithms, as shown in Figure 13b. Total power is initially 4.9 W but it decreases to just below 3.87 W after the change. As shown, P&O and VRC move closer to the true maximum power after the irradiance transient, but P&O continues to step back and forth to a lower power level below the MPP. With constant voltage control, the power settles to a lower power output than the other MPPT algorithms. The average power for constant voltage control after the step is 3.850 W, for P&O it is 3.858 W, and for VRC it is 3.862 W. Although the difference in power is on the order of mW, VRC shows the best performance while constant voltage control shows the lowest performance.
Assuming that the MPPT algorithm parameters are well matched to the PV module’s characteristics, VRC reacts most effectively to irradiance changes and maintains the highest output power. However, constant voltage control exhibits an output power lower by only 12 mW and does not need a current sensor. If the added circuitry needed for the current sensor consumes more than 12 mW of power, then constant voltage control is the more effective MPPT algorithm. Alternatively, if significant temperature changes, aging, or wear are expected for the PV modules in the application, the P&O is the most effective since it dynamically tracks the MPP, regardless of changes in the PV module characteristics. In short, MPPT algorithm selection depends on both output power and application requirements.

4. Conclusions

A PV-powered wearable application utilizing parallel DPP converters and MPPT for improved power output was explored through mathematical analysis and detailed simulation. The target of the PV-powered bag application is to charge the battery of a portable device. The system consists of four PV modules, each independently controlled by a parallel DPP converter. Two parallel DPP configurations are compared: with and without a front-end converter. The parallel DPP system with a front-end converter uses higher-voltage PV modules such that the power loss in the DPP converters is very small under nominal irradiance conditions. However, it cannot always achieve MPPT when the DC bus voltage is low; further, it is unable to charge the battery load in some lower-irradiance cases. The parallel DPP design without a front-end converter uses lower-voltage PV modules, such that power loss in the DPP converters is slightly higher in nominal irradiance conditions; however, it shows higher system efficiency at lower DC bus voltages and is able to charge the battery over a wider range of irradiance conditions. These results identified the parallel DPP system without a front-end converter as the more effective design for the PV-powered bag application.
Independent MPPT capability of the DPP converters and proper charging of the battery load was also verified through the simulation results. Three PV MPPT algorithms (constant voltage, P&O, and VRC) were identified as viable control strategies for parallel DPP systems and their performance was compared. With well-calibrated MPPT parameters, VRC showed the best performance under a sudden irradiance change to uneven lighting across the four PV modules. However, each MPPT algorithm has implementation trade-offs and the algorithm selection depends on the specific application requirements. With these findings, effective power converters can be developed and implemented for PV-powered wearable applications charging Li-ion battery loads. The parallel DPP architecture and control schemes can be extended to other PV applications where uneven lighting is expected over multiple PV modules, such as mobile PV power systems for camping or military applications, building-integrated PV systems, and PV modules installed in vehicles.

Author Contributions

Conceptualization, K.A.K.; methodology, H.L. and K.A.K.; software, H.L.; investigation, H.L.; writing—original draft preparation, H.L.; writing—review and editing, K.A.K.; funding acquisition, K.A.K.

Funding

This research was supported in part by the Basic Science Research Program through the National Research Foundation of Korea (NRF) funded by the Ministry of Education (2016R1D1A1B03931573), and by research funding from Ulsan National Institute of Science and Technology (Grant No. 1.180061.01).

Conflicts of Interest

The authors declare no conflict of interest. The funders had no role in the design of the study; in the collection, analyses, or interpretation of the data; in the writing of the manuscript, or in the decision to publish the results.

Abbreviations

PVphotovoltaic
DPPdifferential power processing
MPPTmaximum power point tracking
MPPmaximum power point
MICmodule-integrated converter
FPPfull power processing
P&Operturb and observe
VRCvoltage-offset resistive control

References

  1. Zsiborács, H.; Hegedűsné Baranyai, N.; Vincze, A.; Háber, I.; Pintér, G. Economic and Technical Aspects of Flexible Storage Photovoltaic Systems in Europe. Energies 2018, 11, 1445. [Google Scholar] [CrossRef]
  2. Pintér, G.; Baranyai, N.H.; Wiliams, A.; Zsiborács, H. Study of Photovoltaics and LED Energy Efficiency: Case Study in Hungary. Energies 2018, 11, 790. [Google Scholar] [CrossRef]
  3. Mardonova, M.; Choi, Y. Review of Wearable Device Technology and Its Applications to the Mining Industry. Energies 2018, 11, 547. [Google Scholar] [CrossRef]
  4. Gao, L.; Dougal, R.A.; Liu, S.; Iotova, A.P. Parallel-Connected Solar PV System to Address Partial and Rapidly Fluctuating Shadow Conditions. IEEE Trans. Ind. Electron. 2009, 56, 1548–1556. [Google Scholar] [Green Version]
  5. Olalla, C.; Deline, C.; Maksimovic, D. Performance of Mismatched PV Systems With Submodule Integrated Converters. IEEE J. Photovolt. 2014, 4, 396–404. [Google Scholar] [CrossRef]
  6. Kim, K.A.; Krein, P.T. Reexamination of Photovoltaic Hot Spotting to Show Inadequacy of the Bypass Diode. IEEE J. Photovolt. 2015, 5, 1435–1441. [Google Scholar] [CrossRef]
  7. Sahu, H.S.; Nayak, S.K.; Mishra, S. Maximizing the Power Generation of a Partially Shaded PV Array. IEEE J. Emerg. Sel. Top. Power Electron. 2016, 4, 626–637. [Google Scholar] [CrossRef]
  8. Manganiello, P.; Balato, M.; Vitelli, M. A Survey on Mismatching and Aging of PV Modules: The Closed Loop. IEEE Trans. Ind. Electron. 2015, 62, 7276–7286. [Google Scholar] [CrossRef]
  9. Olalla, C.; Hasan, M.N.; Deline, C.; Maksimovic, D. Mitigation of Hot-Spots in Photovoltaic Systems Using Distributed Power Electronics. Energies 2018, 11, 726. [Google Scholar] [CrossRef]
  10. Barth, C.; Pilawa-Podgurski, R.C.N. Dithering Digital Ripple Correlation Control for Photovoltaic Maximum Power Point Tracking. IEEE Trans. Power Electron. 2015, 30, 4548–4559. [Google Scholar] [CrossRef]
  11. Moon, S.; Yoon, S.G.; Park, J.H. A New Low-Cost Centralized MPPT Controller System for Multiply Distributed Photovoltaic Power Conditioning Modules. IEEE Trans. Smart Grid 2015, 6, 2649–2658. [Google Scholar] [CrossRef]
  12. Zsiborács, H.; Bai, A.; Popp, J.; Gabnai, Z.; Pályi, B.; Farkas, I.; Baranyai, N.H.; Veszelka, M.; Zentkó, L.; Pintér, G. Change of Real and Simulated Energy Production of Certain Photovoltaic Technologies in Relation to Orientation, Tilt Angle and Dual-Axis Sun-Tracking. A Case Study in Hungary. Sustainability 2018, 10, 1394. [Google Scholar] [CrossRef]
  13. Li, Q.; Wolfs, P. A Review of the Single Phase Photovoltaic Module Integrated Converter Topologies with Three Different DC Link Configurations. IEEE Trans. Power Electron. 2008, 23, 1320–1333. [Google Scholar]
  14. Maity, S.; Sahu, P.K. Modeling and Analysis of a Fast and Robust Module-Integrated Analog Photovoltaic MPP Tracker. IEEE Trans. Power Electron. 2016, 31, 280–291. [Google Scholar] [CrossRef]
  15. Walker, G.R.; Sernia, P.C. Cascaded dc-dc converter connection of photovoltaic modules. IEEE Trans. Power Electron. 2004, 19, 1130–1139. [Google Scholar] [CrossRef]
  16. Chen, S.M.; Liang, T.J.; Hu, K.R. Design, Analysis, and Implementation of Solar Power Optimizer for DC Distribution System. IEEE Trans. Power Electron. 2013, 28, 1764–1772. [Google Scholar] [CrossRef]
  17. Hanson, A.J.; Deline, C.A.; MacAlpine, S.M.; Stauth, J.T.; Sullivan, C.R. Partial-Shading Assessment of Photovoltaic Installations via Module-Level Monitoring. IEEE J. Photovolt. 2014, 4, 1618–1624. [Google Scholar] [CrossRef]
  18. Levron, Y.; Clement, D.; Choi, B.; Olalla, C.; Maksimovic, D. Control of Submodule Integrated Converters in the Isolated-Port Differential Power-Processing Photovoltaic Architecture. IEEE J. Emerg. Sel. Top. Power Electron. 2014, 2, 821–832. [Google Scholar] [CrossRef]
  19. Olalla, C.; Deline, C.; Clement, D.; Levron, Y.; Rodriguez, M.; Maksimovic, D. Performance of Power-Limited Differential Power Processing Architectures in Mismatched PV Systems. IEEE Trans. Power Electron. 2015, 30, 618–631. [Google Scholar] [CrossRef]
  20. Shimizu, T.; Hirakata, M.; Kamezawa, T.; Watanabe, H. Generation control circuit for photovoltaic modules. IEEE Trans. Power Electron. 2001, 16, 293–300. [Google Scholar] [CrossRef] [Green Version]
  21. Shenoy, P.S.; Kim, K.A.; Johnson, B.B.; Krein, P.T. Differential Power Processing for Increased Energy Production and Reliability of Photovoltaic Systems. IEEE Trans. Power Electron. 2013, 28, 2968–2979. [Google Scholar] [CrossRef]
  22. Olalla, C.; Clement, D.; Rodriguez, M.; Maksimovic, D. Architectures and Control of Submodule Integrated DC-DC Converters for Photovoltaic Applications. IEEE Trans. Power Electron. 2013, 28, 2980–2997. [Google Scholar] [CrossRef]
  23. Diab-Marzouk, A.; Trescases, O. SiC-Based Bidirectional Cuk Converter with Differential Power Processing and MPPT for a Solar Powered Aircraft. IEEE Trans. Transp. Electrification 2015, 1, 369–381. [Google Scholar] [CrossRef]
  24. Bell, R.; Pilawa-Podgurski, R.C.N. Decoupled and Distributed Maximum Power Point Tracking of Series-Connected Photovoltaic Submodules Using Differential Power Processing. IEEE J. Emerg. Sel. Top. Power Electron. 2015, 3, 881–891. [Google Scholar] [CrossRef]
  25. Qin, S.; Barth, C.B.; Pilawa-Podgurski, R.C.N. Enhancing Microinverter Energy Capture With Submodule Differential Power Processing. IEEE Trans. Power Electron. 2016, 31, 3575–3585. [Google Scholar] [CrossRef]
  26. Jeon, Y.T.; Lee, H.; Kim, K.A.; Park, J.H. Least Power Point Tracking Method for Photovoltaic Differential Power Processing Systems. IEEE Trans. Power Electron. 2017, 32, 1941–1951. [Google Scholar] [CrossRef]
  27. Kim, K.A.; Shenoy, P.S.; Krein, P.T. Converter Rating Analysis for Photovoltaic Differential Power Processing Systems. IEEE Trans. Power Electron. 2015, 30, 1987–1997. [Google Scholar] [CrossRef]
  28. Villalva, M.G.; Gazoli, J.R.; Filho, E. Comprehensive Approach to Modeling and Simulation of Photovoltaic Arrays. IEEE Trans. Power Electron. 2009, 24, 1198–1208. [Google Scholar] [CrossRef]
  29. Kim, K.A.; Xu, C.; Lei, J.; Krein, P.T. Dynamic photovoltaic model incorporating capacitive and reverse-bias characteristics. IEEE J. Photovolt. 2013, 3, 1334–1341. [Google Scholar] [CrossRef]
  30. Jena, D.; Ramana, V.V. Modeling of photovoltaic system for uniform and non-uniform irradiance: A critical review. Renew. Sustain. Energy Rev. 2015, 52, 400–417. [Google Scholar] [CrossRef]
  31. Zhou, H.; Zhao, J.; Han, Y. PV Balancers: Concept, Architectures, and Realization. IEEE Trans. Power Electron. 2015, 30, 3479–3487. [Google Scholar] [CrossRef]
  32. Lee, H.; Kim, K.A. Differential power processing converter design for photovoltaic wearable applications. In Proceedings of the International Power Electronics and Motion Control Conference (IPEMC-ECCE Asia), Hefei, China, 22–26 May 2016; pp. 463–468. [Google Scholar]
  33. Lee, H.; Kim, K.A. Comparison of photovoltaic converter configurations for wearable applications. In Proceedings of the IEEE Workshop Control Modeling Power Electron, Vancouver, BC, Canada, 12–15 July 2015; pp. 1–6. [Google Scholar]
  34. Cobos, J.A.; Cristóbal, H.; Serrano, D.; Ramos, R.; Oliver, J.A.; Alou, P. Differential power as a metric to optimize power converters and architectures. In Proceedings of the 2017 IEEE Energy Conversion Congress and Exposition (ECCE), Cincinnati, OH, USA, 1–5 October 2017; pp. 2168–2175. [Google Scholar]
  35. Esram, T.; Kimball, J.; Krein, P.; Chapman, P.; Midya, P. Dynamic Maximum Power Point Tracking of Photovoltaic Arrays Using Ripple Correlation Control. IEEE Trans. Power Electron. 2006, 21, 1282–1291. [Google Scholar] [CrossRef]
  36. Kim, K.A.; Li, R.M.; Krein, P.T. Voltage-offset resistive control for DC-DC converters in photovoltaic applications. In Proceedings of the 2012 Twenty-Seventh Annual IEEE Applied Power Electronics Conference and Exposition (APEC), Orlando, FL, USA, 5–9 February 2012; pp. 2045–2052. [Google Scholar]
Figure 1. Photovoltaic (PV) systems with (a) module-integrated converters (MICs); (b) direct current optimizers (DC Opt); (c) series differential power processing (DPP) converters; and (d) parallel DPP converters.
Energies 11 03329 g001
Figure 2. PV-powered device: charging bag concept.
Energies 11 03329 g002
Figure 3. System diagram of parallel DPP converters (a) without and (b) with a front-end converter, where V f e is the front-end converter output voltage, L is inductance, Q indicates a switch, D indicates a diode, and C is capacitance.
Energies 11 03329 g003
Figure 4. Example irradiance conditions and voltages (a) without and (b) with a front-end converter.
Energies 11 03329 g004
Figure 5. System efficiency at different converter efficiencies for FPP and DPP architectures.
Energies 11 03329 g005
Figure 6. Portable battery charging voltage and current characteristics measured at different state of charge (SOC) values.
Energies 11 03329 g006
Figure 7. Current–voltage (I–V) curves for two PV modules with different maximum power point (MPP) values.
Energies 11 03329 g007
Figure 8. Optimal voltage-offset resistive control (VRC) values for a PV module at different irradiance values.
Energies 11 03329 g008
Figure 9. The system’s (a) output power and (b) efficiency for each irradiance case.
Energies 11 03329 g009
Figure 10. PSIM software circuit diagram of the parallel DPP converter system for four PV modules.
Energies 11 03329 g010
Figure 11. Irradiance values used in the simulations.
Energies 11 03329 g011
Figure 12. PV voltage waveforms for (a) constant voltage control, (b) perturb and observe control (P&O), and (c) voltage-offset resistive control (VRC).
Energies 11 03329 g012
Figure 13. Waveforms of (a) the bus voltage and (b) the output power for different MPPT algorithms.
Energies 11 03329 g013
Table 1. Power Loss Comparison For Parallel MIC and DPP.
Full Power Processing (FPP) Converters
PV No. P c o n v , f p p (W) P l o s s , f p p (W) P l o s s , t o t (W)
11.230.250.59
20.960.19
30.570.11
40.190.04
Parallel DPP Converters
PV No. P c o n v , d p p (W) P l o s s , d p p (W) P l o s s , t o t (W)
10.050.010.04
20.050.01
30.050.01
40.030.01
With Front-End Converter
Conv. P c o n v , f e (W) P l o s s , f e (W) P l o s s , t o t (W)
FE0.230.050.08
Table 2. Irradiance Scenarios.
CaseIrradiance (W/m 2 )
PV 1PV 2PV 3PV 4
110001050900950
21000700500200
31000105090050
4500550400450
5500350300175
650055045050
Table 3. Performance Comparison of DPP Configurations.
AspectWith Front-EndWithout Front-End
MPPT with low DC buspoorgood
Charging at low input powerfairgood
System power: nominal, uniformexcellentgood
System power: lower or nonuniformpoorgood

