Article

Experimental and Analytical Simulation Analyses on the Electrical Performance of Thermoelectric Generator Modules for Direct and Concentrated Quartz-Halogen Heat Harvesting

Division of Electrical and Electronic Engineering, Centre for Advanced Materials, School of Engineering, London South Bank University, 103 Borough Road, London SE1 0AA, UK
*
Author to whom correspondence should be addressed.
Energies 2018, 11(12), 3315; https://doi.org/10.3390/en11123315
Submission received: 4 November 2018 / Revised: 18 November 2018 / Accepted: 25 November 2018 / Published: 27 November 2018
(This article belongs to the Special Issue Thermoelectric Generators)

Abstract

:
The scope of thermoelectric generators (TEGs), in improving the electric vehicle battery performance and glass/steel manufacturing industries, could achieve wider significance by harnessing the unused radiative heat and light conversion to electrical power. This paper experimentally investigates the electrical performance correlated to concentrated quartz-halogen, with acrylic Fresnel lens and heat-light harvesting, coupled with heat sink. This study also experimentally examined the influence of extreme temperature variance on the open circuit generated voltage of the Peltier electrical failure mode, compared to the standard performance parameters of the commercial TEG module. The research results presented provide expedient perception into the testing (open circuit voltage, short circuit current, and full load power) of a commercial heat-stove TEG to understand its performance limitations. The analytical simulation and mathematical model developed in MATLAB compared the electrical performance parameters and its dependencies. The analytical simulation shows that increasing the heat-sink temperature increases the efficiency of not more than 2% at the Δ T of 360 K, due to the limitation of the Z T ¯ of 0.43 at Δ T of 390 K. The maximum Z T ¯ of 0.7 for Bi2Te3, with an achievable efficiency of 4.5% at the Seebeck coefficient of 250 µV/K, was predicted. The design of three experimental setups and results presented demonstrate the functioning of TEG in stable and unstable temperature conditions, confirming the theoretical study and stipulating a quantity of the electrical output power in relation to extreme temperature conditions.

1. Introduction

Over the past two decades, there has been a rising significance, mainly due to non-moving parts, of thermoelectric generator (TEG) developments in improving the electric vehicle (EV) battery performance and utilising the unused or surplus heat energy, from either domestic boilers, radiators, cooking appliances, or automotive exhausts, conversion into electrical power [1,2,3]. TEG has gained reputation in powering portable electronic equipment and laptop batteries using thermoelectric converter systems and, therefore, have proven to increase the life span of laptops internal batteries [4]. Recently, thermoelectric generators spanned their diligence to solar thermal and photovoltaic schemes, where the cost of the thermal energy input is not an issue [5,6]. The idea of thermoelectrics was discovered by Thomas Johann Seebeck in 1821 [7], in which a compass needle was deflected if it was brought near to a closed loop, made up of two different electrical conductors when any one of the junctions was heated [8]. Thirteen years after the Seebeck’s experiment, J.C.A. Peltier observed the second thermoelectric effect, in which the electric current was passed through the thermocouple, producing heating or cooling, depending on the direction of current [9]. It was unknown that the Seebeck and the Peltier phenomena are dependent on each other until W. Thomson related the Seebeck and Peltier effects coefficients through thermodynamics. In 1949, Abram Fedorovich introduced the thermoelectric figure of merit Z T ¯ , which linked the performance of the thermoelectric with the physics of semiconductors; this parameter measured the thermoelectric efficiency and performance by revealing the balance between the materials electrical and thermal properties [7,8,9]. Altenkirch demonstrated that a good thermoelectric material ought to have a large Seebeck coefficient, and it should possess low thermal conductivity, and these appropriate properties were represented in the commonly named figure of merit (ZT) [8]. Yet, TEGs’ lower heat-to-power conversion efficiency (less than 5%) is an overwhelmingly dominant hurdle specifically when utilising the commercial TEG modules made of Bi2Te3 composite. An effort on improving the efficiency or ZT of thermoelectric materials was made that may operate under dynamic temperatures, particularly in the range of 250 K and 400 K [10], and where concentration of solar energy is one of the ways. Historically, Telkes, in 1954, achieved the temperature difference of 520 K by means of a lens with 50× optical concentration to achieve an efficiency of 3.34% [11]. Kraemer et al. reported the maximum efficiency of 7.4% by using high optical concentration by placing the concentrated solar thermoelectric generator inside a vacuum [12]. Although such heat-to-power performance efficiency was mainly realised with the use of vacuum insulation, the vacuum degradation on the TEG efficiency has not been studied yet. However, highly efficient thermoelectric compositions for power generation applications were studied [13,14]. A typical electrical circuit of TEG (Peltier module) consists of an open circuit potential difference connected in series with the TEG module internal resistance; both fluctuate with the disparity of temperature between hot side and cold side, as shown in Figure 1.
If heat source surface temperature on P- and N-type of electrodes is lower, it will produce lower circuit current, meaning reduced thermal conductance (or higher thermal resistance), and vice versa [1]. Usually, TEG short circuiting is avoided, because it would allow highest possible thermal conductance, whilst it is significantly important to quantify, experimentally, the short circuit performance of TEG, in order to improve the insulation. To increase the power generated by TEG, a maximum power transfer theorem can be applied when the internal resistance is equivalent to external/load resistance. Despite the TEG (Peltier) module specifications and efficiencies available in the literature, there are speculations that TEG modules may sometimes underperform where manufacturers are not aware of the heat inequity effects. TEG modules constructed with Bi2Te3 were utilised in harnessing heat from the smoke of cookers and stoves, and external air (forced convection) as a heat sink achieved the maximum generated potential difference of 4 W [15]. There is no reported experimental work in the literature on the commercial heat-stove TEG open-short-full load analysis, failure mode analysis of Bi2Te3 Peltier module subjected to wider temperature differentials, and the influence of quartz-halogen radiative light and heat concentration onto the Peltier module open circuit voltage performance. However, Montecucco et al. [1] reported the effect of temperature mismatch when connected in series and parallel, but they primarily focused on VI characteristics of generic Peltier module arrays. One of the contributions of this research is to experimentally enumerate the operating conditions of Peltier module under higher temperature differentials.
The research work presented in this paper, for the first time, matters correlated to the concentrated—with acrylic Fresnel lens—quartz-halogen heat–light harvesting scope on TEG (Peltier) module, coupled with heat sink. This study experimentally reconnoitres the influence of higher temperatures, or Peltier failure mode, on the open circuit-generated voltage, compared to the standard performance parameters of the commercial TEG module using a hot plate. The research results presented provide expedient perception into the testing (open-short-full load) of commercial heat-stove TEG in understanding the performance limitations of it. The analytical simulation and mathematical model developed in MATLAB compared the electrical performance parameters and its dependencies. All three experimental setups, designed and developed for understanding the functioning of TEG in stable and unstable temperature conditions, confirm the theoretical study and stipulate a quantity of the electrical output power in relation to extreme temperature conditions.

2. Materials and Methods

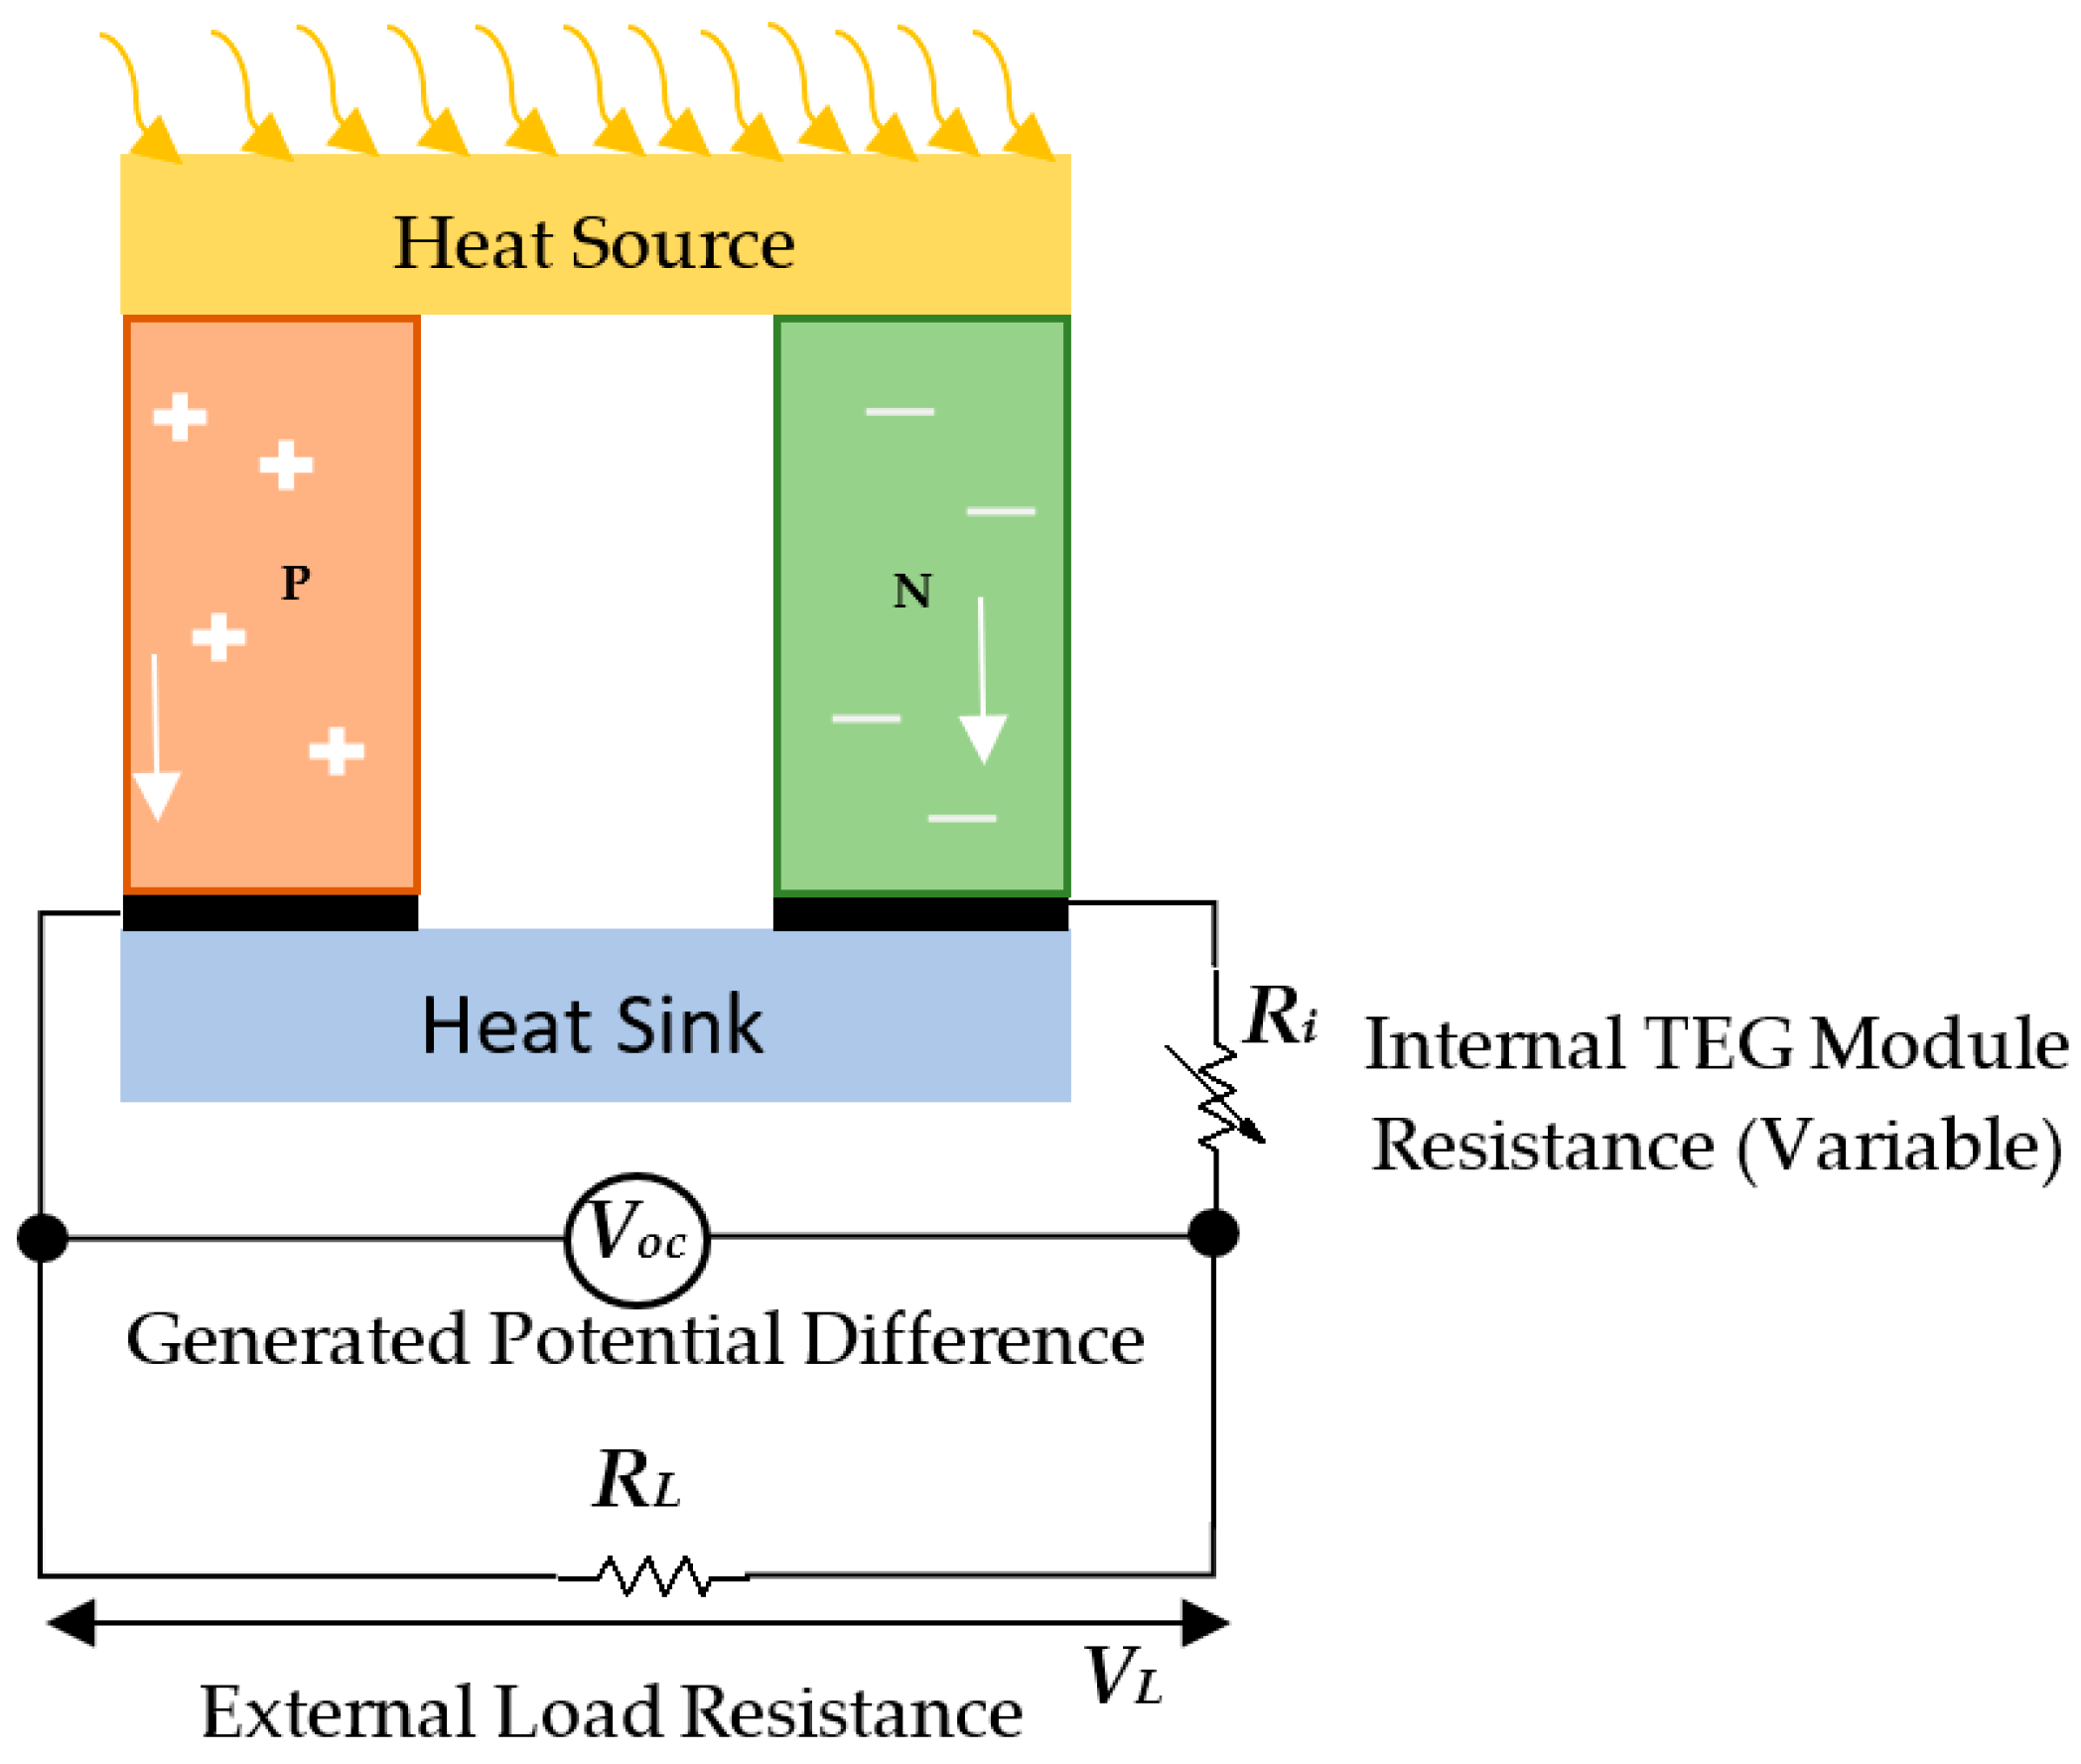
2.1. Analytical Model Method for TEG Characterisation

A mathematical model of the TEG is developed in MATLAB, that works on the principle of the Seebeck effect, and produces an electric potential under the influence of the temperature difference between its sides [16]. The larger the temperature difference, the greater is the output power produced, but this temperature difference is not easy to obtain, due to which an effective cooling mechanism is required, to keep one side cooler than the other [17]. As the large temperature difference is difficult to obtain, it means that the overall efficiency of the TEG is very low. An increase in the overall efficiency is primarily dependent on thermoelectric materials which play a significant part in determining its operating temperature range, and their range is usually divided into three categories: less than 450 K utilise bismuth (Bi) composite with tellurium (Te), antimony (Sb), and/or selenium (Se) basis of commercial TEGs; 600–850 K utilise composites of lead (Pb) and telluride (Te2); and 900–1300 K utilise germanium (Ge) and silicon (Si). Due to the <450 K operating range of the commercial TEG module, they are usually coupled in series, and crammed between heat-conductive elements providing heat from the hot source and cooling from the heat sink to achieve a reasonable power. When different temperatures are forced between P and N junctions of Bi2Te3 TEG, it is found that the generated potential difference or voltage V shows up on the voltmeter, and is represented in Equation (1) [9].
V = α Δ T ,
where V represents the open circuit voltage, Δ T is the difference in temperature ( T h T c ) and α is the representation of Seebeck coefficient. The performance of any thermoelectric device is predicted by its thermoelectric figure of merit Z, which is represented by Equation (2) [18].
Z p , n = α 2 ρ   k ,
where ρ and k are the electrical resistivity and thermal conductivity, respectively. This figure of merit can become dimensionless if linked with average temperature T ¯ of the thermoelectric module [15]. This dimensionless figure of merit can be written as in Equation (3) [1].
Z T ¯ p , n = α 2 T ¯ ρ   k ,
where thermal conductance (K) [17] can be written as in Equation (4).
K = k A L
In addition, the internal resistance (Ri) can be written as in Equation (5).
R i = ρ L A i
For maximum power R L equals to R i , and the maximum power current and maximum power are represented by Equations (6) and (7) [1,19].
I m p = α Δ T 2 R i
P m p = I 2 R L
When the current reaches maximum power, then the voltage across the load calculated using Equation (8).
V L = I m p R L
The heat flow, Q h , into the hot side represented by Equation (9).
Q h = α   x   T h   I 1 2 I 2 R + K ( T h T c ) ,
where T h represents the temperature of hot junction, T c the temperature of cold junction, I the current, and Ri internal resistance. The conversion efficiency for the maximum power is calculated using Equation (10), when the values of the heat absorbed at the hot junction and maximum power known. The maximum conversion efficiency can be calculated using Equation (11) [18].
η m p = P m p Q h
η = T h T c T h   1 + Z T ¯   1 1 + Z T ¯   + T c T h
The load resistance, R L , is calculated at the maximum conversion efficiency using Equation (12). Thus, the generated current, voltage, and power are calculated using Equations (13), (14), and (16), respectively.
R L = R i ( 1 +   Z T ¯ ) 1 2
V L = I m p R L
I m c = α   ( T h T c ) ( R L + R i )
P L = I m c 2 R L
Thermoelectric devices are made up of the combinations of N-type and P-type semiconductor materials, which make the basic unit of a thermoelectric device; these semiconductor materials are connected electrically in series, and thermally in parallel. Therefore, when the heat moves from the hot side to the cold side of the module, the electrons and the holes are carried with it, resulting in the potential difference [20].

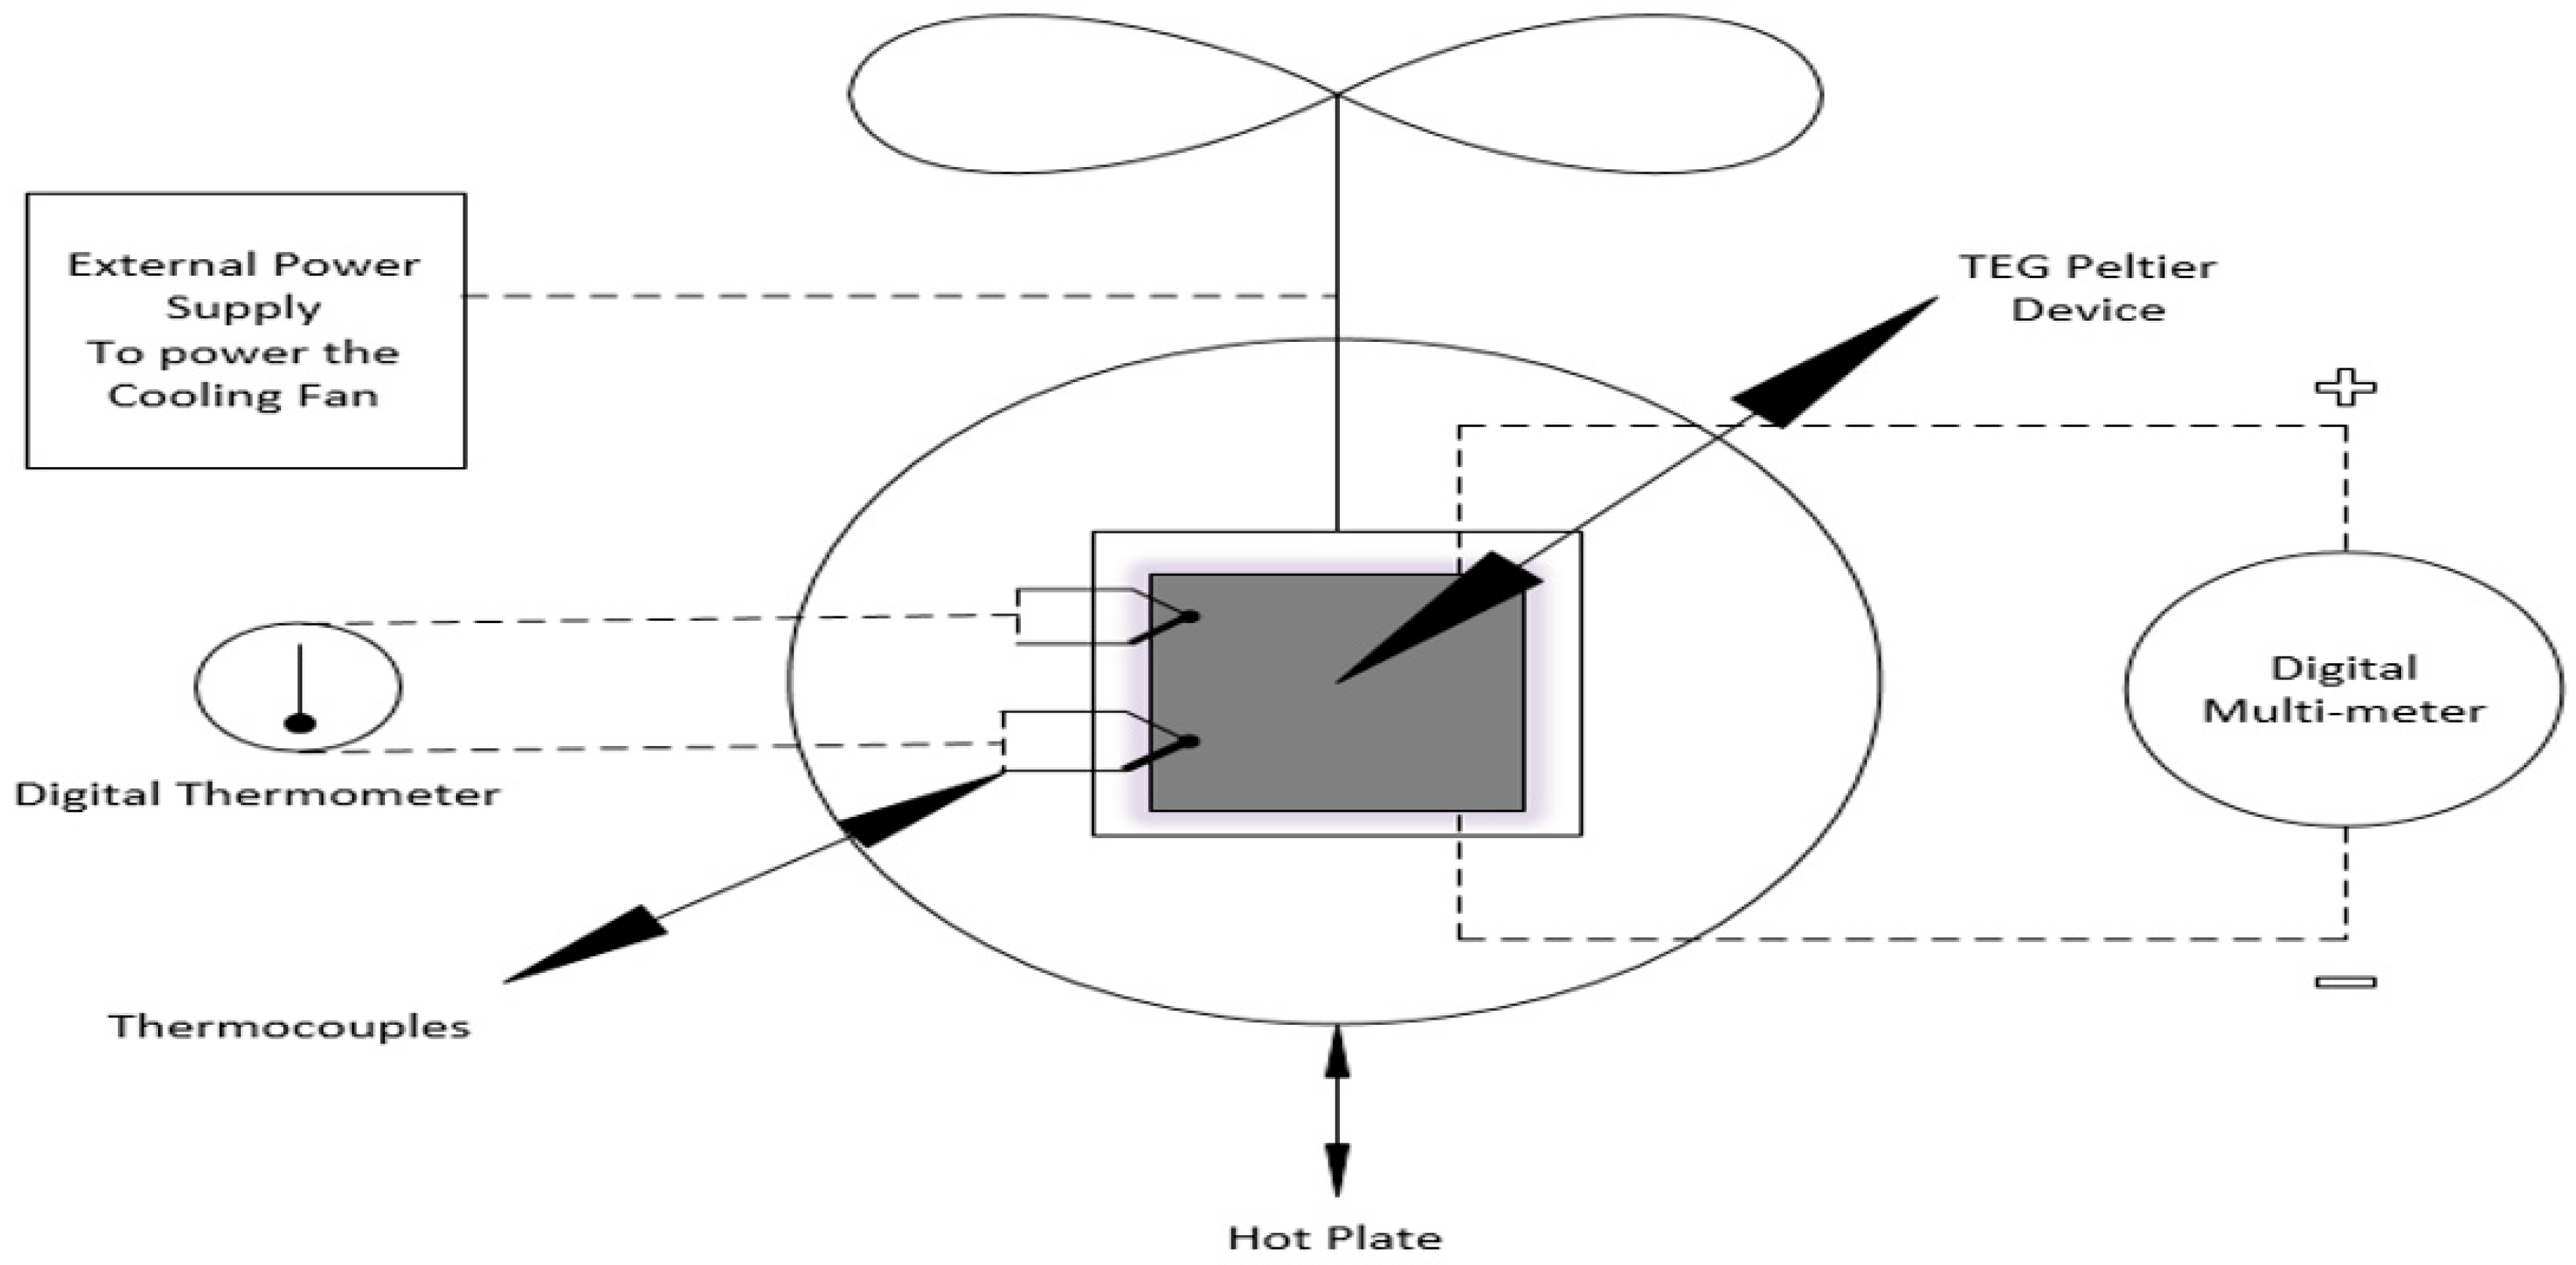
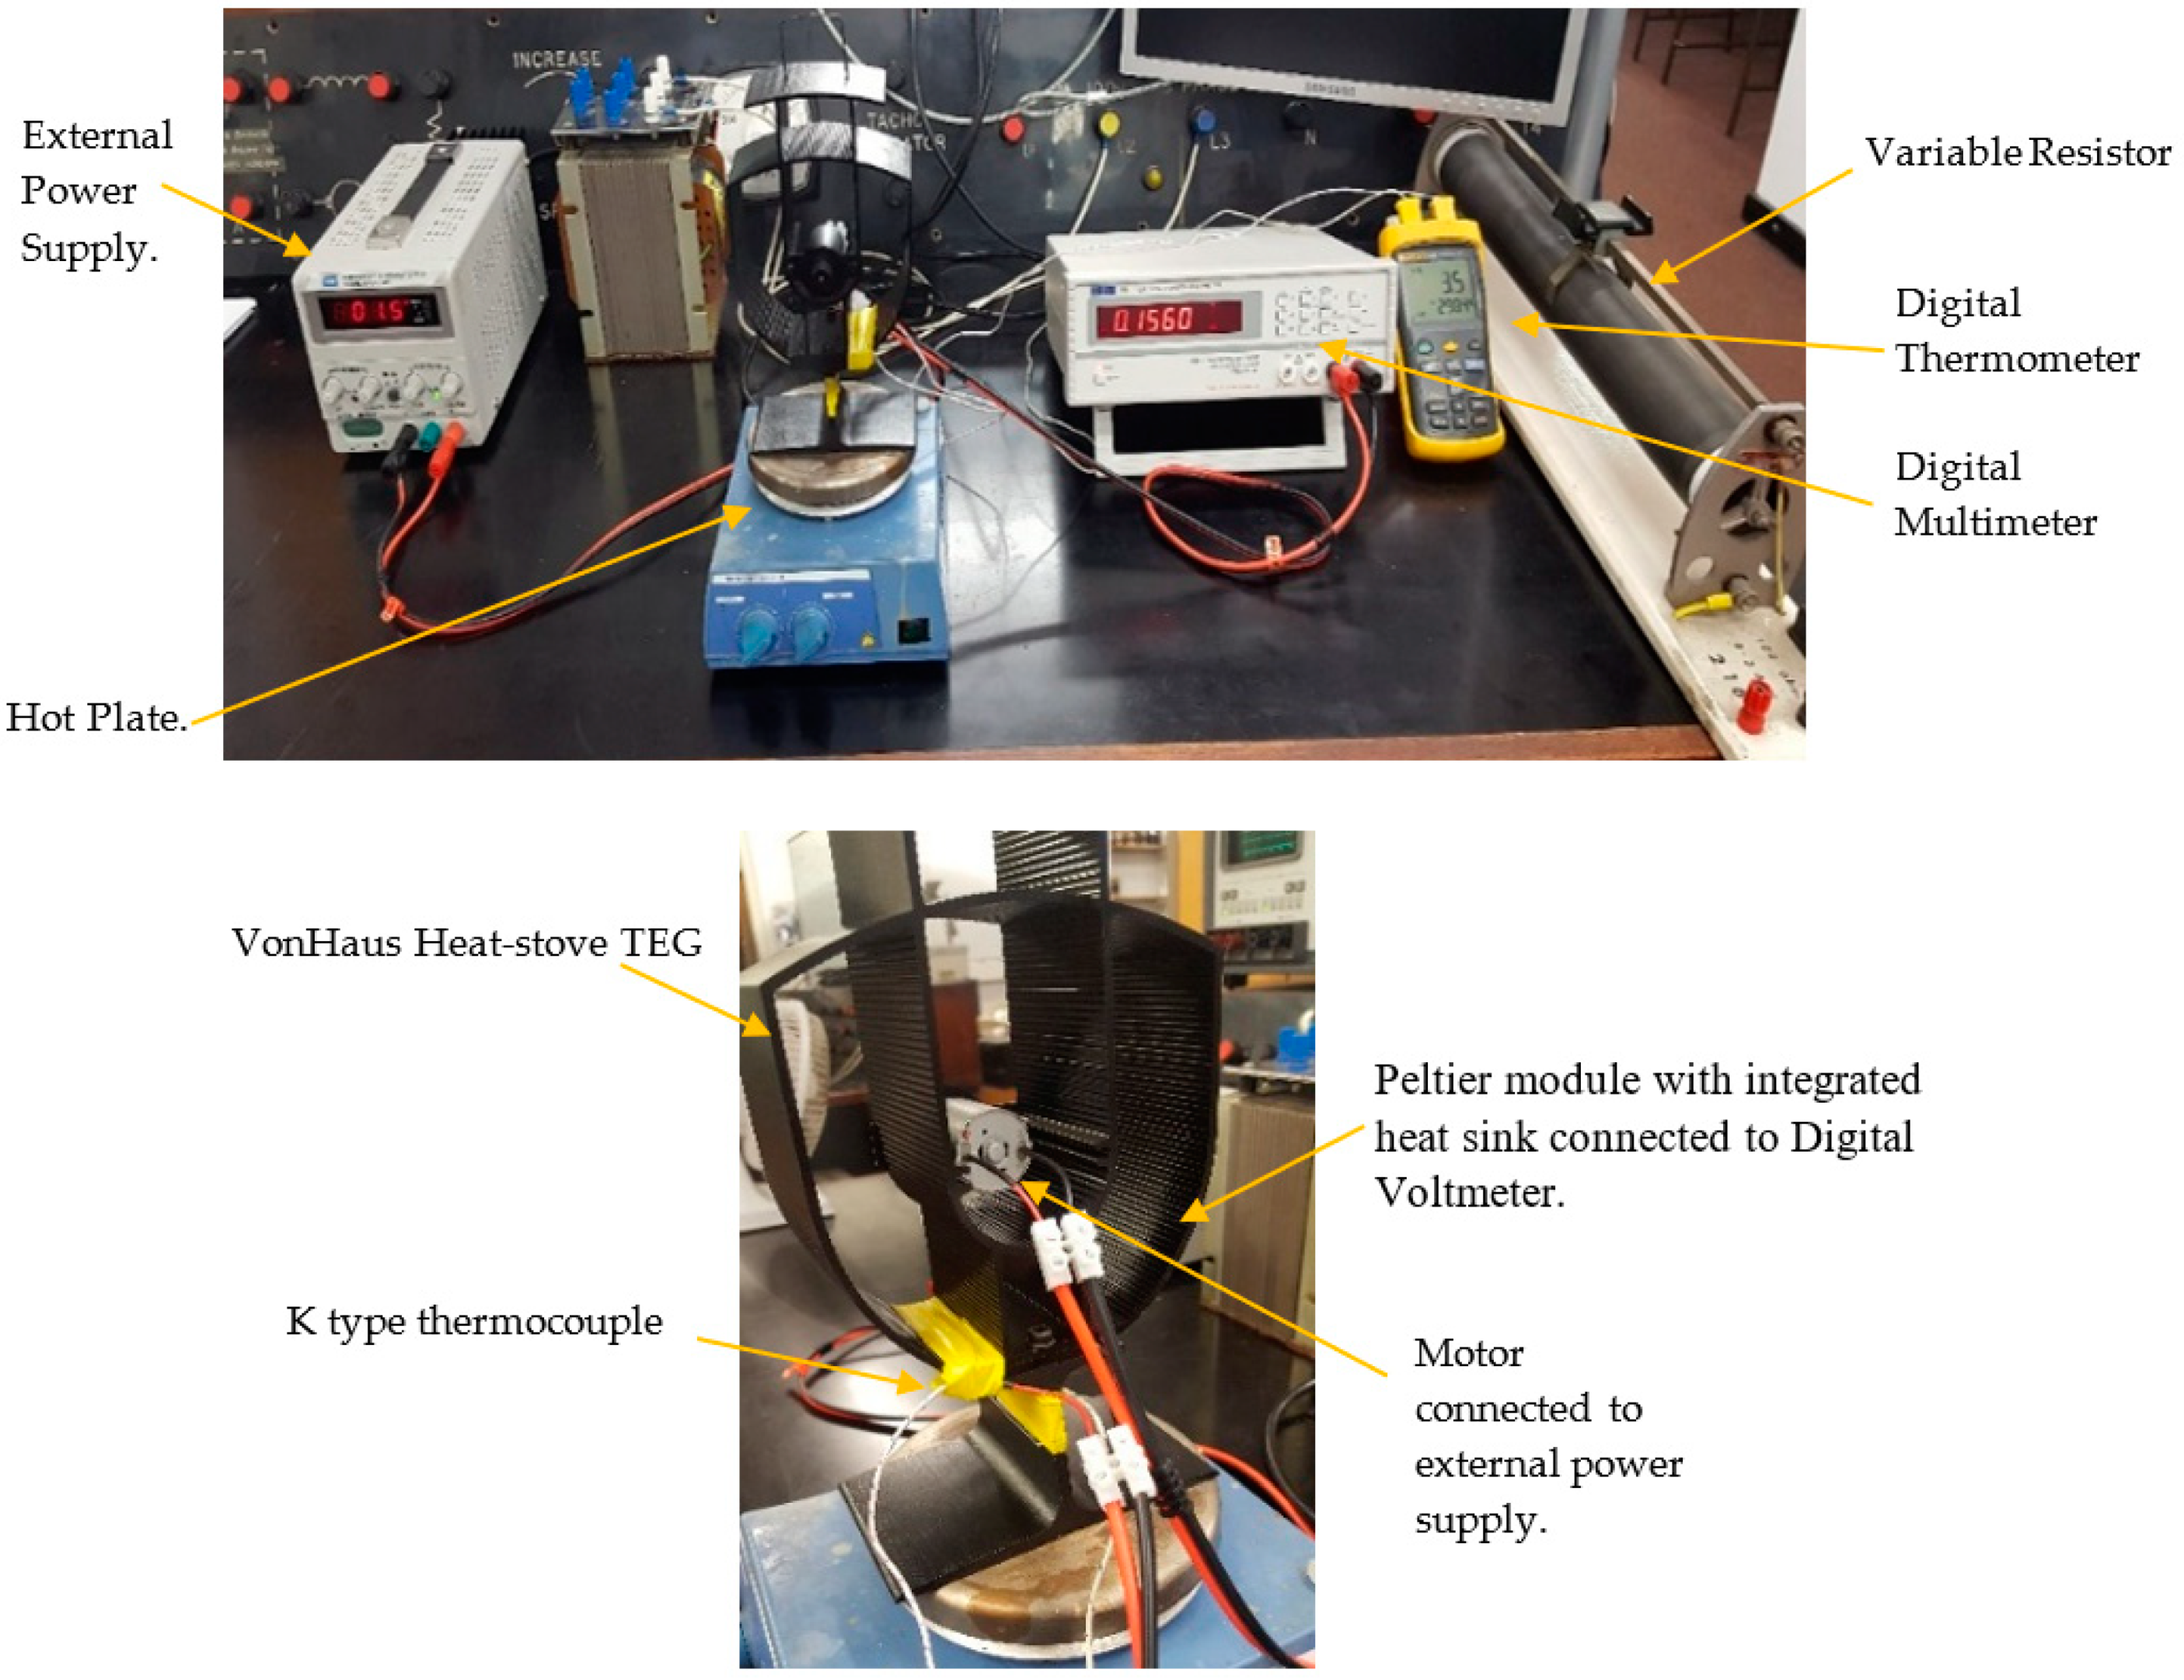
2.2. Experimental Facility and Instrumentation

2.2.1. Heat-Stove TEG System Components for Direct Heat Harvesting

Figure 2 elucidates the schematic diagram of the experimental setup for the electrical performance (open circuit voltage, short circuit current, and full load voltage) testing of direct heat harvesting using commercial (VonHaus) heat-stove TEG. Standard specification of the TEG-127020, dimensions of 40 mm × 44 mm × 3.3 mm, both P- and N-type elements (Bi2Te3), insulated with Teflon connected with copper lead, are shown in Table 1. It does not have a figure-of-merit ( Z T ¯ ) of more than 1, and is not continuous, because the material properties change due to its reliance on temperature variance. Nevertheless, a typical, under good performance, Z T ¯ for this type is in the range of 0.3 and 0.7 having a heat-to-power conversion efficiency specified to be less than 4.5%, and Seebeck coefficient in the range of 150 to 250 µV/K. This heat-stove has a built-in heat sink to keep the cold-side temperature to less than 308 K, supported with a small cooling fan, and the heat-source (hot-plate) temperature goes up to around 419 K, and will be subjected to a range of thermoelectrical conditions for electrical performance testing. The open circuit voltage (Voc) test can be conducted when the circuit is not connected with an external load resistor (RL). The short circuit current test can be conducted when the output leads are shorted with copper conductor. The full load test can be conducted when the TEG leads are connected to external load resistor (RL), and for maximum power measurement, the RL must be equal to Ri, which is why it is a variable resistor of 100 Ω, to measure the maximum power performance. For this experimental analysis, the hot-plate surface temperature is limited to 420 K. The fan cooling was connected to the external power supply and the TEG heat-stove connected to the digital voltmeter with two k-type thermocouples: one on the cooling side and one on the heating side, secured with thermal glue for recording the hot-side and cold-side temperatures, as shown in Figure 3. For the full load testing, a 100 Ω variable resistor was used.

2.2.2. TEG System Components for Peltier Failure Mode Analysis under Extreme Temperature Variance

Figure 4 shows the schematic diagram of the experimental setup for the open circuit voltage performance testing under extreme temperature variance of direct heat harvesting using TEG (SP1848-27145), dimensions of 40 mm × 40 mm × 3.4 mm, both P- and N-type elements (Bi2Te3) insulated with Teflon connected with copper lead. The standard specifications are shown at Δ T of 293.15, 313.15, 333.15, 353.15, and 373.15 K, for the Voc of 1.8, 2.4, 3.6, and 4.8 V, respectively. In this part of the experiment, a test of achieving higher temperature variance between the hot and cold side of the Peltier module was performed. Extreme temperature influences on low power when it reaches its maximum limit and deteriorates Bi2Te3 due to diffusion. However, its maximum experimental temperature sustainability limit is unclear, such that steady operation can be maintained for experimentally measuring the failure mode of the Peltier module. To achieve this, the hot plate, heat sink, and ice bowl were used to cool TEG from one side, and heat it from the other side, so that a reasonable amount of temperature difference could be achieved between its two sides, as shown in Figure 5. For this purpose, a heat sink was attached to one side of the Peltier device, and a hot plate was used to provide heating from the other side. An additional bowl of ice was placed on top of heat sink so that the cooling process could be enhanced. Two metal plates were placed on the top and bottom of the Peltier device with the use of the thermal glue, onto which k-type thermocouples were attached. These k-type thermocouples were then inserted into the digital thermometer, which displayed the temperature of both sides of the Peltier module. The open circuit voltage was displayed on the digital voltmeter as shown in Figure 5. The measuring instruments used is in this experiment are the same as the ones used in Section 2.2.1.

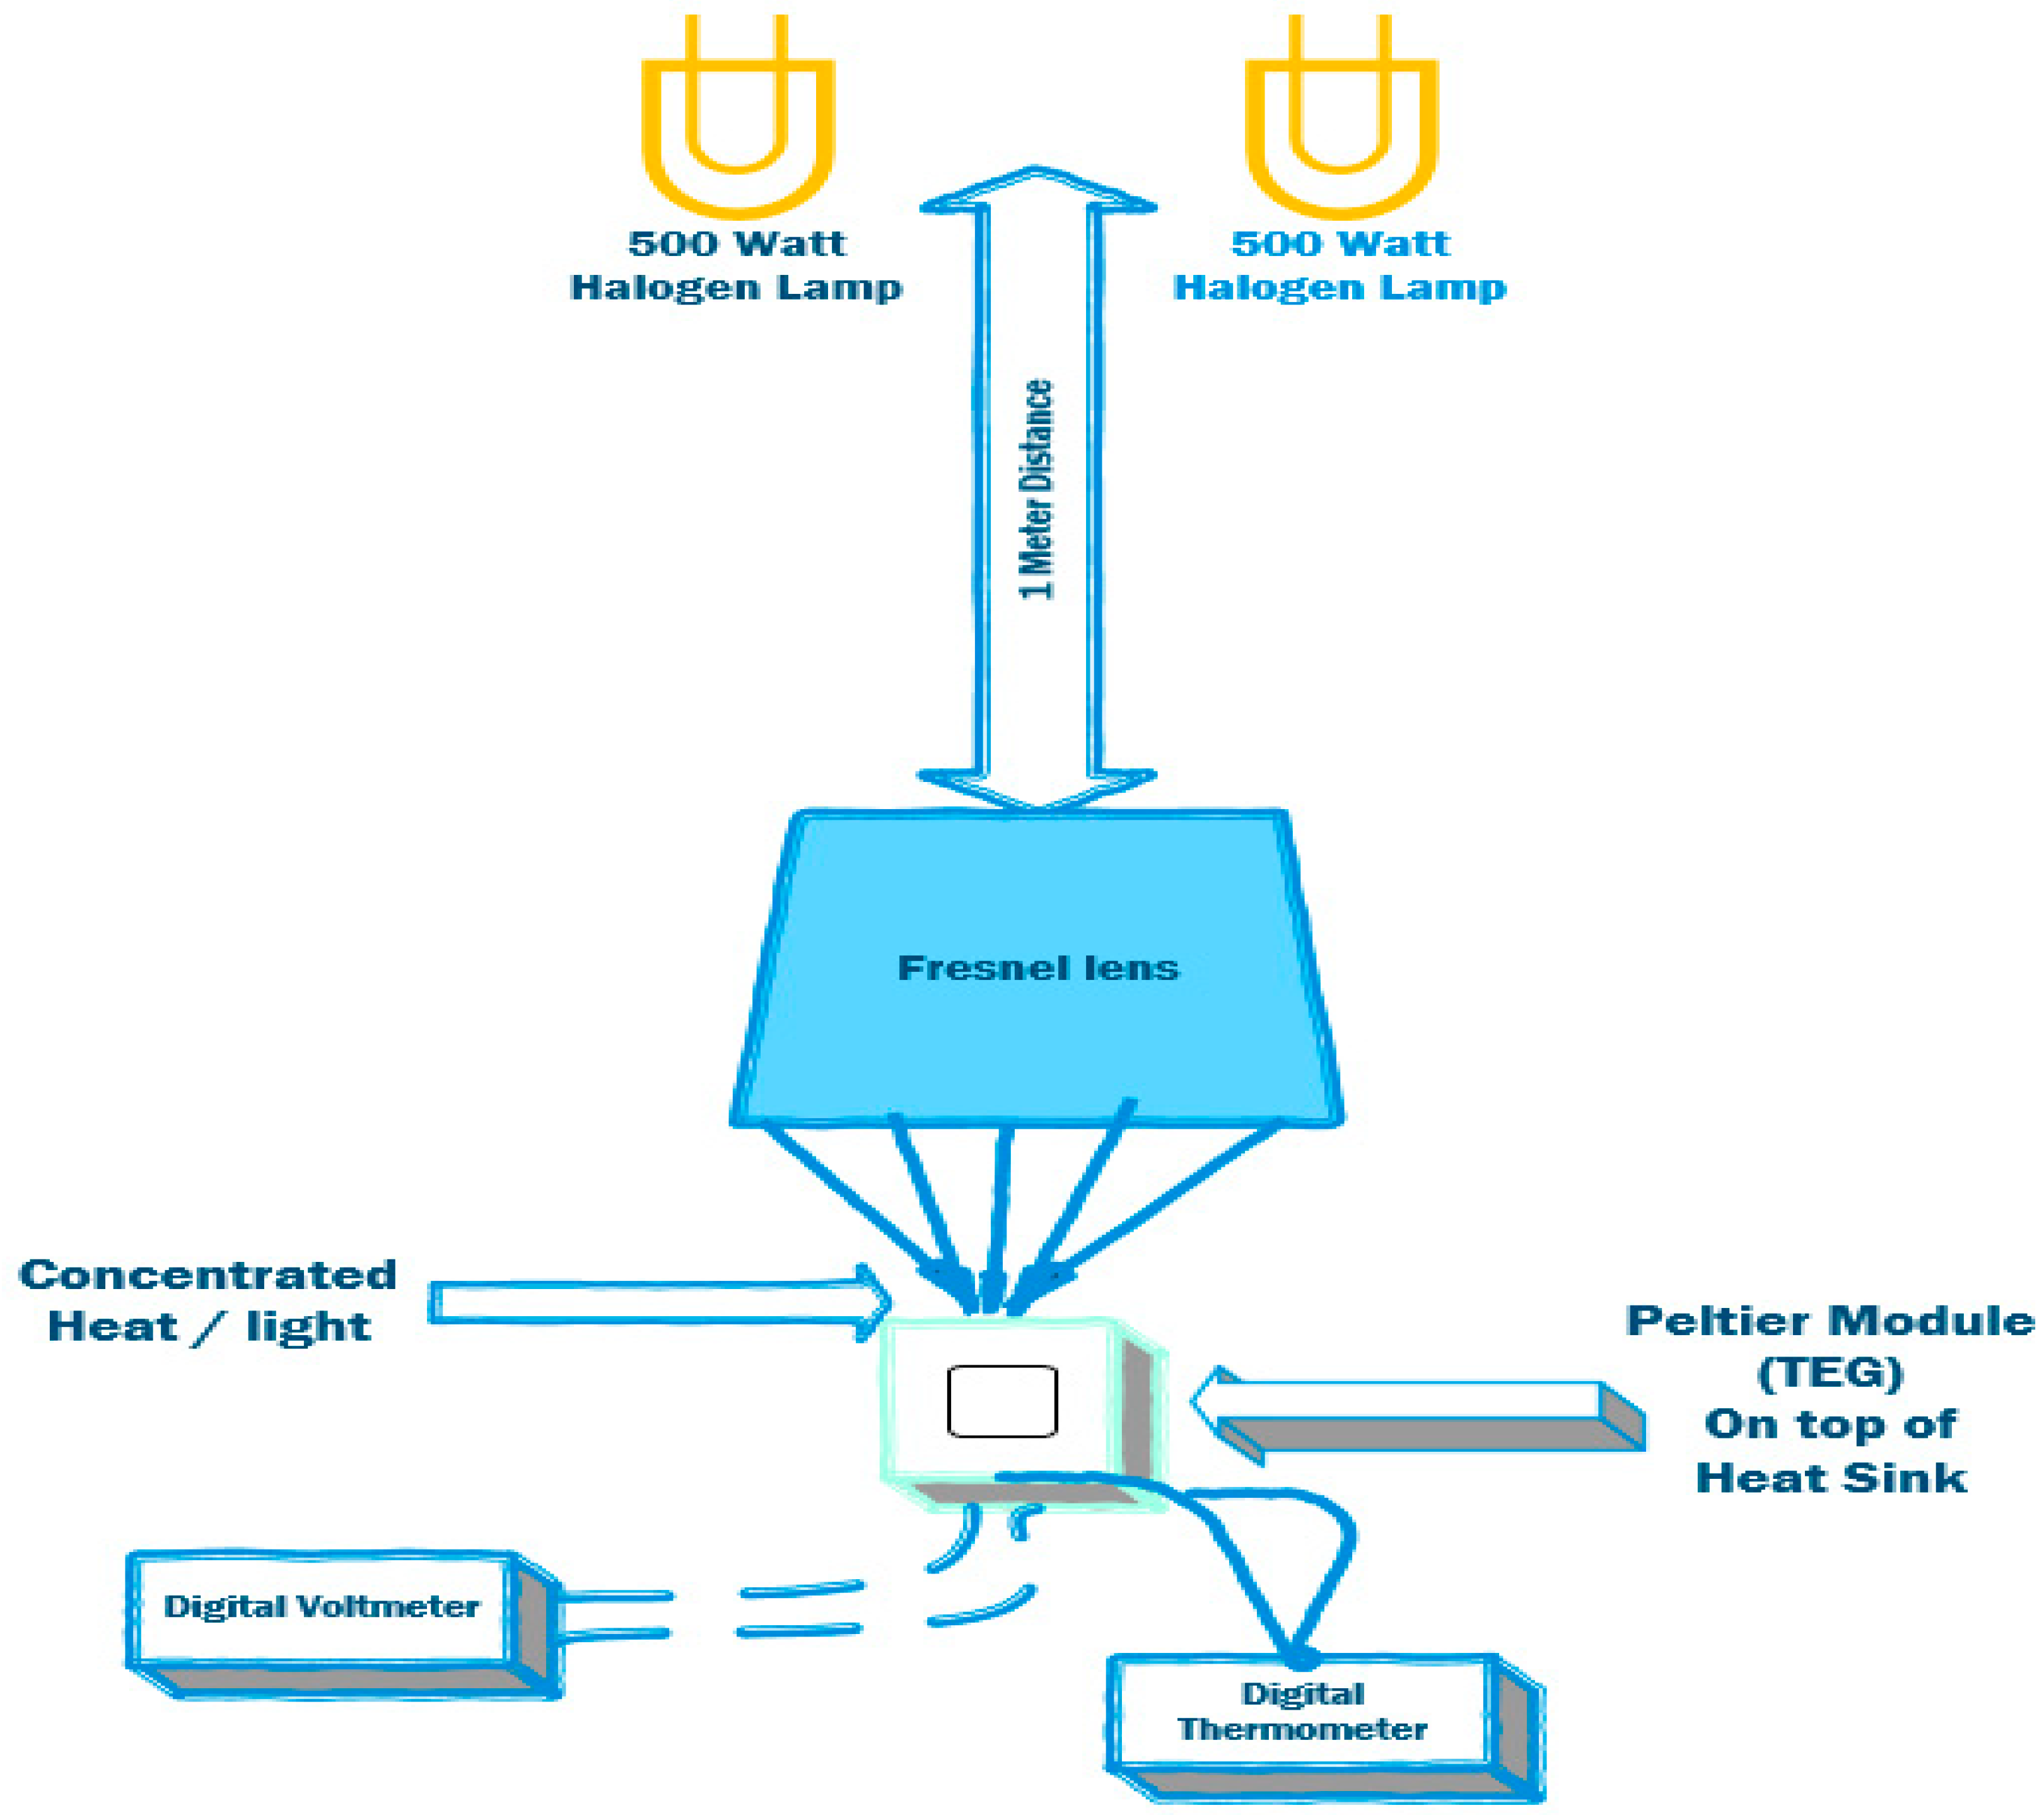
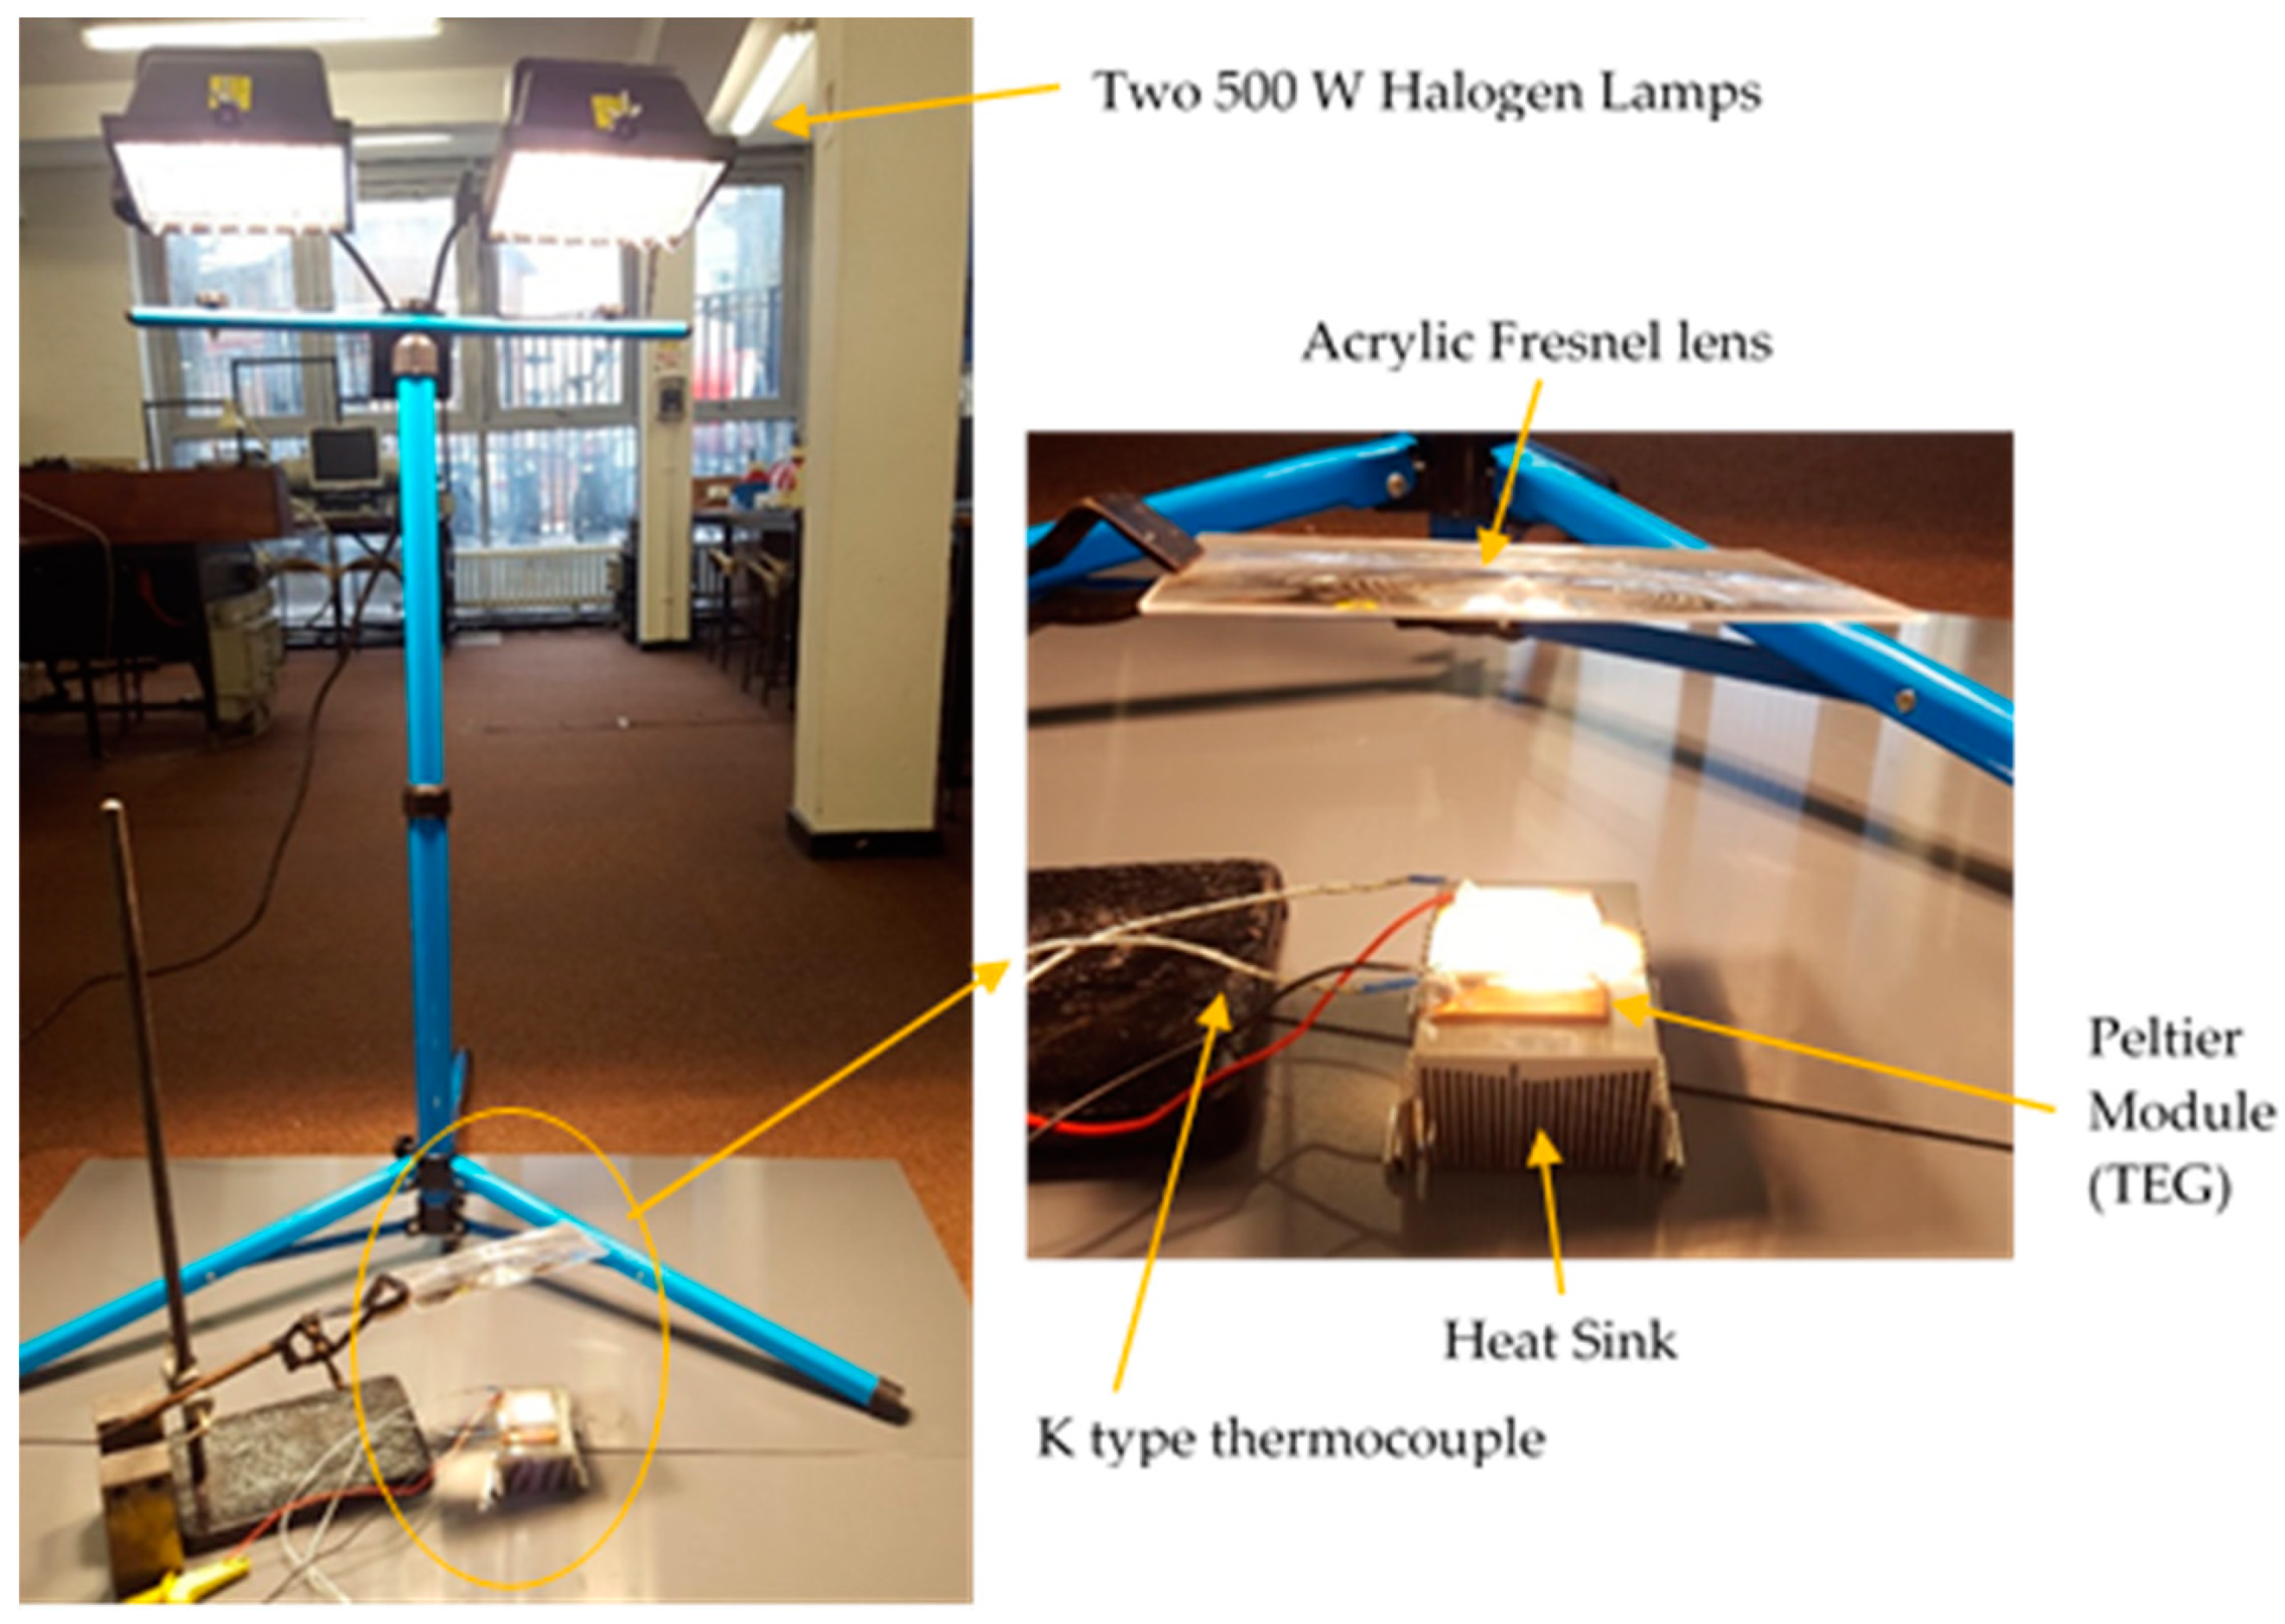
2.2.3. System Components for Quartz-Halogen Radiative Heat Harvesting Using Fresnel Lens with Peltier TEG Module

Specific to glass and steel manufacturing industries, the scope of the conversion of high radiative heat and light into electrical power has been experimentally investigated. In this part, the experimental setup was designed with two 500 W quartz-halogen lamps and acrylic Fresnel lens (dimensions of 280 mm × 280 mm × 2 mm, magnification 3×, 50 grooves/inch, and focal length 220 mm), harnessing the radiative heat and light concentrated onto the Peltier module connected to the heat sink, as shown in Figure 6. Acrylic Fresnel lenses are usually are a good choice for concentrating quartz-halogen radiation, as they are economical, have small volume and less weight, and, additionally, they increase the energy density effectively [21]. Fresnel lens is the flat optical part of a conventional lens. As the surface of the lens consists of small concentric grooves, the lens is approximated in such a way that each separate groove behaves like a separate prism [21]. Solar thermal systems for intermediary temperature range use solar concentrators. Fresnel lens are categorised as either imaging Fresnel lens or as non-imaging Fresnel lens. However, for this experiment, the non-imaging Fresnel lens are utilised. Non-imaging Fresnel lens are made in such a way that they concentrate the quartz-halogen radiation at a point as high as hypothetically possible. These types of lenses have two main factors, which are the focal length and the aperture. When the Fresnel lens is exposed directly to quartz-halogen lamp, the light coming out of the lens from the opposite direction will fall on to the Peltier device, and this light will be of increased concentration [22]. The open circuit voltage and temperature obtained were displayed on the digital voltmeter and thermometer, respectively. The distance of 1 m has been maintained between the Fresnel lens and the halogen lamps. It was made sure by varying the angle of the Fresnel lens that the maximum concentration was achieved when the halogen lamps and the Fresnel lens were parallel to each other, as shown in Figure 7. This is because when the angle of the Fresnel lens was changed, the amount of heat concentrated was decreased, and there was only one position where the maximum concentration occurred, and that was when the lens was directly facing the halogen lamp. After finding the maximum concentration point, the Peltier module attached to heat sink was placed under it. It must be noted that the concentrated heat was not covering the whole of the surface of the Peltier device at the point of maximum concentration of heat.

3. Results and Discussion

3.1. Simulation Analysis on TEG Electrical Performance

The steady-state temperature dispersal between the heat-sink side was modelled to be constant at 30 K, and the heat-source side increased gradually to 390 K. Such a range of Δ T influences the voltage, power, and efficiency, as shown in Figure 8. It can be seen that increasing the heat-sink temperature increases the efficiency of not more than 2% at the Δ T of 360 K. However, negligible output power was predicted at the Δ T of 40 K, and such results are in good agreement with [2,23]. Moreover, this is due to the limitation of Z T ¯ , as the predictions show the maximum of 0.43 at Δ T of 390 K. However, the maximum Z T ¯ of 0.7 for Bi2Te3 with an achievable efficiency of 4.5% at the Seebeck coefficient of 250 µV/K was predicted, as shown in Figure 9.
Figure 10 shows a linear response between the efficiency/ Z T ¯ and Seebeck coefficient when Δ T of 390 K ( T h = 420 K and T c = 30 K) was kept constant. Figure 10a shows an increase of Seebeck coefficient from 1.85 to 2.04, influencing the efficiency from 0.11 to 0.13, which is considerably less because, as shown in Figure 10b, Z T ¯ increased from 0.32 to 0.4. It has been found that the performance of TEG greatly depends on Z T ¯ , as Δ T and the Seebeck coefficient ( α ) are directly proportional to it. The maximum electrical resistivity was predicted to be 1.64 × 10 6 Ω∙cm at the Z T ¯ of 0.4, and Δ T of 525 K. An increase of electrical resistivity to 1.82 × 10 6 Ω∙cm leads to a decrease of Z T ¯ to 0.38. The electrical resistivity ( ρ ) and the thermal conductivity ( k ) are inversely proportional to the thermoelectric figure of merit ( Z T ¯ ) , so when these values increase, then the performance and efficiency of the TEG decreases; likewise, when these two values decrease, then the efficiency increases. Therefore, it can be said that a large value of the Seebeck coefficient, a small value of the thermal conductivity, and a small value of the electrical resistivity, are crucial to attain a suitable value of Z T ¯ . The results obtained from the mathematical model of TEG confirm the theory that good thermoelectric materials should possess high thermoelectric Z T ¯ [19]. The thermal conductivity is proportional to the electrical conductivity (it accounts for the electron-charge carrier concentration), so increasing the electrical or thermal conductivity decreases the Seebeck coefficient, and that is why semiconductors are considered to be suitable. The recognition of a good thermoelectric material is that it has a Z T ¯ of ≥1 but, realistically, with Bi2Te3 material, it has been difficult to obtain. However, the values of Z T ¯ between two and three, at the normal room temperature, seemed optimistic [18], but there is a plenty of room for the improvement of materials, specifically, the nanomaterials.

3.2. Experimental Results

3.2.1. Direct Heat Harvesting with Heat-Stove TEG

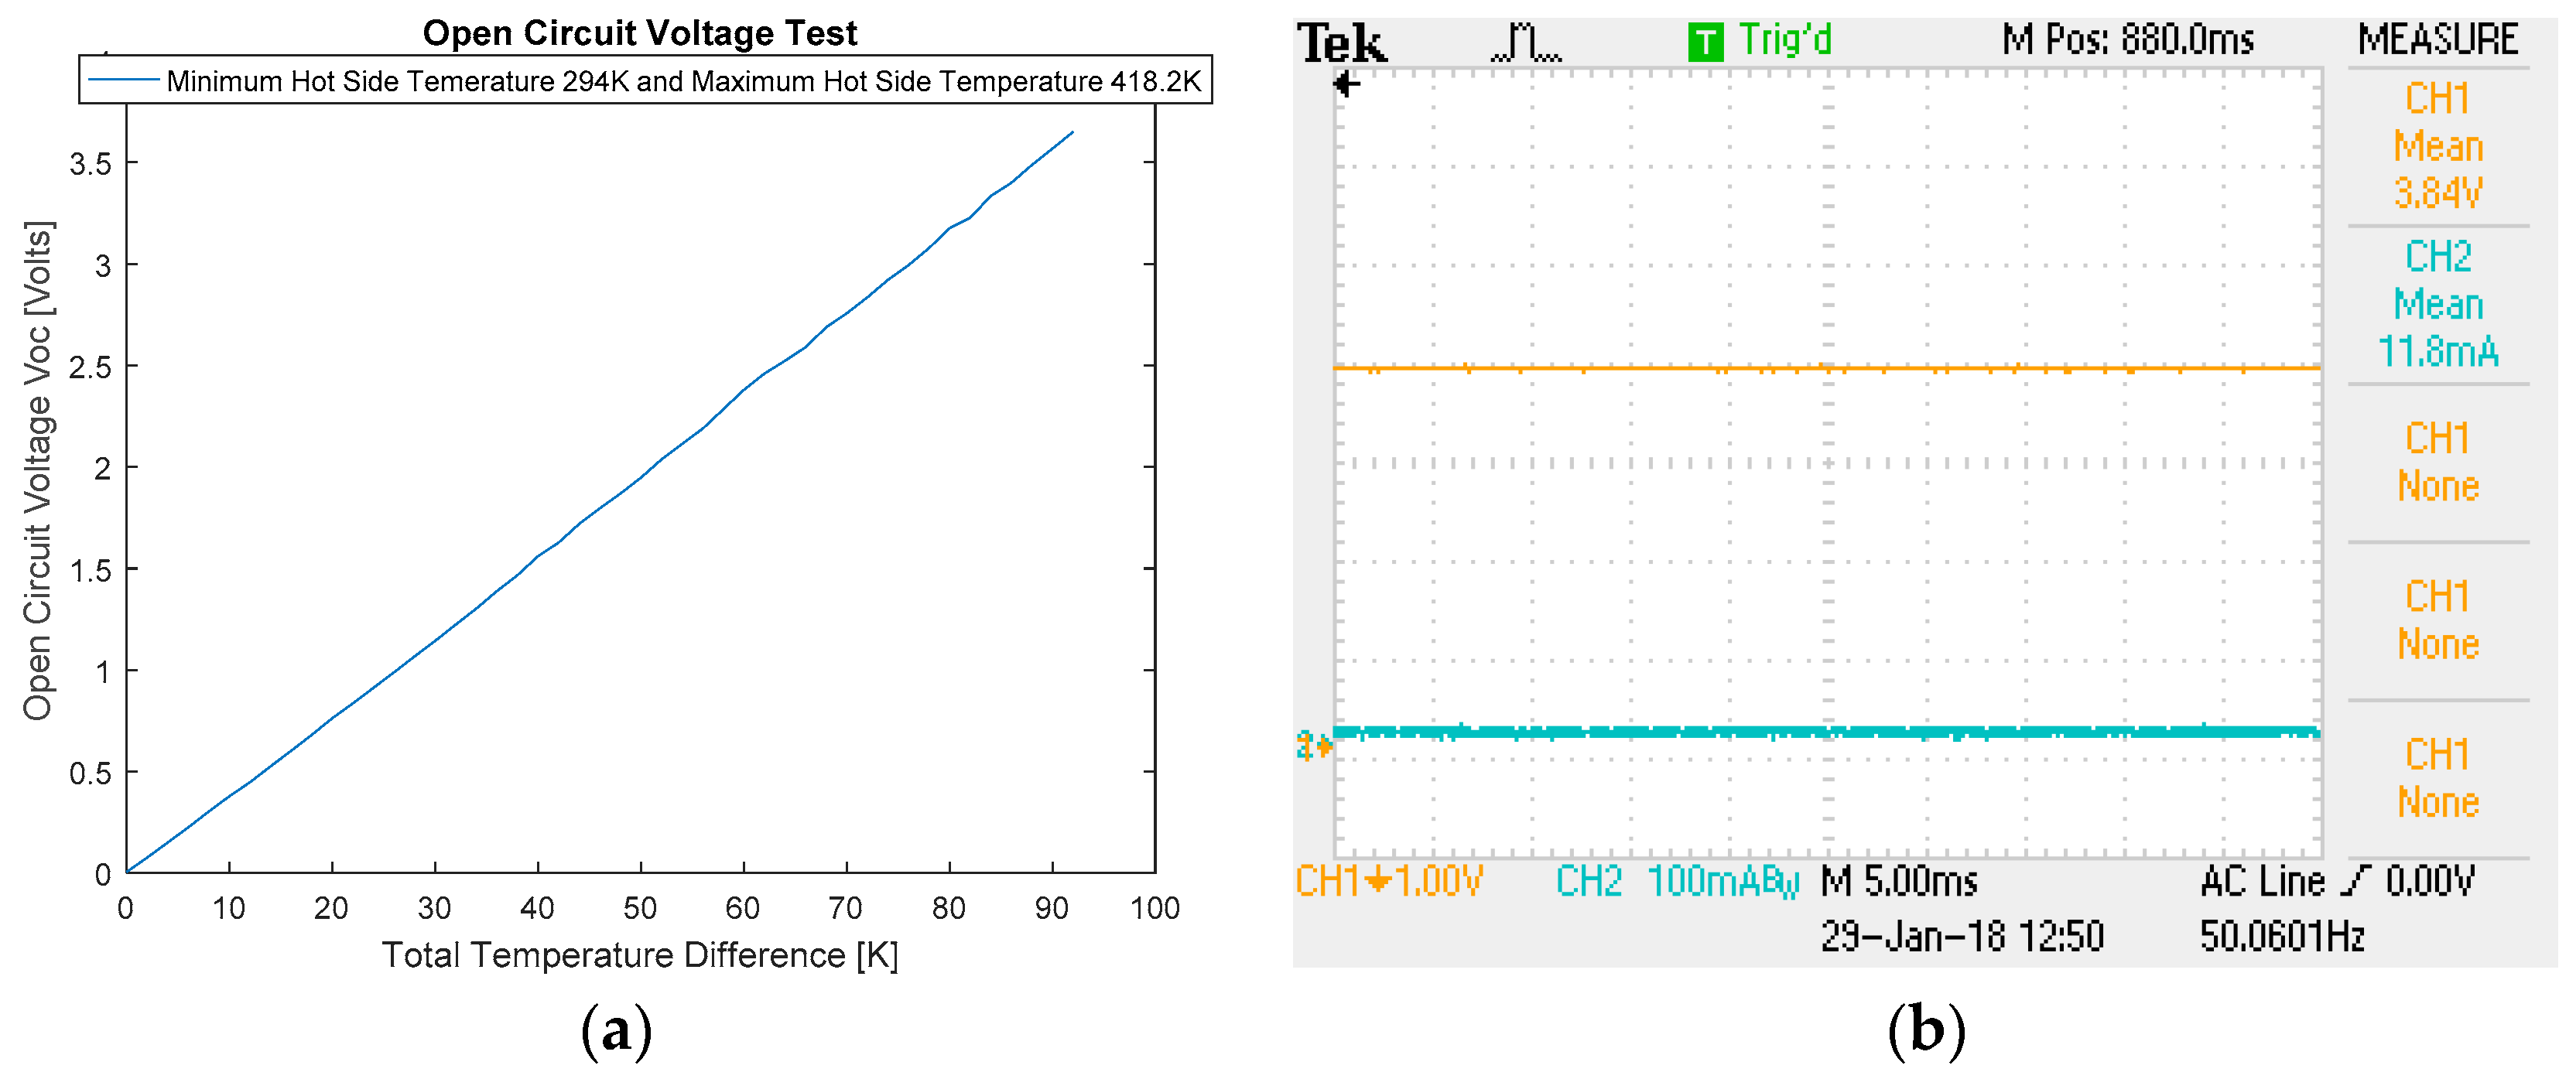
Open Circuit Voltage Test ( V o c )

Figure 11a shows open circuit voltage ( V o c ) performance for a TEG-127020 (from RS Electronics (London, UK), dimensions of 40 mm × 44 mm × 3.3 mm, both P- and N-type elements made of Bi2Te3, with the direct heat supplied using a hot plate, in which the minimum T h was set to 294 K, and the maximum T h set to 418.5 K, whilst the maximum T c was set to 40 °C, using a grid-integrated heat sink supported by small DC fan. A Δ T of 92 K between the two sides of the TEG was achieved, which were the maximum operating conditions. Several (at least three) experimental tests were conducted, and achieved, consistently, a V o c of 3.65 V. Figure 11b shows the open circuit current of 11.8 mA, due to scrounging effect of internal resistance of Peltier module contingent to heat conductivity, which reflects the performance under no-load situation, having a positive influence on the efficiency.

Short Circuit Current Test ( I s c )

Figure 12a shows the maximum short circuit current (Isc) of 0.93 A that was obtained at a temperature difference of 90 K, without damaging the thermoelectric device. A series of short circuit tests were conducted under the same temperature gradients, and it was found that the maximum Isc was recorded with was 1.04 A, as shown in Figure 12b. As the short circuit current test was carried out after the open circuit voltage test, and it was found out that the performance of the TEG module was not the same as when the open circuit voltage test was carried out in the first place. This is mainly due to the bonding of Bi2Te3 with electrodes, which expand due to the current and heat source causing heat, leading to tensile stresses. Such slight deviation of performance can be observed that, during the open circuit voltage test, a temperature of 418.2 K was achieved, while there was a temperature difference of 92 K between the two sides of the generator, whereas, in the short circuit current test, at a temperature of 427.7 K, there was only a temperature difference of 90 K between its two sides. The comparison between the two tests shows that the performance of the TEG deteriorated during the second test.

Full Load Test

Figure 13a shows the performance of full load tests at four different Δ T on the output load power connected to the variable external resistor, when RL was equivalent to Rin. For an increase of Δ T , the maximum power point (MPP) increases, similar to [3,24]. In theory, MPP occurs when VL and IL are approximately equivalent to half of the Voc and Isc, respectively. Figure 13b shows the VL of 1.68 V and IL 547 mA were achieved compared to the approximate half of the experimental Voc of 3.84 V and Isc of 1.04 A. However, Ri is dependent on Δ T , and is variable. The output load power (PL) on the left of the Figure 13a shows the situation below MPP (or below IL of 0.3 A), due to less direct heat supply causing a decrease in current and RL and, in this case, is underloaded. The output power on the right of the Figure 13a shows the situation over MPP (or above IL of 0.3 A), due to increased direct heat supply. An accurate MPP was achieved when Δ T was continued at 64.7 K for this single TEG, and is approximately 0.42 W.

3.2.2. Peltier Electrical Failure Mode Analysis under Extreme Temperature Variance

TEG modules do encounter performance deterioration due to heat-induced stresses [24,25]. Quantifying the influence of extreme temperature variance on Voc provides insight into the unswerving workings of a commercial-scale TEG (SP1848-27145 from RS Electronics). Figure 14 shows the Voc performance of TEG subjected to minimum and maximum temperatures of 297.1 K and 439 K, respectively. The Voc of 2.55 V was achieved at the maximum Δ T of 55.6 K. Peltier failed to function when operated at 439 K, because it expands on the hot side, and contracts on the cold side, causing internal stresses, specifically, to the soldered joints of P–N pairs; typically, there are 126 pairs and, if one fails, the others fail due to the series connection and the Voc dropping to zero. Conversely, the temperature increases excitation across the energy gap in an electron-hole pair, resulting in the deterioration to Seebeck coefficient, and the bipolar effect increases the heat conductance of Bi2Te3 composite.

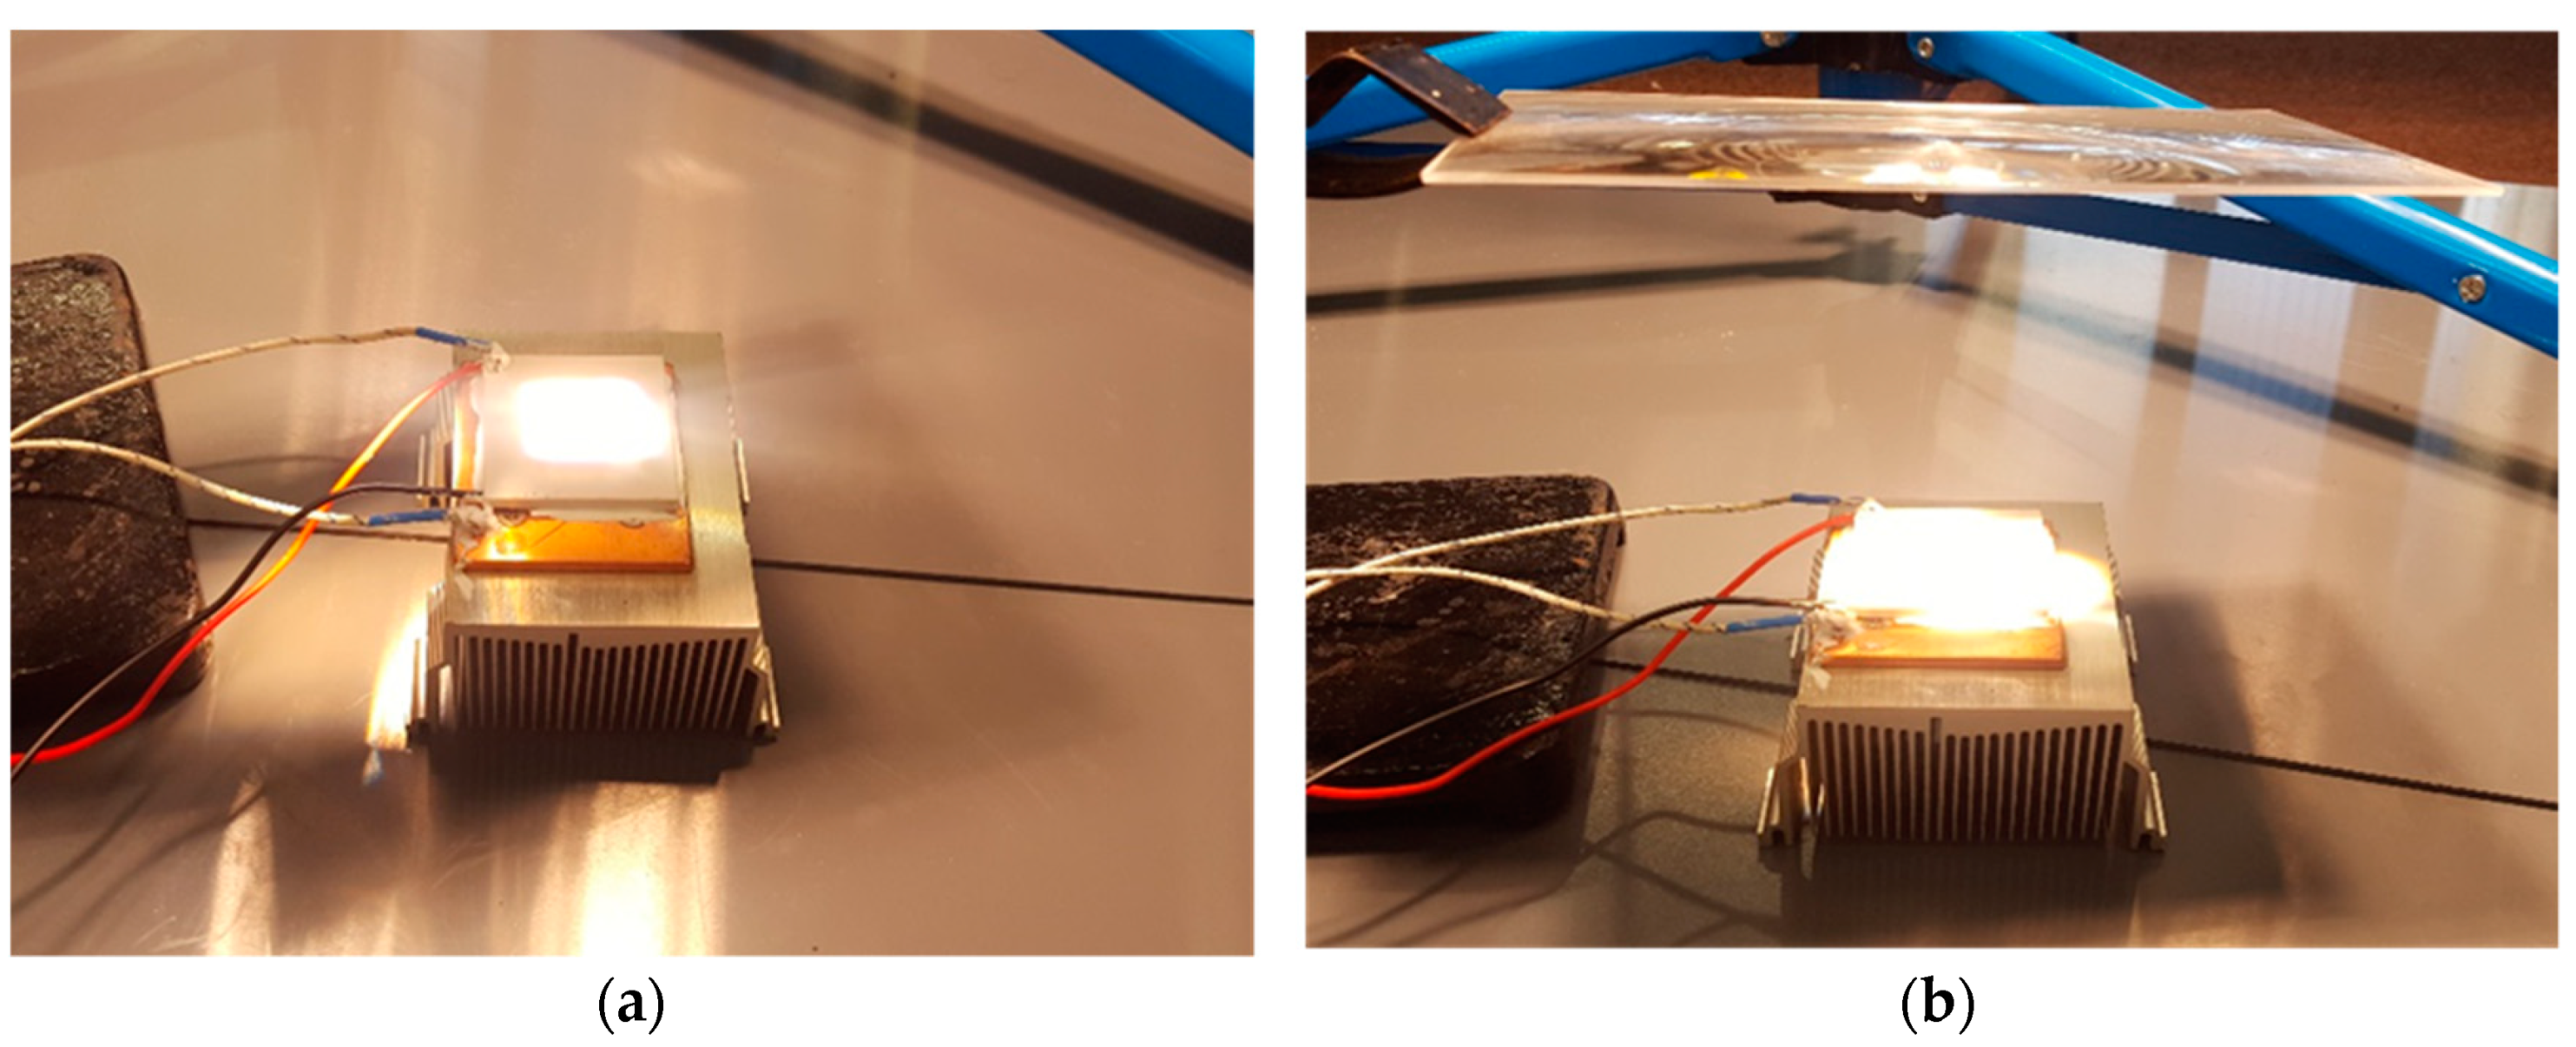
3.2.3. Concentrated Quartz-Halogen Light and Radiative Heat Harvesting Using Fresnel Lens with Peltier TEG Module

Two quartz-halogen lamps, each of 500 W, emit light and radiative heat concentrated with an acrylic Fresnel lens onto the TEG (SP1848-27145) module. The Fresnel lens concentrated some of the emitted heat and light onto the surface of the hot side of the TEG, while some of the heat and light was being reflected back to the halogen lamp. After initial tests, it was found that the distance of approximately 1 m should be maintained between quartz-halogen lamp and the Fresnel lens whilst 13 cm distance between Fresnel lens and the TEG was maintained. The hot-side surface temperature of the TEG module was measured before and after the point of maximum concentration, as shown in Figure 15. The temperature above the Fresnel lens was measured to be 294.2 K, and the temperature after concentration of heat above the surface of the TEG was measured to be 330 K, with an achieved Δ T of 35.8 K. It was noticed that concentrated light was not covering the whole surface area of the hot side of the TEG. Now, as soon as the light fell on the Peltier device at the point of maximum concentration, there was a change in voltage, but as the Δ T was not sufficient enough, a maximum of only 0.0225 V was obtained, and even after a longer period of time, the voltage remained constant, at 0.0225 V. The reason for this small amount of voltage was found to be that the halogen lamps were dispersing heat in all directions, and as the lens was placed at a large distance of 1 m, the heat captured by the Fresnel lens was very small, due to which, the voltage achieved was very small. When the angle of the lens was tilted in such a way that it was not concentrating the maximum heat but, instead, now, the heat was covering the whole surface area of the TEG module. The temperature measured before concentration on top of the lens was found to be 293 K, and the temperature measured after concentration was found to be 309 K; this was obtained when the lens was placed at a distance of 0.98 m from the lens covering a wide surface area of TEG. As it can be observed, the amount of heat concentrated now is less than the one measured before but, this time, the maximum voltage obtained was 0.0257 V, which is more than the previously obtained value of 0.0296 V. This behaviour of the TEG shows that, although a greater temperature difference is required between the two sides of the device in order to produce greater voltage, it is also important that the temperature distribution on the surface of the Peltier device is even. Although, with this experiment, the results were not as expected, as it was not performed under the ideal conditions of the solar radiations, but it helped to demonstrate the quartz-halogen scope; in order to get a reasonable amount of output voltage, the temperature should be evenly distributed on the surface of the thermoelectric devices. Even and uneven distribution of heat onto the surface of TEG is shown in Figure 16. Figure 16a shows the thermoelectric module, where the light is focused at the centre of the device, is the one where there is more concentration of heat, but its performance is poor, as it produces less Voc. Figure 16b shows the light and heat are evenly distributed on the surface of the Peltier but, although that the concentrated heat is not a high temperature, it still produces comparably higher Voc.

4. Conclusions

The scope of TEG in improving the EV battery performance and glass/steel manufacturing industries could achieve wider significance by harnessing the unused radiative heat and light conversion to electrical power. This work presents experimental and analytical simulation analyses on the electrical performance of TEG modules for the scope of direct and concentrated quartz-halogen heat harvesting. The analytical simulation shows that increasing the heat-sink temperature increases the efficiency by not more than 2% at the Δ T of 360 K, due to the limitation of the Z T ¯ of 0.43 at Δ T of 390 K. The maximum Z T ¯ of 0.7 for Bi2Te3, with an achievable efficiency of 4.5% at the Seebeck coefficient of 250 µV/K, was predicted. The maximum electrical resistivity was predicted to be 1.64 × 10 6 Ω∙cm at the Z T ¯ of 0.4 and Δ T of 525 K. An increase of electrical resistivity of 1.82 × 10 6 Ω∙cm leads to a decrease of Z T ¯ to 0.38. The results were obtained from the mathematical model of TEG. The recognition of a good thermoelectric material is that it has a Z T ¯ of ≥1 but, realistically, with Bi2Te3 material, it has been difficult to obtain. In the first experimental setup, a commercial heat-stove TEG-127020, dimensions of 40 mm × 44 mm × 3.3 mm (both P- and N-type elements made of Bi2Te3) supplied with direct heat through a hot-plate and grid-integrated heat sink, supported by small DC fan, was investigated for its electrical performance. The V o c of 3.65 V and Ioc of 11.8 mA at the Δ T of 92 K were achieved; the Ioc was due to the scrounging effect of internal resistance of Peltier module contingent to heat conductivity, and it reflects the performance under a no-load situation, having a positive influence on the efficiency. The Isc of 0.93 A was obtained at Δ T of 90 K, without damaging the thermoelectric device. A series of short circuit tests were conducted under the same temperature gradients, and it was found that the maximum Isc recorded was 1.04 A. The comparison between the two tests show the electrical performance of the TEG deteriorated during the short circuit test. The full load tests, at four different Δ T on the output load power, connected to the variable external resistor when RL equivalent to Ri, were performed, and show that, for an increase of Δ T , the maximum power point (MPP) increases. The VL of 1.68 V and IL 547 mA were achieved compared to the approximate half of the experimental Voc of 3.84 V and Isc of 1.04 A. However, Ri is dependent on Δ T , and is variable. An accurate MPP of 0.42 W was achieved when Δ T was continued at 64.7 K. In the second experimental setup, the influence of extreme temperature variance on the Voc of TEG (SP1848-27145), dimensions of 40 mm × 40 mm × 3.4 mm, was investigated. A Voc of 2.55 V was achieved at the maximum Δ T of 55.6 K. Peltier failed to function when operated at 439 K, because it expands on the hot side and contracts on the cold side, causing internal stresses, specifically, to the soldered joints of P–N pairs; typically, there are 126 pairs and, if one fails, the others fail due to series connection and the Voc dropping to zero. Conversely, the temperature increases excitation across the energy gap in electron–hole pair, resulting in the deterioration of the Seebeck coefficient, and the bipolar effect increases the heat conductance of Bi2Te3 composite. In the third experimental setup, the electrical performance correlated to concentrated with acrylic Fresnel lens quartz-halogen heat-light harvesting scope, on a TEG (Peltier) module coupled with heat sink, was investigated. The experimental results show that a Δ T of 35.8 K achieved a Voc of 0.0225 V at the point of maximum concentration covering the small surface area. Covering the whole surface area of TEG at a distance of 0.98 m between the quartz-halogen lamp and Fresnel lens achieved a Voc of 0.0296 V at the Δ T of 16 K. The light focused at the centre of the hot-side surface of TEG shows a comparably higher concentration of heat, but its performance is poor, as it produces less Voc. When the light and heat are evenly distributed on the surface of the hot-side TEG, it produces comparably higher Voc, despite the fact the concentrated heat was comparably lower. Experimental results show that there is a necessity for DC–DC converters, but it is not certain that the consistent maximum power point could be achieved. The analytical simulation model could be advanced, that should consider the extreme temperature variances and the influence of improving P and N element insulation with triple vacuum glass [26] on the electrical performances of TEG, which would greatly contribute to a next-generation EV and glass/steel manufacturing industries in harnessing unused energy.

Author Contributions

Conceptualization, methodology, validation, wrote the paper, review and editing, and supervision S.M.; software, laboratory work, validation, formal analysis, K.N.T.

Funding

This research received no external funding and is a self-initiated research project by the corresponding author at London South Bank University.

Acknowledgments

Authors would like to thank the Electrical Power Laboratory technician, Peter Adams.

Conflicts of Interest

The authors declare no conflict of interest.

Abbreviations

Nomenclature
αSeebeck coefficient (V/K)
Vvoltage (V)
Icurrent (A)
kthermal conductivity (Wcm−1K−1)
ρ electrical Resistivity (Ω∙cm)
Z T ¯ figure of merit (dimensionless)
Δ T temperature difference (K)
T temperature (K)
T ¯ average temperature (K)
Kthermal conductance (Wcm−2K−1)
Rresistance (Ω)
Llength of thermoelectric element (cm)
Qheat flow (W)
ηheat-to-power conversion efficiency (%)
Ppower (W)
Across-sectional area (cm−2)
TEGthermoelectric generator
DCdirect current
MPPmaximum power point
EVelectric vehicle
MATLABmatrix laboratory software
Subscripts
ocopen circuit
scshort circuit
p, nsemiconductor properties showing impurity doping
iinternal
Lload
Hhot side
ccold side
mpmaximum power
mcmaximum conversion
Chemical Formula
Bi2Te3bismuth telluride

References

  1. Montecucco, A.; Siviter, J.; Knox, A.R. The effect of temperature mismatch on thermoelectric generators electrically connected in series and parallel. Appl. Energy 2014, 123, 47–54. [Google Scholar] [CrossRef]
  2. Tang, Z.B.; Deng, Y.D.; Su, C.Q.; Shuai, W.W.; Xie, C.J. A research on thermoelectric generator’s electrical performance under temperature mismatch conditions for automotive waste heat recovery system. Case Stud. Therm. Eng. 2015, 5, 143–150. [Google Scholar] [CrossRef]
  3. Goldsmid, H.J. Bismuth telluride and its alloys as materials for thermoelectric generation. Materials 2014, 7, 2577–2592. [Google Scholar] [CrossRef] [PubMed]
  4. Rocha, R.P.; Carmo, J.P.; Goncalves, L.M.; Correia, J.H. An energy scavenging microsystem based on thermoelectricity for battery life extension in laptops. In Proceedings of the 35th Annual Conference of IEEE Industrial Electronics, Porto, Portugal, 3–5 November 2009; pp. 1813–1816. [Google Scholar] [CrossRef]
  5. Xie, W.T.; Dai, Y.J.; Wang, R.Z.; Sumathy, K. Concentrated solar energy applications using Fresnel lenses: A review. Renew. Sustain. Energy Rev. 2011, 15, 2588–2606. [Google Scholar] [CrossRef]
  6. Nia, M.H.; Nejad, A.A.; Goudarzi, A.M.; Valizadeh, M.; Samadian, P. Cogeneration solar system using thermoelectric module and fresnel lens. Energy Convers. Manag. 2014, 84, 305–310. [Google Scholar] [CrossRef]
  7. Polozine, A.; Sirotinskaya, S.; Schaeffer, L. History of development of thermoelectric materials for electric power generation and criteria of their quality. Mater. Res. 2014, 17, 1260–1267. [Google Scholar] [CrossRef] [Green Version]
  8. Rowe, D.M. Thermoelectrics Handbook: Macro to Nano; CRC Press: Boca Raton, FL, USA, 2005; ISBN 9781420038903. [Google Scholar]
  9. Goldsmid, H.J. The Thermoelectric and Related Effects. In Introduction to Thermoelectricity; Springer: Berlin/Heidelberg, Germany, 2016; pp. 1–7. [Google Scholar] [CrossRef]
  10. Tritt, T.M.; Subramanian, M.A. Thermoelectric materials, phenomena, and applications: A bird’s eye view. MRS Bull. 2006, 31, 188–198. [Google Scholar] [CrossRef]
  11. Telkes, M. Solar thermoelectric generators. J. Appl. Phys. 1954, 25, 765–777. [Google Scholar] [CrossRef]
  12. Kraemer, D.; Jie, Q.; McEnaney, K.; Cao, F.; Liu, W.; Weinstein, L.A.; Loomis, J.; Ren, Z.; Chen, G. Concentrating solar thermoelectric generators with a peak efficiency of 7.4%. Nat. Energy 2016, 1, 16153. [Google Scholar] [CrossRef] [Green Version]
  13. Appel, O.; Zilber, T.; Kalabukhov, S.; Beeri, O.; Gelbstein, Y. Morphological effects on the thermoelectric properties of Ti 0.3 Zr 0.35 Hf 0.35 Ni 1+ δ Sn alloys following phase separation. J. Mater. Chem. C 2015, 3, 11653–11659. [Google Scholar] [CrossRef]
  14. Appel, O.; Schwall, M.; Mogilyansky, D.; Köhne, M.; Balke, B.; Gelbstein, Y. Effects of microstructural evolution on the thermoelectric properties of spark-plasma-sintered Ti 0.3 Zr 0.35 Hf 0.35 NiSn half-Heusler compound. J. Electron. Mater. 2013, 42, 1340–1345. [Google Scholar] [CrossRef]
  15. Mastbergen, D.; Willson, B.; Joshi, S. Producing light from stoves using a thermoelectric generator. Ethos 2005. Available online: http://everredtronics.com/files/Mastbergen_ETHOS_lighting_power_from_STOVE.pdf (accessed on 2 February 2018).
  16. Ming, T.; Yang, W.; Huang, X.; Wu, Y.; Li, X.; Liu, J. Analytical and numerical investigation on a new compact thermoelectric generator. Energy Convers. Manag. 2017, 132, 261–271. [Google Scholar] [CrossRef]
  17. Nemani, S.V.; Shahi, D.; De, M. Effective generation of electrical energy from exhaust gases in automobiles. In Proceedings of the Power India International Conference (PIICON), Bikaner, India, 25–27 November 2016; IEEE: Piscataway, NJ, USA, 2016; Volume 25, pp. 1–6. [Google Scholar] [CrossRef]
  18. Goldsmid, H.J. Conversion efficiency and figure-of-merit. In CRC Handbook of Thermoelectrics; CRC Press: Boca Raton, FL, USA, 14 July 1995; pp. 19–25. ISBN 9780849301469. [Google Scholar]
  19. Lee, H.S. Thermal Design: Heat Sinks, Thermoelectrics, Heat Pipes, Compact Heat Exchangers, and Solar Cells; John Wiley & Sons: Hoboken, NJ, USA, 2010; ISBN 1118004701. [Google Scholar]
  20. Bobean, C.; Pavel, V. The study and modeling of a thermoelectric generator module. In Proceedings of the 2013 8th International Symposium on Advanced Topics in Electrical Engineering (ATEE), Bucharest, Romania, 23–25 May 2013; IEEE: Piscataway, NJ, USA, 2013; pp. 1–4. [Google Scholar] [CrossRef]
  21. Madhugiri, G.A.; Karale, S.R. High solar energy concentration with a Fresnel lens. A Review. Int. J. Mod. Eng. Res. 2012, 2, 1381–1385. [Google Scholar]
  22. Davis, A.; Kühnlenz, F. Optical design using Fresnel lenses: Basic principles and some practical examples. Optik Photonik 2007, 2, 52–55. [Google Scholar] [CrossRef]
  23. Liu, X.; Deng, Y.D.; Li, Z.; Su, C.Q. Performance analysis of a waste heat recovery thermoelectric generation system for automotive application. Energy Convers. Manag. 2015, 90, 121–127. [Google Scholar] [CrossRef]
  24. Choi, H.S.; Seo, W.S.; Choi, D.K. Prediction of reliability on thermoelectric module through accelerated life test and Physics-of-failure. Electron. Mater. Lett. 2011, 7, 271. [Google Scholar] [CrossRef]
  25. Baskaya, S.; Karaaslan, S.; Calisir, T.; Zeki Yilmazoglu, M.; Yilmaz, T.O. Experimental and Numerical Study on Thermoelectric Generator Performance Applied to a Condensing Combi Boiler. Heat Transf. Eng. 2015, 36, 1292–1302. [Google Scholar] [CrossRef]
  26. Memon, S. Analysing the potential of retrofitting ultra-low heat loss triple vacuum glazed windows to an existing UK solid wall dwelling. Int. J. Renew. Energy Dev. (IJRED) 2014, 3, 161–174. [Google Scholar] [CrossRef]
Figure 1. Schematic diagram of thermoelectric generator (TEG) composed of P- and N-type Bi2Te3 composite: one couple is illustrated here; typically, it consists of many couples depending on its size, showing the open circuit-generated voltage (Voc) obtained without RL. Full load voltage can be obtained when matched load resistance (RL) is connected. The internal TEG resistance (Ri) is dynamic, due to its dependency on the temperature differentials.
Energies 11 03315 g001
Figure 2. Schematic diagram of the direct heat harvesting method using a hot plate with heat-stove TEG for electrical performance testing.
Energies 11 03315 g002
Figure 3. Photographs of the experimental setup for open circuit, short circuit, and full load tests of heat-stove TEG with direct heat harvesting using a hot plate.
Energies 11 03315 g003
Figure 4. Schematic diagram of the direct heat harvesting method using Peltier TEG module connected with heat sink and ice-cooling to achieve larger temperature variance.
Energies 11 03315 g004
Figure 5. Photographs of the experimental setup for direct heat harvesting with Peltier TEG module connected with heat sink and ice-cooling to achieve larger temperature variance.
Energies 11 03315 g005
Figure 6. Schematic diagram of the concentrated quartz-halogen (2500 W lamps) radiative heat harvesting using Fresnel lens with Peltier module.
Energies 11 03315 g006
Figure 7. Photographs of the experimental setup for the concentrated quartz-halogen (two 500 W lamps) radiative heat harvesting using Fresnel lens with Peltier module.
Energies 11 03315 g007
Figure 8. Effect of temperature variance on efficiency, voltage, and power.
Energies 11 03315 g008
Figure 9. Effect of temperature variance on current and the thermoelectric figure of merit ( Z T ¯ ).
Energies 11 03315 g009
Figure 10. (a) Effect of increasing Seebeck coefficient from 1.85 × 10⁻⁴ to 2.04 × 10⁻⁴ on (a) efficiency and (b) figure of merit Z T ¯ showing an increase of efficiency from 0.11 to 0.13 and an increase of Z T ¯ from 0.32 to 0.4.
Energies 11 03315 g010
Figure 11. (a) Effect of temperature difference ( Δ T ) on open circuit voltage (Voc) and (b) oscilloscope DC Voc and Ioc response at 418.2 K (or Δ T of 92 K).
Energies 11 03315 g011
Figure 12. (a) Effect of temperature difference ( Δ T ) on short circuit current (Isc) and (b) oscilloscope DC Isc at 418.2 K (or Δ T of 90 K).
Energies 11 03315 g012
Figure 13. (a) Effect of full load tests at four different Δ T on the output load power (PL) connected to the variable load resistor (RL) equivalent to Ri, and (b) oscilloscope DC VL and IL, which is approximately half of the Voc and Isc showing the maximum power point.
Energies 11 03315 g013
Figure 14. Peltier electrical failure mode shows the Voc performance of TEG (SP1848-27145) subjected to minimum and maximum temperatures of 297.1 K and 439 K, respectively.
Energies 11 03315 g014
Figure 15. Graphical representation of the concentrated quartz-halogen heat and light showing the Voc covering the small and large surface area of the TEG module with respect to time in s.
Energies 11 03315 g015
Figure 16. (a) Quartz-halogen concentrated light and heat on to the surface area of TEG covering (a) centre (b) whole of the module.
Energies 11 03315 g016
Table 1. Specifications of heat-stove TEG.
Heat-Source TemperatureVoc (V)VL (V)IL (A)Ri (Ω)RL (Ω)PL (W)Tolerances (%)
373.15 K3.221.811.81.81.8±10
473.15 K8.544.2722.12.18.5±10
In these specifications, the heat-sink (cold) temperature is stated as 303.15 K.

