Performance of Practical Grounding Systems under High Impulse Conditions


Abstract
:1. Introduction
2. Experimental Arrangement
2.1. Soil Resistivity at Site
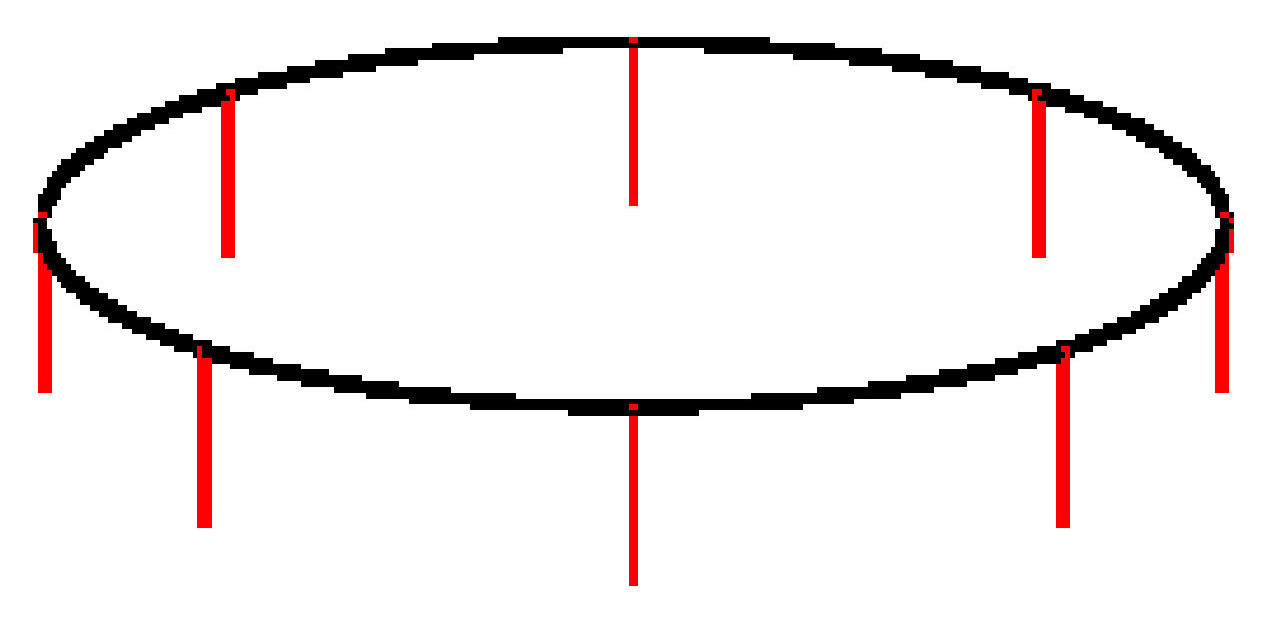
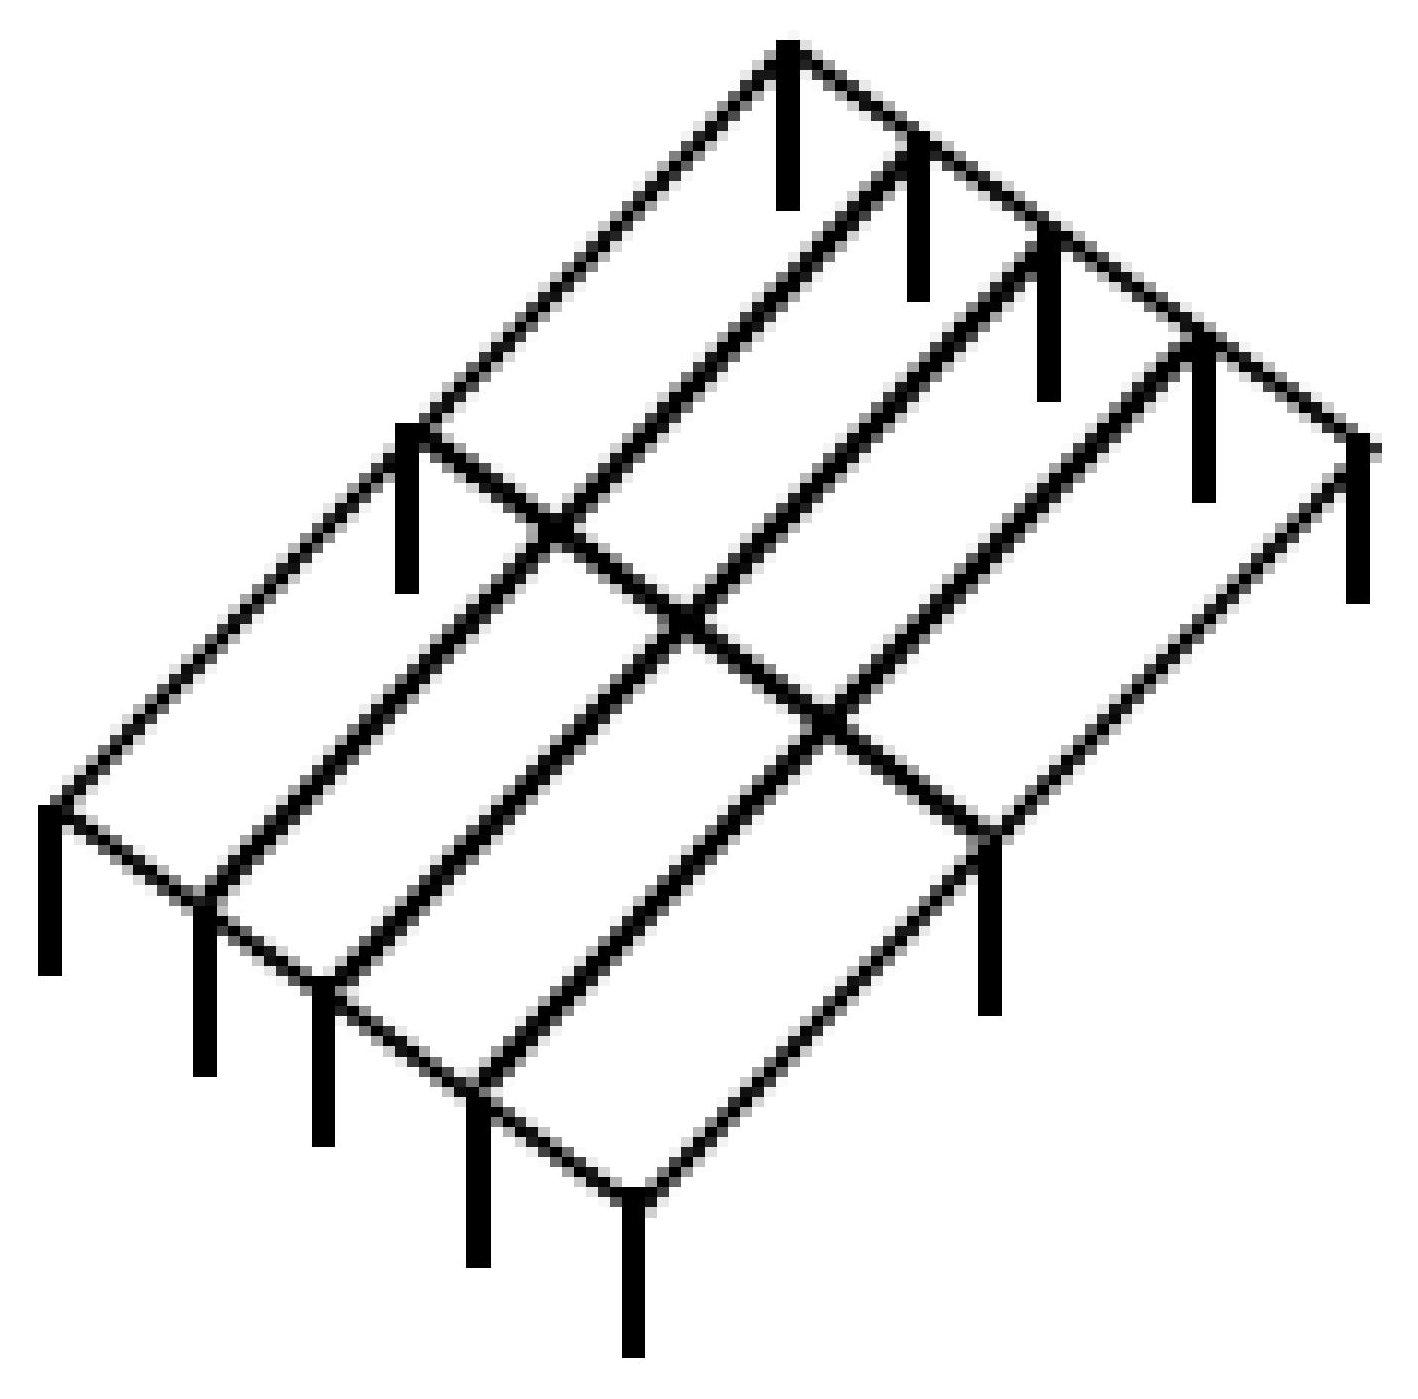
2.2. Ground Electrodes under Test
2.3. Remote Ground Electrodes
2.4. DC Resistances of Grounding Systems
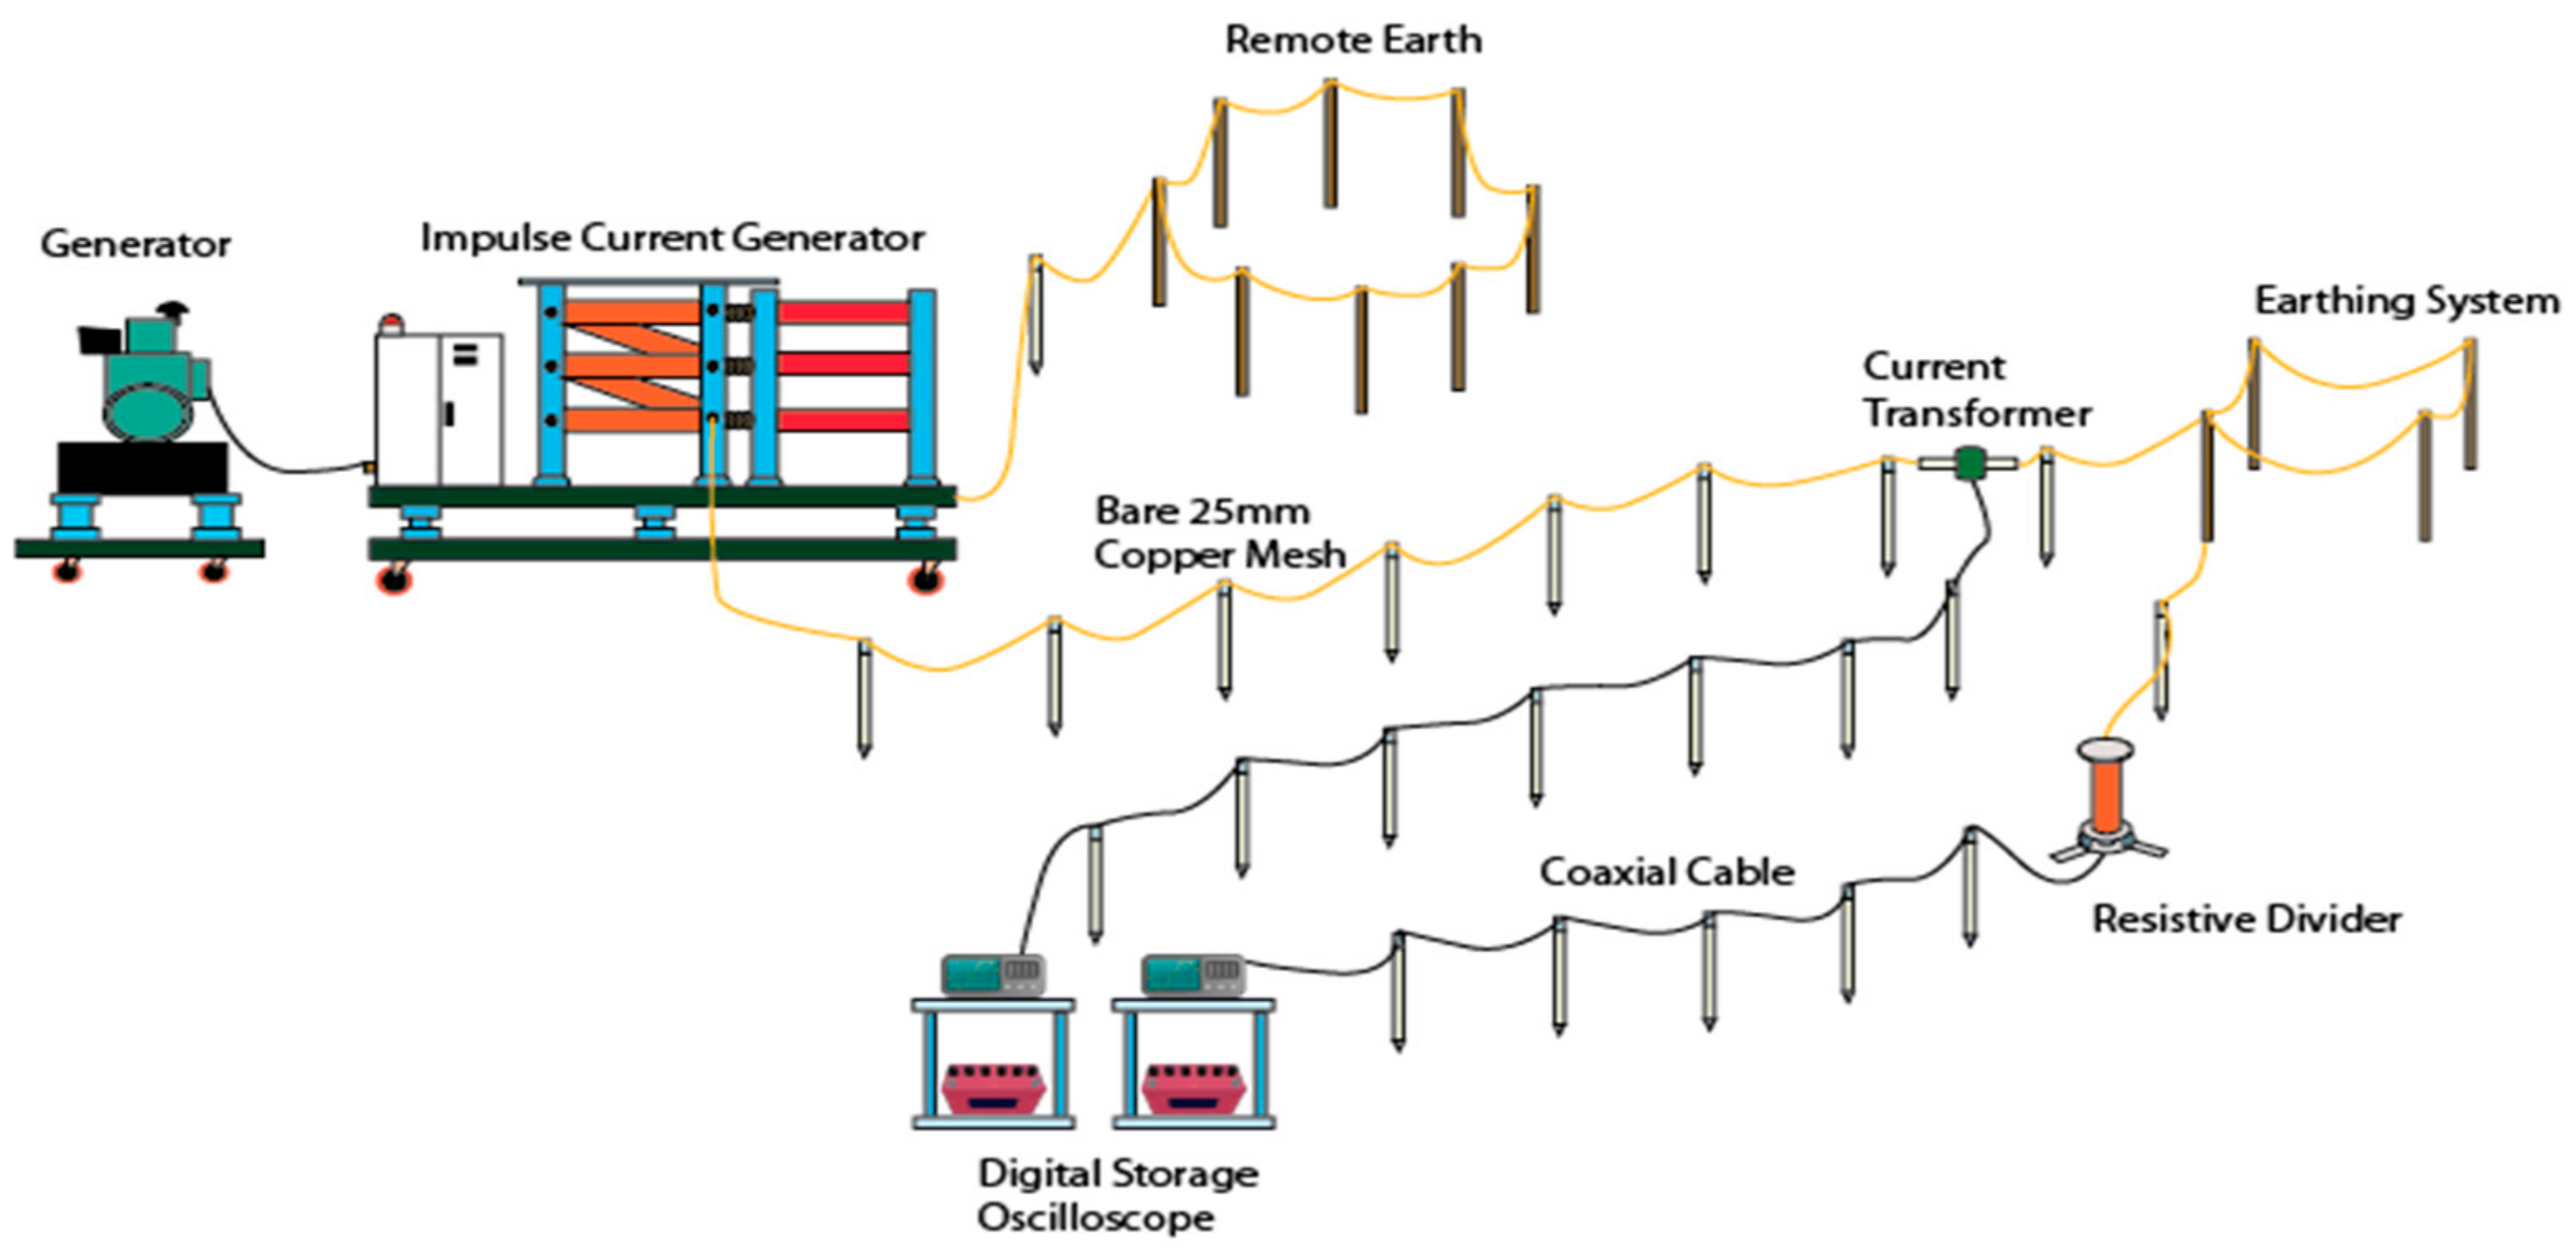
2.5. Test Set Up
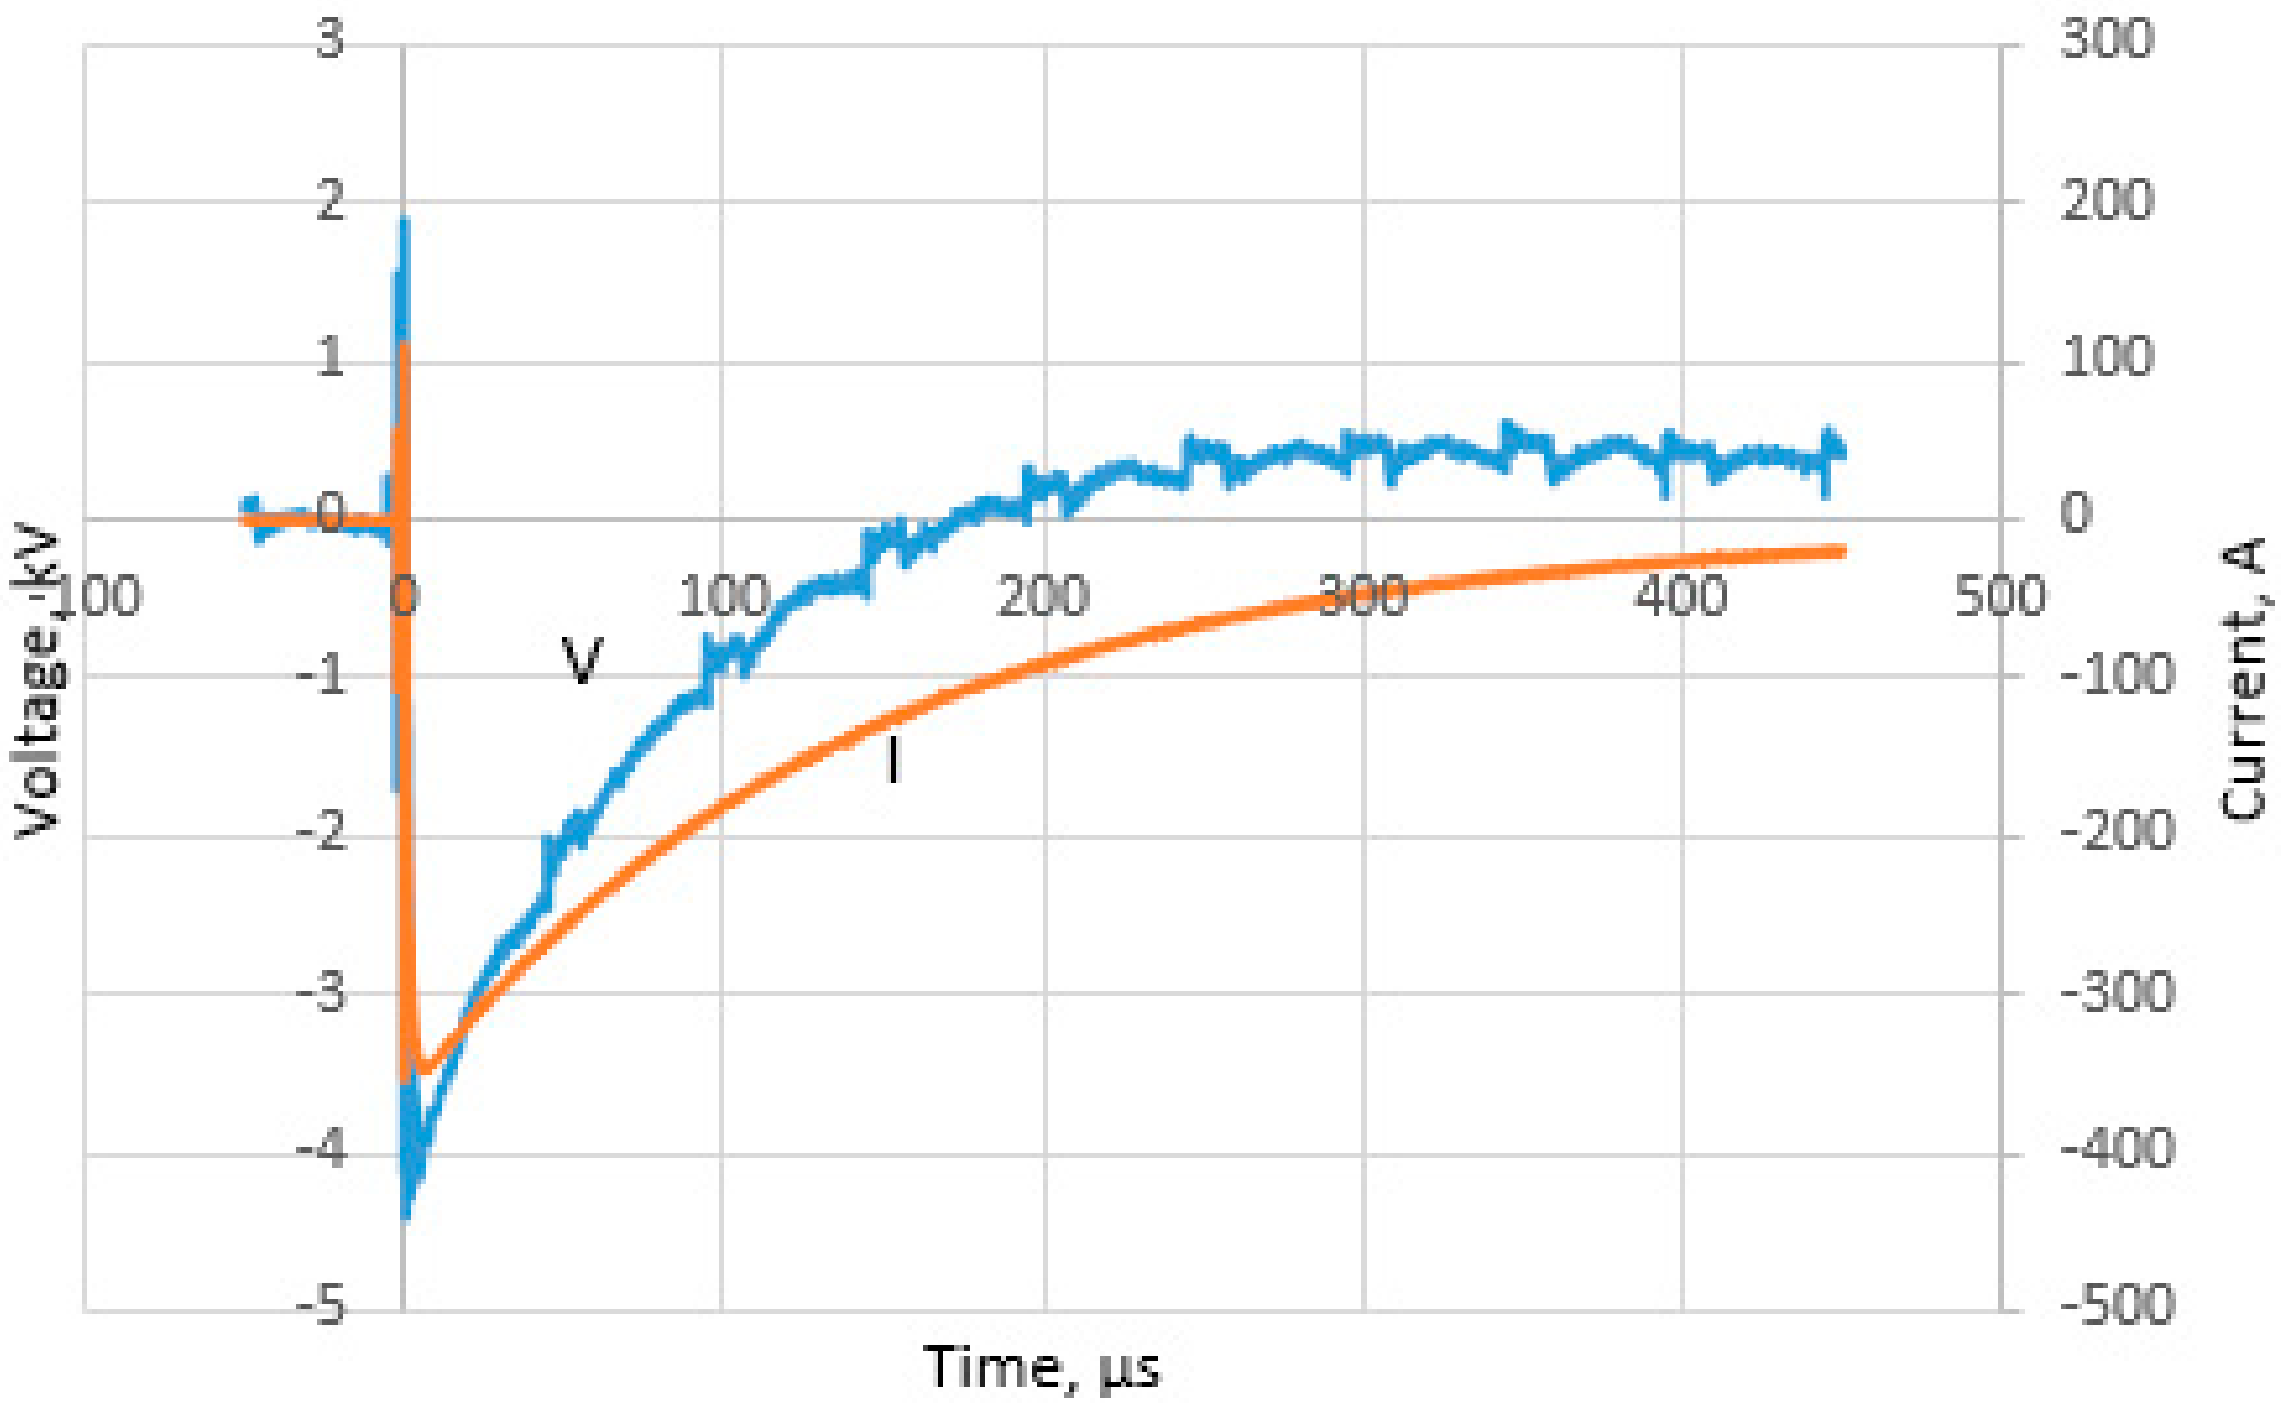
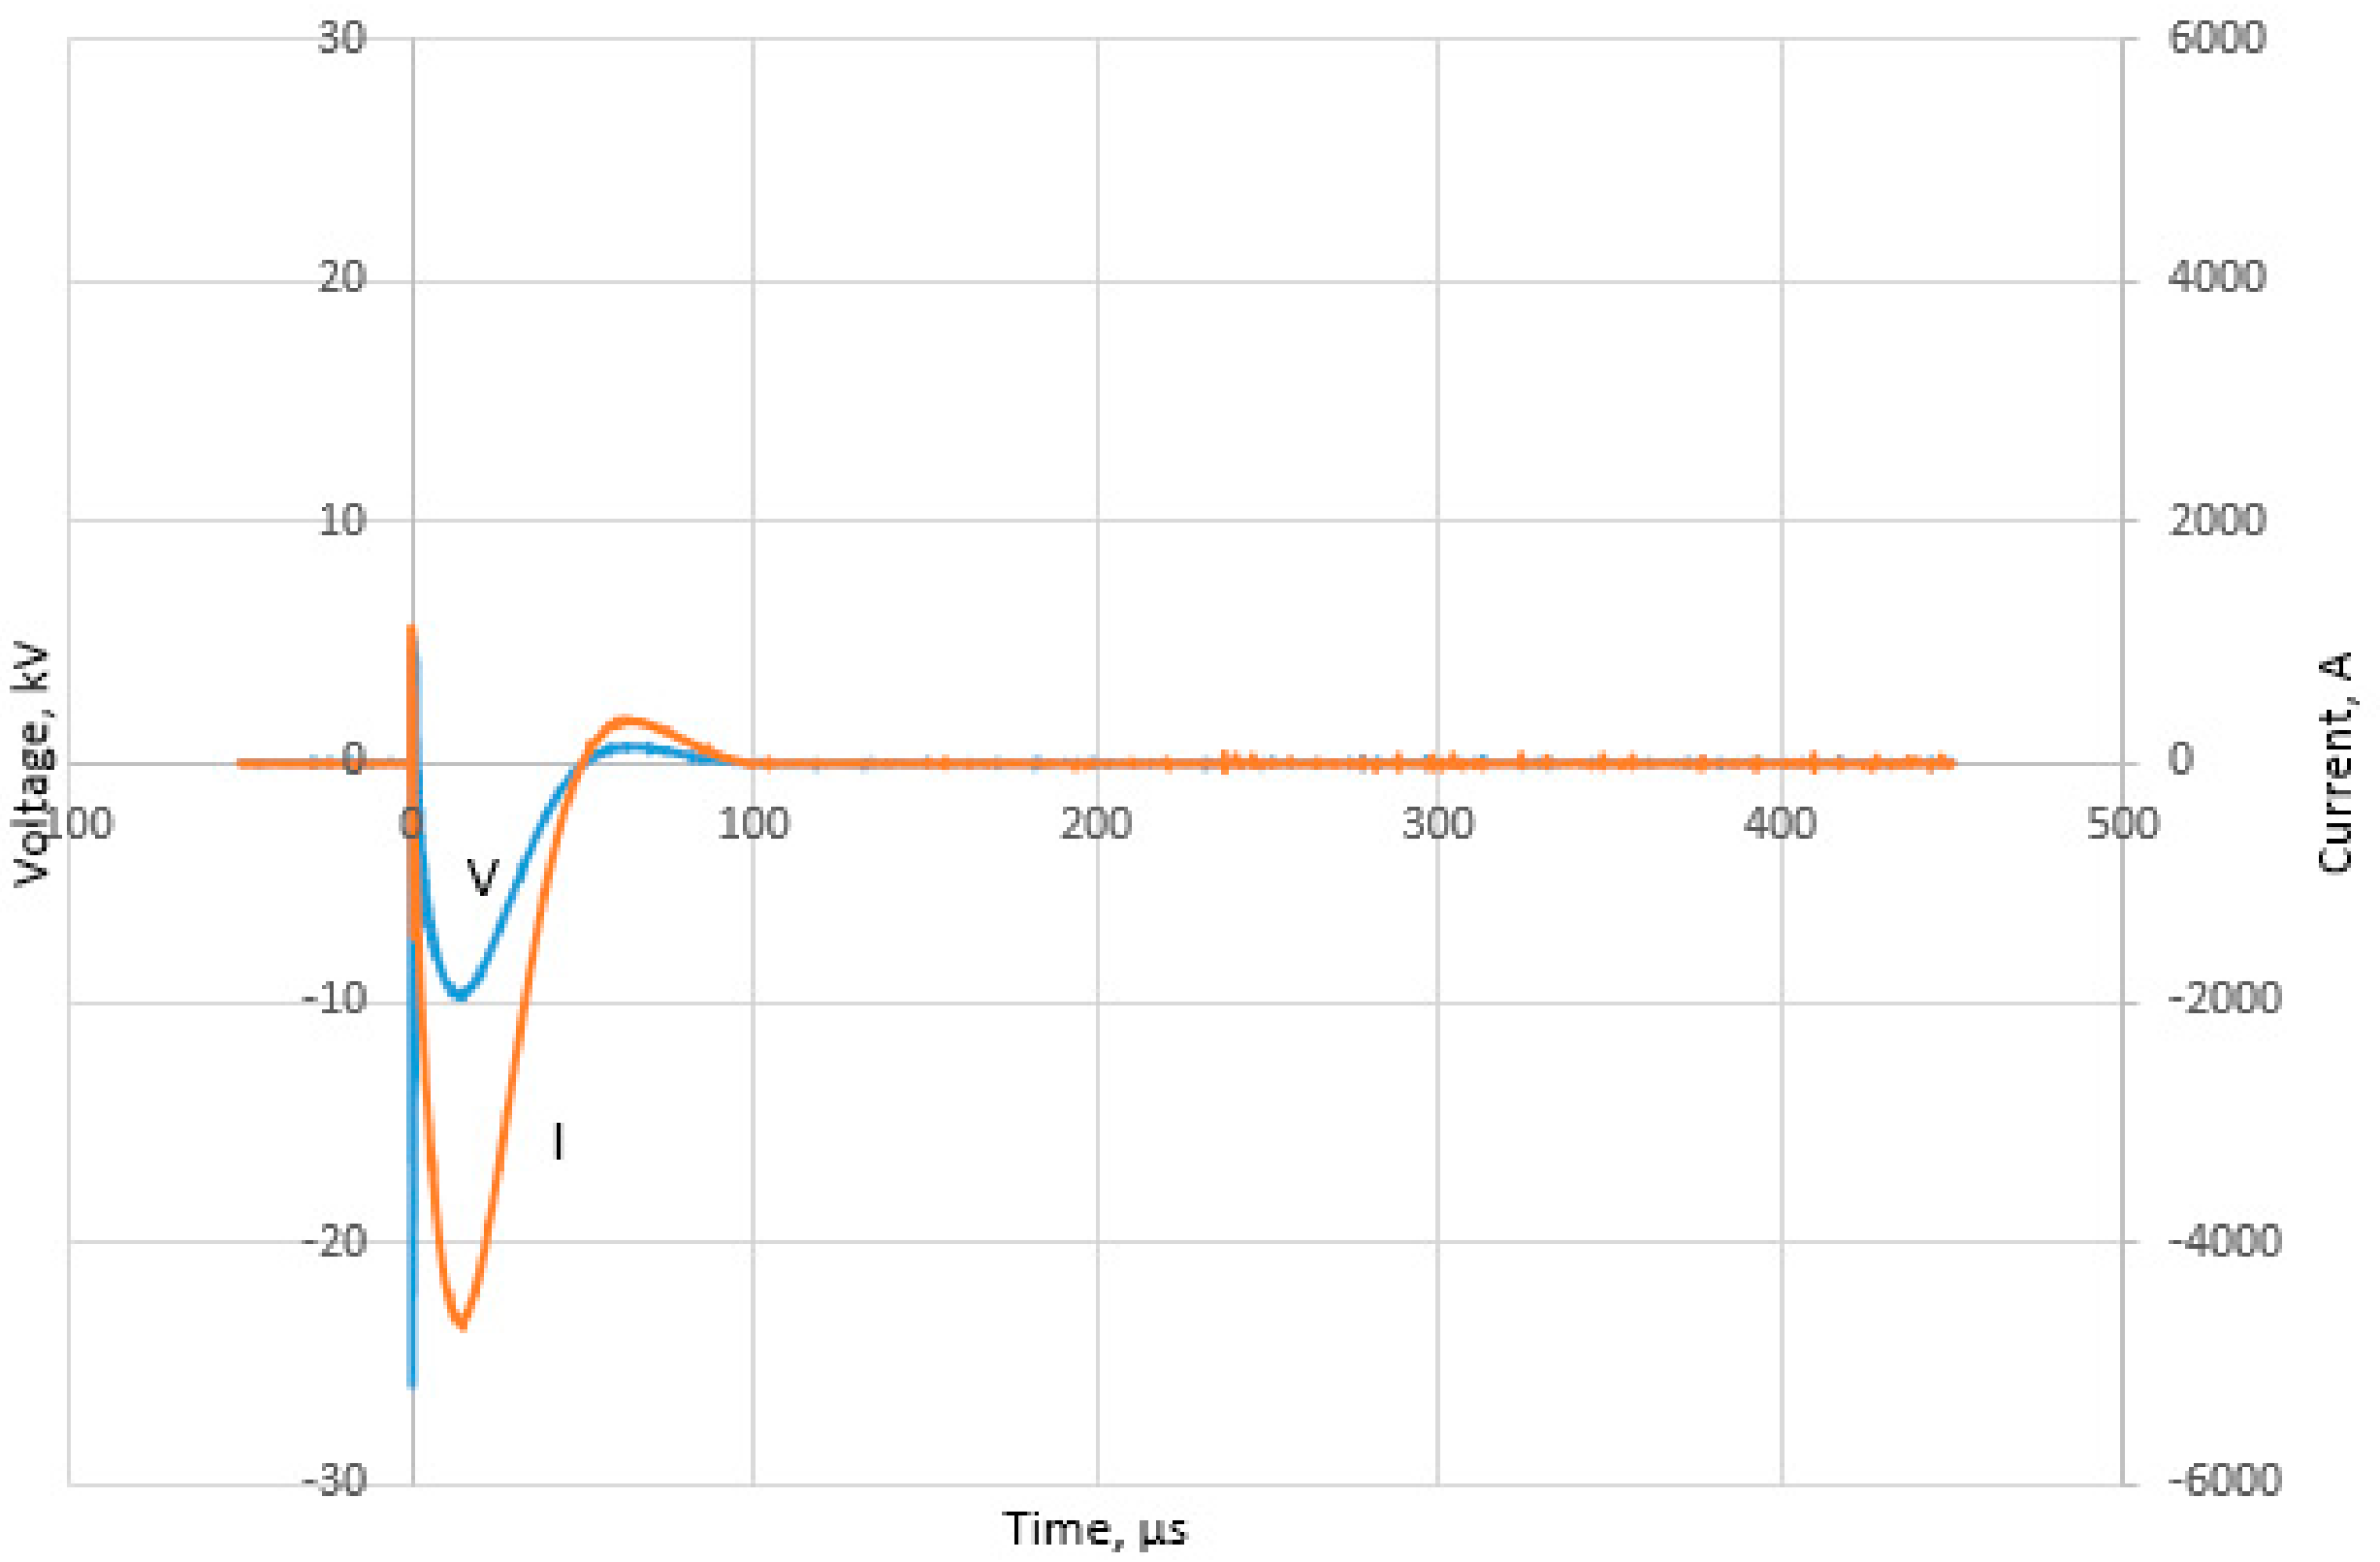
3. Test Results
3.1. Effect of Soil Resistivity
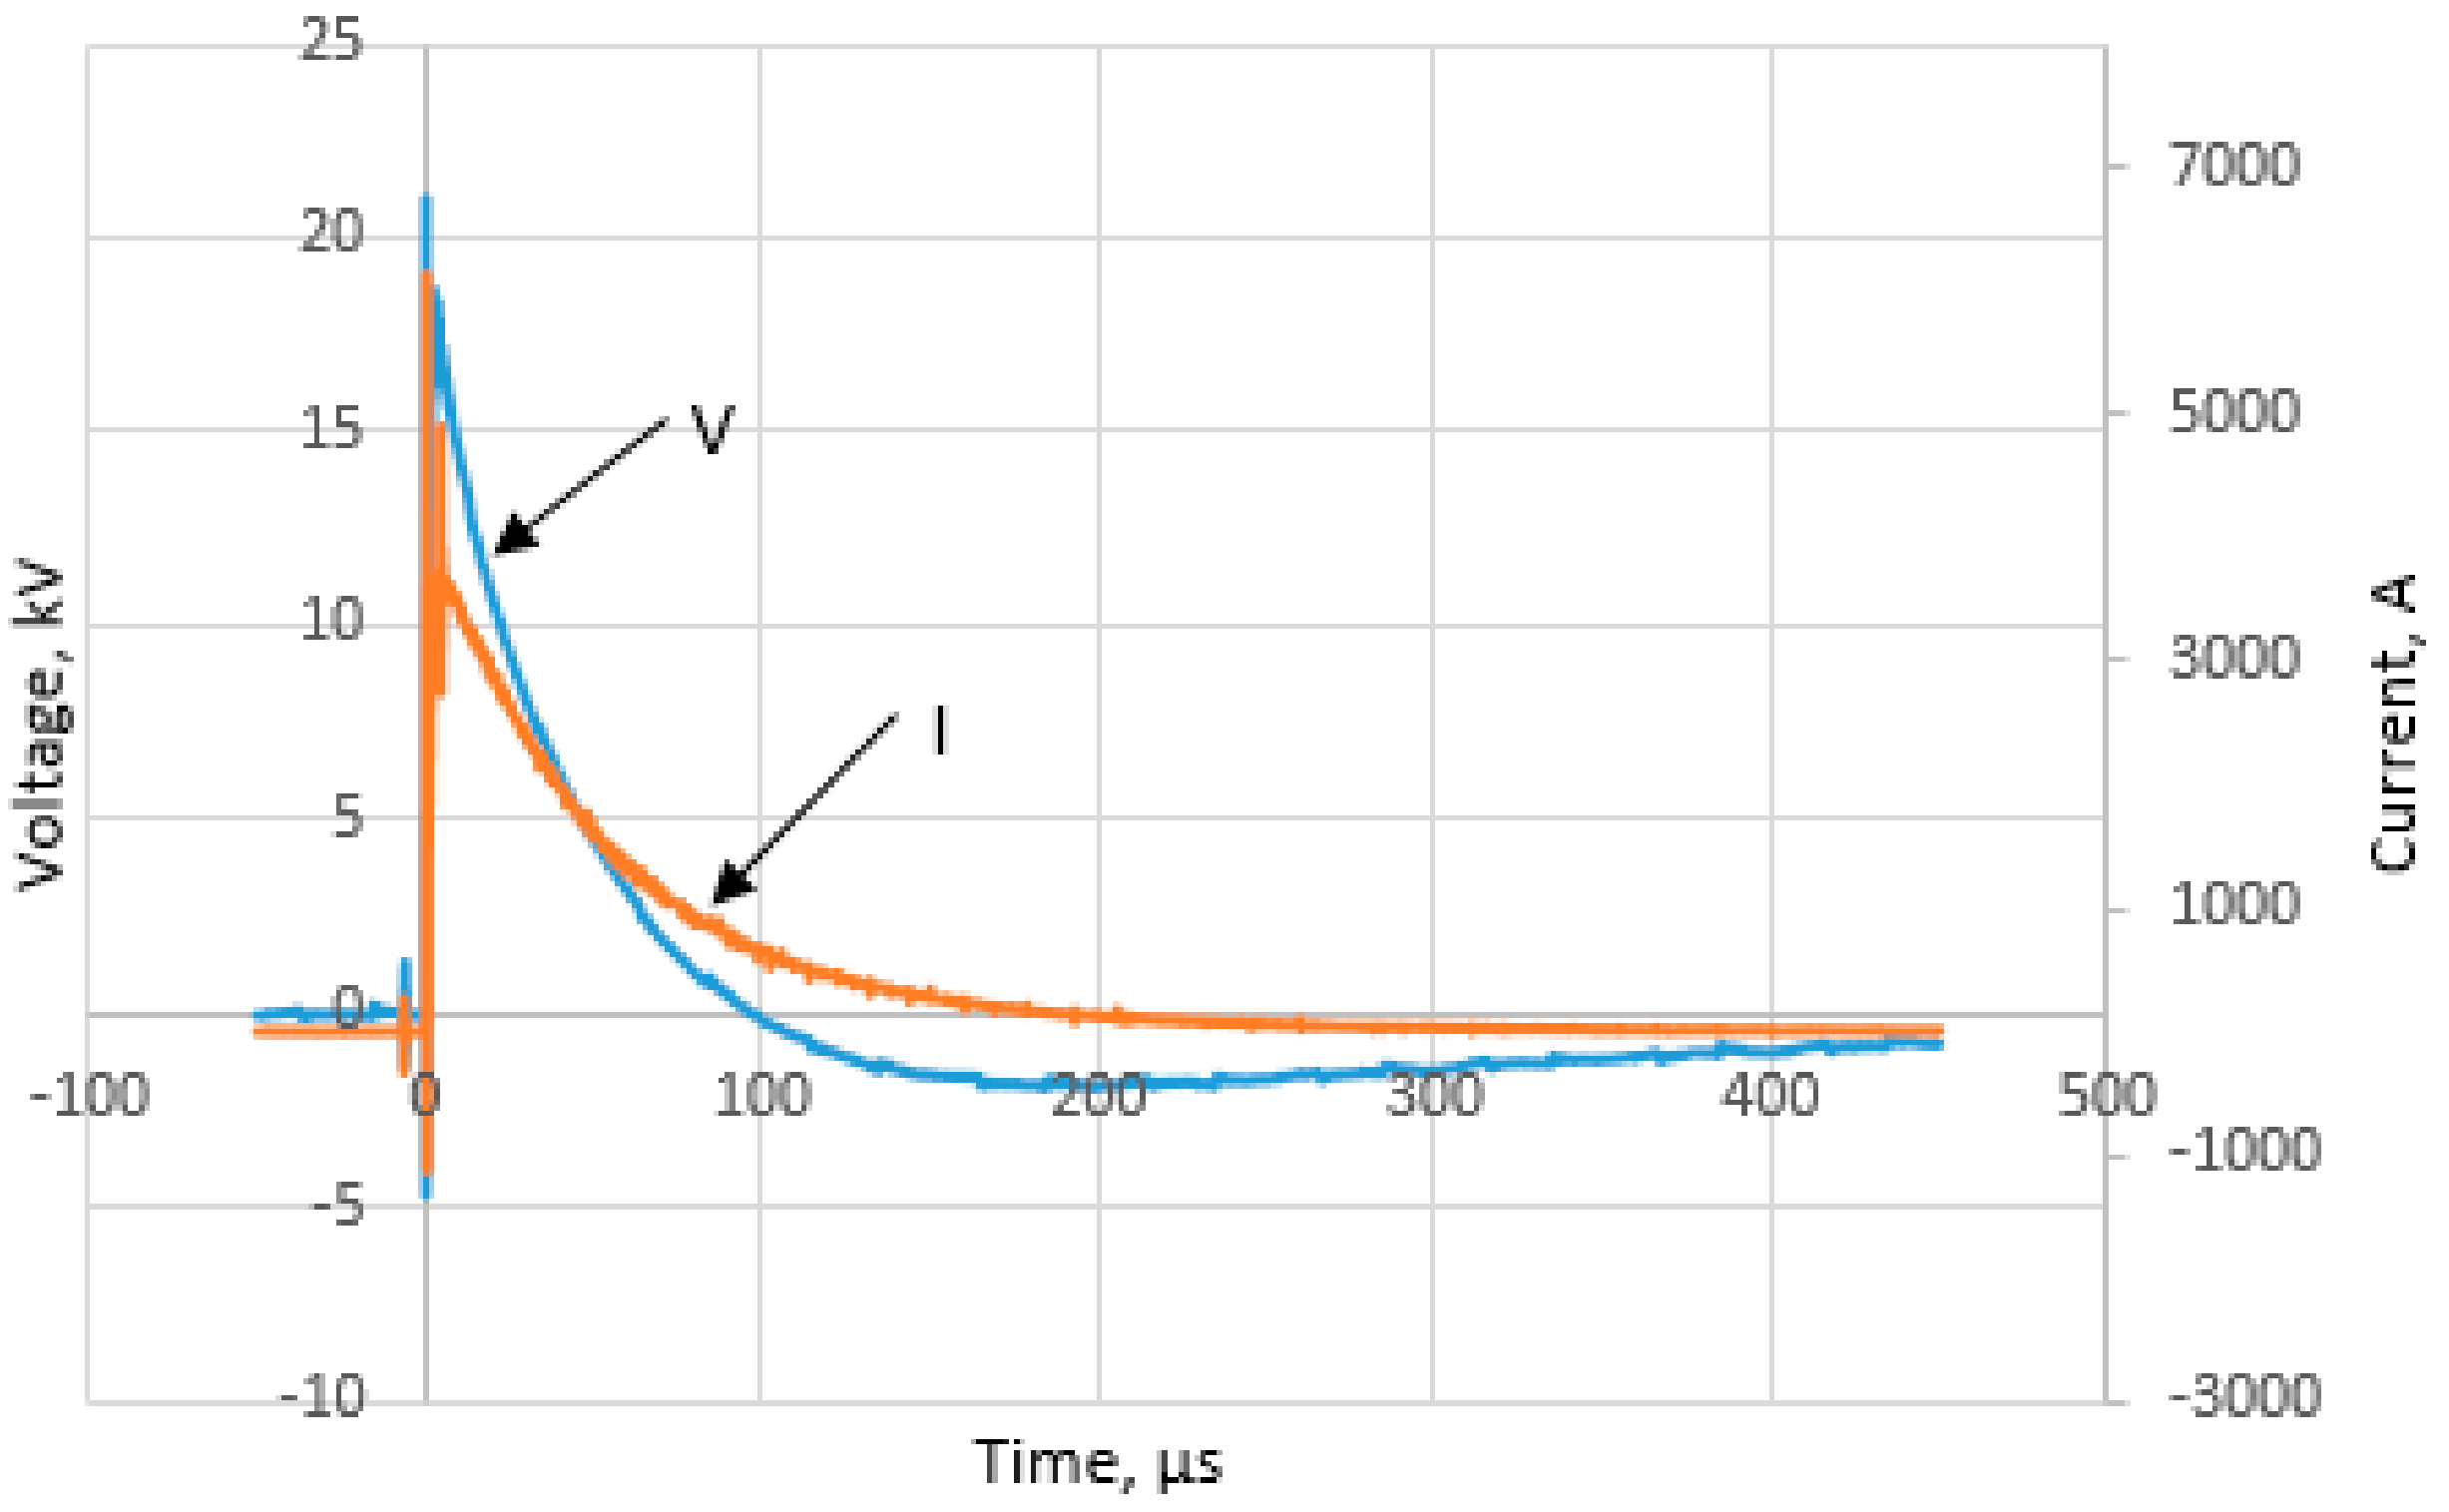
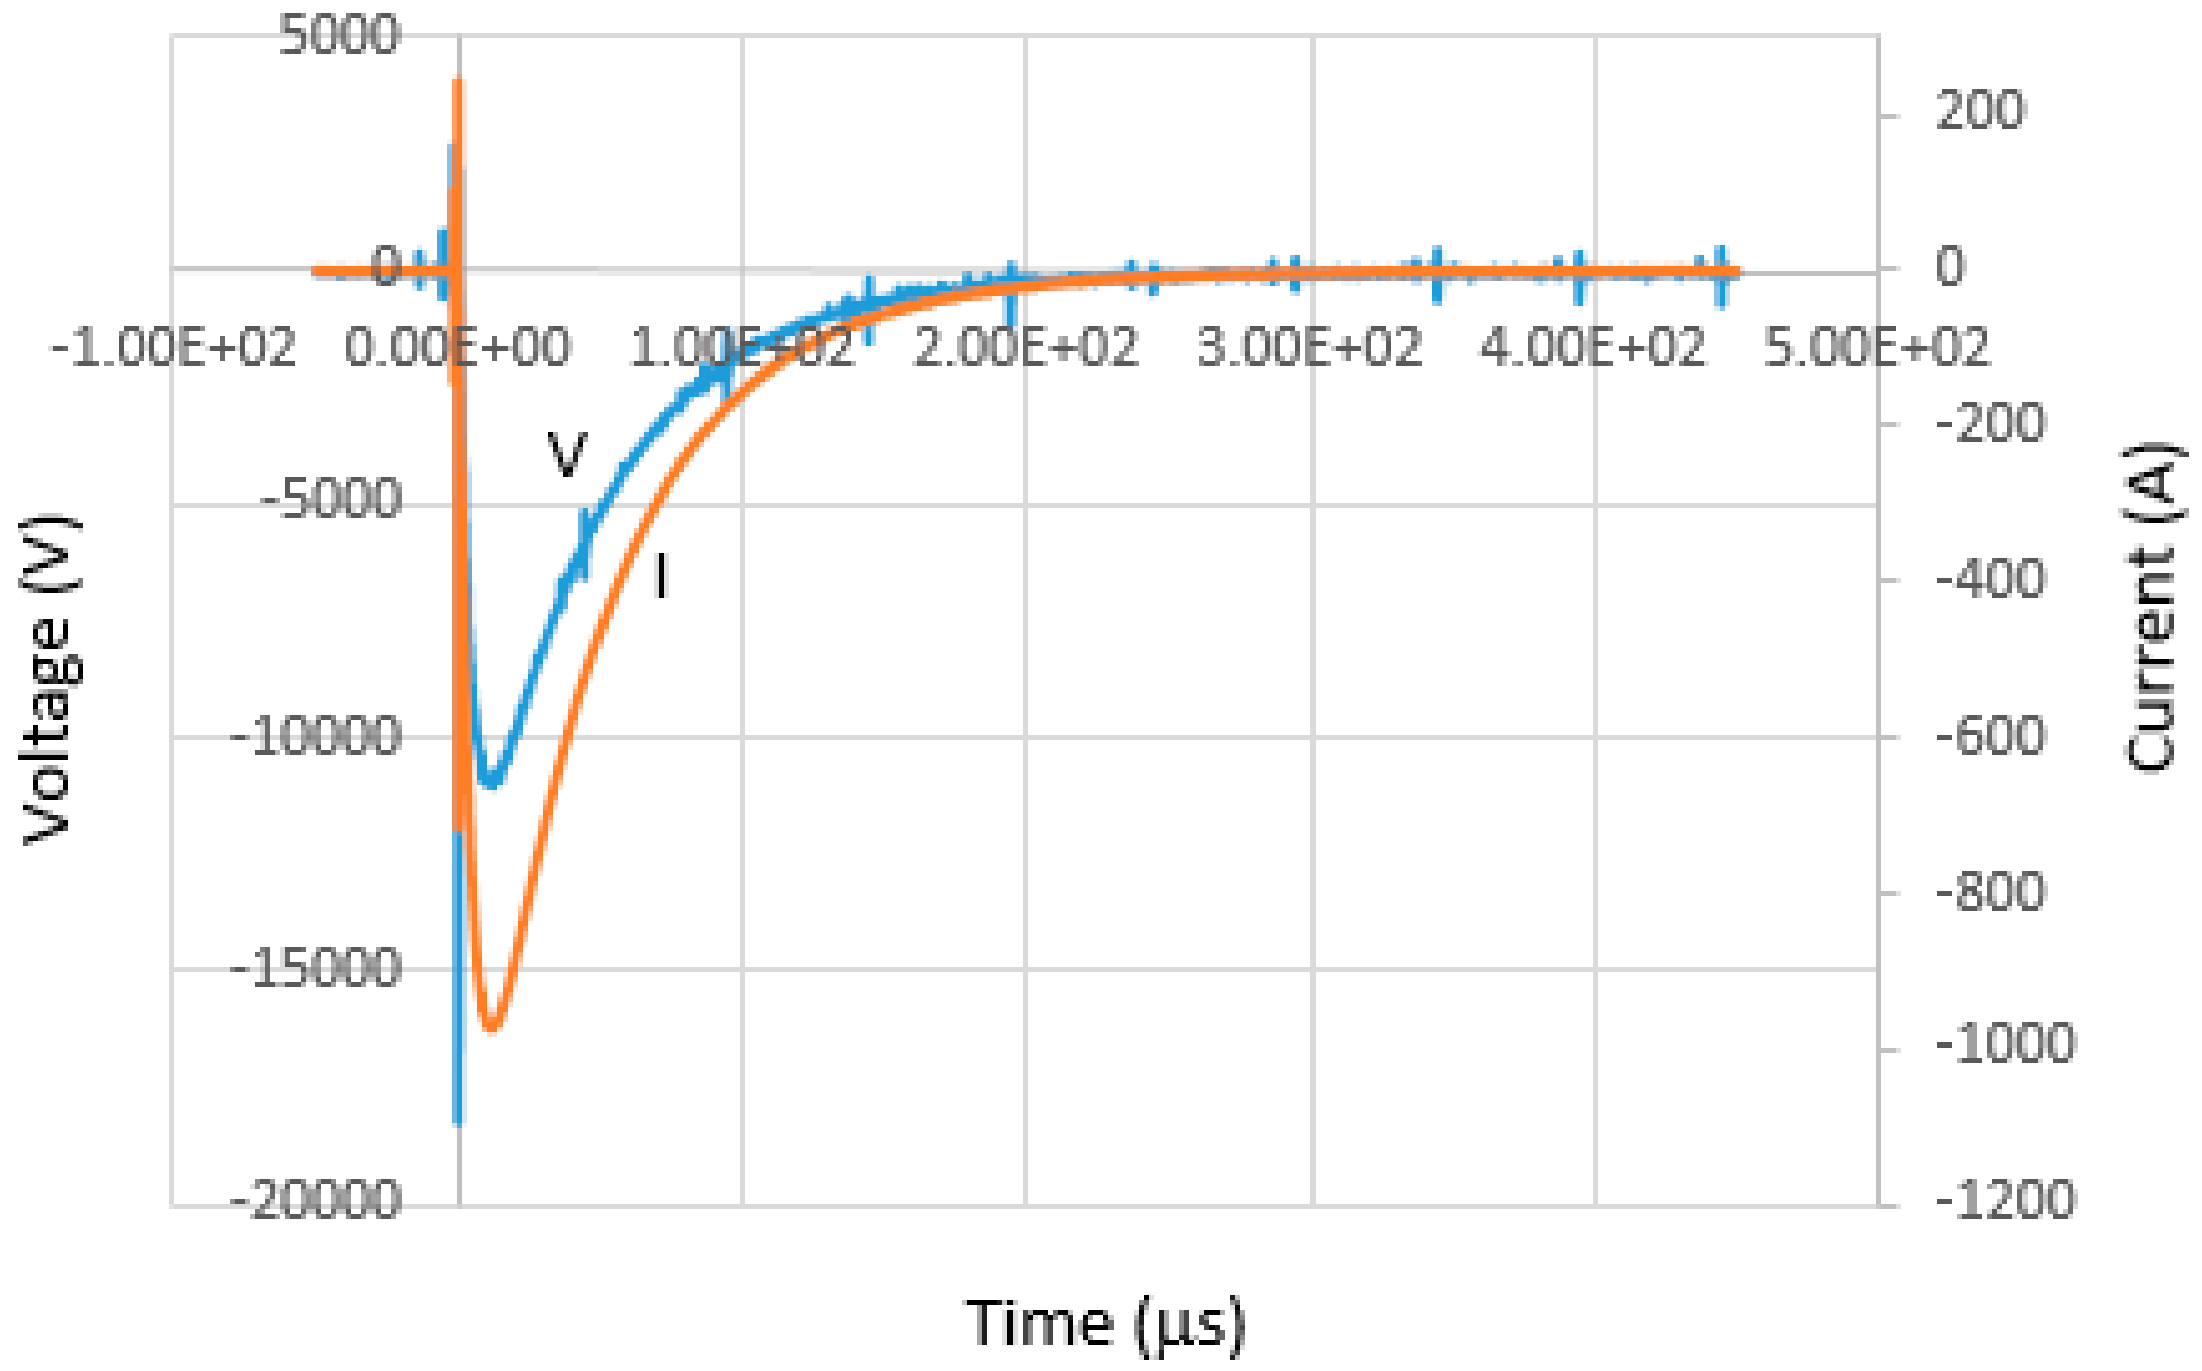
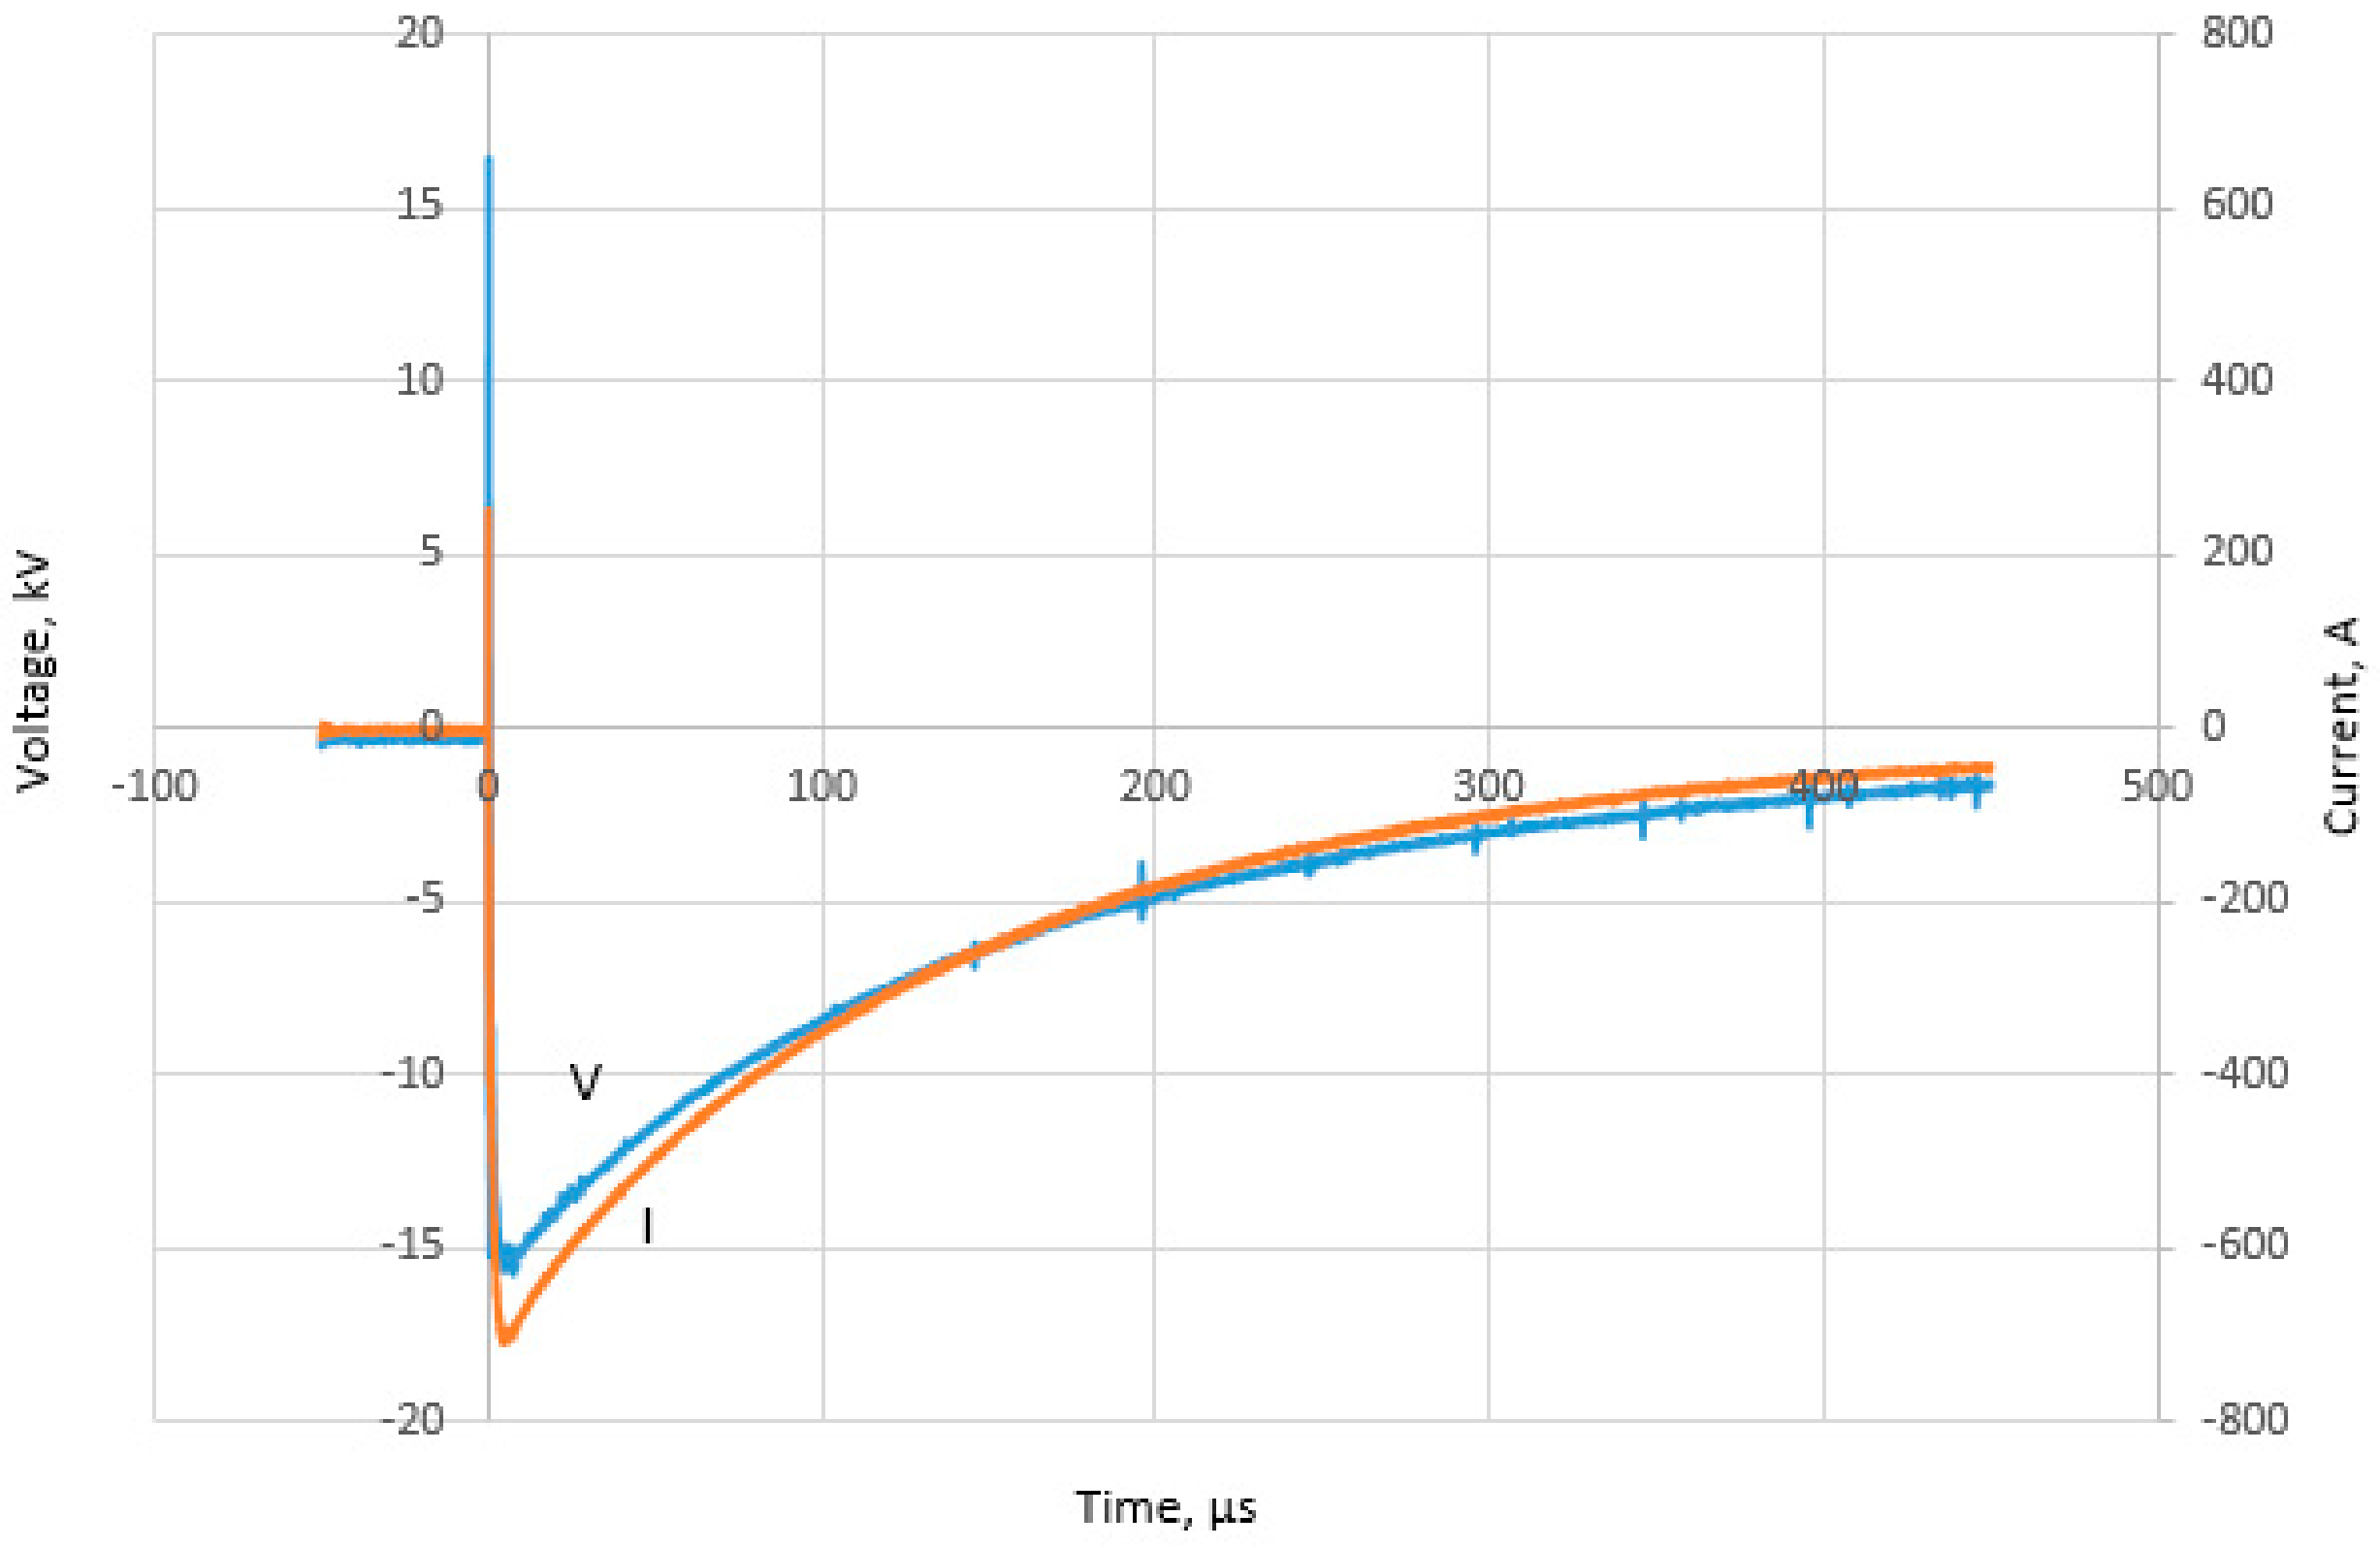
3.2. Effect of Impulse Polarity
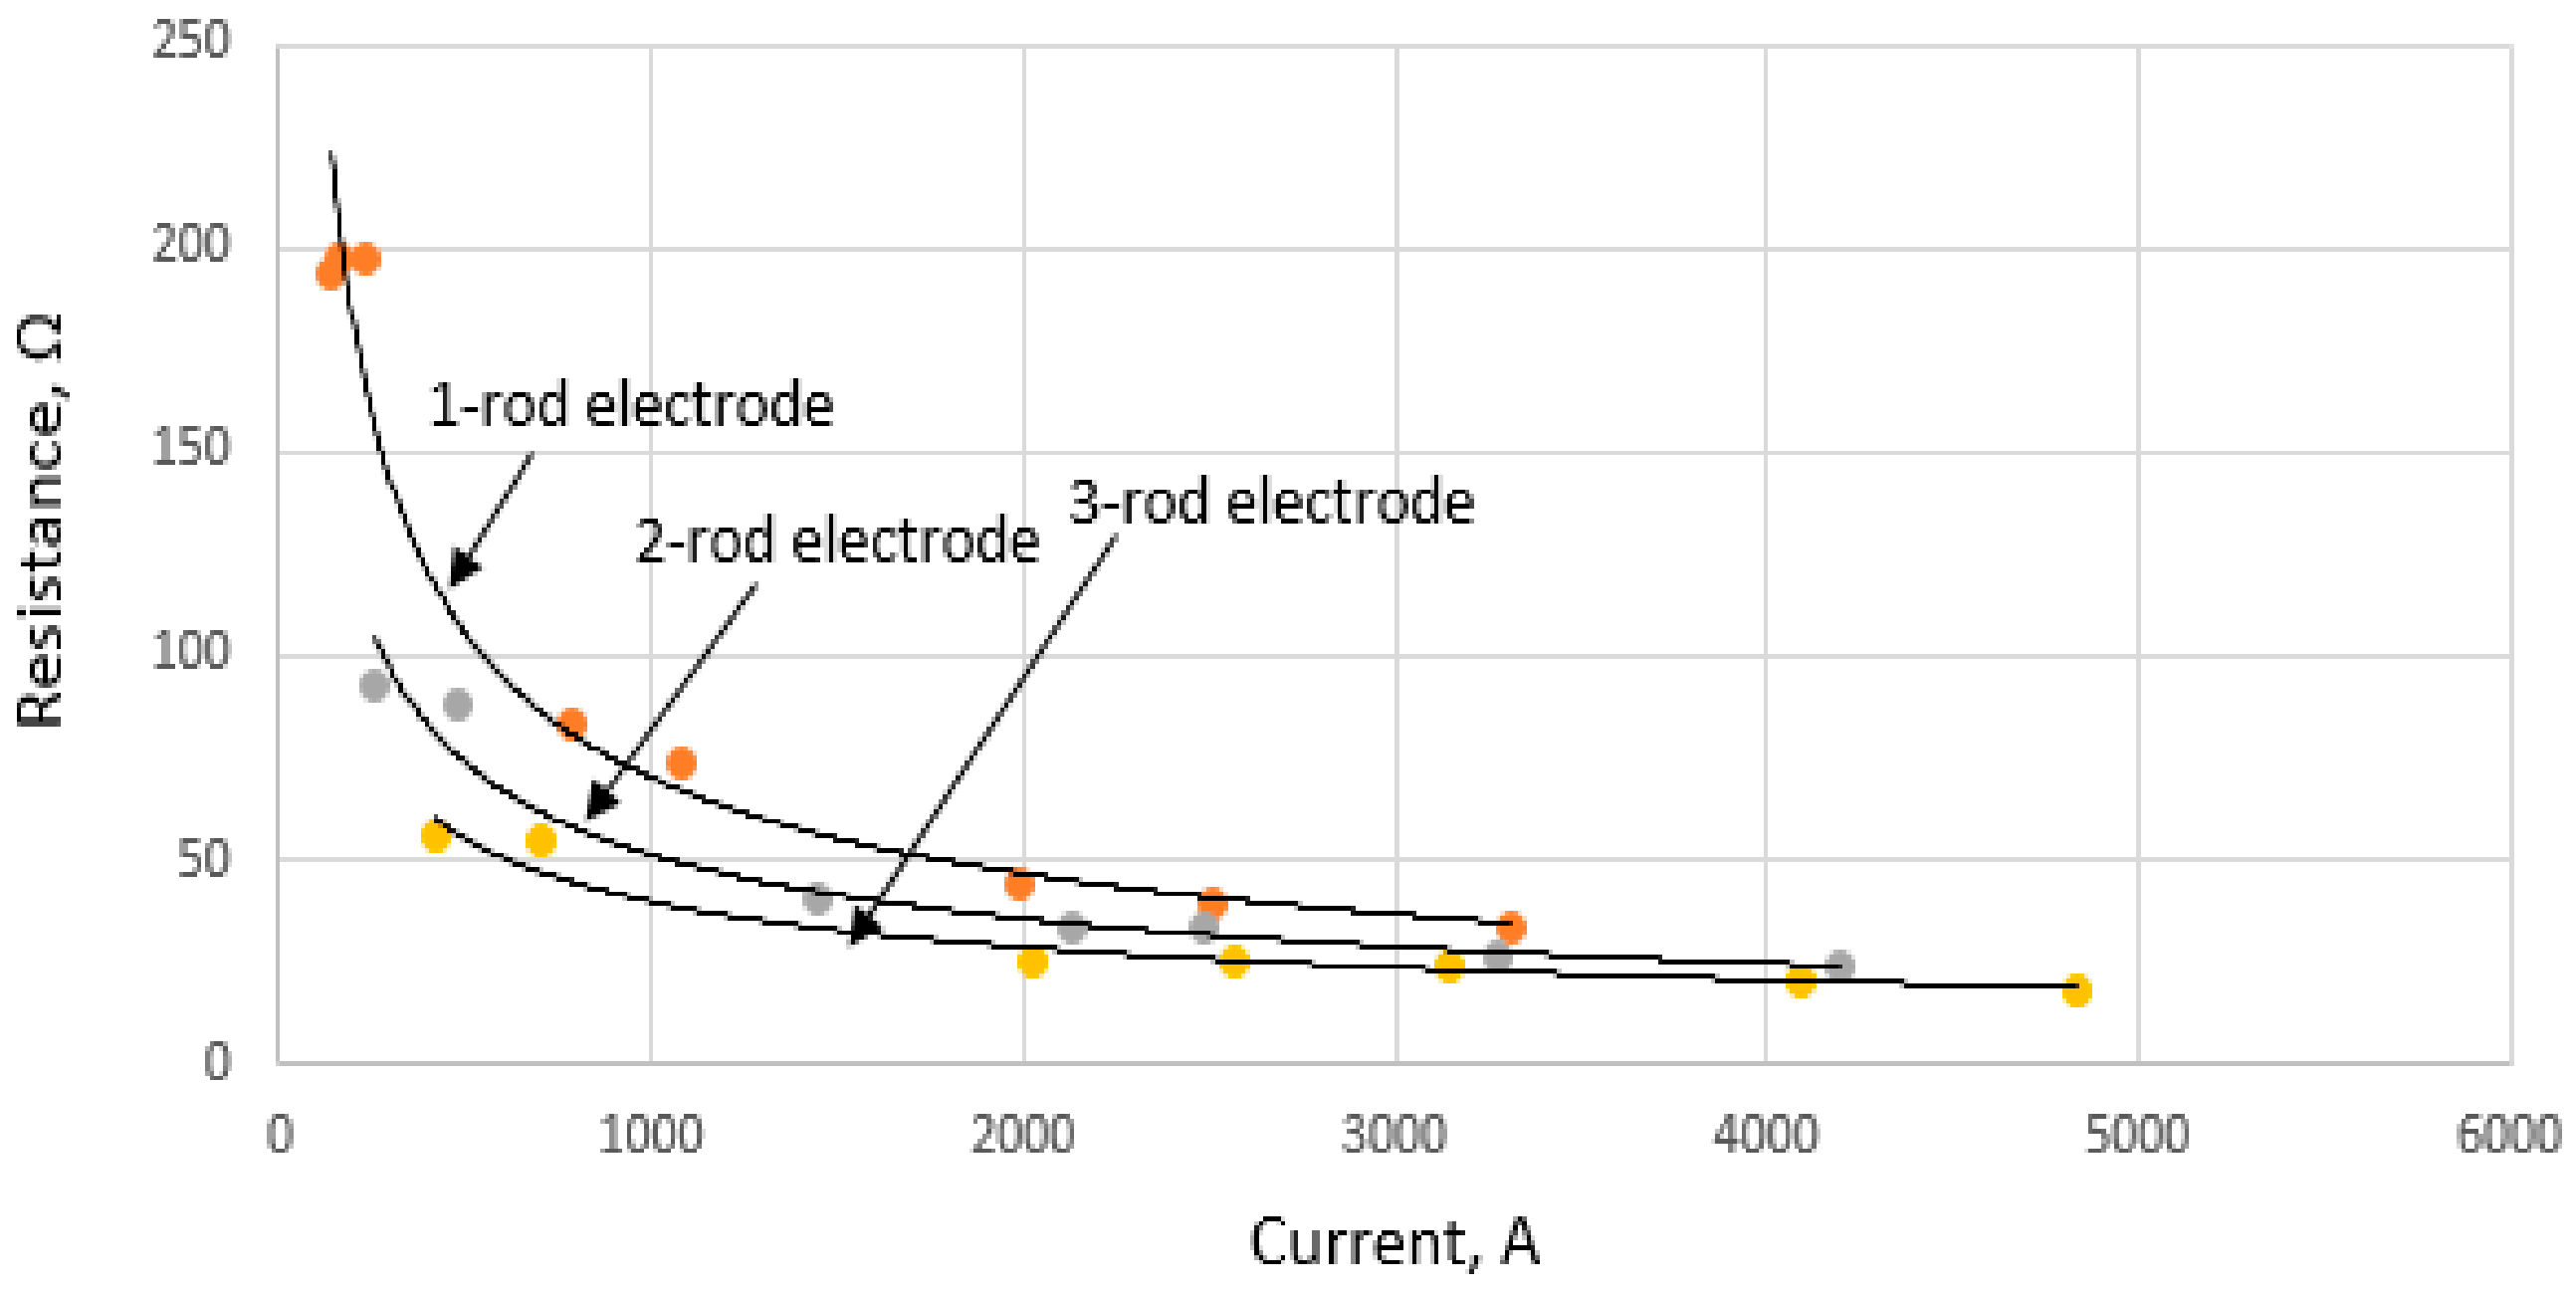
3.3. Effect of Electrode’s Configurations
4. Conclusions
Author Contributions
Funding
Conflicts of Interest
References
- Sekioka, S.; Sonoda, T.; Ametani, A. Experimental study of current dependent grounding resistance of rod electrode. IEEE Trans. Power Deliv. 2005, 20, 1569–1576. [Google Scholar] [CrossRef]
- Sekioka, S.; Hayashida, H.; Hara, T.; Ametani, A. Measurement of grounding resistance for high impulse currents. IEE Proc. Gener. Transm. Distrib. 1998, 145, 693–699. [Google Scholar] [CrossRef]
- Yunus, S.; Mohamad Nor, N.; Agbor, N.; Abdullah, S.; Ramar, K. Performance of earthing systems for different earth electrode configurations. IEEE Trans. Ind. Appl. 2015, 51, 5335–5342. [Google Scholar] [CrossRef]
- Yang, S.; Zhou, W.; Huang, J.; Yu, J. Investigation on impulse characteristic of full-scale grounding grid in substation. IEEE Trans. Electromagn. Compat. 2017, 60, 1993–2001. [Google Scholar] [CrossRef]
- Haddad, A.; Griffiths, H.; Ahmeda, M.; Harid, N. Experimental Investigation of the Impulse Characteristics of Practical Ground Electrode Systems. In Proceedings of the International Conference on High Voltage Engineering and Application, New Orleans, MS, USA, 11–14 October 2010. [Google Scholar]
- Duan, L.; Zhang, B.; He, J.; Xiao, L.; Qian, L. Experimental Study on Transient Characteristics of Grounding Grid for Substation. In Proceedings of the 33rd International Conference of Lightning Protection (ICLP), Estoril, Portugal, 25–30 September 2016. [Google Scholar]
- Etobi, A.; Mohamad Nor, N.; Abdullah, S.; Othman, M. Characterizations of a Single Rod Electrode under High Impulse Currents with Different Polarities. In Proceedings of the 1st IEEE International Conference on Electrical Materials and Power Equipment (ICEMPE), Xi’an, China, 14–17 May 2017. [Google Scholar]
- Abdullah, S.; Mohamad Nor, N.; Ramar, K. Field measurements on earthing systems of different soil resistivity values under high impulse conditions. Electr. Eng. 2017, 99, 1005–1011. [Google Scholar] [CrossRef]
- Nor, N.M.; Haddad, A.; Griffiths, H. Characterization of ionization phenomena in soils under fast impulses. IEEE Trans. Power Deliv. 2006, 21, 353–361. [Google Scholar] [CrossRef]
- Mohamad Nor, N.; Haddad, A.; Griffiths, H. Factors Affecting Soil Characteristics under Fast Transients. In Proceedings of the International Conference of Power Systems Transients (IPST), New Orleans, MS, USA, 2003; Available online: http://www.ipstconf.org/papers/Proc_IPST2003/03IPST07-05.pdf (accessed on 11 July 2018).
- Cabrera, M.; Lundquist, S.; Cooray, V. On the physical properties of discharges in sand under lightning impulses. J. Electrost. 1993, 30, 17–28. [Google Scholar]
- ANSI/IEEE Std 81-2012. IEEE Guide for Measuring Earth Resistivity, Ground Impedance, and Earth Surface Potentials of a Ground System. Available online: https://ieeexplore.ieee.org/document/6392181 (accessed on 31 July 2018).
- ANSI/IEEE Std 80-2000. IEEE Guide for Safety in AC Substation Grounding. Available online: http://www.dee.ufrj.br/~acsl/grad/equipamentos/IEEE-std80.pdf (accessed on 30 July 2018).
- Heimbach, M.; Grcev, L.D. Grounding systems analysis in transient programs applying electromagnetic field approach. IEEE Trans. Power Deliv. 1997, 12, 186–193. [Google Scholar] [CrossRef]
- Grcev, L. Lightning surge efficiency of grounding grid. IEEE Trans. Power Deliv. 2011, 26, 1692–1699. [Google Scholar] [CrossRef]
- Kuffel, E.; Zaengl, W.S.; Kuffel, J. HV Engineering Book; Elsevier: Amsterdam, The Netherlands, 2000. [Google Scholar]


| Location | ρ1 (Ω·m−1) | h1 (m) | ρ2 (Ω·m−1) | h2 (m) |
|---|---|---|---|---|
| Site 1 | 119.5 | 7.18 | 391.05 | ∞ |
| Site 2 | 53.89 | 5.19 | 426.89 | ∞ |
| Site 3 | 210.96 | 1.73 | 507.62 | ∞ |
| Site 4 | 52.74 | 1.02 | 0.65 | ∞ |
| Electrode under Tests | Remote Earth | ||||
|---|---|---|---|---|---|
| Earth Electrode | Measured (Ω) | CDEGS (Ω) | Earth Electrode | Measured (Ω) | CDEGS (Ω) |
| Sample A | 61.5 | 38.386 | REA | 38.2 | 23.237 |
| Sample B | 12.86 | 14.463 | REB | 13.67 | 9.8906 |
| Sample C | 62.6 | 56.708 | REC | 51.8 | 38.154 |
| Sample D | 4.66 | 6.1194 | RED | 4.13 | 3.1764 |
| 1-rod | 466 | 132.18 | 20 m × 20 m | 8.45 | 3.5 |
| 2-rod | 185 | 70.507 | 20 m × 20 m | 8.45 | 3.5 |
| 3-rod | 118 | 49.119 | 20 m × 20 m | 8.45 | 3.5 |
| Sample | Positive | Negative | ||||
|---|---|---|---|---|---|---|
| Vch (kV) | Vapp (kV) | Ip (A) | Vch (kV) | Vapp (kV) | Ip (A) | |
| A | 150 | 16 | 2934 | 100 | 12 | 2800 |
| B | 50 | 12 | 3200 | 50 | 17 | 3200 |
| C | No Oscillations | No Oscillations | ||||
| D | 40 | 12.5 | 6000 | 37 | 11 | 5852 |
© 2018 by the authors. Licensee MDPI, Basel, Switzerland. This article is an open access article distributed under the terms and conditions of the Creative Commons Attribution (CC BY) license (http://creativecommons.org/licenses/by/4.0/).
Share and Cite
Reffin, M.S.; Nor, N.M.; Ahmad, N.N.; Abdullah, S. Performance of Practical Grounding Systems under High Impulse Conditions. Energies 2018, 11, 3187. https://doi.org/10.3390/en11113187
Reffin MS, Nor NM, Ahmad NN, Abdullah S. Performance of Practical Grounding Systems under High Impulse Conditions. Energies. 2018; 11(11):3187. https://doi.org/10.3390/en11113187
Chicago/Turabian StyleReffin, Muhd Shahirad, Normiza Mohamad Nor, Nurul Nadia Ahmad, and Syarifah Abdullah. 2018. "Performance of Practical Grounding Systems under High Impulse Conditions" Energies 11, no. 11: 3187. https://doi.org/10.3390/en11113187
APA StyleReffin, M. S., Nor, N. M., Ahmad, N. N., & Abdullah, S. (2018). Performance of Practical Grounding Systems under High Impulse Conditions. Energies, 11(11), 3187. https://doi.org/10.3390/en11113187