Abstract
A new energy transition policy in Korea has increased the importance of liquefied natural gas (LNG) in the energy mix. The Asia-Pacific LNG market is inflexible because long-term contracts are dominant. This market characteristic means that the development of policies that ensure a stable supply of LNG is essential. We developed a new model for the optimal LNG import portfolio. The model consists of a two-step portfolio model combining the mean-variance (MV) portfolio and the linear programming (LP) model. In the first step, the MV model was applied to derive the optimal ratio between the long-term and spot contracts. Next, the LP model was used to determine the optimal LNG portfolio. We also applied a fuzzy analytic hierarchy process (AHP) to determine the weights of the cost factors. The application of the fuzzy AHP enabled this research to reflect the tangible and intangible costs more effectively. The optimal LNG portfolio showed that the optimal ratios for the long-term and spot contracts are 89.72% and 10.28% respectively, and the supply ratios in the Middle East and Southeast Asia decreased, while those in the Far East and Oceania significantly increased. The proposed model is able to build an effective LNG import strategy because it reflects the characteristics of LNG markets better than previous models.
1. Introduction
The Asia-Pacific gas market is growing due to the massive investment in liquefied natural gas (LNG) supplies and increasing demand. According to the International Energy Agency (IEA) [1], the Asia-Pacific demand for natural gas will increase from 732 billion cubic meters (bcm) in 2016 to over 1472 bcm in 2040. The predicted average annual demand growth rate of 3.0% between 2016 and 2040 is much faster than those projected for North America or Europe—0.7% per year and 0.3% per year, respectively, over this period [1]. Despite this increase in demand, structural oversupply of the gas market has occurred due to the construction of large-scale liquefaction facilities in the US, Australia, and Russia, and policies to expand Qatar’s exports. Hence, the growth of the market has continued based on the abundant gas supply capability and because the current gas market is a buyers’ market [2,3].
However, the presence of a buyers’ market does not mean that risks to the security of supply have disappeared. This risk is demonstrated, for example, by the past disruption in supply caused by the Middle East war and Russia, and by the recent diplomatic confrontation between Qatar and its neighbors [1,4,5]. These events pose a serious threat to the energy security of certain LNG importing countries. The characteristics of the LNG market also increase the risks. Unlike the oil market, long-term contracts have long dominated the Asia-Pacific market for LNG [6]. In the case of LNG, a long-term project period is required because the exporting country must build a large-scale infrastructure for transportation [7]. Therefore, the LNG market is inflexible in the sense that supply is unable to respond elastically to short-term increases in demand [8]. These market characteristics indicate that policy-making and research concerning stable importation is necessary.
Korea was the world’s third-largest LNG-consuming country in 2017 [9], but its dependence on LNG imports was as high as 99.6% [10]. Due to the lack of domestic natural gas resources, the stability and security of LNG is an important policy issue. Korea is unable to trade with neighboring countries through pipelines due to geopolitical conditions caused by the ceasefire with North Korea. This means that Korea is an isolated market that depends entirely on LNG transport [11]. In addition, the storage cost of natural gas is high, and Korea’s geographical features make the underground storage of natural gas difficult [12]. The Renewable Energy 3020 Implementation Plan [13], an energy transition policy established in 2017, further boosted the importance of stable LNG imports. The policy states that the electricity supply through renewable generation will be increased to 20% by 2030 [13]. An increase in renewable energy will increase the demand for LNG because the intermittency of renewable energy requires LNG-fired plants to serve as backup generators to stabilize the electricity supply [14,15]. With these conditions, any problems in a natural gas exporting country such as a natural disaster, or marine transportation accident can severely threaten energy security. Since the 2000s, the threat of terrorism on energy infrastructure and transportation has increased, and natural disasters such as hurricanes have an adverse ripple effect. Consequently, the understanding of energy security has extended beyond security and diversification of energy sources to include all energy supply infrastructures related to transportation and utilization [16].
Considering the Korean situation and value chain of the natural gas market, we developed an optimal LNG portfolio model that considers tangible and intangible costs to improve the importation stability of LNG from the perspective of Yergin’s [16] energy security model. The model quantifies not only tangible factors that depend on the supply capability of each exporting country, such as the natural gas price, reserve capacity, and liquefaction facilities, but also intangible factors, such as the risk of natural disasters, transportation, and political influences.
Previous studies [17,18,19,20,21] based on the linear programming (LP) portfolio model did not consider spot contracts when determining optimal portfolio strategies and only considered long-term contracts. Since the demand for natural gas markedly differs between winter and summer, spot trading is used in winter to cope with natural gas shortages. Therefore, it is necessary to consider spot contracts within the model. We solved this problem by combining the Markowitz’s mean-variance (MV) portfolio model [22] with the LP portfolio model. Also, we solved the problem of weight determination using the fuzzy analytic hierarchy process (AHP) methodology. The weights have a significant impact on the optimal portfolio strategy and therefore, it is essential to derive the weights quantitatively using a scientific methodology. The study of applying fuzzy AHP to determine weights has been applied in various fields, and its validity has been verified [23,24,25]. AHP plays a critical role in many decision-making problems [26]. Thus, this study more accurately reflects the tangible and intangible factors by using weights based on the results calculated from the fuzzy AHP.
Finally, we evaluated the optimal LNG portfolio derived from the models using Lefèvre’s [27] energy security index. The energy security index showed that the optimal portfolio improves the energy security quantitatively compared to the actual LNG portfolio.
The remaining sections of the paper are organized as follows. The second section proposes a two-step portfolio framework. The third section presents the data to be calculated. The fourth section presents the results and discussion based on the optimal portfolio strategy. Finally, the fifth section concludes the paper and presents the policy implications.
2. Materials and Methods
2.1. Research Scheme
Figure 1 shows the analytical framework of this study. This study had three phases.
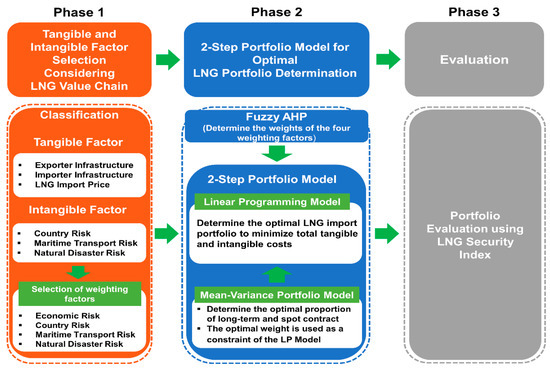
Figure 1.
The analytical framework of this study.
- The selection of tangible and intangible factors considering the LNG value chain: The LNG market has a value chain represented by liquefaction–transportation–storage and re-gasification [28]. To take into account the value chain and specificity of the LNG market, intangible factors, such as the national risk and transport risk, as well as tangible factors, such as the supply capacity and introductory price, were set as components and variables in the model. The risk factors to LNG importation may be approached from the following four perspectives: the risk of transportation, the risk of natural disasters, the economic risk, and the national risk. These factors have also been considered in previous studies [17,18,19,20,21]. These four weight factors were used as in the two-step portfolio model to determine the volume of supply from each country.
- Two-step portfolio model and fuzzy AHP for optimal LNG portfolio determination: The model in this study consisted of a two-step portfolio model combining the MV portfolio model and the LP model. In the first step, we applied the MV portfolio to determine the optimal purchase ratio between the long-term and spot contracts. The optimal purchase ratio was calculated considering the prices of long-term and spot contracts as well as the correlation between them. The optimal ratio was calculated using the cost–risk efficient frontier on the basis of the price levels of the term contract and spot trading as well as the correlation between them. The optimal purchase ratio was used as the constraint equation in the LP model. In the second step, we applied the LP portfolio model based on Biresselioglu’s [17] model to determine the optimal LNG portfolio. The optimal LNG portfolio that minimized the total tangible and intangible costs was determined. Fuzzy AHP was applied to calculate the weights.
- Assessment of optimal introduction portfolio using the energy security index: Finally, we evaluated the optimal portfolio derived from the model. The evaluation was based on the Energy Security Market Concentration (ESMC) model proposed by Lefèvre [27]. This assessment showed that the optimal portfolio derived from the model compared to the actual portfolio used in Korea was quantitatively improved from a energy security perspective.
2.2. Fuzzy AHP
The AHP can derive weights for each criterion based on the decision maker’s pairwise comparison. Qualitative factors can also be quantified through AHP. However, the original AHP analysis proposed by Saaty [29] is not performed considering the fuzziness of the decision makers. Fuzzy AHP is a synthetic extension of original AHP methods when the fuzziness of the decision makers are considered [30,31]. Much research on the fuzzy AHP, which is an extension of Saaty’s theory, has provided evidence that the fuzzy AHP provides more adequate descriptions of decision-making processes than traditional AHP methods [32,33,34,35].
Among the various AHP methods involving fuzziness [36,37,38,39], Chang’s calculation method [34] is the most preferred one [40]. Using triangular fuzzy numbers for a pairwise comparison scale, Chang introduced the extent analysis method for synthetic extent values of pairwise comparisons. In this study, we followed the method proposed by Chang’s approach. Detailed calculations are presented in Chang [34].
2.3. Mean-Variance Portfolio Model
Under uncertain future conditions, the MV portfolio analysis is used to reduce risk without reducing the expected return by diversifying the investment assets and using the correlation between them [41]. Also, it enables the creation of an optimal ratio for any given level of expected cost. This MV approach is the most recognized approach to optimal portfolio selection [42]. Various studies have applied the portfolio theory in the energy field [42,43,44,45,46]. We analyzed the portfolio selection based on Markowitz [22] theory and Korea Energy Economics Institute (KEEI) [44] research.
Let us consider n assets. The cost of a portfolio constructed with these assets is given by
where is the weight of asset in the portfolio, and is the cost of asset .
The MV portfolio model for the optimal long-term/spot contract ratio can be defined as
where and denote, respectively, the expected cost of the portfolio and the expected cost of asset , and denotes the portfolio’s cost standard deviation (i.e., the portfolio’s risk). The risk of the portfolio can be written as
where is the standard deviation of asset ’s cost, and is the correlation coefficient between the costs of assets and .
Given the abovementioned equations, the optimization process minimizes the variance of a portfolio that includes a fixed expected minimum cost. Therefore, an investor or decision maker can calculate an efficient frontier with the minimum variance for each expected cost using the objective Equation (2) and the constraints (3). The efficient frontier is a set of optimized portfolios. A decision maker can choose an optimal portfolio for the efficient frontier, taking into account their preferences.
This study derived the optimal purchase ratio by solving the portfolio optimization problem with two purchase alternatives (long-term and spot contracts). Using Equations (2) and (3), we selected the optimal purchase ratio between the long-term and spot contracts with minimum risk on the efficient frontier. The optimal purchase ratio () was set as the constraint in the LP portfolio model.
2.4. Linear Programming Portfolio Model
The purpose of the LP portfolio model is to select the optimal LNG portfolio for Korea, which determines the LNG imports from each country that minimizes the sum of the types and intangible factors.
The parameters used were as follows:
- (1)
- Set
i Number of LNG-exporting countries j Korea t Time - (2)
- Parameters
Importing price from the exporting country , Inventory holding costs for LNG at ports within the importing country, LNG storage capacity of importing country j, Country risk for exporting country i, Maritime transport risks from country i to country j, Nature disaster risks for exporting country i, Amount of LNG demand in importing country j at time t Annual liquefaction capacity of country i Annual re-gasification capacity of country j LNG supply volume of exporting country i, Maximum percentage of LNG that one supplier country can export to one importing country at time t, The optimal long-term contract ratio derived from the MV portfolio model - (3)
- Variables
Amount of LNG imported from country i to country j at time t LNG storage capacity of the importing country j at time t - (4)
- Weights
wl Weight for economic risk wc Weight for country risk wt Weight for maritime transportation risk wn Weight for natural disaster risk
The objective functions used in the study were established based on Biresselioglu’s [17] and Lee’s [21] models and by considering the equations and parameters used in previous studies [17,18,19,20,21]. The objective function was as follows:
When determining the optimal LNG portfolio, it is important to consider the infrastructure of importing and exporting countries and the diversification of importation sources [18]. To consider these conditions, we set constraints. The relevant formulas used for the constraints were as follows.
The market concentration of the LNG market is high. This situation increases the vulnerability of importing countries [34]. Importing countries should diversify their sources of LNG supply to enhance the security of energy. Considering previous studies [17,21] and to enhance the security of LNG importation, we assumed that the maximum ratio of supply by an exporting country did not exceed 25% of the total demand amount for the importing country. This constraint is shown by Equation (6):
An exporting country can export depending on the maximum percentage of LNG that it can export to importing country i at time t. This constraint is shown by Equation (7):
The importing country j, Korea, should secure the amount of LNG that meets the demand at time t. This constraint is shown by Equation (8):
A liquefaction facility is needed to export natural gas in the form of LNG. The amount of LNG supplied from the exporting country i should be less than or equal to the liquefaction capacity in the exporting country i. This constraint is shown by Equation (9):
A re-gasification facility is required to gasify the imported LNG for utilization. Therefore, the total amount of LNG importation should be less than or equal to the annual re-gasification capacity in the importing country. This constraint is shown by Equation (10):
The volume of LNG held in the inventory of country j at time t cannot exceed the LNG storage capacity of importing country j. This constraint is shown by Equation (11):
All variables in the model should be greater than or equal to zero. This constraint is shown by Equation (12):
Finally, by applying the optimal long-term contract purchase ratio derived from the MV portfolio model as the constraint equation, we considered the volume of the long-term contracts in the optimal portfolio strategy. This constraint is shown by Equation (13):
3. Data
3.1. Selection of Exporting Countries
In this study, of the 17 countries that traded LNG with Korea from 2013 to 2015, all except Belgium were chosen as analytical subjects. Belgium was excluded because it is not an LNG producer country but rather, an LNG importer and re-exporter. In addition, the amount of LNG imported from Belgium was just 0.3% of Korea’s total import volume; consequently, the effect of this amount on the entire supply portfolio was negligible. The sixteen selected countries were as follows: Qatar, Indonesia, Oman, Malaysia, Russia, Yemen, Trinidad and Tobago, Nigeria, Equatorial Guinea, Australia, Peru, Egypt, Norway, United States, Brunei, and Algeria.
3.2. Tangible Factors
We used various references to obtain the LNG importation prices in Korea. The long-term contract price was calculated based on the internal data of the Korea Gas Corporation (KOGAS), IEA statistics [47], and the importation volume and bill from K-stat [48]. The spot contract price was obtained from the Platts’s [49] JKM (Japan Korea Marker) LNG price. The LNG infrastructure data from Korea and the exporting countries, and the LNG trade volume in the exporting countries were determined from the IEA [47] and BP [50]. As in the previous study [18], the inventory holding cost for LNG was set at $0.079 per cubic meter [18]. The demand for total natural gas in Korea was determined from KEEI [51]. In 2016, the demand for natural gas in Korea was 47,472 million cubic meters (mcm).
3.2.1. Infrastructure Data related to LNG
Table 1 shows the amount of global LNG exported by the exporting countries. We used the share (%) of the largest export target country as the maximum supply ratio of each exporting country in this study’s constraint Equation (7).

Table 1.
Liquefied natural gas (LNG) export amounts of exporting countries (mcm).
Since LNG should be liquefied in an exporting country before export, a country producing natural gas must construct the necessary infrastructure to export natural gas in LNG form. Table 2 presents data on the liquefaction infrastructures of the exporting countries.
Table 2.
Liquefaction and LNG storage capacity of exporting countries.
An importing country also needs a facility to gasify imported LNG for use. Therefore, considering the re-gasification capacity reflects the uniqueness of the LNG market. Table 3 lists the capacity of the re-gasification facilities in Korea.
Table 3.
Re-gasification and LNG storage capacity of Korea.
3.2.2. Price Data
The average LNG monthly import unit price from each exporting country was used as the price data in this study. Table 4 shows the average LNG import unit price in each exporting country for 2013 and 2015.
Table 4.
LNG long-term contract prices for each exporting country ($/MMBtu).
Figure 2 shows the spot and the average long-term contract price and the rate of price change between 2013 and 2015. Table 5 shows the descriptive statistics for price data.
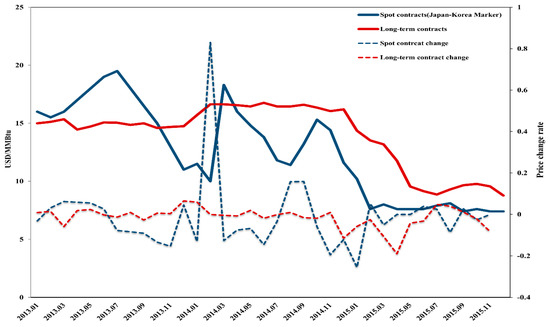
Figure 2.
The price of spot and long-term contracts and the rate of price change.
Table 5.
Descriptive statistics on price data.
3.3. Intangible Factor Data
The intangible factors considered in this study consisted of the country risk, the maritime transportation risk, and the natural disaster risk. These factors were quantified and used as data for the optimal portfolio considering the value chain of the natural gas market. The country risk was calculated based on the Failed States Index [52]. The Failed States Index is calculated by measuring 12 indices for public services, human rights, and poverty, among others, for 178 countries. The maritime transport risk was obtained from the International Chamber Of Commerce (ICC) [53] report. Finally, the natural disaster risk for the exporting country was calculated using the Global Climate Risk index [54].
3.3.1. Country Risk
The country risk, also known as the political risk, indicates the risk of political instability, such as coup d’état, riots, and a low degree of political freedom [55,56]. From an energy security point of view, analyzing the country risk of a trading partner state is critical when constructing an LNG portfolio. The country risk was calculated using the Failed Country Index [52], which is based on the general political, economic and social issues of each country. The index is calculated by measuring 12 indices for public services, human rights, and poverty, among others, for 178 countries.
3.3.2. Maritime Transport Risk
Korea is unable to use a pipeline natural gas-related network connected to the Asian continent because of the division of South and North Korea. Thus, Korea’s natural gas demand can only be satisfied by the marine transportation of LNG. Since the major marine transportation pathways used by Korea pass through areas such as the Malacca Strait and the Gulf of Aden where marine terrorism is frequent, it is important to include the risk of marine transportation in the model. We calculated the maritime transport risk by using the number of piracy incidents and armed robberies in the marine transportation pathways from the exporting country to Korea. The ICC [53] provides this data.
3.3.3. Natural Disaster Risk
To reflect the impact of natural disasters on infrastructure, this study used the Global Climate Risk Index [54], which assesses the risk of climate change and natural disasters. The index is calculated considering the impact and the amount of damage caused by natural disasters. Table 6 shows data on the intangible risks of the exporting country.
Table 6.
The data on the intangible risks of the exporting countries.
3.4. Normalization
Before analyzing the optimal portfolio, we performed normalization. Normalization was performed to avoid distortion using the different scales of the individual risk factors. Table 7 shows the normalized values.
Table 7.
Normalized values of the exporting country risks and prices.
4. Results and Discussion
4.1. MV Portfolio Result
The optimal purchase ratio was calculated using the MV portfolio model considering the price level and correlation between long-term and spot contracts. The optimal purchase ratio was selected using the efficient frontier. Figure 3 shows the efficient frontier and selected optimal portfolio. According to the analysis results, the optimal ratios for long-term and spot contracts were 89.72% and 10.28%, respectively.
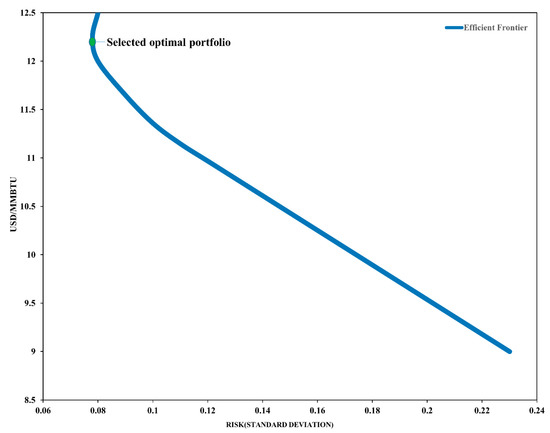
Figure 3.
The optimal purchase ratio on the efficient frontier.
4.2. Fuzzy AHP Results
As mentioned in the introduction, the weights derived by fuzzy AHP were applied as the weights for the economic, national, marine transportation, and natural disaster risks. Since we calculated the weight elements based on the KOGAS expert results, we were able to develop a model that more accurately reflects Korea’s situation. The fuzzy AHP results are shown in Table 8.
Table 8.
Fuzzy analytic hierarchy process (AHP) results.
4.3. Optimal LNG Portfolio
Using the results of the fuzzy AHP and the optimal purchase ratio, we constructed the optimum LNG portfolio for each country. The results were compared with Korea’s actual LNG portfolio for 2012. Figure 4 and Table 9 show the optimal LNG portfolio.
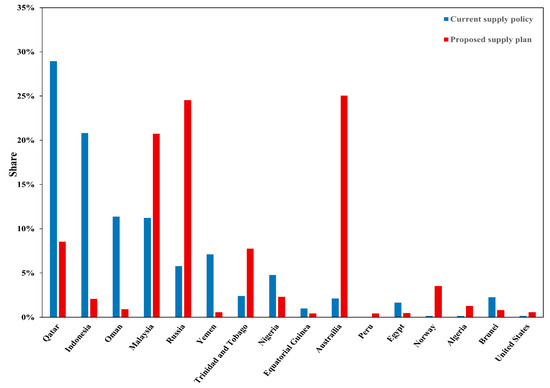
Figure 4.
Comparison of portfolio analysis results.
Table 9.
Comparison of portfolio analysis results (%).
Also, we analyzed our portfolio using the analytical results on a regional basis because marine transportation, political, and natural disaster risks are not limited to the supplier country; the results have an interconnected effect on countries in the same region, as shown in Table 10 and Figure 5.
Table 10.
Comparison of portfolio analysis results for each continental region (%).
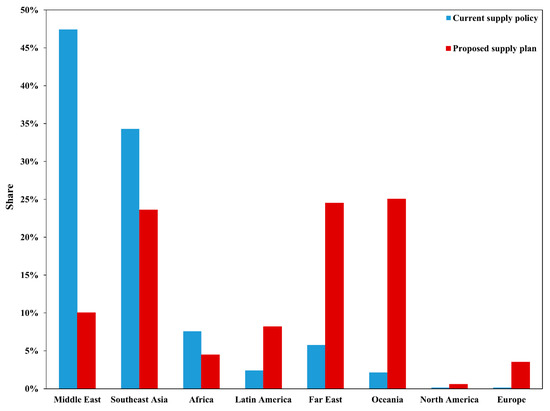
Figure 5.
Comparison of portfolio analysis results for each continental region.
As shown in Table 10 and Figure 5, 49.12% of Korea’s total LNG imports come from the Middle East and 34.31% are imported from Southeast Asia. This means that natural gas imports depend heavily on specific regions. More particularly, Qatar and Indonesia account for 49% of the total amount of imported natural gas. This high dependence on specific countries means that Korea should make policy efforts to diversify its import sources. A two-step portfolio model was developed in this study that considers a comprehensive energy security perspective and a value chain. The optimal portfolio derived from the model has results that differ to the current supply policy of Korea.
The proposed supply plan derived from the two-step portfolio shows that the supply volume from the Middle East and Southeast Asian regions decreases while that of the Far East and Oceania significantly increases. This is because the LNG unit price, national risk, and marine transportation risk in the Middle East are high. The supply volume from Southeast Asia is lower in the proposed plan than in the current supply policy because the risks of marine transportation and natural disasters are relatively high. In contrast, the supply volume from the Far East and Oceania, including Russia and Australia, considerably increases in the proposed supply plan because the risk of marine transportation and the unit price in these regions are lower than those in the Middle East and Southeast Asian regions. More specifically, the supply volume from all countries in the Middle East decreases. In Southeast Asia, the supply volume from Indonesia decreases significantly. This is because Malaysia’s supply price and maritime transport risks are lower than those in Indonesia. Brunei’s supply volume is slightly reduced. The supply volume from Latin America also increases. This is because the risk of marine transportation for countries in this region through the Pacific Ocean is much lower than that from countries in the Middle East, Southeast Asia, and Africa, which use high-risk sea routes. The opening of the Panama Canal has improved the region’s competitiveness. Considering this situation, the prediction of an increasing supply volume from Latin America is reasonable. In Africa, there are also high levels of political and marine transportation risk; however, the import unit price is lower than that in the Middle East, resulting in a slight decrease in the supply volume in the optimal portfolio. Currently, KOGAS participates in gas field development and the acquisition of equity in Mozambique.
The supply volume of Australia is predicted to increase significantly in the optimal portfolio. Australia is expected to provide sufficient capacity because it has the world’s largest liquefaction plant. Consequently, imports from Australia could be an excellent solution to the continually increasing demand for natural gas. In addition, since its marine transportation and political risks are low, it may be necessary to increase the supply volume from Australia, as indicated by the optimal portfolio. Russia is expanding its infrastructure capacity to increase LNG exports to Korea and Japan. Therefore, increasing the Russian supply ratio, as in the optimal portfolio, is a reasonable alternative.
According to the optimal portfolio, which considers tangible and intangible costs, the maldistribution of LNG supply in specific regions decreases compared to the current supply policy. To check the quantitative improvement from a security perspective, we used the natural gas security index model to evaluate the optimal portfolio. The model was proposed by Lefèvre [27]. The results of the comparisons are shown in Figure 6.
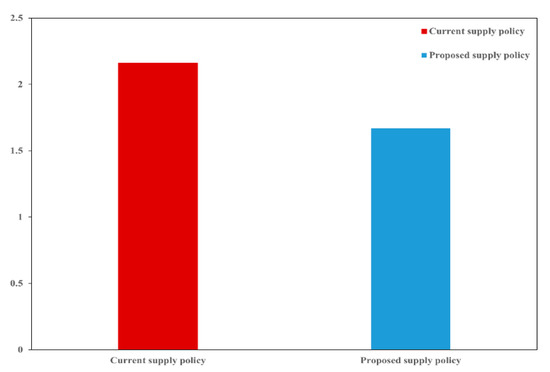
Figure 6.
Portfolio assessment using the natural gas security index.
The results shown in Figure 6 represent the level of energy security evaluated in terms of diversification. A lower value means a higher level of energy security. By applying the current supply policy in Korea, the natural gas security index is shown to be 2.16. The result derived from the optimal portfolio is 1.67. These results indicate that the optimal portfolio has improved the energy security.
5. Conclusions
Korea has started to develop a new energy transition policy [13], and the policy has increased the importance of natural gas in the energy mix. Therefore, having stable LNG security is important. Considering the policy perspective, we developed a two-step portfolio model that reflects the price level, the correlation between long-term and spot contracts, and tangible and intangible costs based on the LNG value chain.
The optimal LNG portfolio calculated in this study has significant policy implications. The actual supply ratio of the Middle East and Southeast Asia (83%) significantly decreased to 30% in the optimal portfolio. This is because the tangible and intangible costs in these regions, such as maritime transportation and political risks, are higher than those in other regions. In contrast, the supply ratios of the Far East and Oceania increased sharply in the optimal portfolio. Accordingly, Korea’s natural gas security index decreased significantly, indicating that the analytical results offer a crucial policy viewpoint. Indeed, the policy proposal derived from the optimal portfolio is consistent with the supply diversification policy that the Korean government has promoted. We propose that the Korean government consider the following policy directions.
- Diversification: Improving the LNG importation portfolio considering the economic and intangible risk.
- Increasing the flexibility of conditions for long-term contracts through cooperation with major LNG exporting countries.
- Utilization of spot and direct import to manage efficient supply and demand.
The analytical framework and results proposed by this study provide a solution to these policy goals. We suggest a diversification strategy and the optimal spot importation volume. In order to achieve comprehensive natural gas supply stabilization, the Korean government should increase its political action, such as through energy diplomacy that includes quota participation and the strengthening of their negotiating capability.
However, because long-term contracts dominate the natural gas market in Korea, it is not possible to change the LNG portfolio in the short run. Nevertheless, the findings of this study can be applied to formulate an LNG policy in the long run to significantly improve security policies and reduce the tangible and intangible costs incurred [57]. Therefore, the novel analytical framework proposed in this study offers an effective tool for making decisions about the optimal LNG portfolio.
Author Contributions
Conceptualization, J.K. (Juhan Kim) and J.K. (Jinsoo Kim); Data curation, J.K. (Juhan Kim); Formal analysis, J.K. (Juhan Kim); Funding acquisition, J.K. (Jinsoo Kim); Methodology, J.K. (Juhan Kim) and J.K. (Jinsoo Kim); Supervision, J.K. (Jinsoo Kim); Writing—original draft, J.K. (Juhan Kim); Writing—review and editing, J.K. (Jinsoo Kim).
Funding
This research is supported by the Human Resources Development program (No. 20174010201170) of the Korea Institute of Energy Technology Evaluation and Planning (KETEP) grant funded by the Korea government Ministry of Trade, Industry and Energy.
Conflicts of Interest
The authors declare no conflict of interest.
References
- IEA. World Energy Outlook 2017; International Energy Agency: Paris, France, 2017. [Google Scholar]
- Wright, S. Qatar’s lng: Impact of the changing east-asian market. Middle East Policy 2017, 24, 154–165. [Google Scholar]
- Elkind, J. United states energy sector collaboration with Israel. Hampton Roads Int. Secur. Q. 2017, 5, 5–8. [Google Scholar]
- Fattouh, B. How Secure Are Middle East Oil Supplies? Oxford Institute for Energy Studies: Oxford, UK, 2007. [Google Scholar]
- Bilgin, M. Geopolitics of european natural gas demand: Supplies from Russia, caspian and the middle east. Energy Policy 2009, 37, 4482–4492. [Google Scholar] [CrossRef]
- Hartley, P.R. The future of long-term lng contracts. Energy J. 2015, 36, 1–42. [Google Scholar] [CrossRef]
- Hwang, J.-H.; Roh, M.-I.; Lee, K.-Y. Determination of the optimal operating conditions of the dual mixed refrigerant cycle for the lng fpso topside liquefaction process. Comput. Chem. Eng. 2013, 49, 25–36. [Google Scholar] [CrossRef]
- Vivoda, V. Lng import diversification in asia. Energy Strategy Rev. 2014, 2, 289–297. [Google Scholar] [CrossRef]
- BP. BP Statistical Review of World Energy; Global, British Petroleum: London, UK, 2018. [Google Scholar]
- KESIS. Korea Energy Statistical Information System; Korea Energy Economics Institute: Jung-gu, Korea, 2018; Volume 2018. [Google Scholar]
- Lee, S.-U.; Kim, K.-S. An evaluation on the efficacy of the competition policy in korean gas industry—From the perspective of meta error in policy problem definition. J. Regul. Stud. 2013, 22, 183–224. [Google Scholar]
- Lee, J.; Han, J.; Shin, C.; An, S.; Lee, Y.; Sung, W. A study on the underground natural gas storage and the conversion of depleted gas reservoir into underground storage. Korean Soc. Miner. Energy Resour. Eng. 2009, 46, 114–124. [Google Scholar]
- MOTIE. Renewable Energy 3020 Implementation Plan; The Ministry of Trade, Industry and Energy: Sejong City, Korea, 2017.
- Wu, J.-H.; Huang, Y.-H. Electricity portfolio planning model incorporating renewable energy characteristics. Appl. Energy 2014, 119, 278–287. [Google Scholar] [CrossRef]
- Cho, J.; Yoon, T.; Kim, Y.-K. An induced impact analysis of a lng power plant in korea. Korean Energy Econ. Rev. 2018, 17, 265–286. [Google Scholar]
- Yergin, D. Ensuring energy security. Foreign Aff. 2006, 85, 69–82. [Google Scholar] [CrossRef]
- Biresselioglu, M.E.; Demir, M.H.; Kandemir, C. Modeling turkey’s future lng supply security strategy. Energy Policy 2012, 46, 144–152. [Google Scholar] [CrossRef]
- Geng, J.-B.; Ji, Q.; Fan, Y.; Shaikh, F. Optimal lng importation portfolio considering multiple risk factors. J. Clean. Prod. 2017, 151, 452–464. [Google Scholar] [CrossRef]
- Zhang, X.-N.; Zhong, Q.-Y.; Qu, Y.; Li, H.-L. Liquefied natural gas importing security strategy considering multi-factor: A multi-objective programming approach. Expert Syst. Appl. 2017, 87, 56–69. [Google Scholar] [CrossRef]
- Shaikh, F.; Ji, Q.; Fan, Y.; Shaikh, P.H.; Uqaili, M.A. Modelling an optimal foreign natural gas import scheme for china. J. Nat. Gas Sci. Eng. 2017, 40, 267–276. [Google Scholar] [CrossRef]
- Lee, N. A Study on Korea’s Strategy Planning for Securing Overseas Energy: Focus on Natural Gas; Chungnam National University: Daejon, Korea, 2013. [Google Scholar]
- Markowitz, H. Portfolio selection. J. Financ. 1952, 7, 77–91. [Google Scholar]
- Tung, S.; Tang, S. A comparison of the saaty’s ahp and modified ahp for right and left eigenvector inconsistency. Eur. J. Oper. Res. 1998, 106, 123–128. [Google Scholar] [CrossRef]
- Guo, J.-Y.; Zhang, Z.-B.; Sun, Q.-Y. Applications of AHP method in safety science. J. Saf. Sci. Technol. 2008, 2, 69–73. [Google Scholar]
- Cheng, J.-H.; Chen, S.-S.; Chuang, Y.-W. An application of fuzzy delphi and fuzzy ahp for multi-criteria evaluation model of fourth party logistics. WSEAS Trans.Syst. 2008, 7, 466–478. [Google Scholar]
- Triantaphyllou, E.; Mann, S.H. Using the analytic hierarchy process for decision making in engineering applications: Some challenges. Int. J. Ind. Eng. Appl. Pract. 1995, 2, 35–44. [Google Scholar]
- Lefèvre, N. Measuring the energy security implications of fossil fuel resource concentration. Energy Policy 2010, 38, 1635–1644. [Google Scholar] [CrossRef]
- Woodward, J.L.; Pitbaldo, R. LNG Risk Based Safety: MODELING and Consequence Analysis; John Wiley & Sons: Hoboken, NJ, USA, 2010. [Google Scholar]
- Saaty, T.L. The Analytic Hierarchy Process: Planning, Priority Setting, Resource Allocation; McGraw-Hill International Book Company: New York, NY, USA, 1980. [Google Scholar]
- Özdağoğlu, A.; Özdağoğlu, G. Comparison of AHP and Fuzzy AHP for the Multi-Criteria Decision Making Processes with Linguistic Evaluations; Istanbul Commerce University: Istanbul, Turkey, 2007. [Google Scholar]
- Karimi, A.; Mehrdadi, N.; Hashemian, S.; Bidhendi, G.N.; Moghaddam, R.T. Selection of wastewater treatment process based on the analytical hierarchy process and fuzzy analytical hierarchy process methods. Int. J. Environ. Sci. Technol. 2011, 8, 267–280. [Google Scholar] [CrossRef]
- Buckley, J.J. Ranking alternatives using fuzzy numbers. Fuzzy Sets Syst. 1985, 15, 21–31. [Google Scholar] [CrossRef]
- Buckley, J.J. Fuzzy hierarchical analysis. Fuzzy Sets Syst. 1985, 17, 233–247. [Google Scholar] [CrossRef]
- Chang, D.-Y. Applications of the extent analysis method on fuzzy ahp. Eur. J. Oper. Res. 1996, 95, 649–655. [Google Scholar] [CrossRef]
- Ribeiro, R.A. Fuzzy multiple attribute decision making: A review and new preference elicitation techniques. Fuzzy Sets Syst. 1996, 78, 155–181. [Google Scholar] [CrossRef]
- Cheng, C.-H. Evaluating naval tactical missile systems by fuzzy ahp based on the grade value of membership function. Eur. J. Oper. Res. 1997, 96, 343–350. [Google Scholar] [CrossRef]
- Weck, M.; Klocke, F.; Schell, H.; Rüenauver, E. Evaluating alternative production cycles using the extended fuzzy ahp method. Eur. J. Oper. Res. 1997, 100, 351–366. [Google Scholar] [CrossRef]
- Bozdağ, C.E.; Kahraman, C.; Ruan, D. Fuzzy group decision making for selection among computer integrated manufacturing systems. Comput. Ind. 2003, 51, 13–29. [Google Scholar] [CrossRef]
- Sheu, J.-B. A hybrid fuzzy-based approsach for identifying global logistics strategies. Transp. Res. Part E Logist. Transp. Rev. 2004, 40, 39–61. [Google Scholar] [CrossRef]
- Heo, E.; Kim, J.; Cho, S. Selecting hydrogen production methods using fuzzy analytic hierarchy process with opportunities, costs, and risks. In. J. Hydrog. Energy 2012, 37, 17655–17662. [Google Scholar] [CrossRef]
- Markowitz, H.M. Foundations of portfolio theory. J. Financ. 1991, 46, 469–477. [Google Scholar] [CrossRef]
- Bonacina, F. The Optimal Generation Mix for an Electricity Producer: The Case of Italy. Ph.D. Thesis, Universit degli Studi di Milano-Bicocca, Milano, Italy, 2013. [Google Scholar]
- Awerbuch, S. Portfolio-based electricity generation planning: Policy implications for renewables and energy security. Mit. Adapt. Strat. Glob. Chang. 2006, 11, 693–710. [Google Scholar] [CrossRef]
- KEEI. A Study on Lng Pricing Method and Long-Term—Spot Optimal Portfolio Selection; Korea Energy Economics Institute: Uiwang, Korea, 2012. [Google Scholar]
- Roques, F.A.; Newbery, D.M.; Nuttall, W.J. Fuel mix diversification incentives in liberalized electricity markets: A mean–variance portfolio theory approach. Energy Econ. 2008, 30, 1831–1849. [Google Scholar] [CrossRef]
- Gökgöz, F.; Atmaca, M.E. Financial optimization in the turkish electricity market: Markowitz’s mean-variance approach. Renew. Sustain. Energy Rev. 2012, 16, 357–368. [Google Scholar] [CrossRef]
- IEA. Natural Gas Information 2017; International Energy Agency: Paris, France, 2017. [Google Scholar]
- KITA. K-Statisics; The Korea International Trade Association: Seoul, Korea, 2018. [Google Scholar]
- Platts. Platts Market Data-Lng; Platts: New York, NY, USA, 2017. [Google Scholar]
- BP. BP Statistical Review of World Energy; Global, British Petroleum: London, UK, 2016. [Google Scholar]
- KEEI. Yearbook of Energy Statistics; Korea Energy Economics Institute: Ulsan, Korea, 2017. [Google Scholar]
- FFP. Fragile States Index; The Fund for Peace: Washington, DC, USA, 2016. [Google Scholar]
- ICC International Maritime Bureau. Piracy and Armed Robbery against Ships Report; ICC International Maritime Bureau: London, UK, 2013. [Google Scholar]
- Kreft, S.; Eckstein, D.; Melchior, I. Global Climate Risk Index 2017: Who Suffers Most From Extreme Weather Events? Weather-Related Loss Events in 2015 and 1996 to 2015; Germanwatch Nord-Süd Initiative eV: Bonn, Germany, 2016. [Google Scholar]
- Jensen, N. Measuring Risk: Political Risk Insurance Premiums and Domestic Political Institutions. In Proceedings of the Political Economy of Multinational Corporations and Foreign Direct Investment Conference, Washington, DC, USA, 7 November 2005. [Google Scholar]
- Lindeberg, M.; Mörndal, S. Managing Political Risk: A Contextual Approach; Ekonomiska Institutionen: Stockholm, Sweden, 2002. [Google Scholar]
- Kim, J.; Jin, T.; Kim, J. Assessment of south korea’s lng portfolio considering panama canal expansion, Heading Towards Sustainable Energy Systems: Evolution or Revolution? In Proceedings of the 15th IAEE European Conference, Vienna, Austria, 3–6 September 2017. [Google Scholar]


© 2018 by the authors. Licensee MDPI, Basel, Switzerland. This article is an open access article distributed under the terms and conditions of the Creative Commons Attribution (CC BY) license (http://creativecommons.org/licenses/by/4.0/).