Schedule Modeling to Estimate Typical Construction Durations and Areas of Risk for 1000 MW Ultra-Critical Coal-Fired Power Plants


Abstract
:1. Introduction
1.1. Coal-Fired Power Generation Existing Literature
1.2. The Use of PERT/CPM and Uncertainty in Construction Literature
1.3. Point of Departure
2. Materials and Methods
2.1. Data Collection
2.2. Research Methodology
3. Results
4. Discussion
5. Conclusions and Limitations
Author Contributions
Funding
Acknowledgments
Conflicts of Interest
Appendix A

| Activity | Most Likely Duration (tm) |
|---|---|
| Boiler excavating to foundations | 8 |
| Foundations and concrete work | 6 |
| Boiler main steel | 9 |
| Miscellaneous steel and finish | 23 |
| Boiler pressure parts installation | 17 |
| Turbine building excavating to foundations | 8 |
| Discharge tunnel and foundation concrete | 11 |
| Main steel frame installation | 8 |
| Crane installation and testing | 3 |
| T/G base mat concrete | 4 |
| Pedestal and deck concrete | 11 |
| BM and chipping | 2 |
| Sole Plate | 1 |
| Turbine generator installation | 18 |
| Electrical System | 1 |
| Chemical cleaning and cold clean up | 1 |
| Steam blow-out | 8 |
| Boiler and auxiliary system test | 8 |
| Firing test | 2 |
| T/G and auxiliary system test | 2 |
| Trial Operation | 12 |
| Activity | Survey Responses (Months) | Mean | |||||||||
|---|---|---|---|---|---|---|---|---|---|---|---|
| 1 | 2 | 3 | 4 | 5 | 6 | 7 | 8 | 9 | 10 | ||
| Boiler excavating to foundations | 5 | 7 | 8 | 8 | 7 | 7 | 8 | 5 | 7 | 8 | 7 |
| Foundations and concrete work | 4 | 6 | 6 | 6 | 5 | 5 | 5 | 6 | 5 | 5 | 5 |
| Boiler main steel | 5 | 8 | 9 | 9 | 9 | 8 | 9 | 9 | 9 | 8 | 8 |
| Miscellaneous steel and finish | 18 | 22 | 23 | 23 | 20 | 21 | 22 | 21 | 20 | 20 | 21 |
| Boiler pressure parts installation | 12 | 16 | 17 | 17 | 17 | 17 | 17 | 15 | 16 | 17 | 16 |
| Turbine building excavating to foundations | 4 | 7 | 8 | 8 | 8 | 7 | 8 | 5 | 7 | 8 | 7 |
| Discharge tunnel and foundation concrete | 7 | 10 | 11 | 11 | 10 | 10 | 11 | 6 | 10 | 10 | 10 |
| Main steel frame installation | 4 | 8 | 8 | 8 | 7 | 7 | 8 | 7 | 6 | 6 | 7 |
| Crane installation and testing | 2 | 3 | 3 | 3 | 3 | 2 | 3 | 3 | 2 | 3 | 3 |
| T/G base mat concrete | 3 | 4 | 4 | 4 | 3 | 3 | 4 | 4 | 4 | 3 | 4 |
| Pedestal and deck concrete | 8 | 10 | 11 | 11 | 10 | 10 | 11 | 7 | 10 | 9 | 10 |
| BM and chipping | 1 | 2 | 2 | 2 | 2 | 2 | 2 | 2 | 2 | 2 | 2 |
| Sole Plate | 1 | 1 | 1 | 1 | 1 | 1 | 1 | 1 | 1 | 1 | 1 |
| Turbine generator installation | 16 | 17 | 18 | 18 | 18 | 17 | 18 | 15 | 15 | 17 | 17 |
| Electrical System | 1 | 1 | 1 | 1 | 1 | 1 | 1 | 1 | 1 | 1 | 1 |
| Chemical cleaning and cold clean up | 1 | 1 | 1 | 1 | 1 | 1 | 1 | 1 | 1 | 1 | 1 |
| Steam blow-out | 1 | 8 | 8 | 8 | 8 | 7 | 6 | 2 | 6 | 8 | 6 |
| Boiler and auxiliary system test | 6 | 8 | 8 | 8 | 7 | 7 | 8 | 8 | 8 | 7 | 8 |
| Firing test | 2 | 2 | 2 | 2 | 1 | 1 | 2 | 2 | 2 | 2 | 2 |
| T/G and auxiliary system test | 1 | 2 | 2 | 2 | 1 | 1 | 2 | 2 | 2 | 2 | 2 |
| Trial Operation | 10 | 12 | 12 | 12 | 10 | 11 | 12 | 12 | 9 | 10 | 11 |
| Activity | Survey Responses (Months) | Mean | |||||||||
|---|---|---|---|---|---|---|---|---|---|---|---|
| 1 | 2 | 3 | 4 | 5 | 6 | 7 | 8 | 9 | 10 | ||
| Boiler excavating to foundations | 12 | 12 | 10 | 9 | 12 | 9 | 9 | 8 | 9 | 10 | 10 |
| Foundations and concrete work | 10 | 7 | 7 | 7 | 9 | 7 | 7 | 7 | 7 | 7 | 8 |
| Boiler main steel | 12 | 12 | 12 | 11 | 9 | 11 | 10 | 10 | 11 | 10 | 11 |
| Miscellaneous steel and finish | 30 | 25 | 24 | 24 | 25 | 24 | 25 | 24 | 24 | 23 | 25 |
| Boiler pressure parts installation | 20 | 21 | 20 | 19 | 20 | 20 | 18 | 20 | 20 | 18 | 20 |
| Turbine building excavating to foundations | 12 | 12 | 10 | 9 | 9 | 9 | 9 | 8 | 10 | 9 | 10 |
| Discharge tunnel and foundation concrete | 15 | 12 | 11 | 12 | 12 | 12 | 12 | 11 | 11 | 12 | 12 |
| Main steel frame installation | 12 | 9 | 10 | 9 | 9 | 9 | 9 | 8 | 9 | 8 | 9 |
| Crane installation and testing | 5 | 3 | 3 | 4 | 3 | 4 | 4 | 4 | 3 | 3 | 4 |
| T/G base mat concrete | 6 | 5 | 4 | 5 | 5 | 5 | 5 | 6 | 5 | 5 | 5 |
| Pedestal and deck concrete | 15 | 12 | 11 | 13 | 12 | 12 | 12 | 11 | 13 | 12 | 12 |
| BM and chipping | 3 | 2 | 2 | 4 | 3 | 3 | 3 | 2 | 2 | 2 | 3 |
| Sole Plate | 2 | 3 | 3 | 2 | 1 | 2 | 1 | 1 | 1 | 1 | 2 |
| Turbine generator installation | 24 | 20 | 20 | 20 | 23 | 20 | 19 | 20 | 18 | 19 | 20 |
| Electrical System | 2 | 1 | 1 | 2 | 1 | 1.5 | 2 | 2 | 1 | 1 | 1 |
| Chemical cleaning and cold clean up | 2 | 1 | 1 | 2 | 1 | 2 | 2 | 2 | 1 | 1 | 2 |
| Steam blow-out | 3 | 8 | 8 | 10 | 12 | 10 | 8 | 3 | 9 | 9 | 8 |
| Boiler and auxiliary system test | 9 | 8 | 8 | 10 | 10 | 9 | 9 | 8 | 10 | 8 | 9 |
| Firing test | 3 | 3 | 4 | 3 | 4 | 3 | 3 | 3 | 4 | 2 | 3 |
| T/G and auxiliary system test | 3 | 3 | 3 | 3 | 3 | 3 | 3 | 2 | 3 | 2 | 3 |
| Trial Operation | 14 | 18 | 18 | 15 | 14 | 13 | 13 | 18 | 13 | 12 | 15 |
References
- Sieminski, A. International Energy Outlook 2014. Available online: https://www.eia.gov/pressroom/presentations/sieminski_09222014_columbia.pdf (accessed on 18 October 2018).
- Hou, G.; Yang, Y.; Jiang, Z.; Li, Q.; Zhang, J. A new approach of modeling an ultra-super-critical power plant for performance improvement. Energies 2016, 9, 310. [Google Scholar] [CrossRef]
- Tumanovskii, A.G.; Shvarts, A.L.; Somova, E.V.; Verbovetskii, E.K.; Avrutskii, G.D.; Ermakova, S.V.; Kalugin, R.N.; Lazarev, M.V. Review of the coal-fired, over-supercritical and ultra-supercritical steam power plants. Therm. Eng. 2017, 64, 83–96. [Google Scholar] [CrossRef]
- National Energy Technology Laboratory. High Performance Materials. Available online: https://www.netl.doe.gov/research/coal/crosscutting/high-performance-materials/Ultrasupercritical (accessed on 10 October 2018).
- Gianfrancesco, A. Materials for Ultra-Supercritical and Advanced Ultra-Supercritical Power Plants; Woodhead Publishing: Cambridge, UK, 2016. [Google Scholar]
- Zhang, D.K. Ultra-supercritical Coal Power Plant: Materials, Technologies and Optimisation; Woodhead Publishing: Cambridge, UK, 2013. [Google Scholar]
- Starkloff, R.; Postler, R.; Al-Maliki, W.A.; Alobaid, F.; Epple, B. Investigation into gas dynamics in an oxyfuel coal fired boiler during master fuel trip and blackout. J. Process Control 2016, 41, 67–75. [Google Scholar] [CrossRef]
- Stępczyńska, K.; Kowalczyk, Ł.; Dykas, S.; Elsner, W. Calculation of a 900 MW conceptual 700/720 °C coal-fired power unit with an auxiliary extraction-backpressure turbine. J. Power Technol. 2012, 92, 266–273. [Google Scholar]
- Bugge, J.; Kjaer, S.; Blum, R. High-efficiency coal-fired power plants development and perspectives. Energy 2006, 31, 1437–1445. [Google Scholar] [CrossRef]
- Hong, C.S.; Lee, E.B. Power Plant Economic Analysis: Maximizing Lifecycle Profitability by Simulating Preliminary Design Solutions of Steam-Cycle Conditions. Energies 2018, 11, 2245. [Google Scholar] [CrossRef]
- Phillips, J.N.; Wheeldon, J.M. Economic analysis of advanced ultra-supercritical pulverized coal power plants: A cost-effective CO2 emission reduction option. In Proceedings of the 6th International Conference on Advances in Materials Technology for Fossil Power Plants, Santa Fe, NM, USA, 31 August 2010; pp. 53–64. [Google Scholar]
- Kyushu Electric Power Co., Inc. Study on the Ultra Super Critical Coal-Fired Power Plants in Bac Lieu, the Socialist Republic of Vietnam. 2015. Available online: http://www.meti.go.jp/meti_lib/report/2015fy/000265.pdf (accessed on 10 October 2018).
- Hasler, D.; Rosenquist, W.; Gaikwad, R. New Coal-Fired Power Plant Performance and Cost Estimates. Available online: https://www.epa.gov/sites/production/files/2015-08/documents/coalperform.pdf (accessed on 18 October 2018).
- Lim, S.Y.; Kim, H.J.; Yoo, S.H. South Korean Household’s Willingness to Pay for Replacing Coal with Natural Gas? A View from CO2 Emissions Reduction. Energies 2017, 10, 2031. [Google Scholar] [CrossRef]
- Yan, Q.; Wang, Y.; Baležentis, T.; Sun, Y.; Streimikiene, D. Energy-Related CO2 Emission in China’s Provincial Thermal Electricity Generation: Driving Factors and Possibilities for Abatement. Energies 2018, 11, 1096. [Google Scholar] [CrossRef]
- Fan, H.; Zhang, Z.; Dong, J.; Xu, W. China’s R&D of advanced ultra-supercritical coal-fired power generation for addressing climate change. Therm. Sci. Eng. Prog. 2018, 5, 364–371. [Google Scholar] [CrossRef]
- Doloi, H. Cost overruns and failure in project management: Understanding the roles of key stakeholders in construction projects. J. Constr. Eng. Manag. 2012, 139, 267–279. [Google Scholar] [CrossRef]
- Assaf, S.A.; Al-Hejji, S. Causes of delay in large construction projects. Inter. J. Proj. Manag. 2006, 24, 349–357. [Google Scholar] [CrossRef]
- Odeh, A.M.; Battaineh, H.T. Causes of construction delay: Traditional contracts. Int. J. Proj. Manag. 2002, 20, 67–73. [Google Scholar] [CrossRef]
- Galloway, P.D. Survey of the construction industry relative to the use of CPM scheduling for construction projects. J. Constr. Eng. Manag. 2006, 132, 697–711. [Google Scholar] [CrossRef]
- Abdul-Rahman, H.; Berawi, M.A.; Berawi, A.R.; Mohamed, O.; Othman, M.; Yahya, I.A. Delay mitigation in the Malaysian construction industry. J. Constr. Eng. Manag. 2006, 132, 125–133. [Google Scholar] [CrossRef]
- Lu, M.; AbouRizk, S.M. Simplified CPM/PERT simulation model. J. Constr. Eng. Manag. 2000, 126, 219–226. [Google Scholar] [CrossRef]
- Barraza, G.A. Probabilistic estimation and allocation of project time contingency. J. Constr. Eng. Manag. 2010, 137, 259–265. [Google Scholar] [CrossRef]
- Mulholland, B.; Christian, J. Risk assessment in construction schedules. J. Constr. Eng. Manag. 1999, 125, 8–15. [Google Scholar] [CrossRef]
- Lu, M.; Li, H. Resource-activity critical-path method for construction planning. J. Constr. Eng. Manag. 2003, 129, 412–420. [Google Scholar] [CrossRef]
- Jun, D.H.; El-Rayes, K. Fast and accurate risk evaluation for scheduling large-scale construction projects. J. Comput. Civ. Eng. 2011, 25, 407–417. [Google Scholar] [CrossRef]
- Lu, M. Enhancing project evaluation and review technique simulation through artificial neural network-based input modeling. J. Constr. Eng. Manag. 2002, 128, 438–445. [Google Scholar] [CrossRef]
- Mapped: The World’s Coal Power Plants. CarbonBrief. 2018. Available online: https://www.carbonbrief.org/mapped-worlds-coal-power-plants (accessed on 10 October 2018).
- Choi, K.S. A Study on the Improvement of Calculation Method for the Proper Construction Period of Public Construction in Seoul; Yonsei University: Seoul, Korea, 2009. [Google Scholar]
- Cottrell, W.D. Simplified program evaluation and review technique (PERT). J. Constr. Eng. Manag. 1999, 125, 16–22. [Google Scholar] [CrossRef]
- Project Management Institute. A Guide to the Project Management Body of Knowledge, 6th ed.; Project Management Institute: Newtown Square, PA, USA, 2017. [Google Scholar]
- Maverick, J.B. What Is the Minimum Number of Simulations that Should Be Run in Monte Carlo Value at Risk (VaR)? Available online: https://www.investopedia.com/ask/answers/061515/what-minimum-number-simulations-should-be-run-monte-carlo-value-risk-var.asp (accessed on 10 October 2018).


| Thermal Power Plant | Capacity (MW per Unit) | Construction | |
|---|---|---|---|
| Plan | Actual | ||
| Dangjin Unit 9, 10 | 1020 | 11 June to 16 June 61 months | 11 June to 16 October 65 months |
| Taean Unit 9, 10 | 1022 | 12 December to 16 December 51 months | 12 December to 17 April 55 months |
| Shin Boryung Unit 1, 2 | 1050 | 11 November to 17 June 68 months | 11 November to 17 June 68 months |
| Shamcheok Unit 1, 2 | 1000 | 12 June to 16 June 49 months | 12 June to 17 June 61 months |
| Thermal Power Plant | Capacity (MW per Unit) | Construction |
|---|---|---|
| Hadong Unit 3, 4 | 500 | 94 May to 99 March 41 months |
| Taean Unit 3, 4 | 500 | 12 June to 97 August 39 months |
| Danghin Unit 5, 6 | 500 | 02 November to 06 March 40 months |
| Youngheung Unit 1, 2 | 800 | 00 July to 04 November 52 months |
| Youngheung Unit 3, 4 | 870 | 04 August to 08 December 52 months |
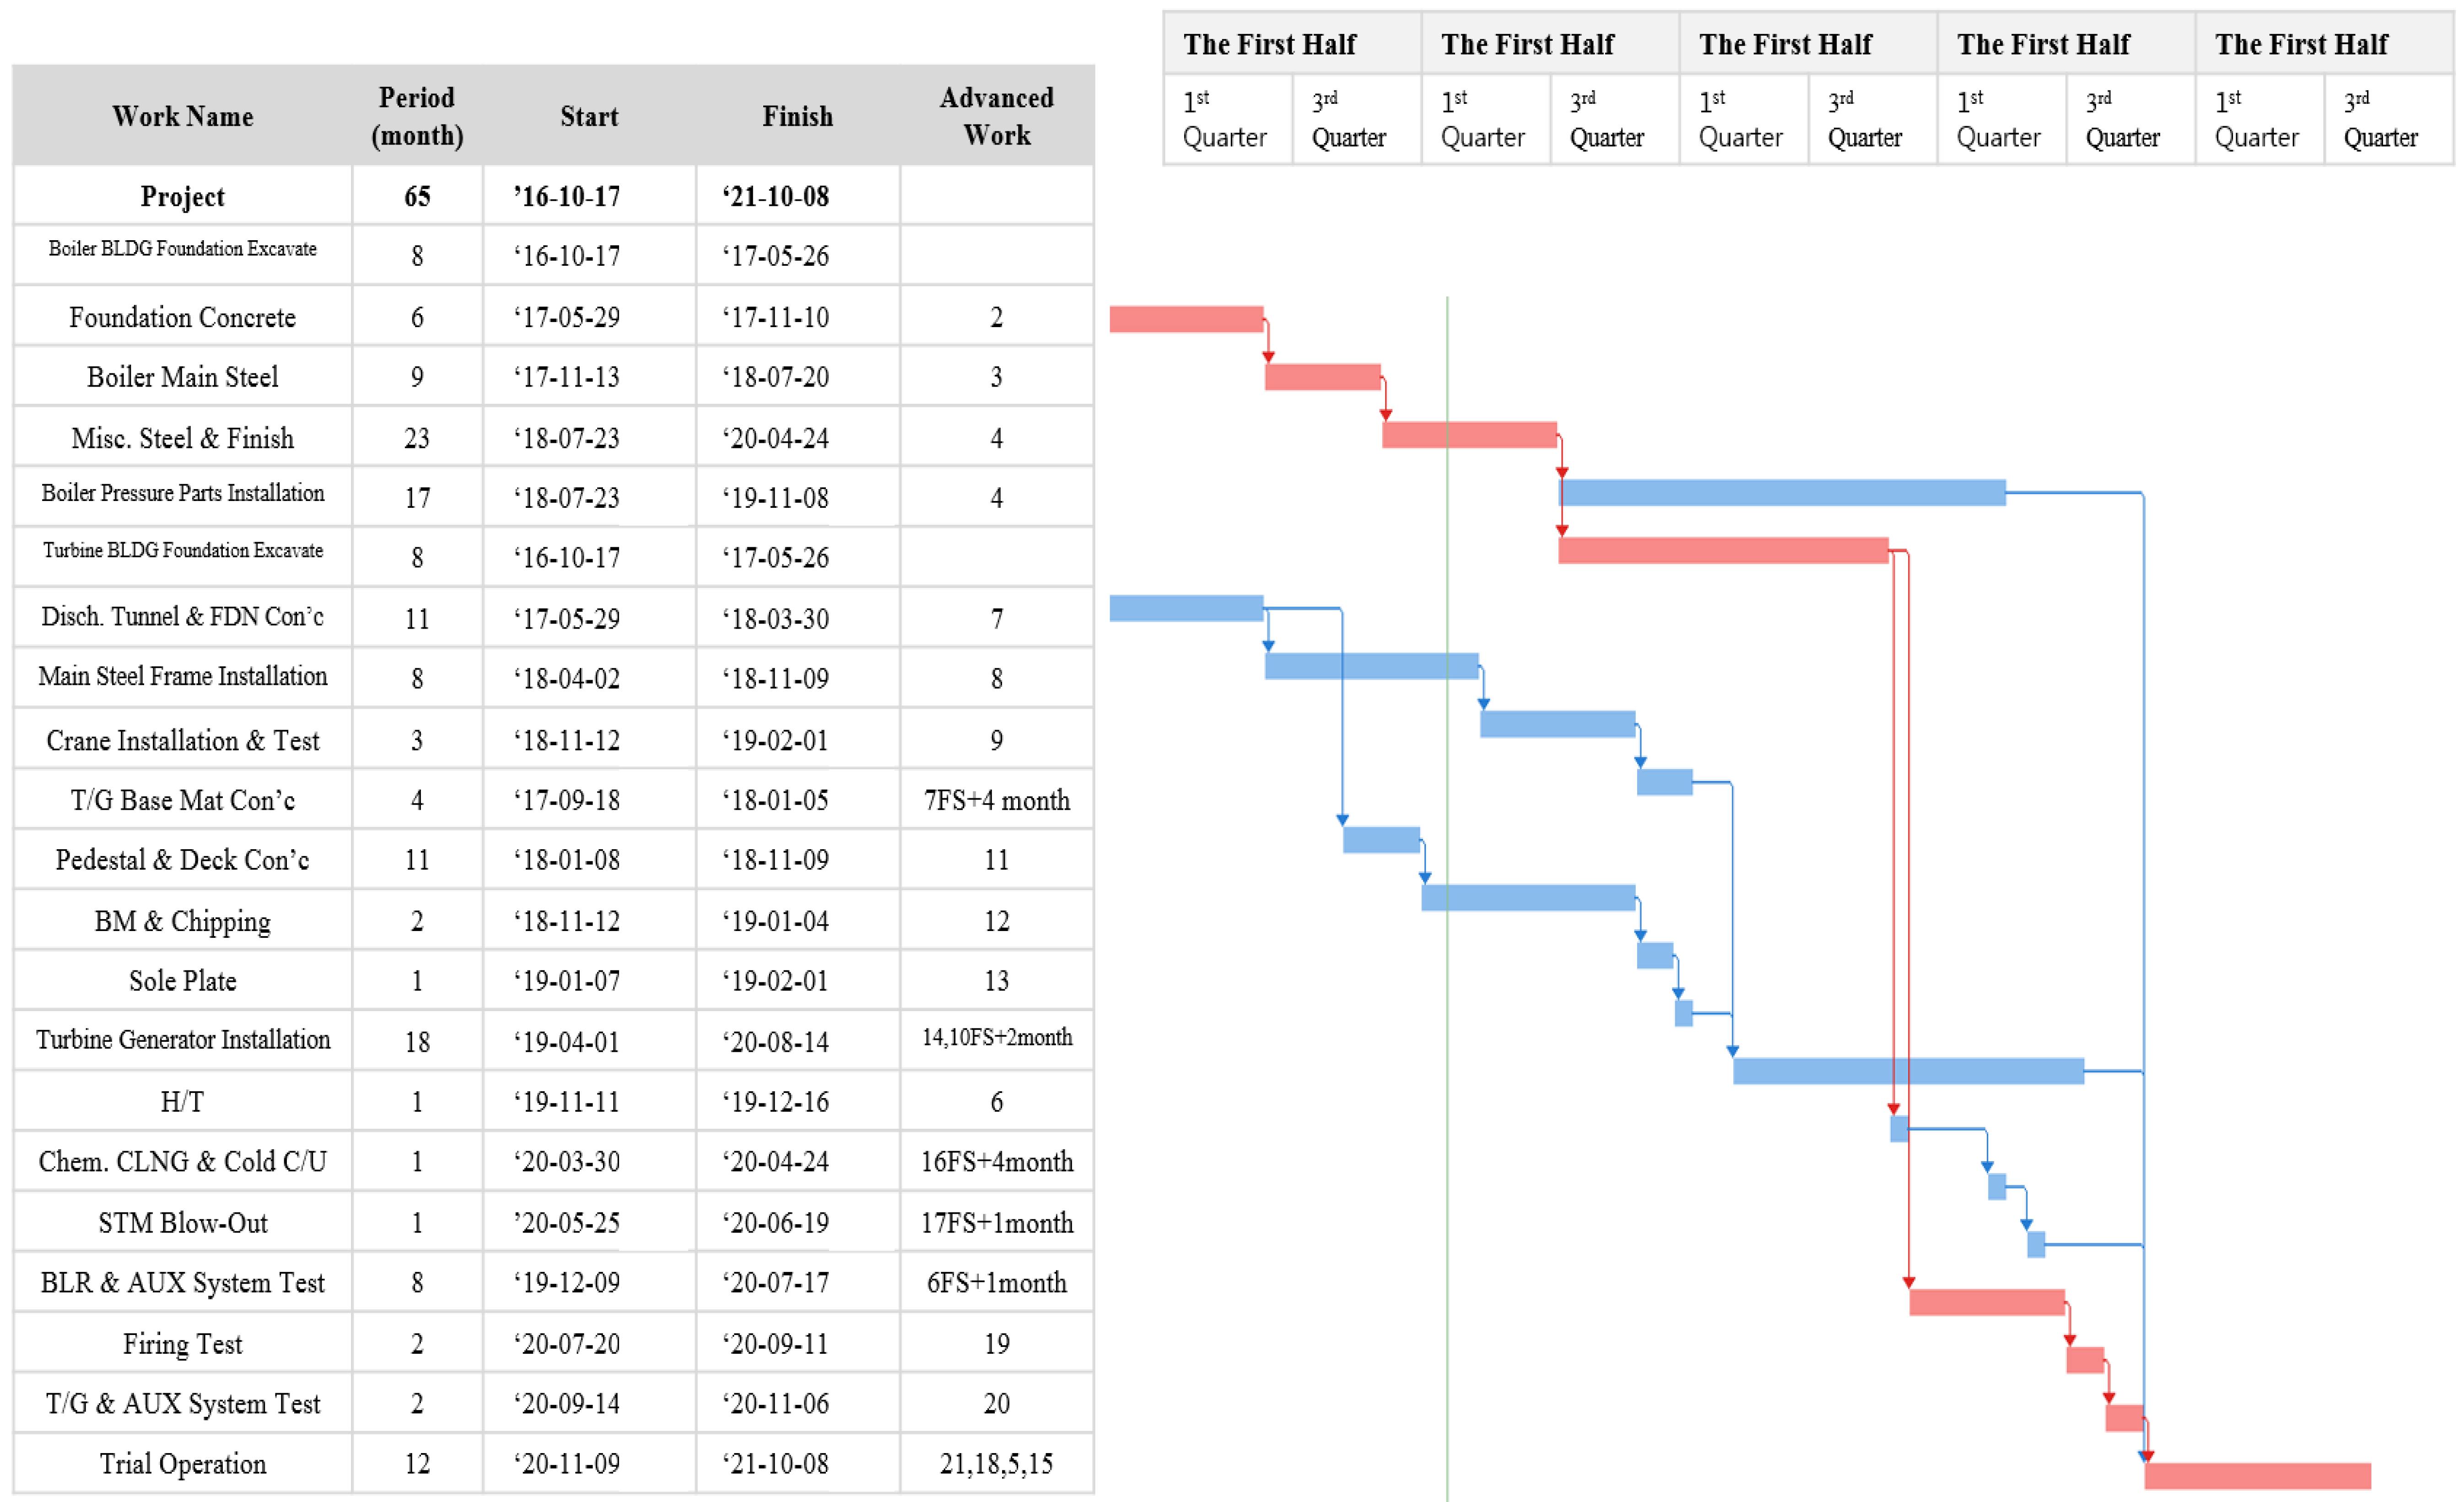
| Activity |
|---|
| Boiler excavating to foundations |
| Foundations and concrete work |
| Boiler main steel |
| Miscellaneous steel and finish |
| Boiler pressure parts installation |
| Turbine building excavating to foundations |
| Discharge tunnel and foundation concrete |
| Main steel frame installation |
| Crane installation and testing |
| T/G base mat concrete |
| Pedestal and deck concrete |
| Bench mark and chipping |
| Sole Plate |
| Turbine generator installation |
| Electrical System |
| Chemical cleaning and cold clean up |
| Steam blow-out |
| Boiler and auxiliary system test |
| Firing test |
| T/G and auxiliary system test |
| Trial Operation |
| Activity | to (Months) | tm (Months) | tp (Months) | te (Months) |
|---|---|---|---|---|
| Boiler excavating to foundations | 7 | 8 | 10 | 8 |
| Foundations and concrete work | 5 | 6 | 8 | 6 |
| Boiler main steel | 8 | 9 | 11 | 9 |
| Miscellaneous steel and finish | 21 | 23 | 25 | 23 |
| Boiler pressure parts installation | 16 | 17 | 20 | 17 |
| Turbine building excavating to foundations | 7 | 8 | 10 | 8 |
| Discharge tunnel and foundation concrete | 10 | 11 | 12 | 11 |
| Main steel frame installation | 7 | 8 | 9 | 8 |
| Crane installation and testing | 3 | 3 | 4 | 3 |
| T/G base mat concrete | 4 | 4 | 5 | 4 |
| Pedestal and deck concrete | 10 | 11 | 12 | 11 |
| Bench mark and chipping | 2 | 2 | 3 | 2 |
| Sole Plate | 1 | 1 | 2 | 1 |
| Turbine generator installation | 17 | 18 | 20 | 18 |
| Electrical System | 1 | 1 | 1 | 1 |
| Chemical cleaning and cold clean up | 1 | 1 | 2 | 1 |
| Steam blow-out | 6 | 8 | 8 | 8 |
| Boiler and auxiliary system test | 8 | 8 | 9 | 8 |
| Firing test | 2 | 2 | 3 | 2 |
| T/G and auxiliary system test | 2 | 2 | 3 | 2 |
| Trial Operation | 11 | 12 | 15 | 12 |
| Activity | to (months) | tm (months) | tp (months) | te (months) | σ (months) | σ2 (months) |
|---|---|---|---|---|---|---|
| Boiler building excavating to foundations | 7 | 8 | 10 | 8 | 0.50 | 0.25 |
| Foundations and concrete work | 5 | 6 | 8 | 6 | 0.37 | 0.13 |
| Boiler main steel | 8 | 9 | 11 | 9 | 0.42 | 0.17 |
| Boiler pressure parts installation | 16 | 17 | 20 | 17 | 0.58 | 0.34 |
| Boiler and auxiliary system test | 8 | 8 | 9 | 8 | 0.23 | 0.05 |
| Firing test | 2 | 2 | 3 | 2 | 0.23 | 0.05 |
| T/G and auxiliary system test | 2 | 2 | 3 | 2 | 0.18 | 0.03 |
| Trial Operation | 11 | 12 | 15 | 12 | 0.63 | 0.40 |
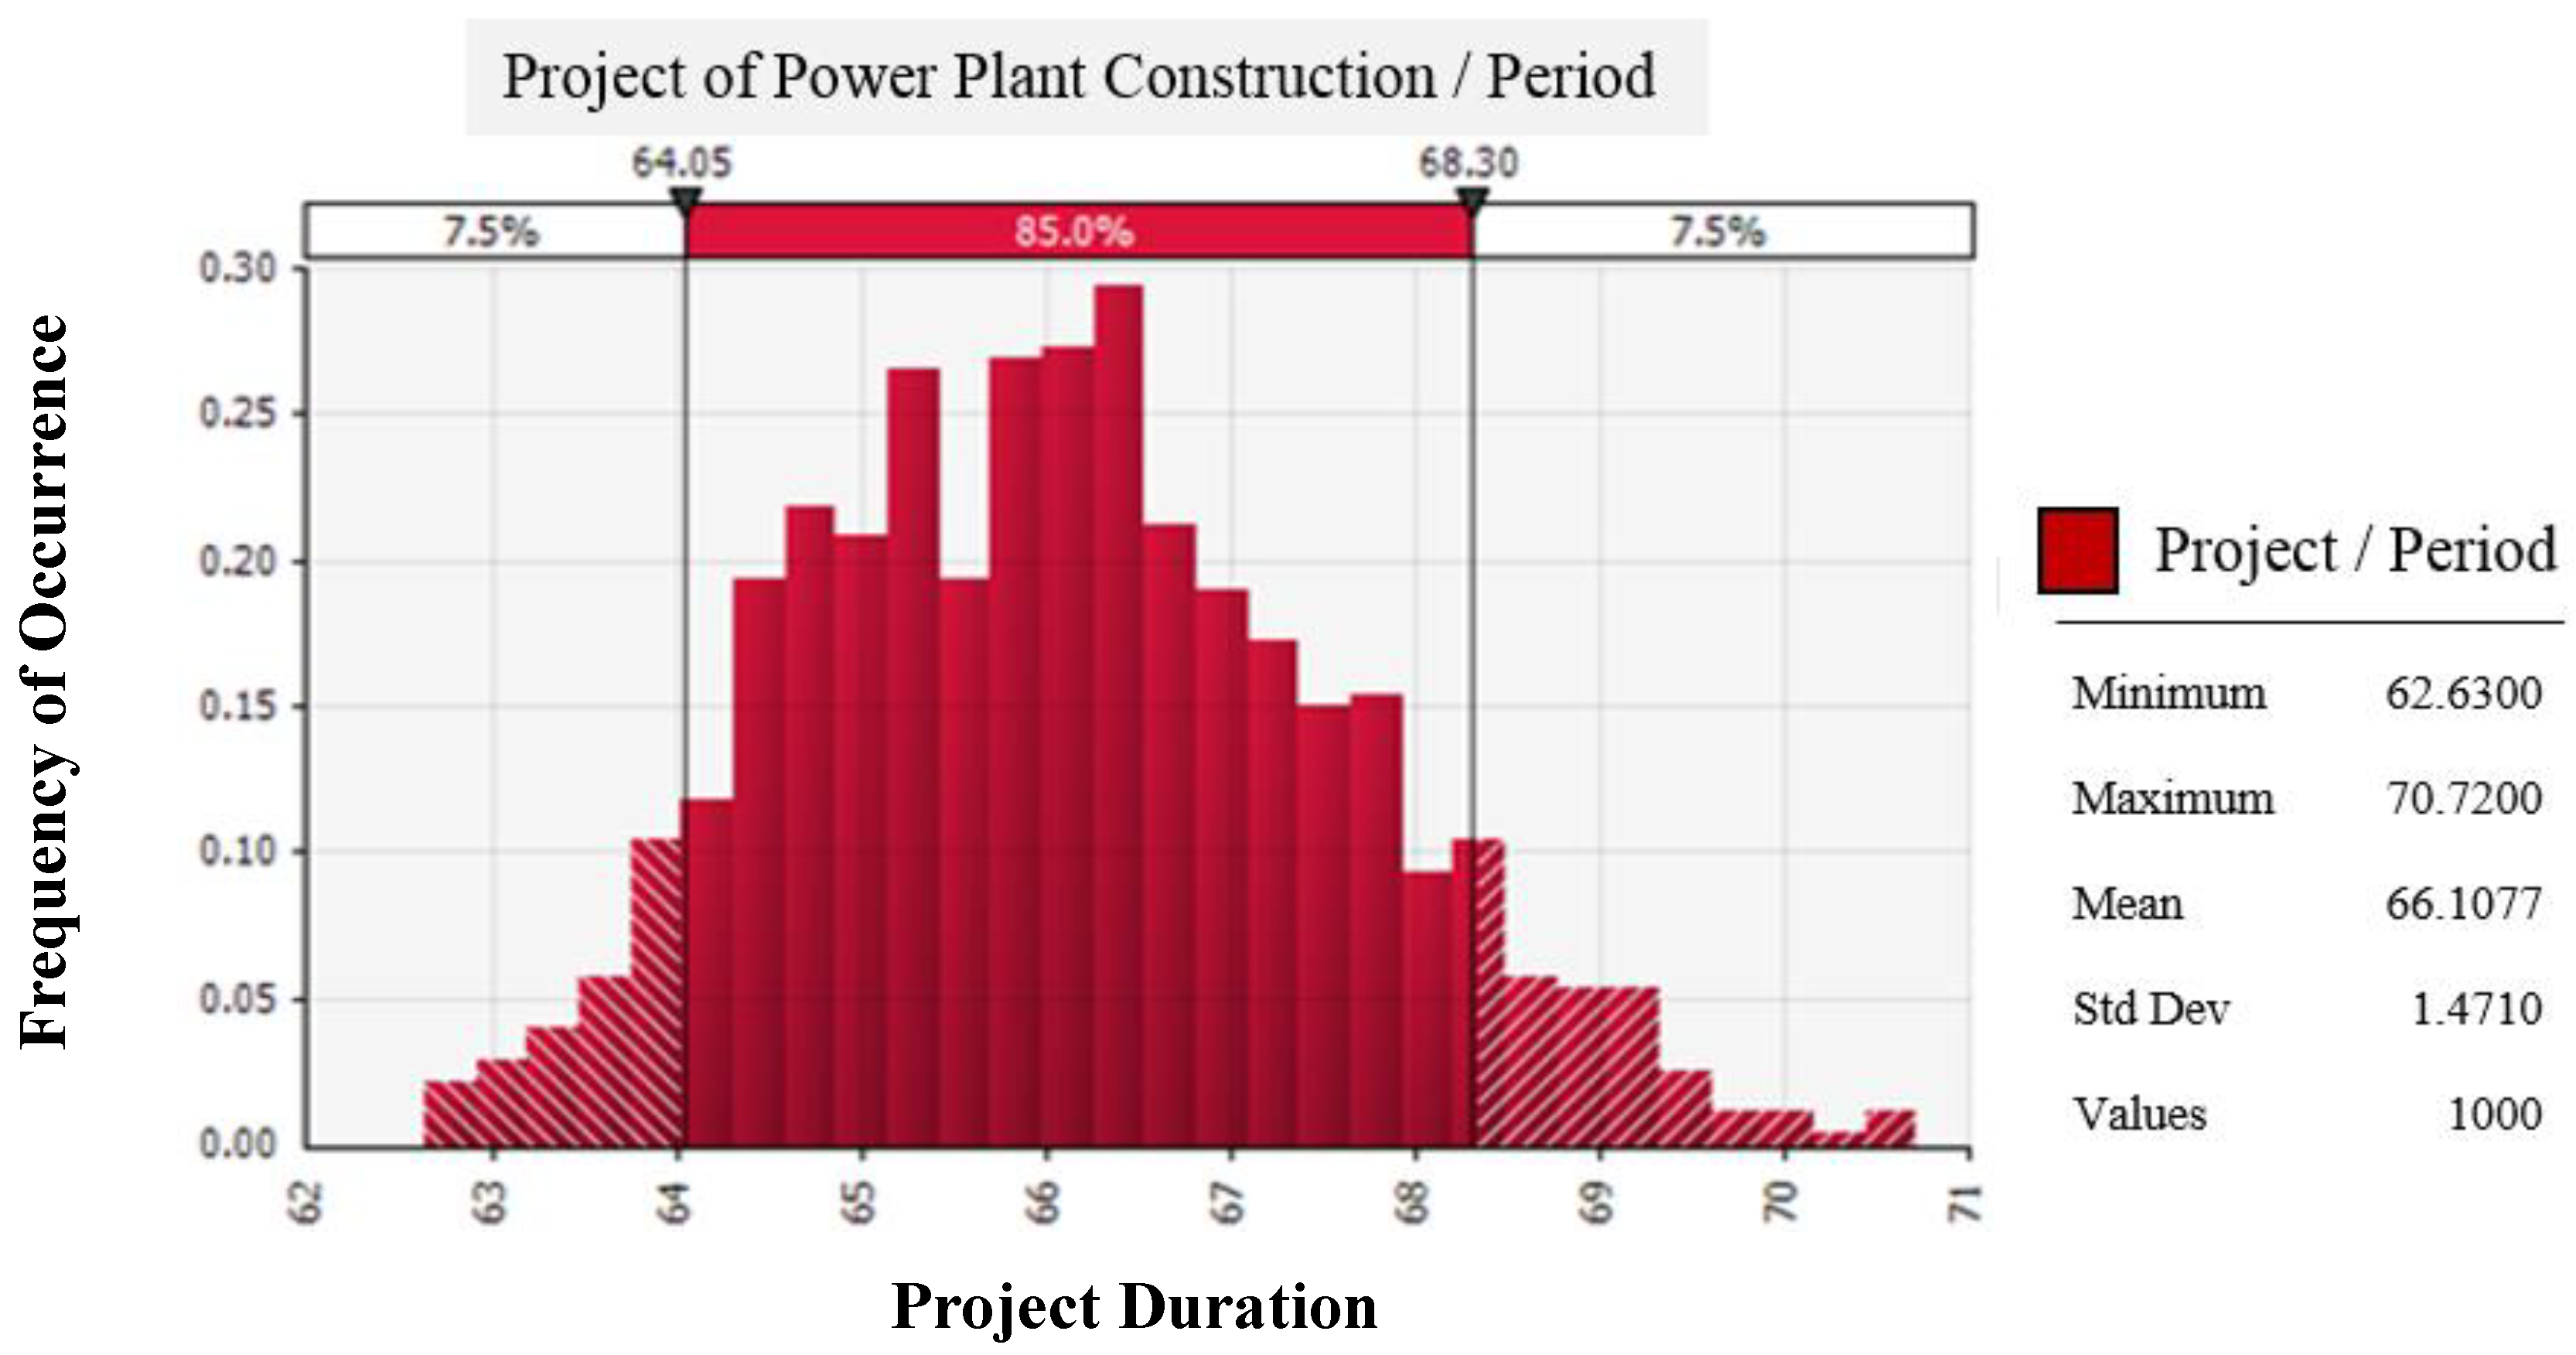
| Total duration (te) | 65 | |||||
| Critical path standard deviation (σcp) | 1.2 |
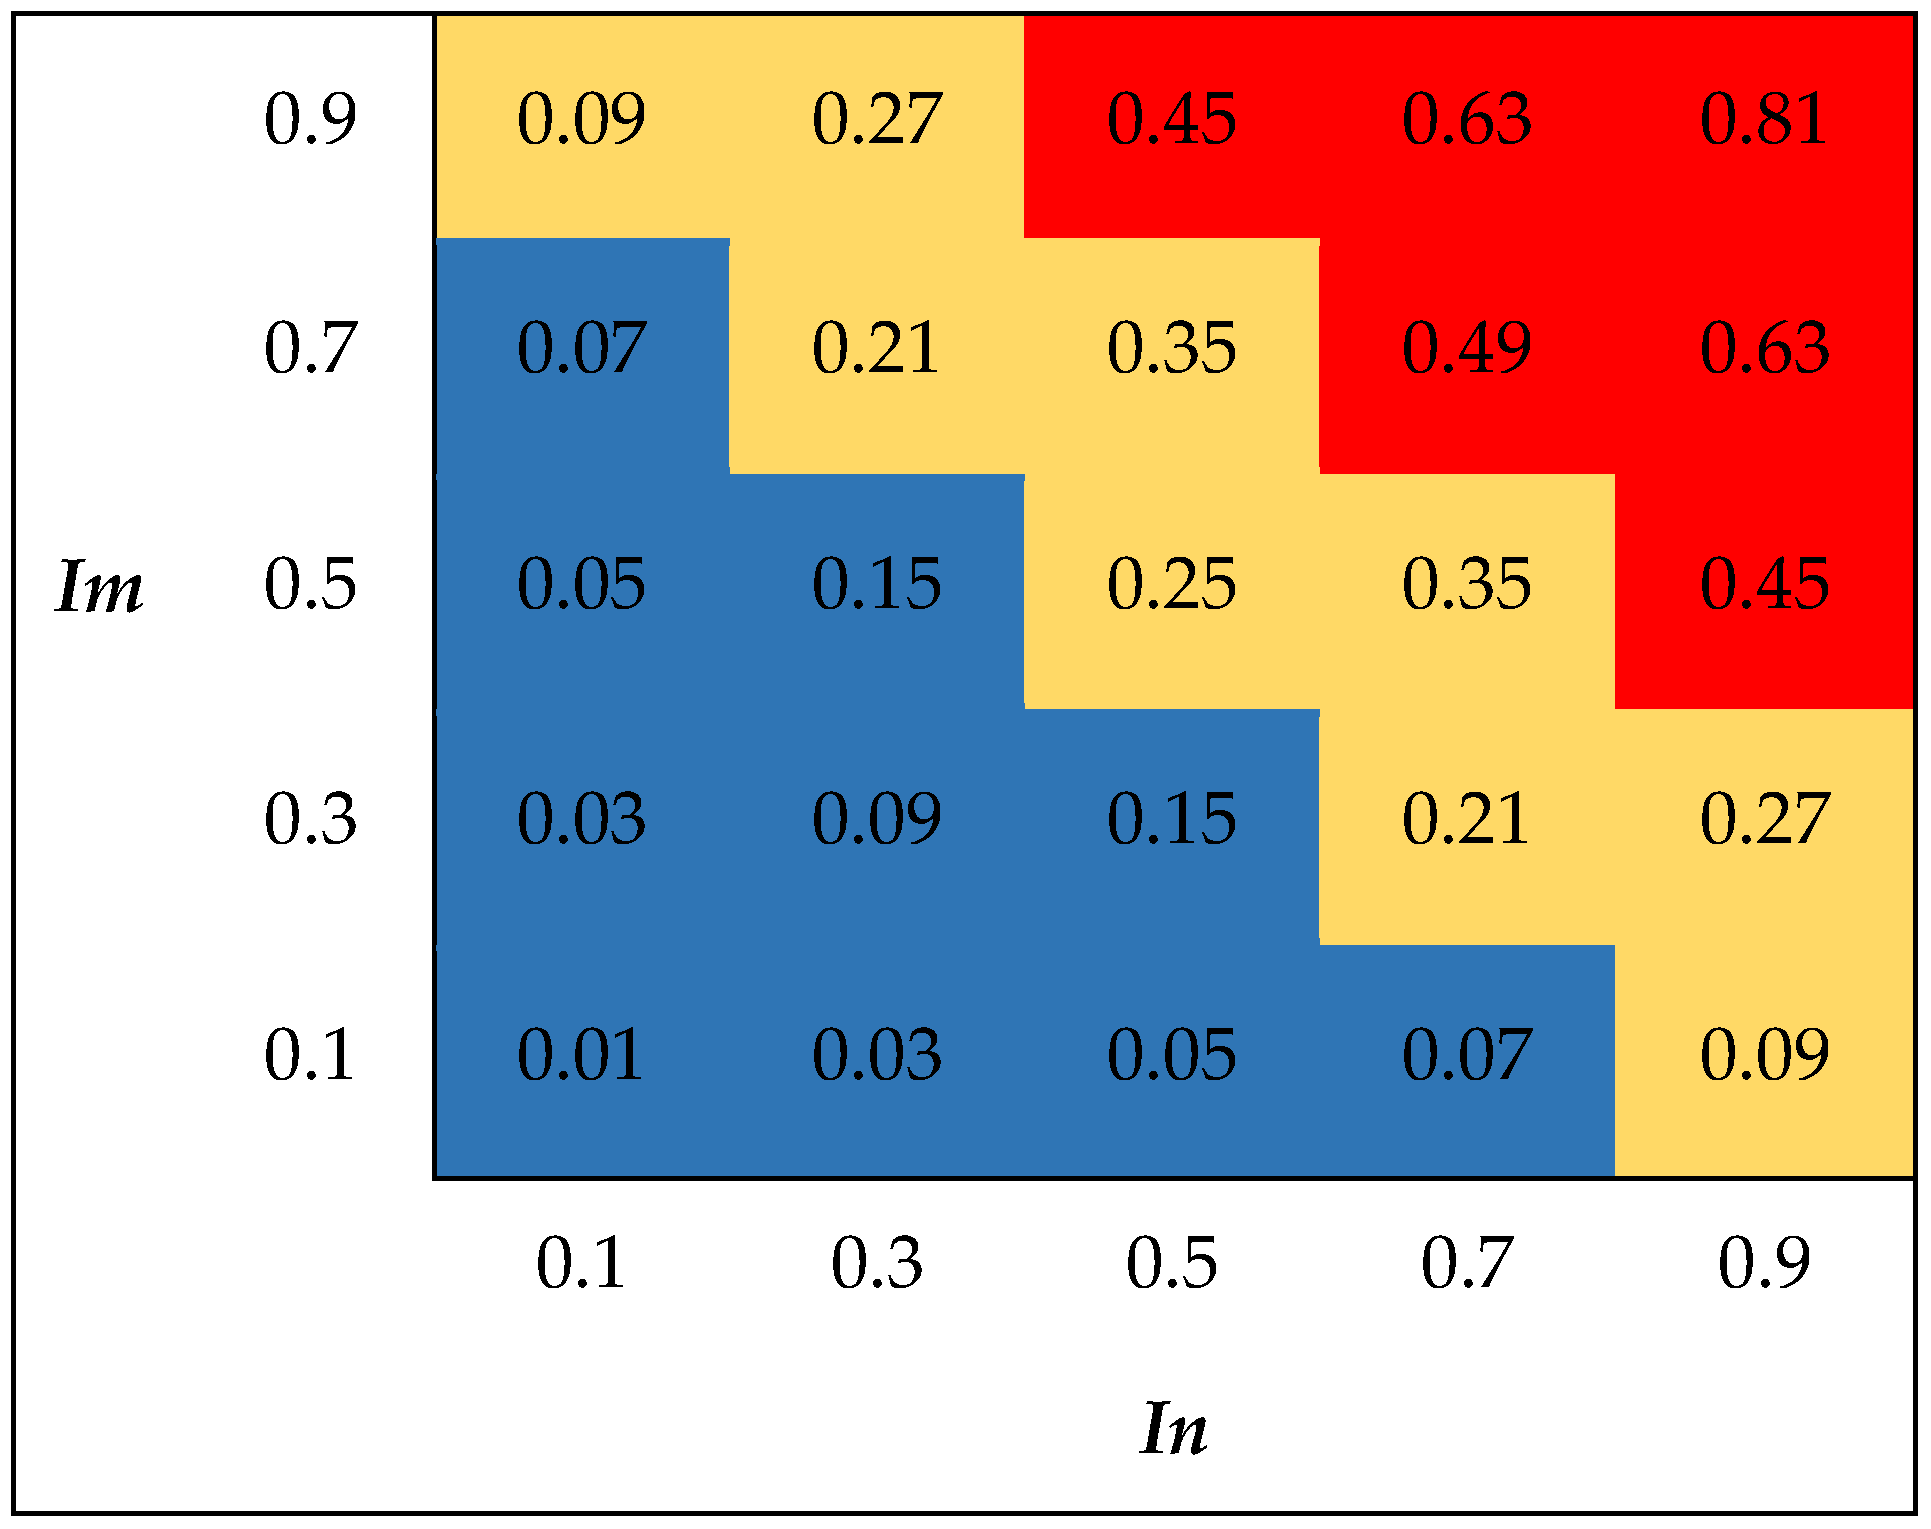
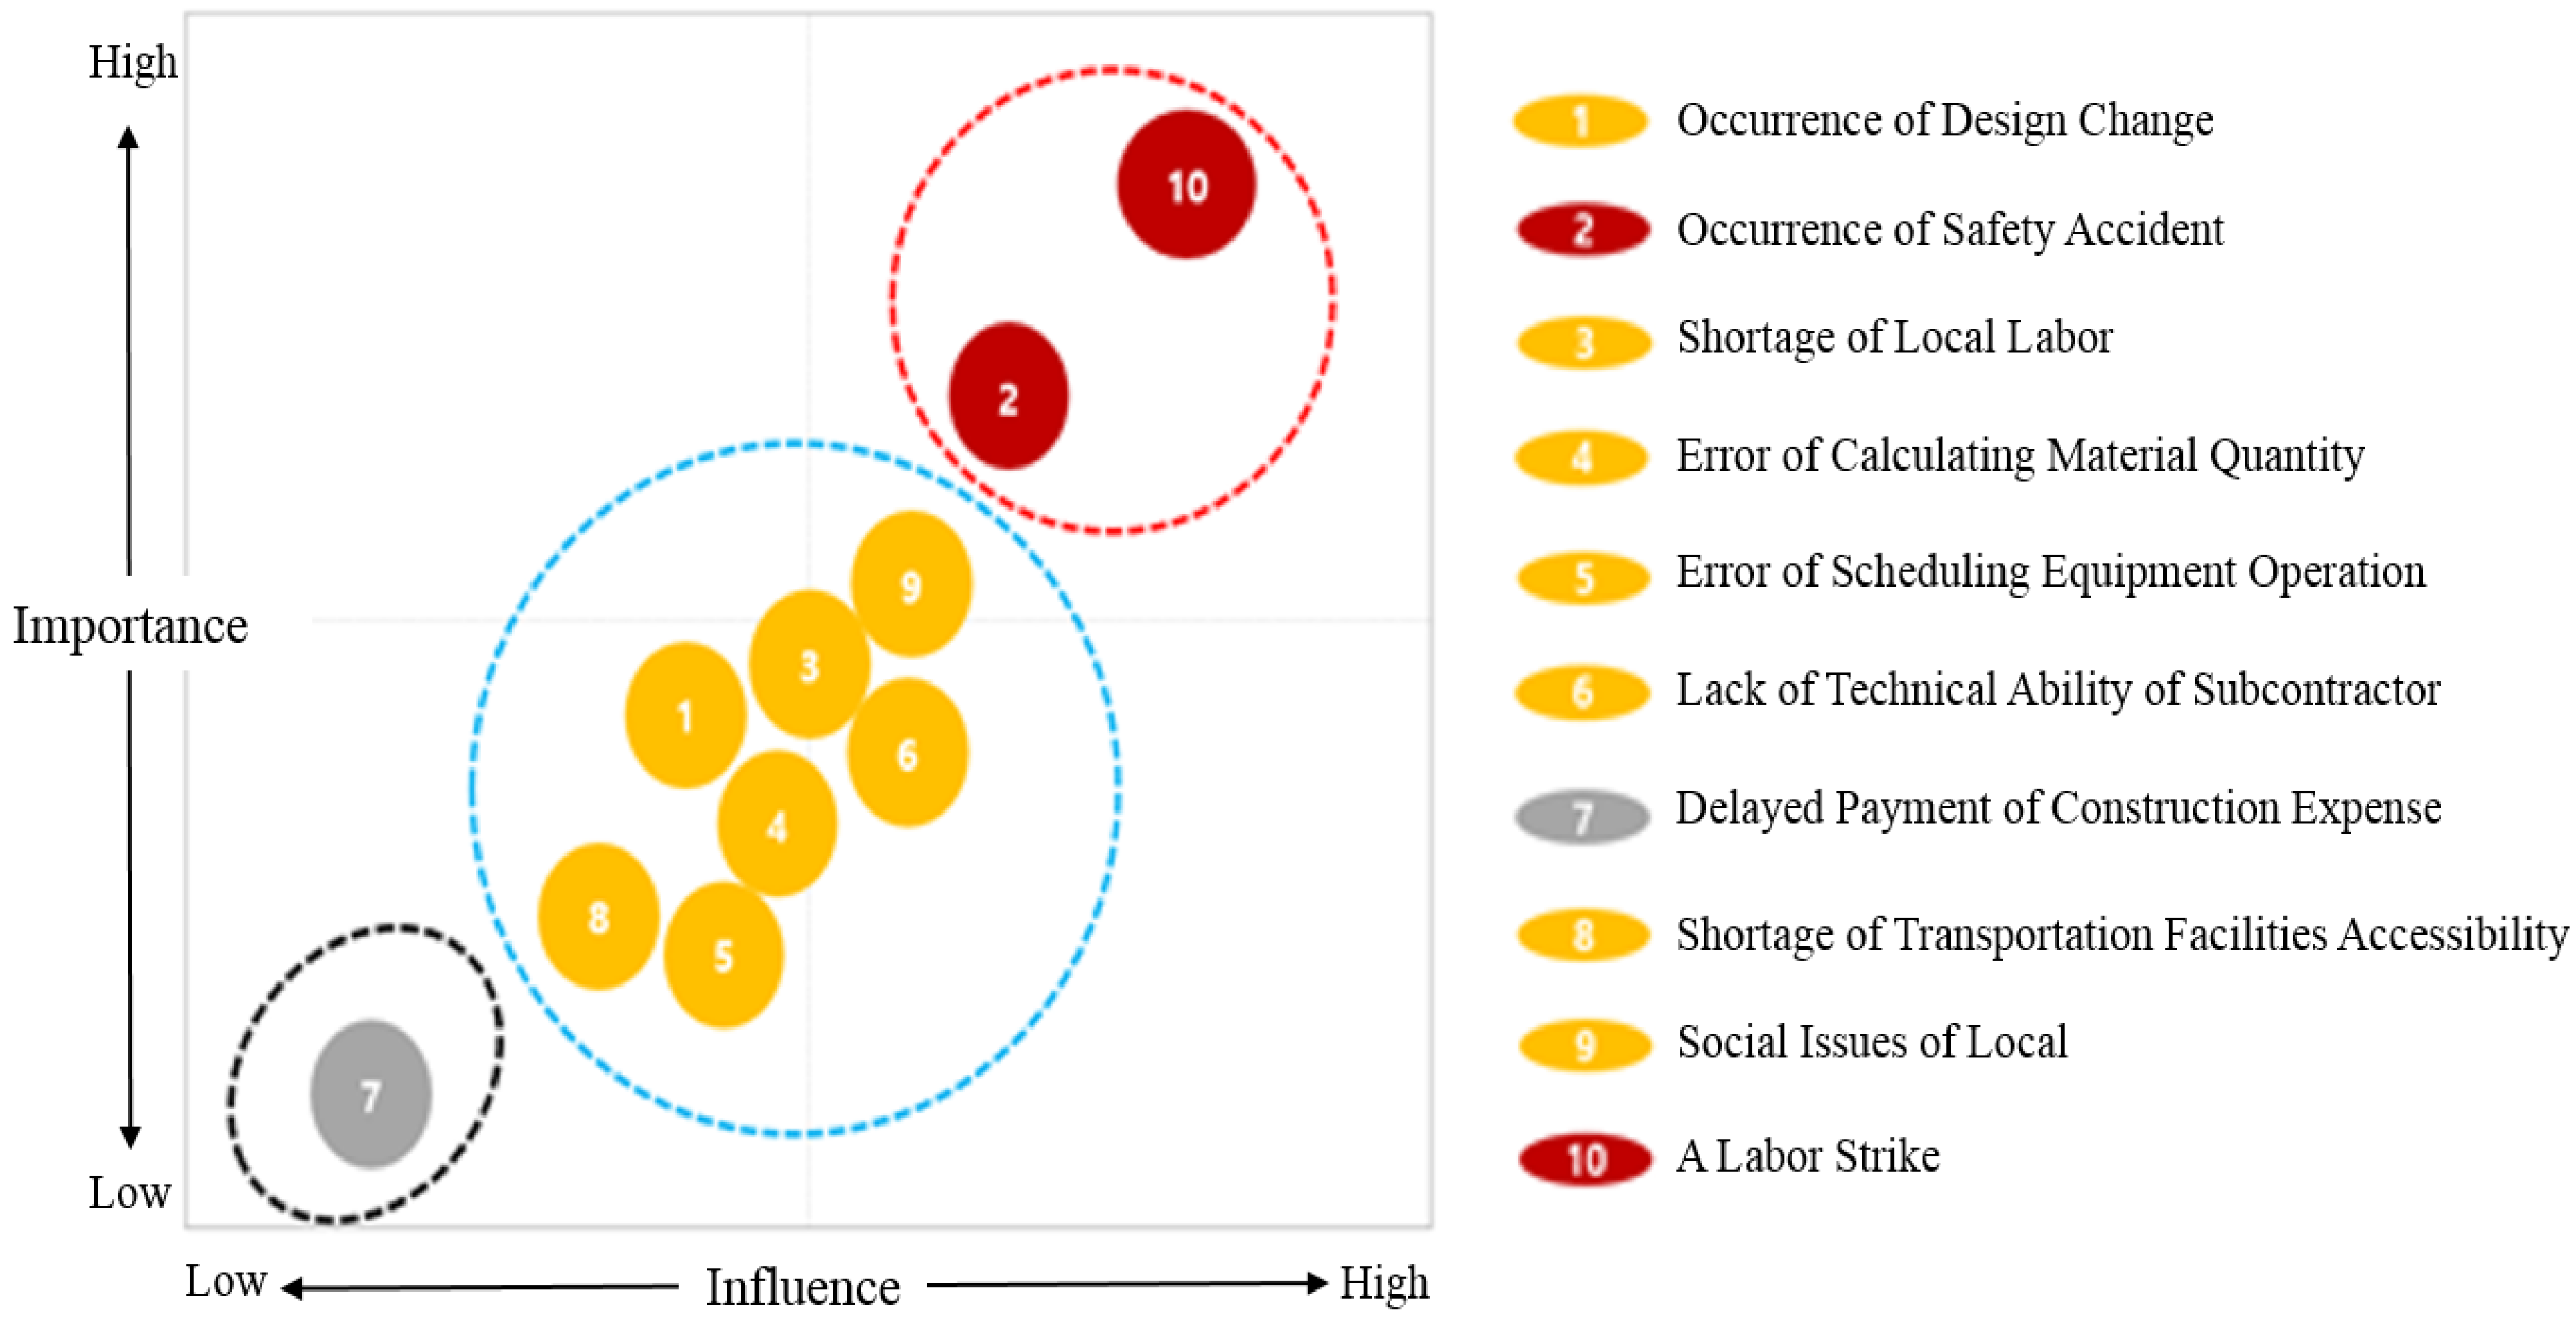
| Risk Factors | Importance | Influence | Risk Impact | Degree of Risk | Priority |
|---|---|---|---|---|---|
| A labor strike | 0.88 | 0.9 | 0.79 | High | 1 |
| Occurrence of safety accident | 0.76 | 0.7 | 0.53 | High | 2 |
| Social issues of local | 0.58 | 0.54 | 0.31 | Moderate | 3 |
| Shortage of local labor | 0.54 | 0.52 | 0.28 | Moderate | 4 |
| Lack of technical ability of subcontractor | 0.52 | 0.46 | 0.24 | Moderate | 5 |
| Occurrence of design change | 0.44 | 0.48 | 0.21 | Moderate | 6 |
| Error of scheduling equipment operation | 0.42 | 0.34 | 0.14 | Moderate | 7 |
| Error of calculating material quantity | 0.38 | 0.34 | 0.13 | Moderate | 8 |
| Shortage of transportation facilities accessibility | 0.38 | 0.32 | 0.12 | Moderate | 9 |
| Delayed payment of construction expense | 0.3 | 0.3 | 0.09 | Low | 10 |
© 2018 by the authors. Licensee MDPI, Basel, Switzerland. This article is an open access article distributed under the terms and conditions of the Creative Commons Attribution (CC BY) license (http://creativecommons.org/licenses/by/4.0/).
Share and Cite
Lee, H.-C.; Lee, E.-B.; Alleman, D. Schedule Modeling to Estimate Typical Construction Durations and Areas of Risk for 1000 MW Ultra-Critical Coal-Fired Power Plants. Energies 2018, 11, 2850. https://doi.org/10.3390/en11102850
Lee H-C, Lee E-B, Alleman D. Schedule Modeling to Estimate Typical Construction Durations and Areas of Risk for 1000 MW Ultra-Critical Coal-Fired Power Plants. Energies. 2018; 11(10):2850. https://doi.org/10.3390/en11102850
Chicago/Turabian StyleLee, Hyun-Chul, Eul-Bum Lee, and Douglas Alleman. 2018. "Schedule Modeling to Estimate Typical Construction Durations and Areas of Risk for 1000 MW Ultra-Critical Coal-Fired Power Plants" Energies 11, no. 10: 2850. https://doi.org/10.3390/en11102850
APA StyleLee, H.-C., Lee, E.-B., & Alleman, D. (2018). Schedule Modeling to Estimate Typical Construction Durations and Areas of Risk for 1000 MW Ultra-Critical Coal-Fired Power Plants. Energies, 11(10), 2850. https://doi.org/10.3390/en11102850