Monitoring Data Study of the Performance of Renewable Energy Systems in a Near Zero Energy Building in Spain: A Case Study

 ,
,  , , , and
Abstract
:1. Introduction
2. Case Study
2.1. Renewable Energies Implemented in the LUCIA nZEB
2.2. Monitoring Data
3. Results and Discussion
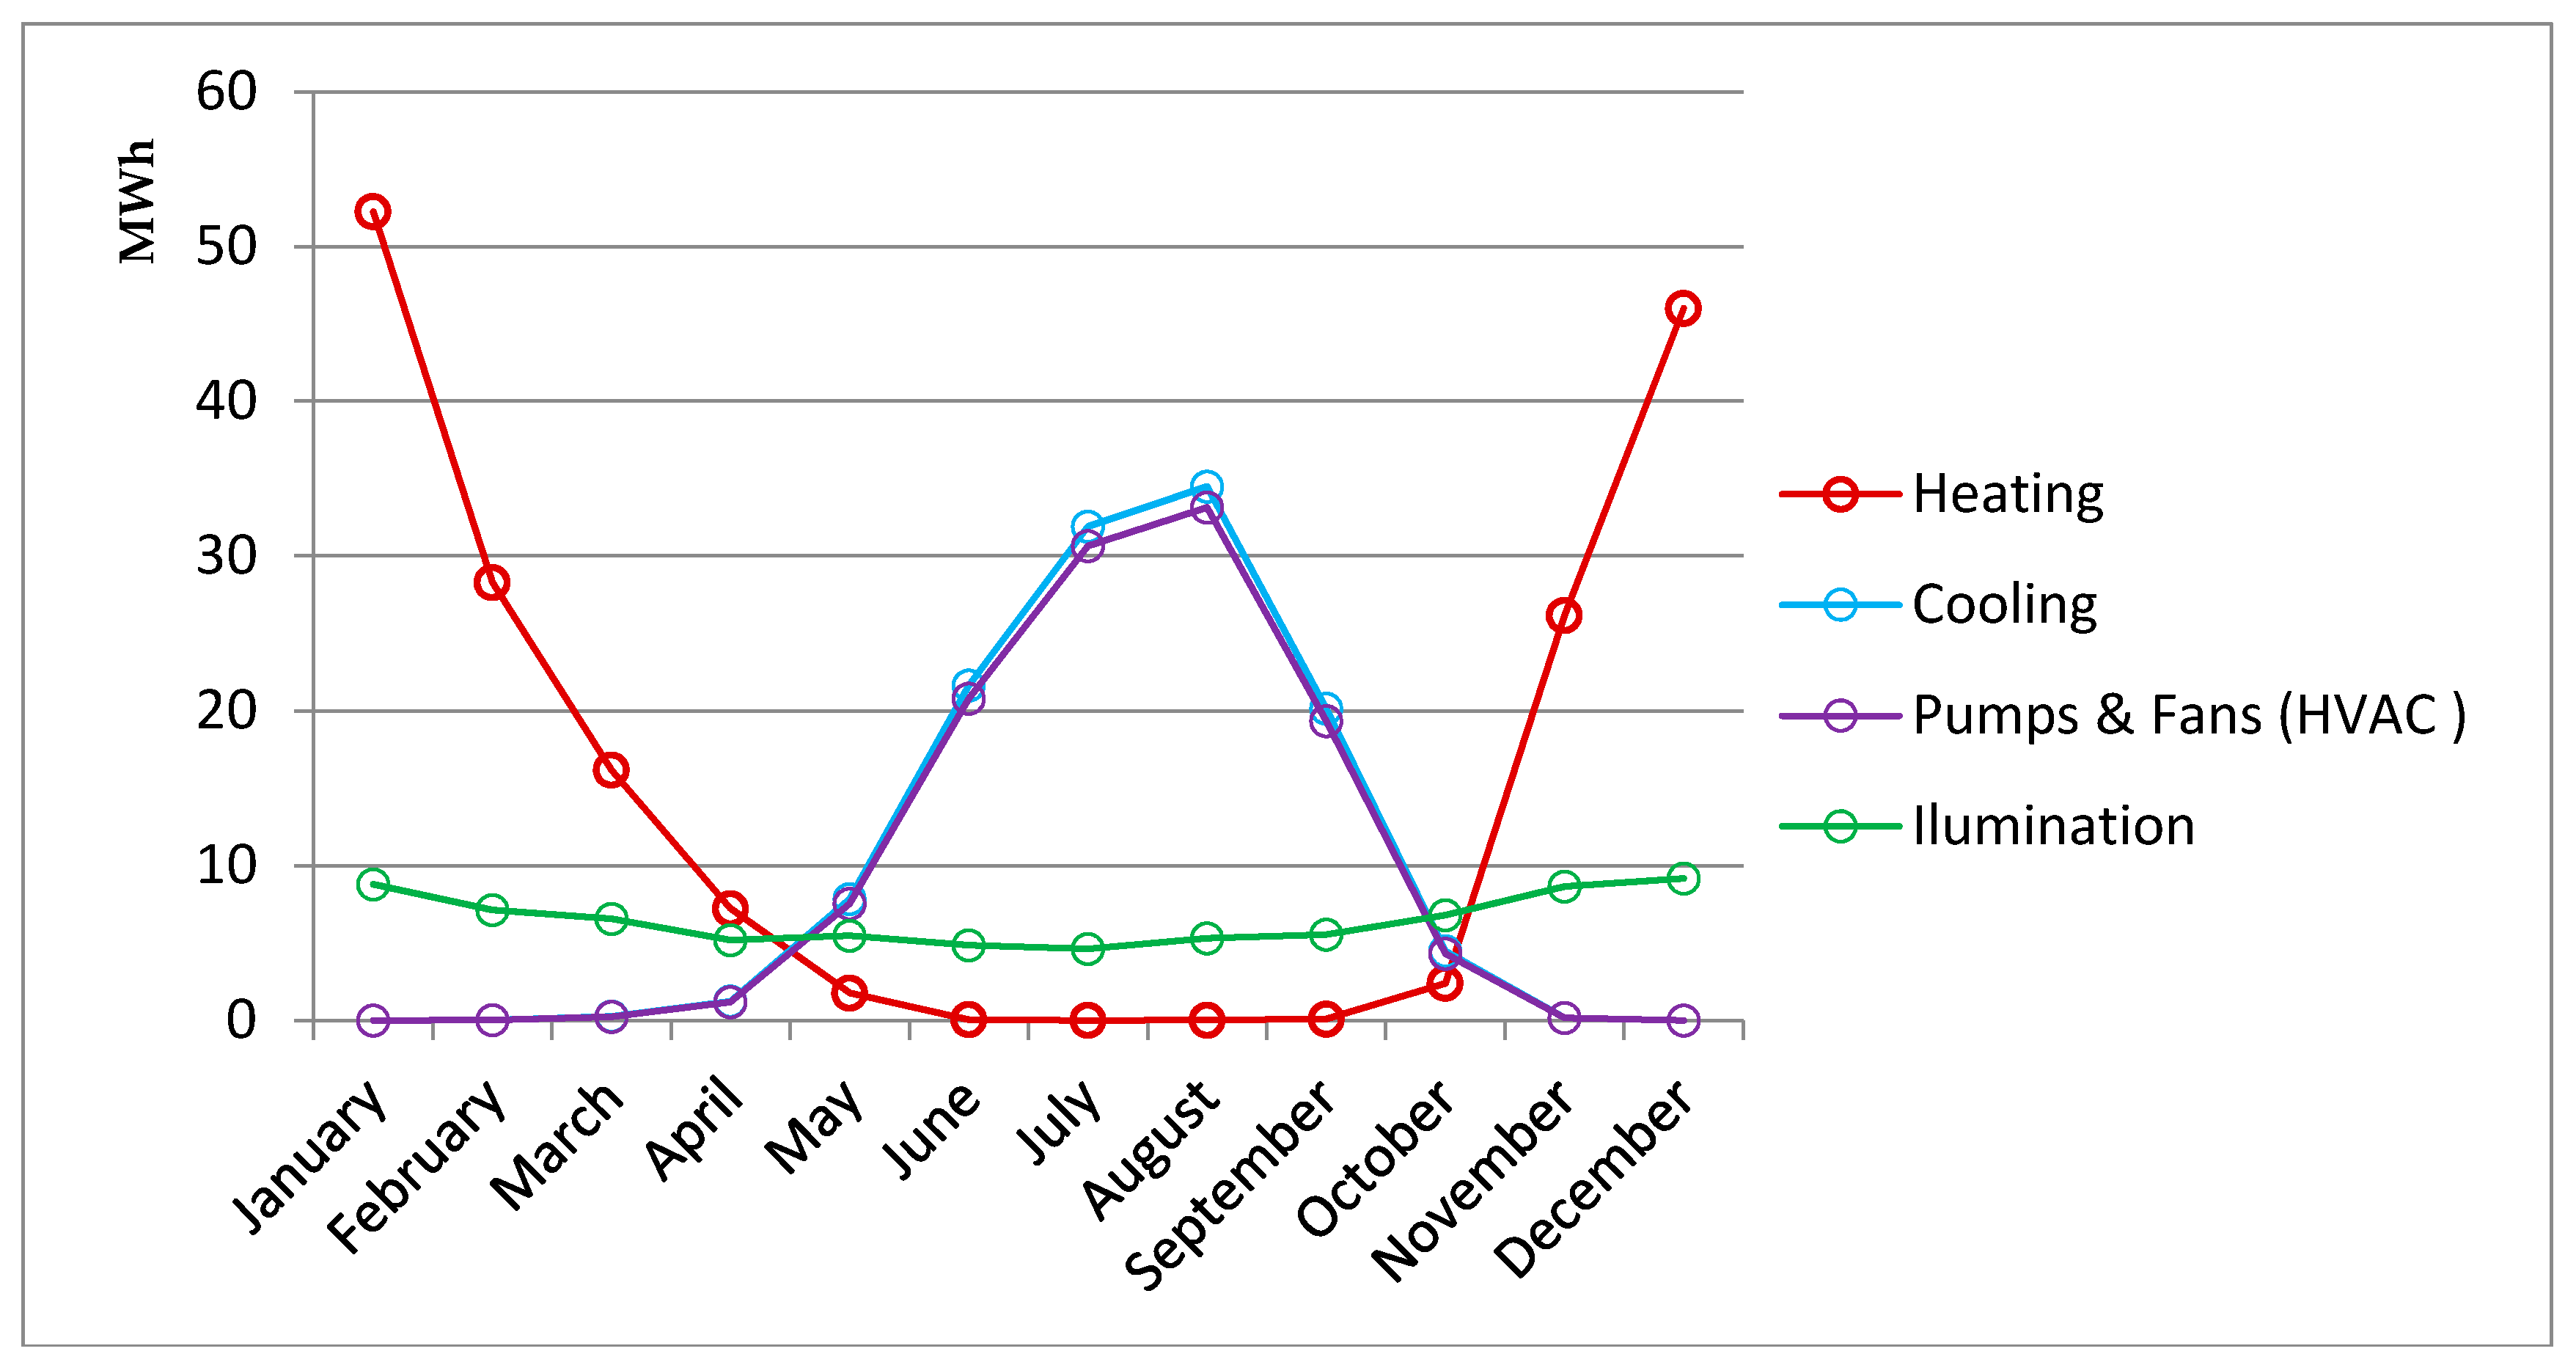
3.1. Energy Consumption
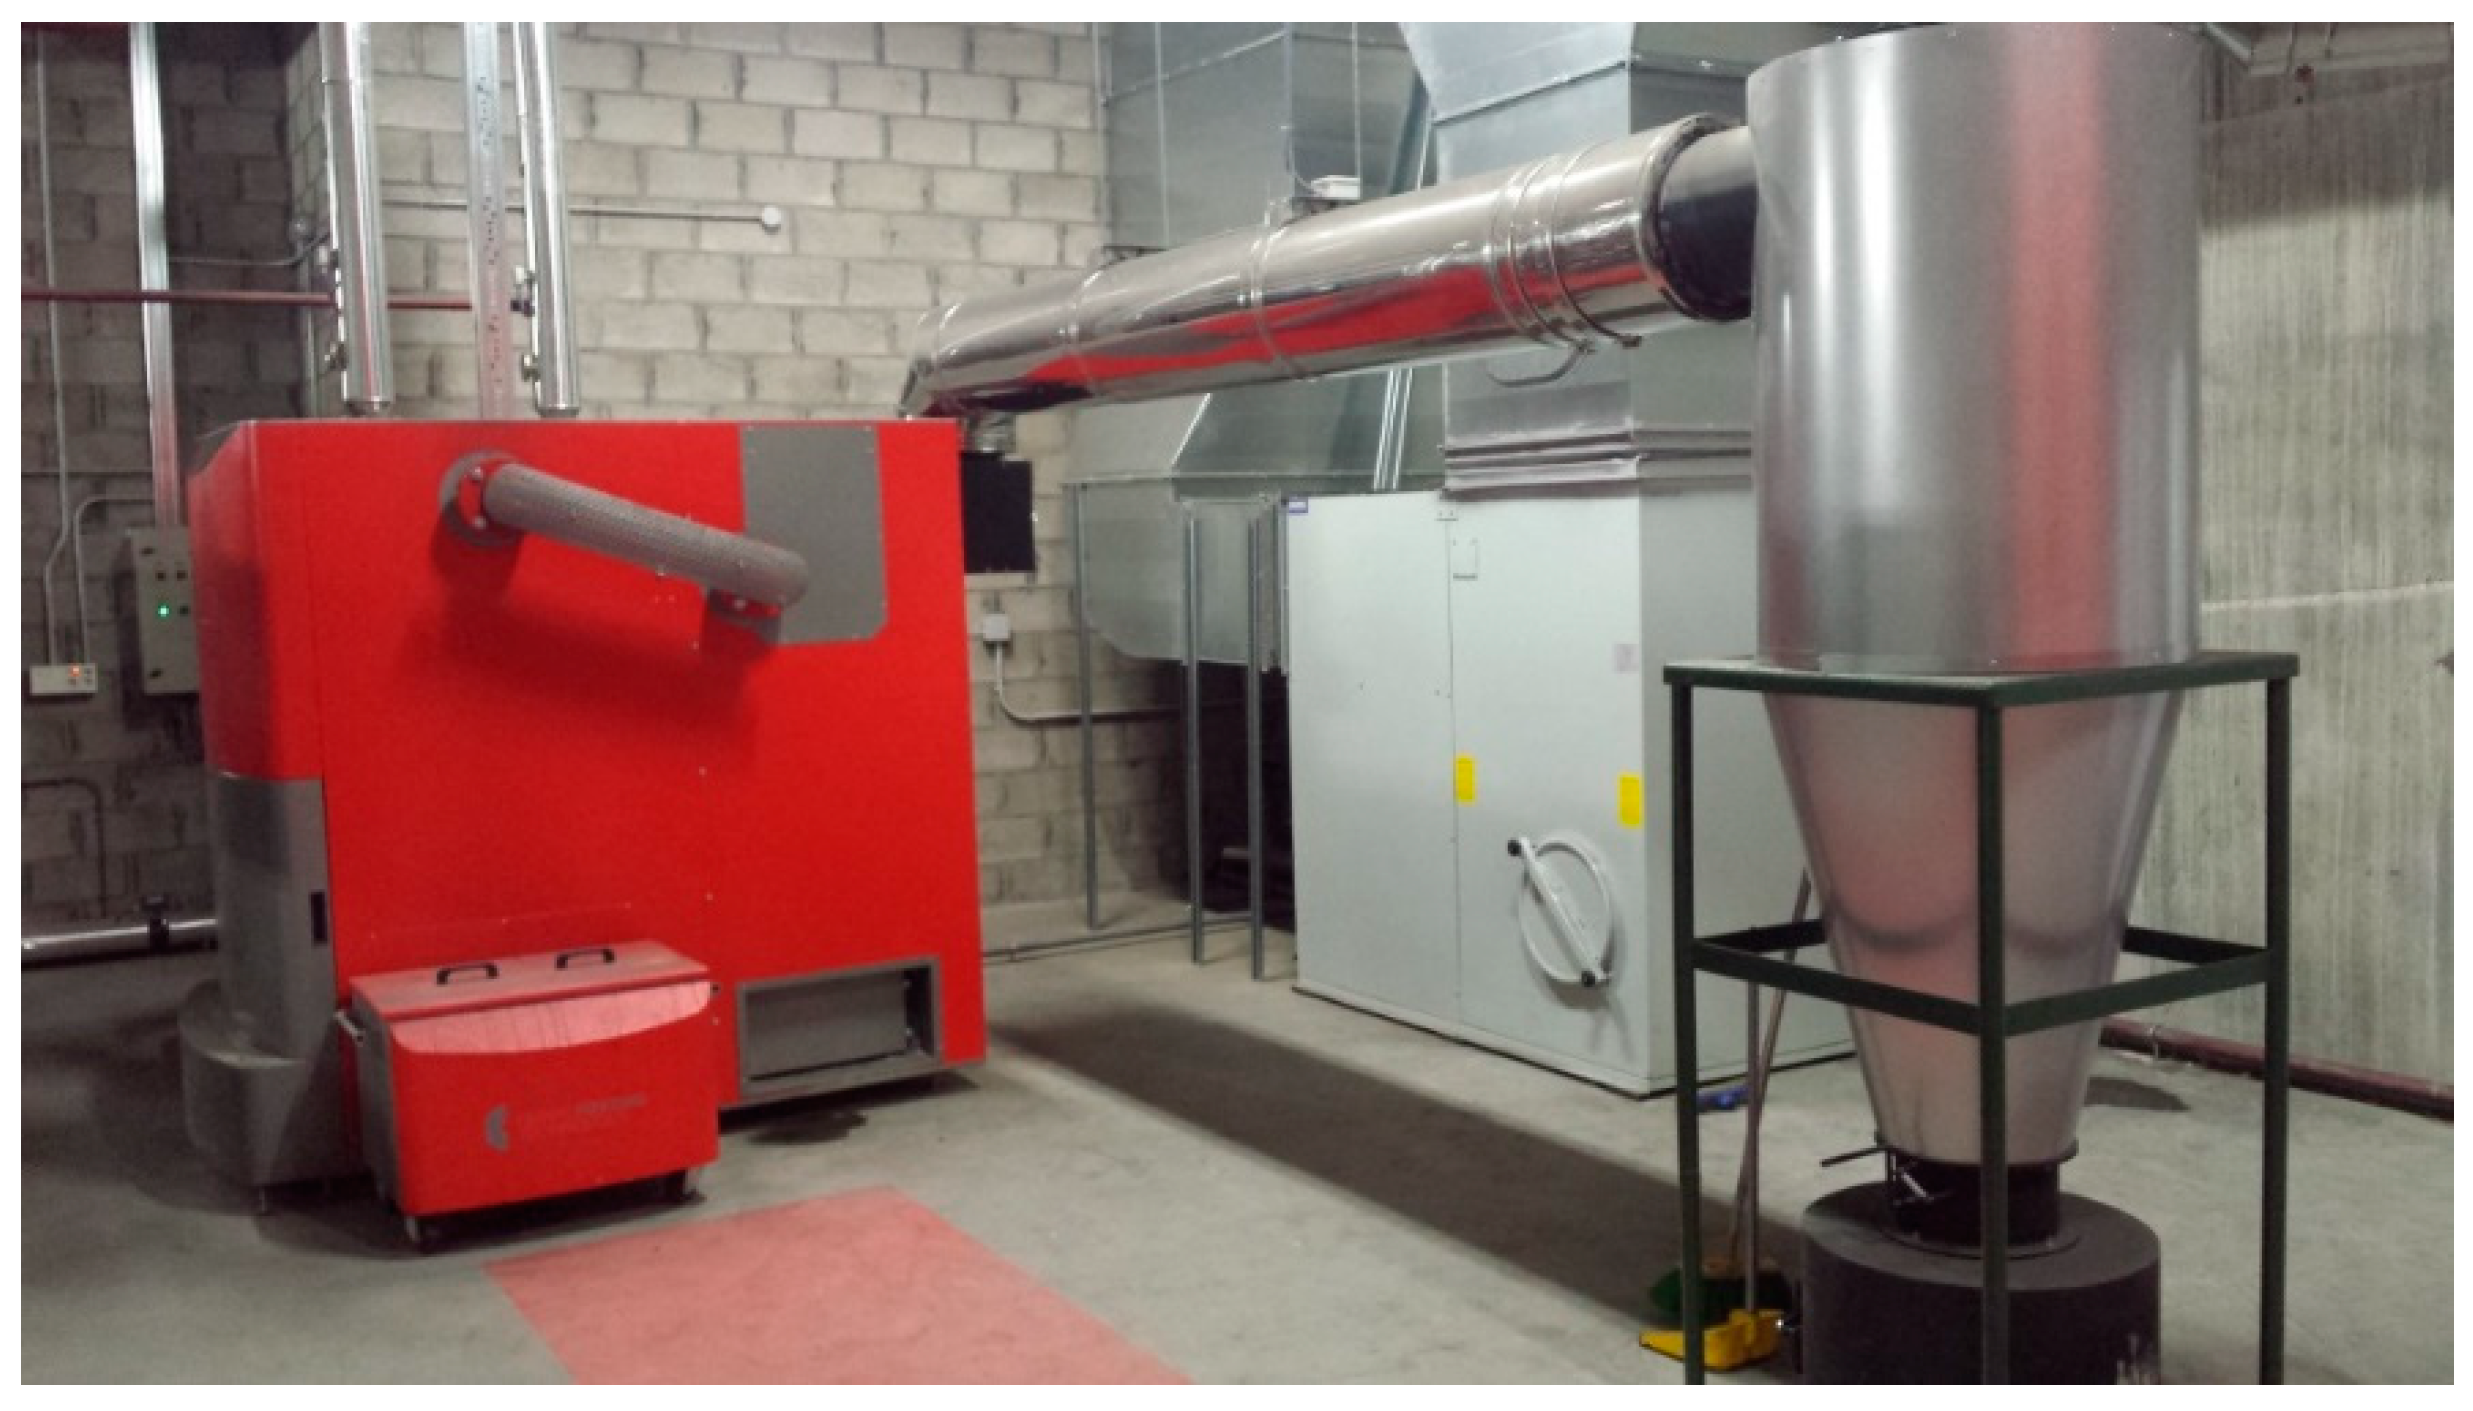
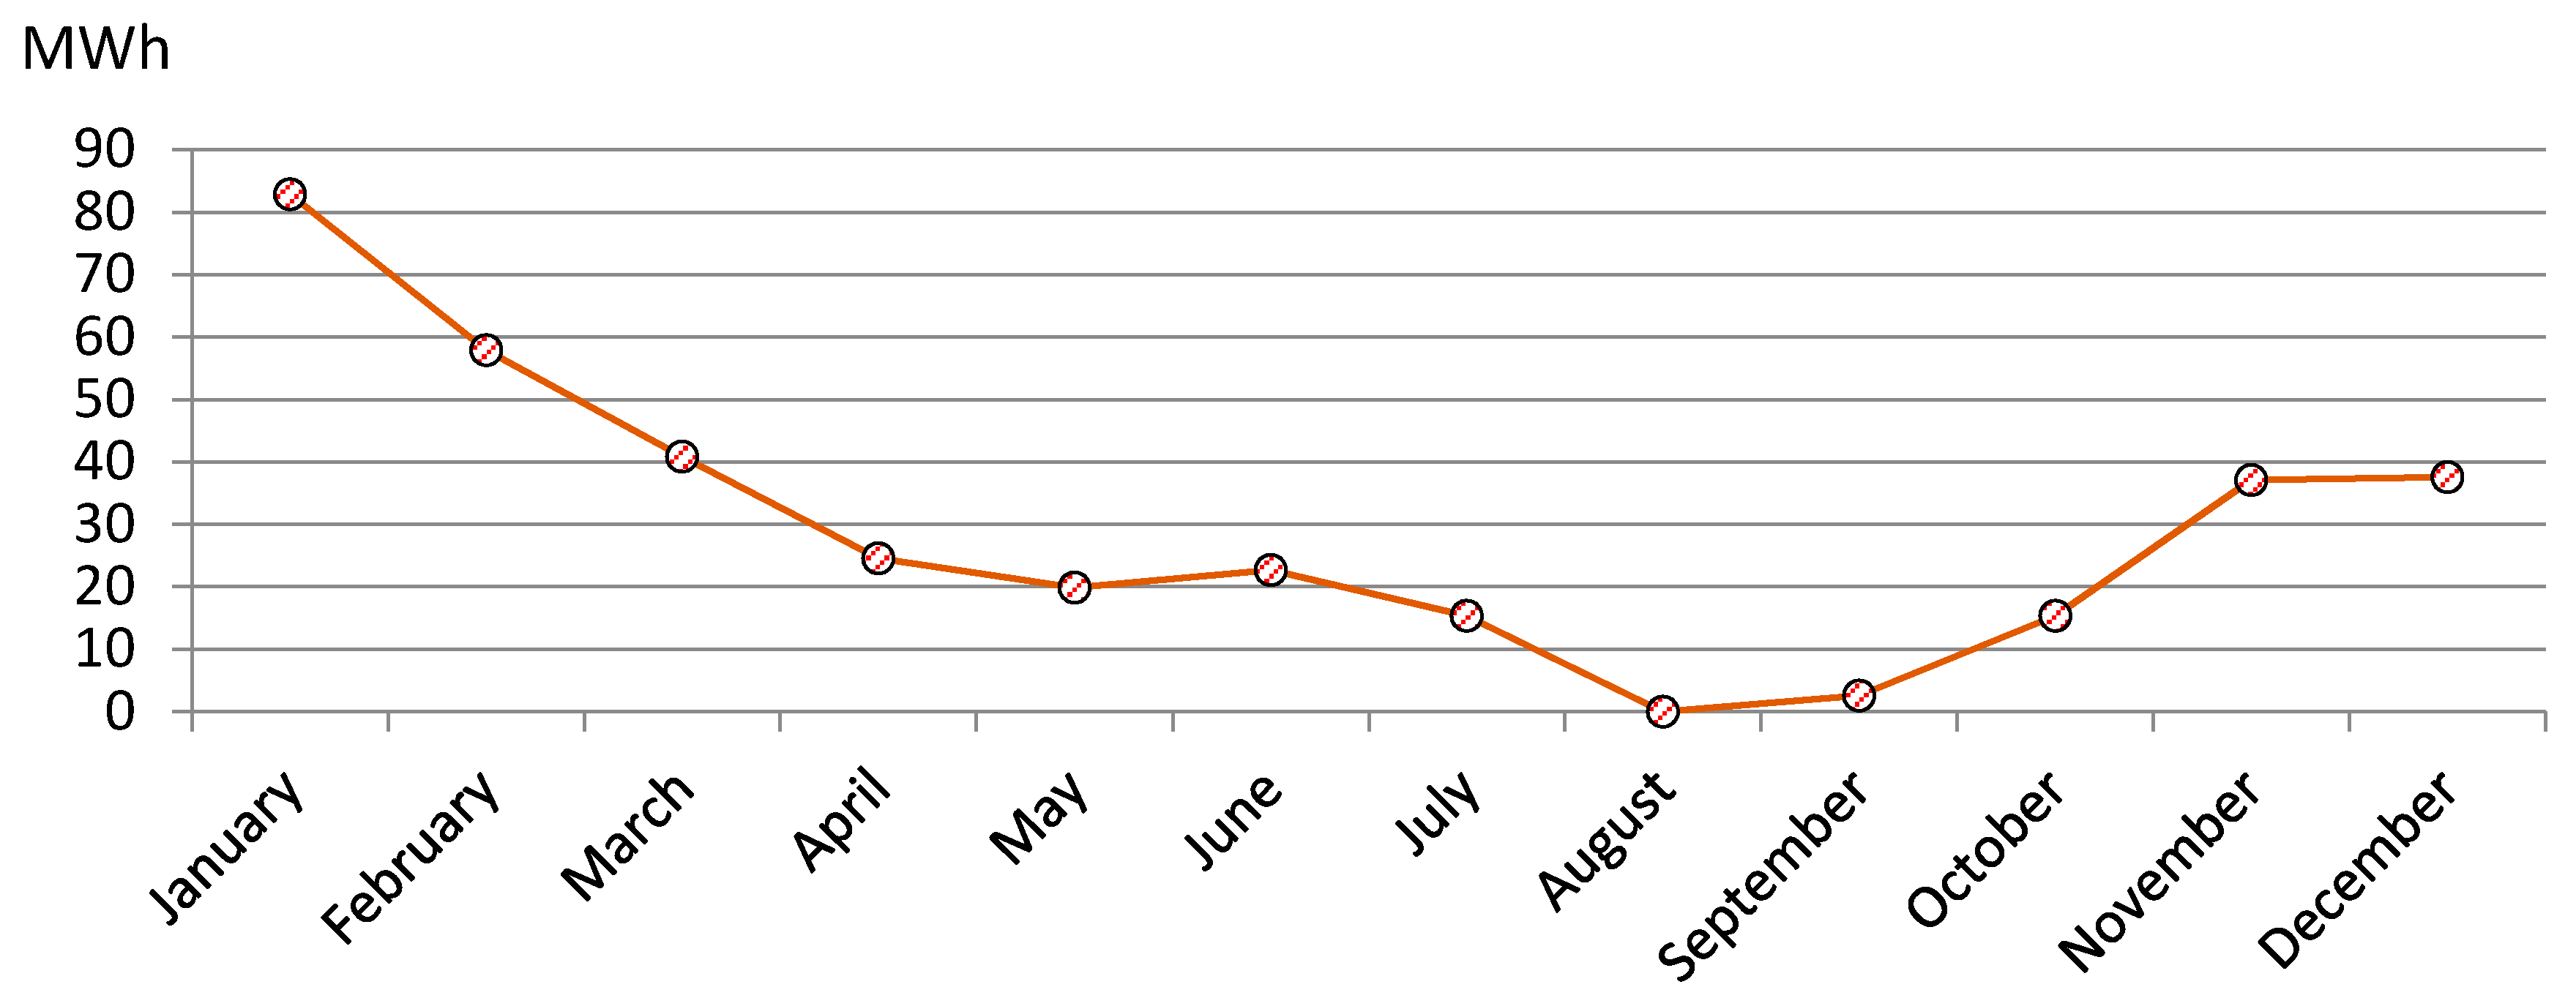
3.2. Biomass
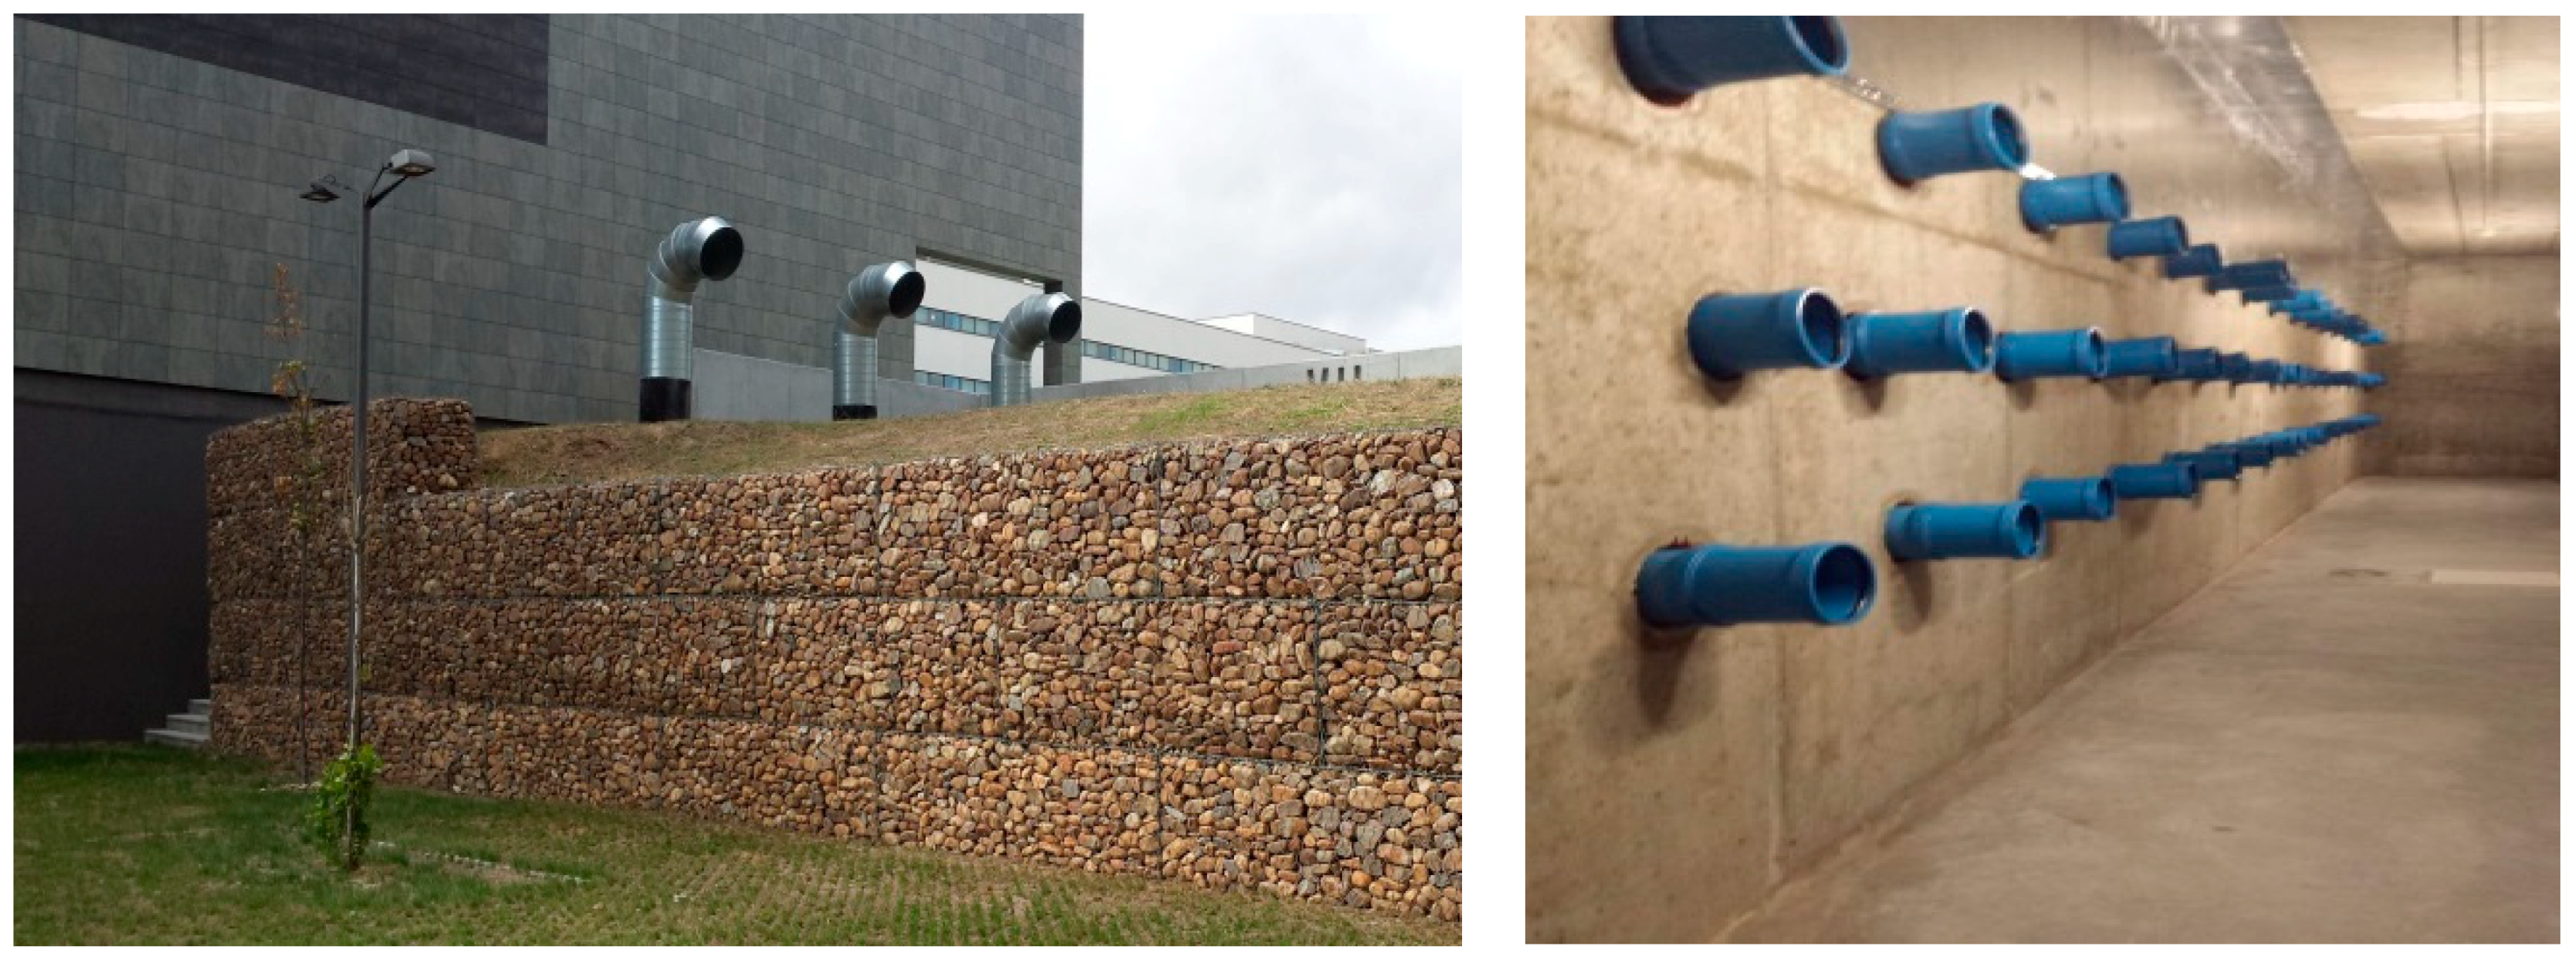
3.3. Earth to Air Heat Exchanger (EAHX)
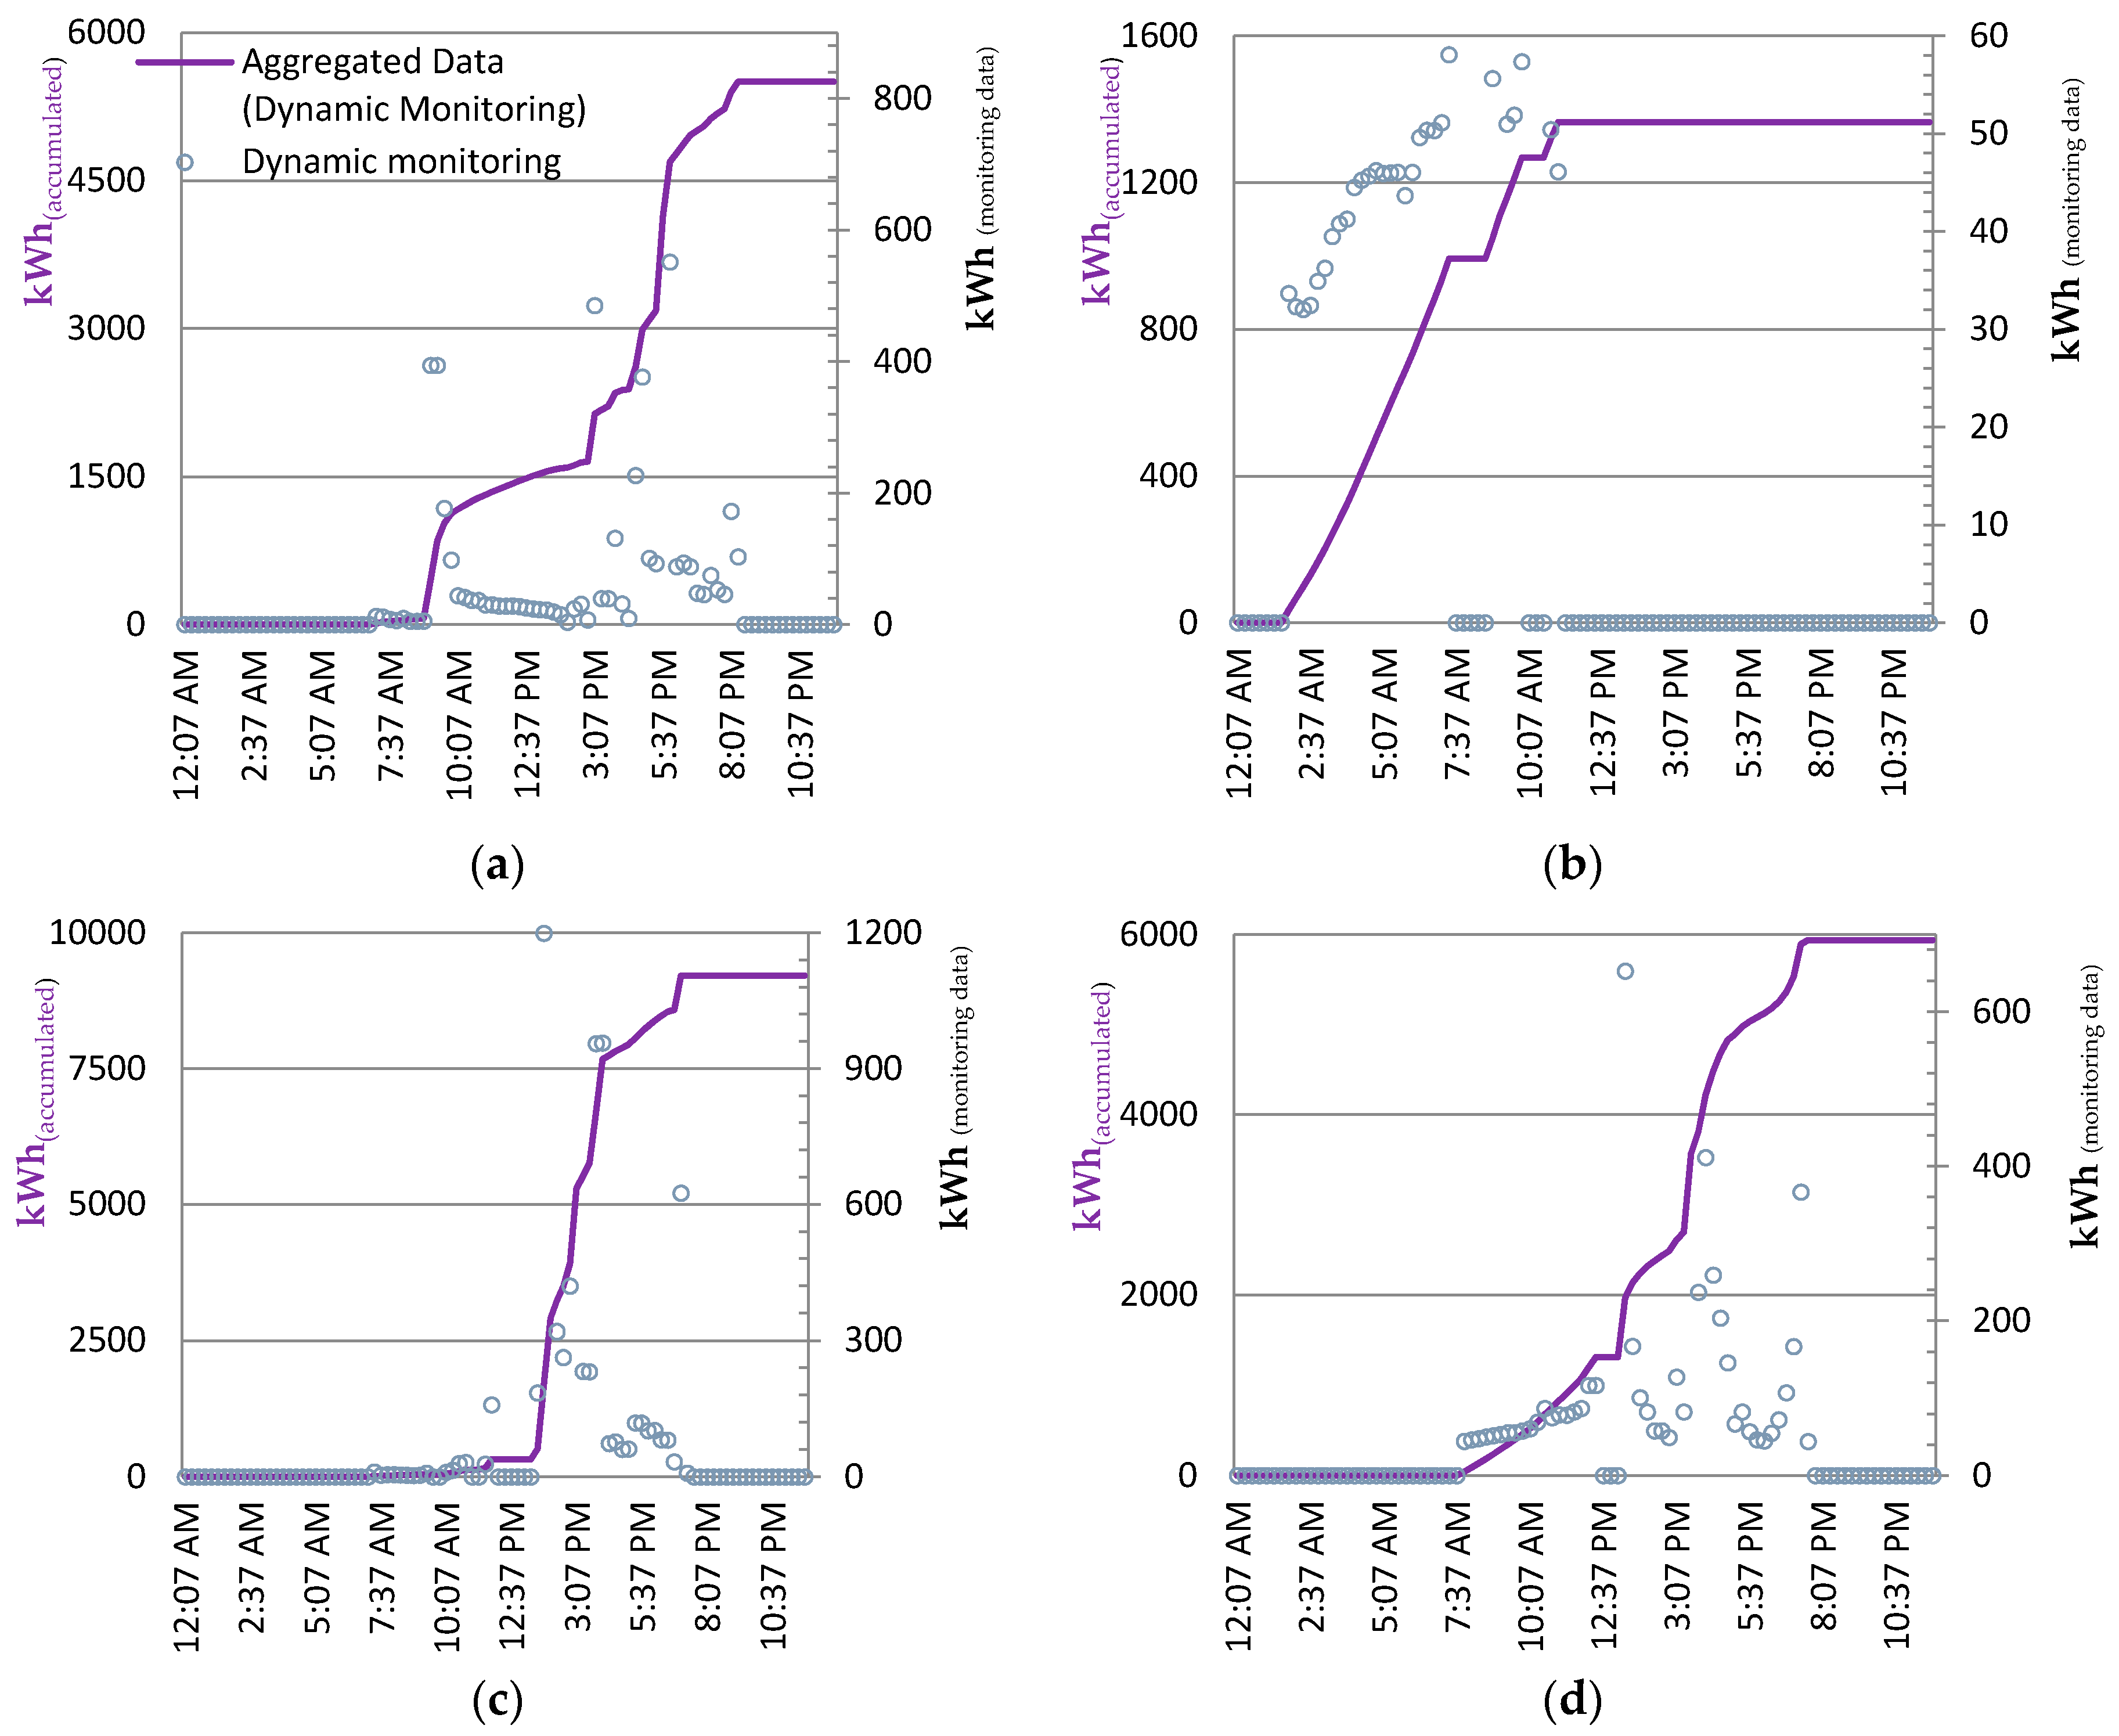
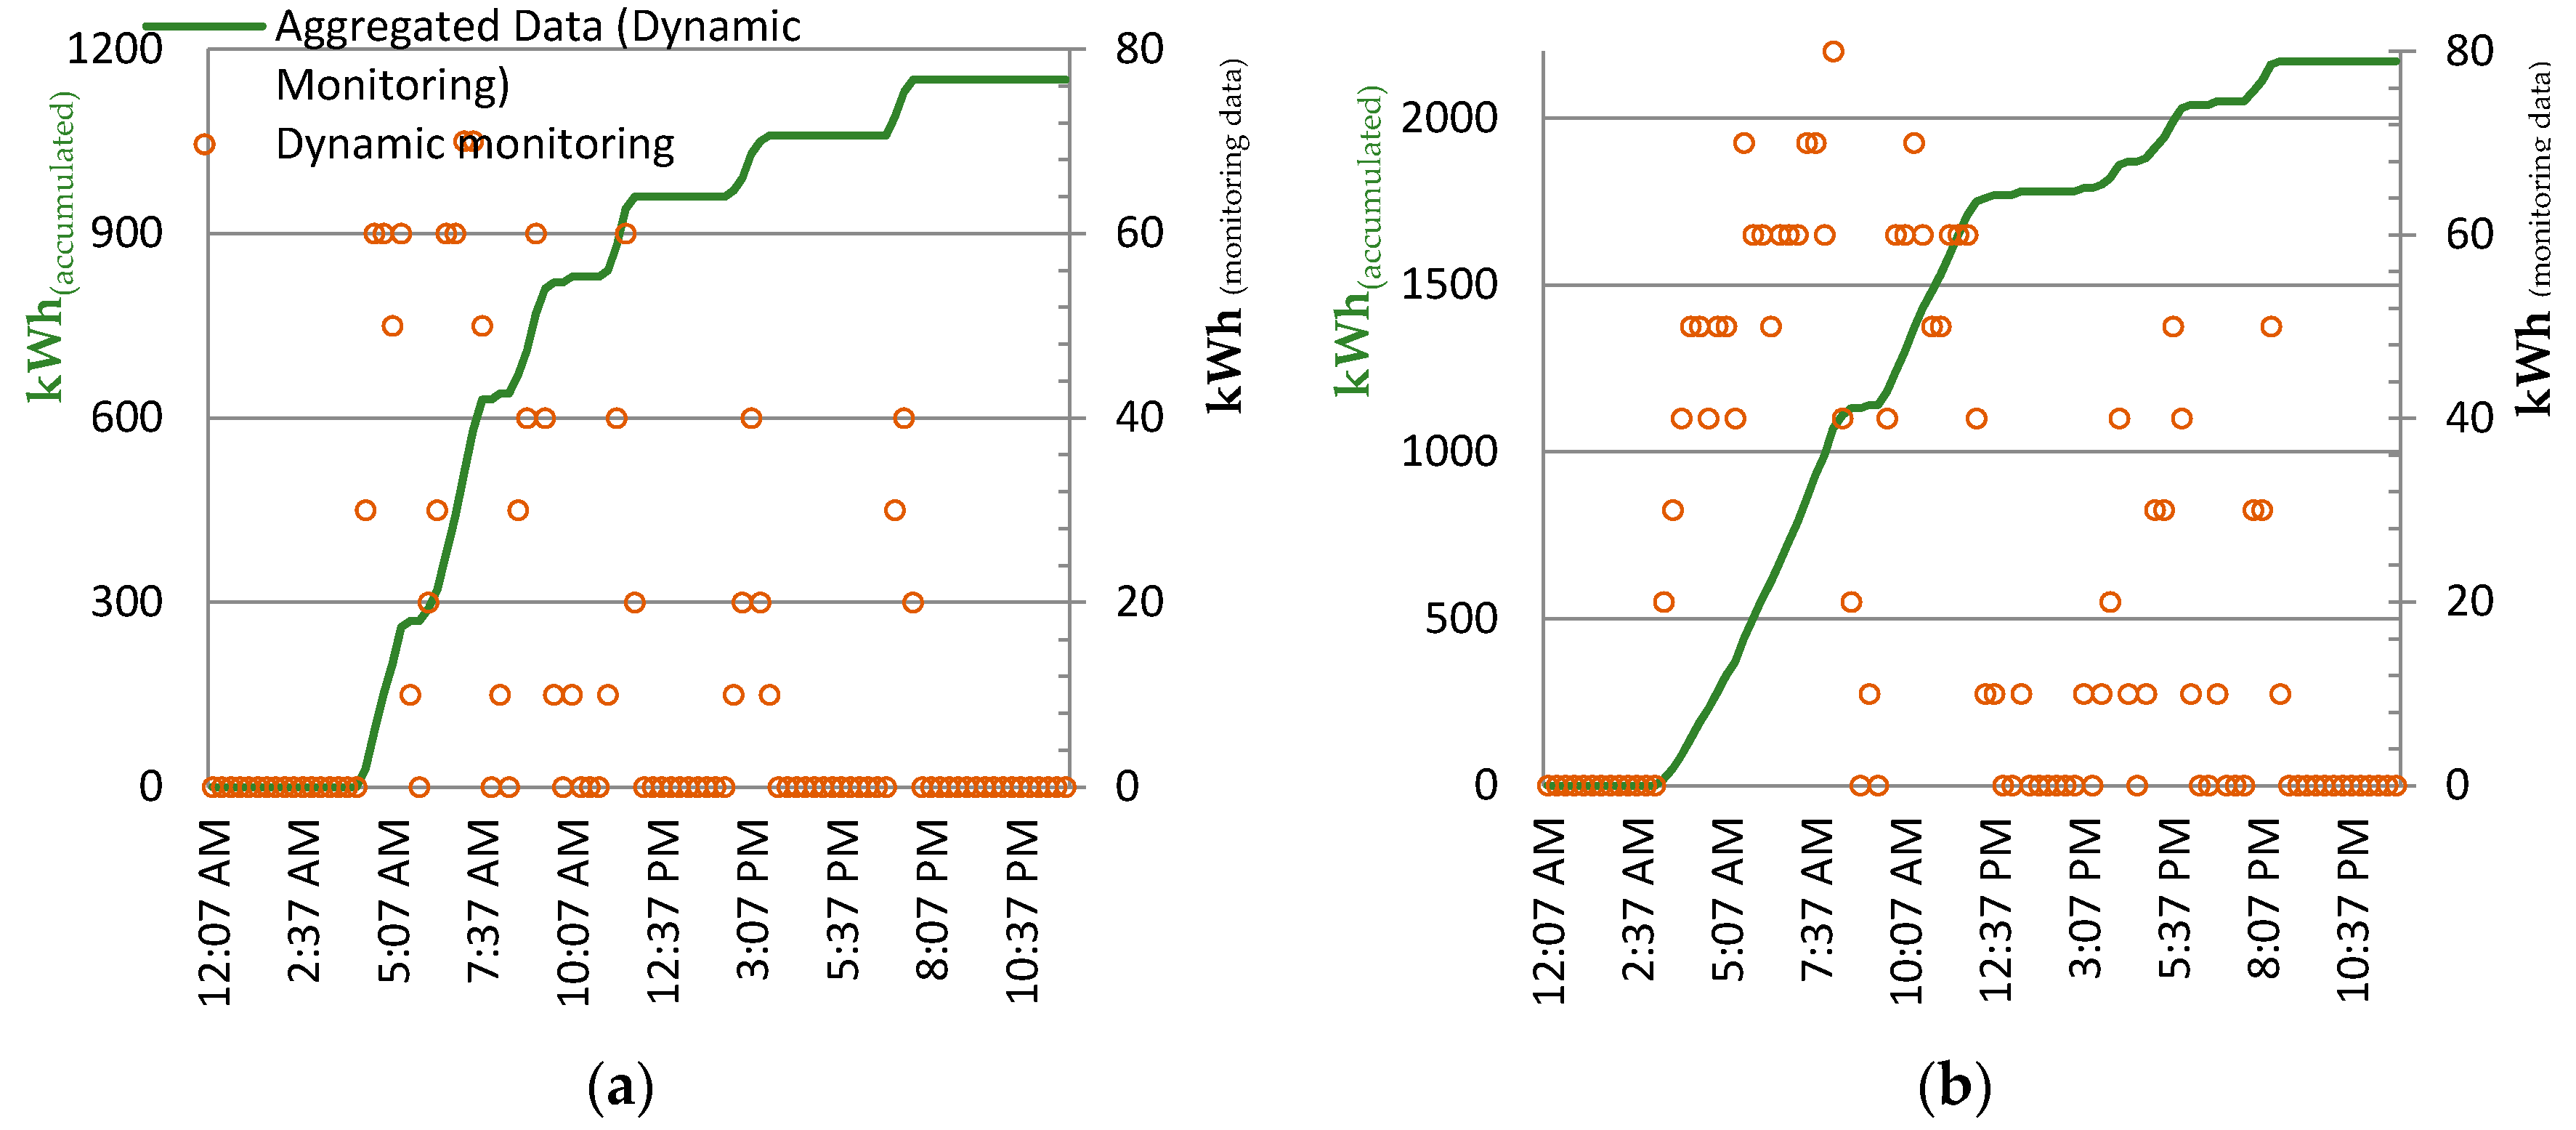
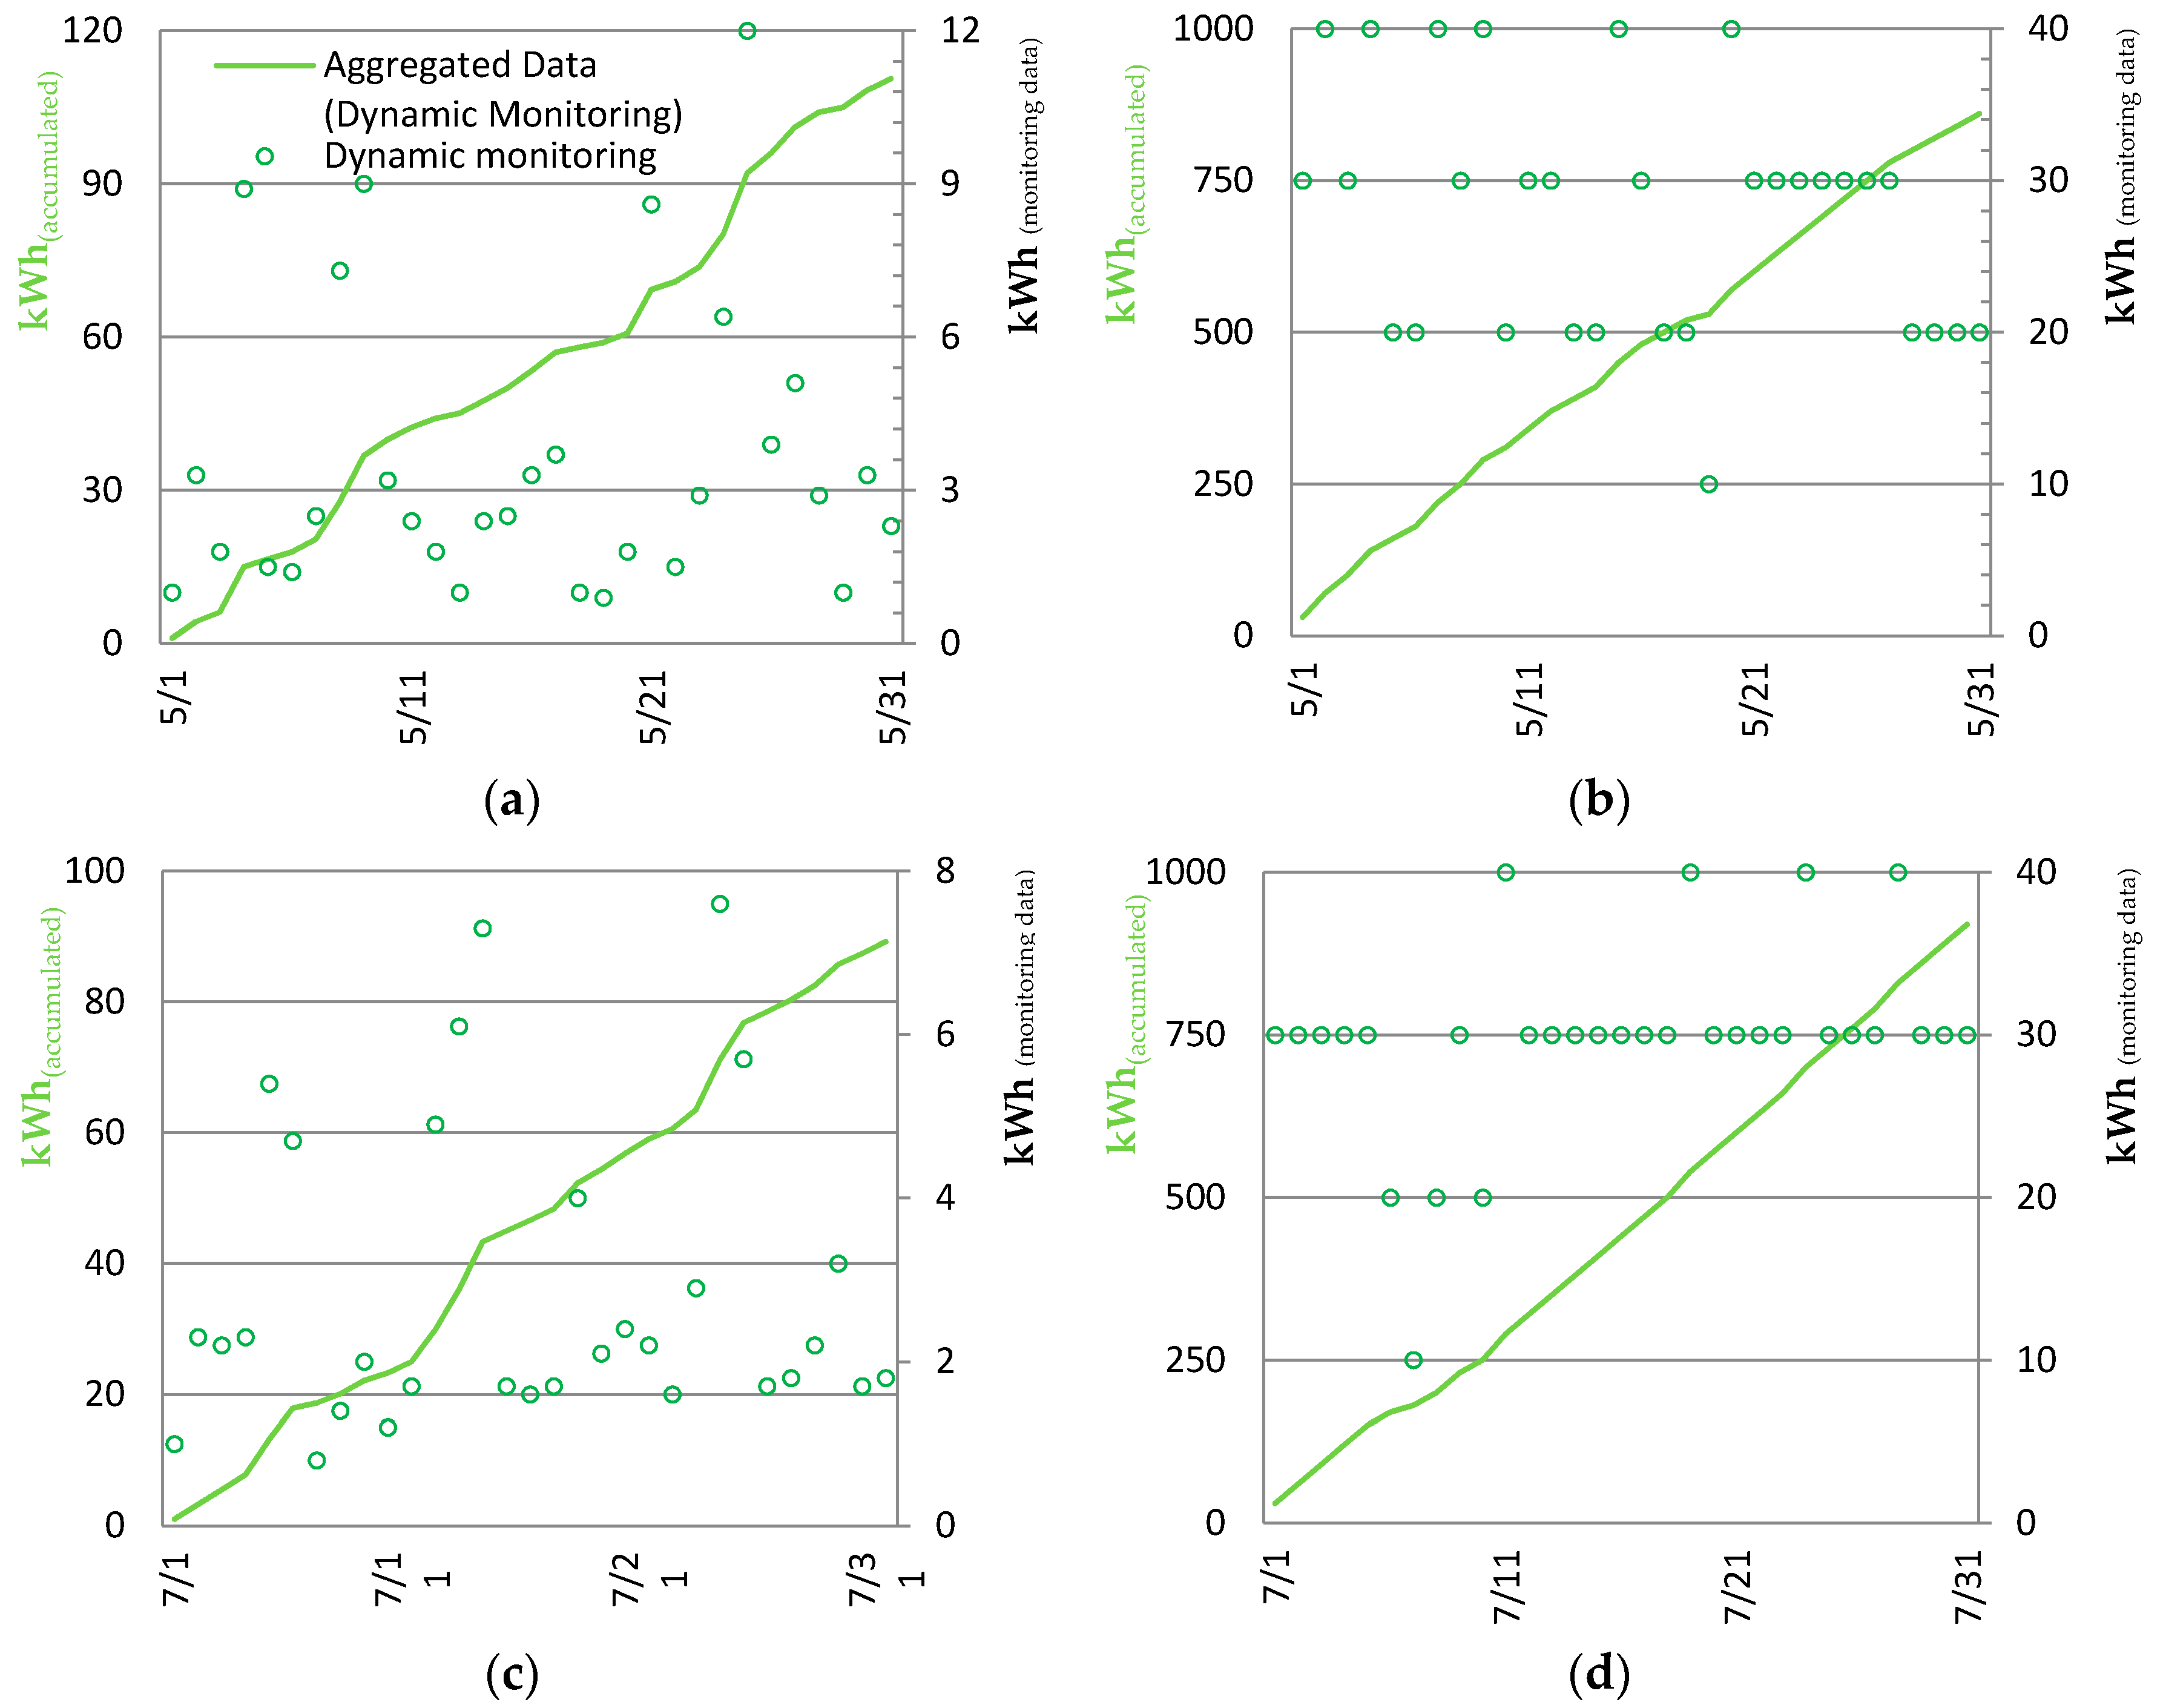
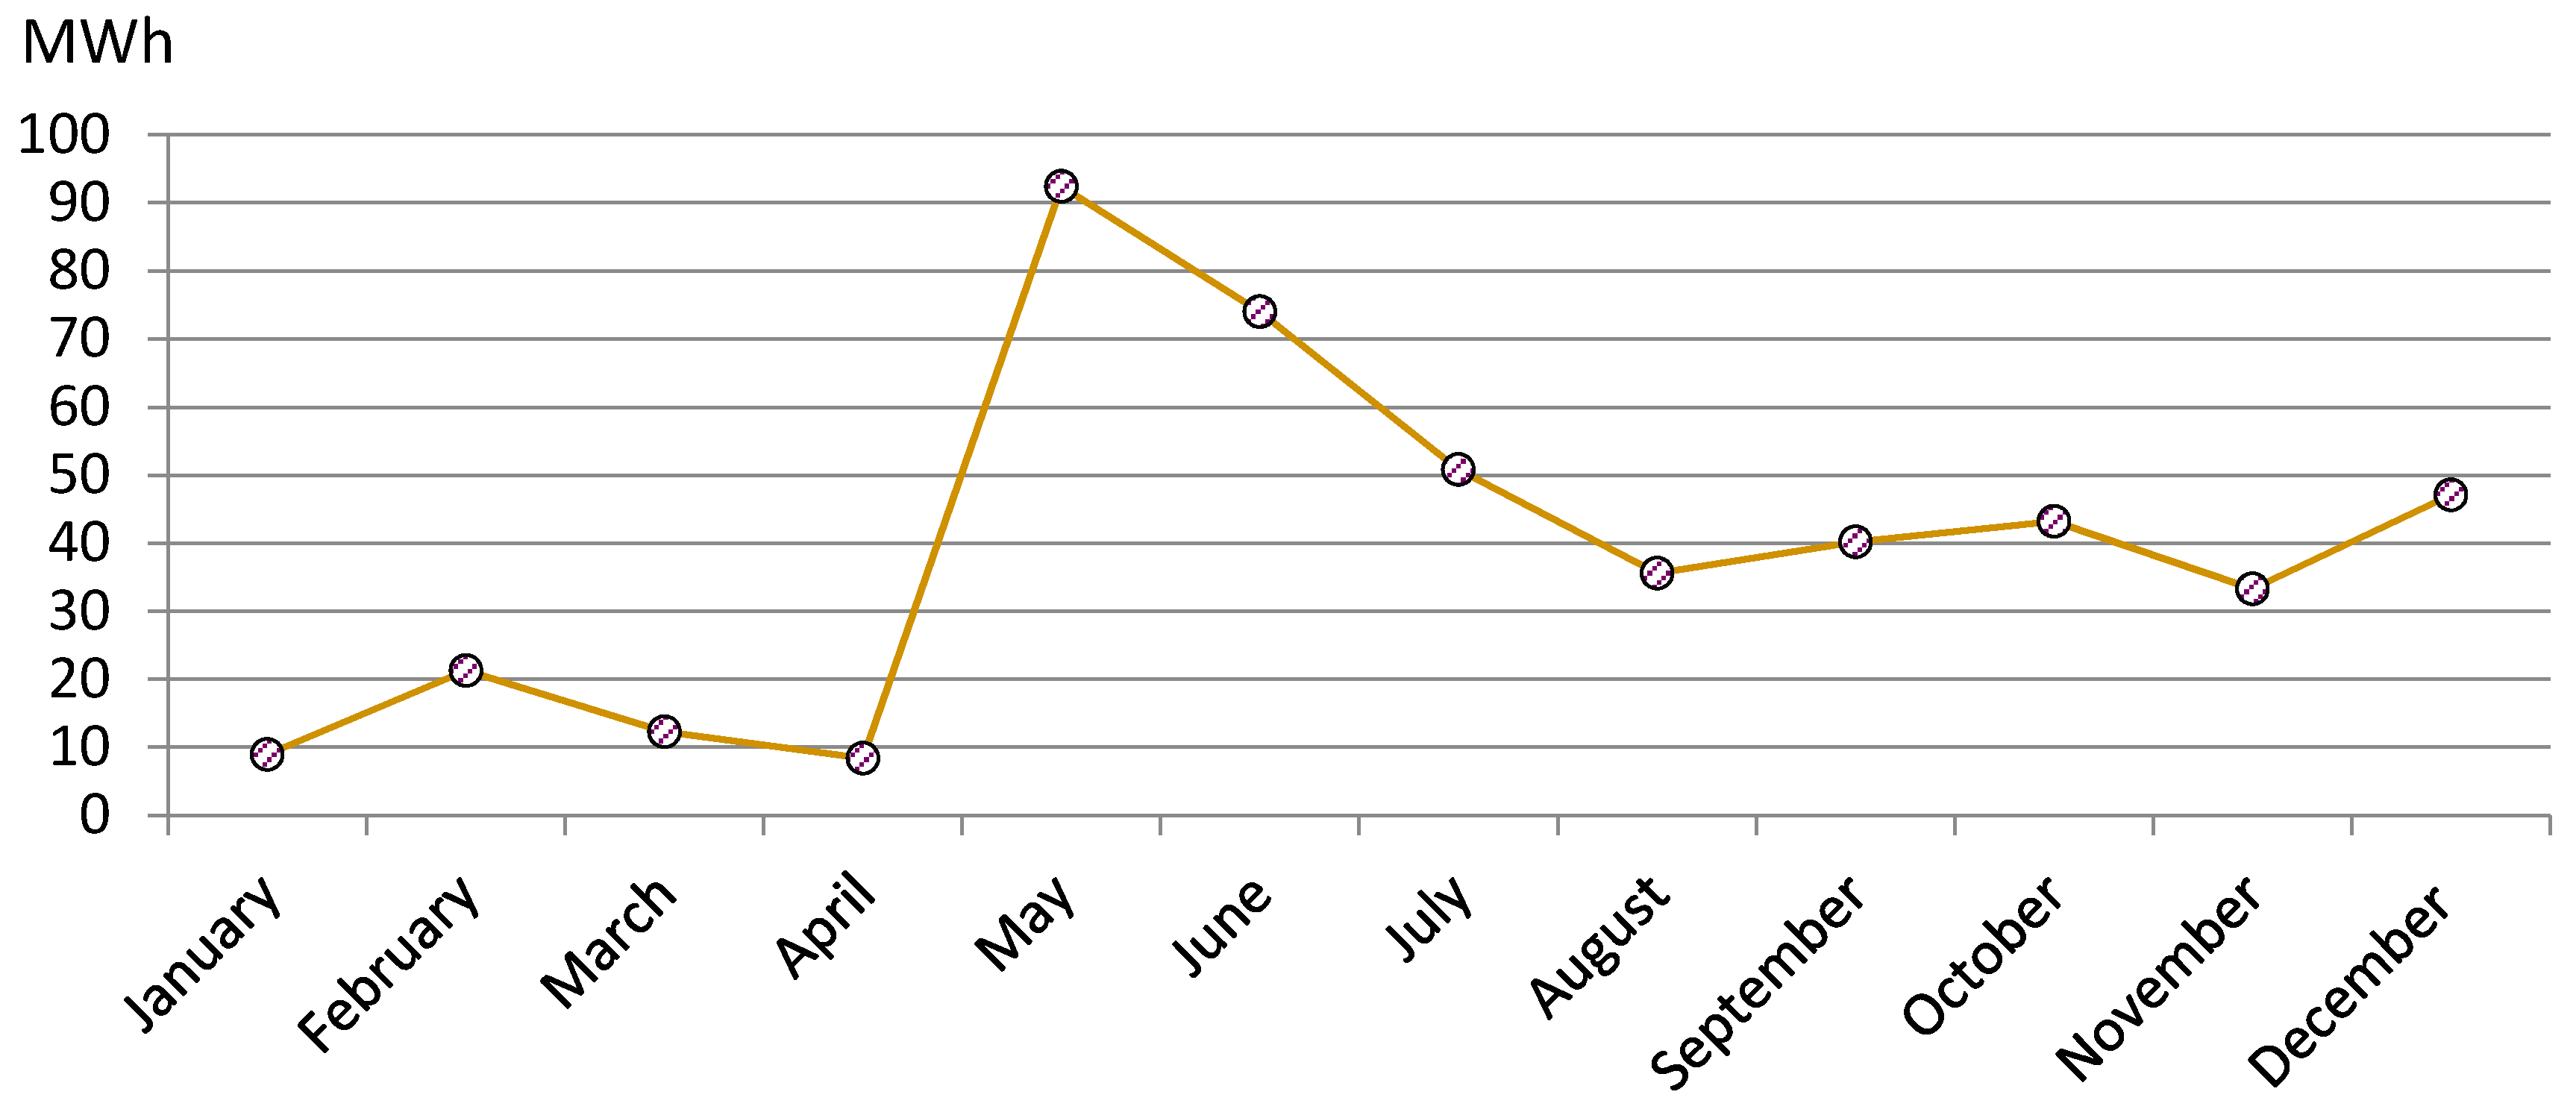
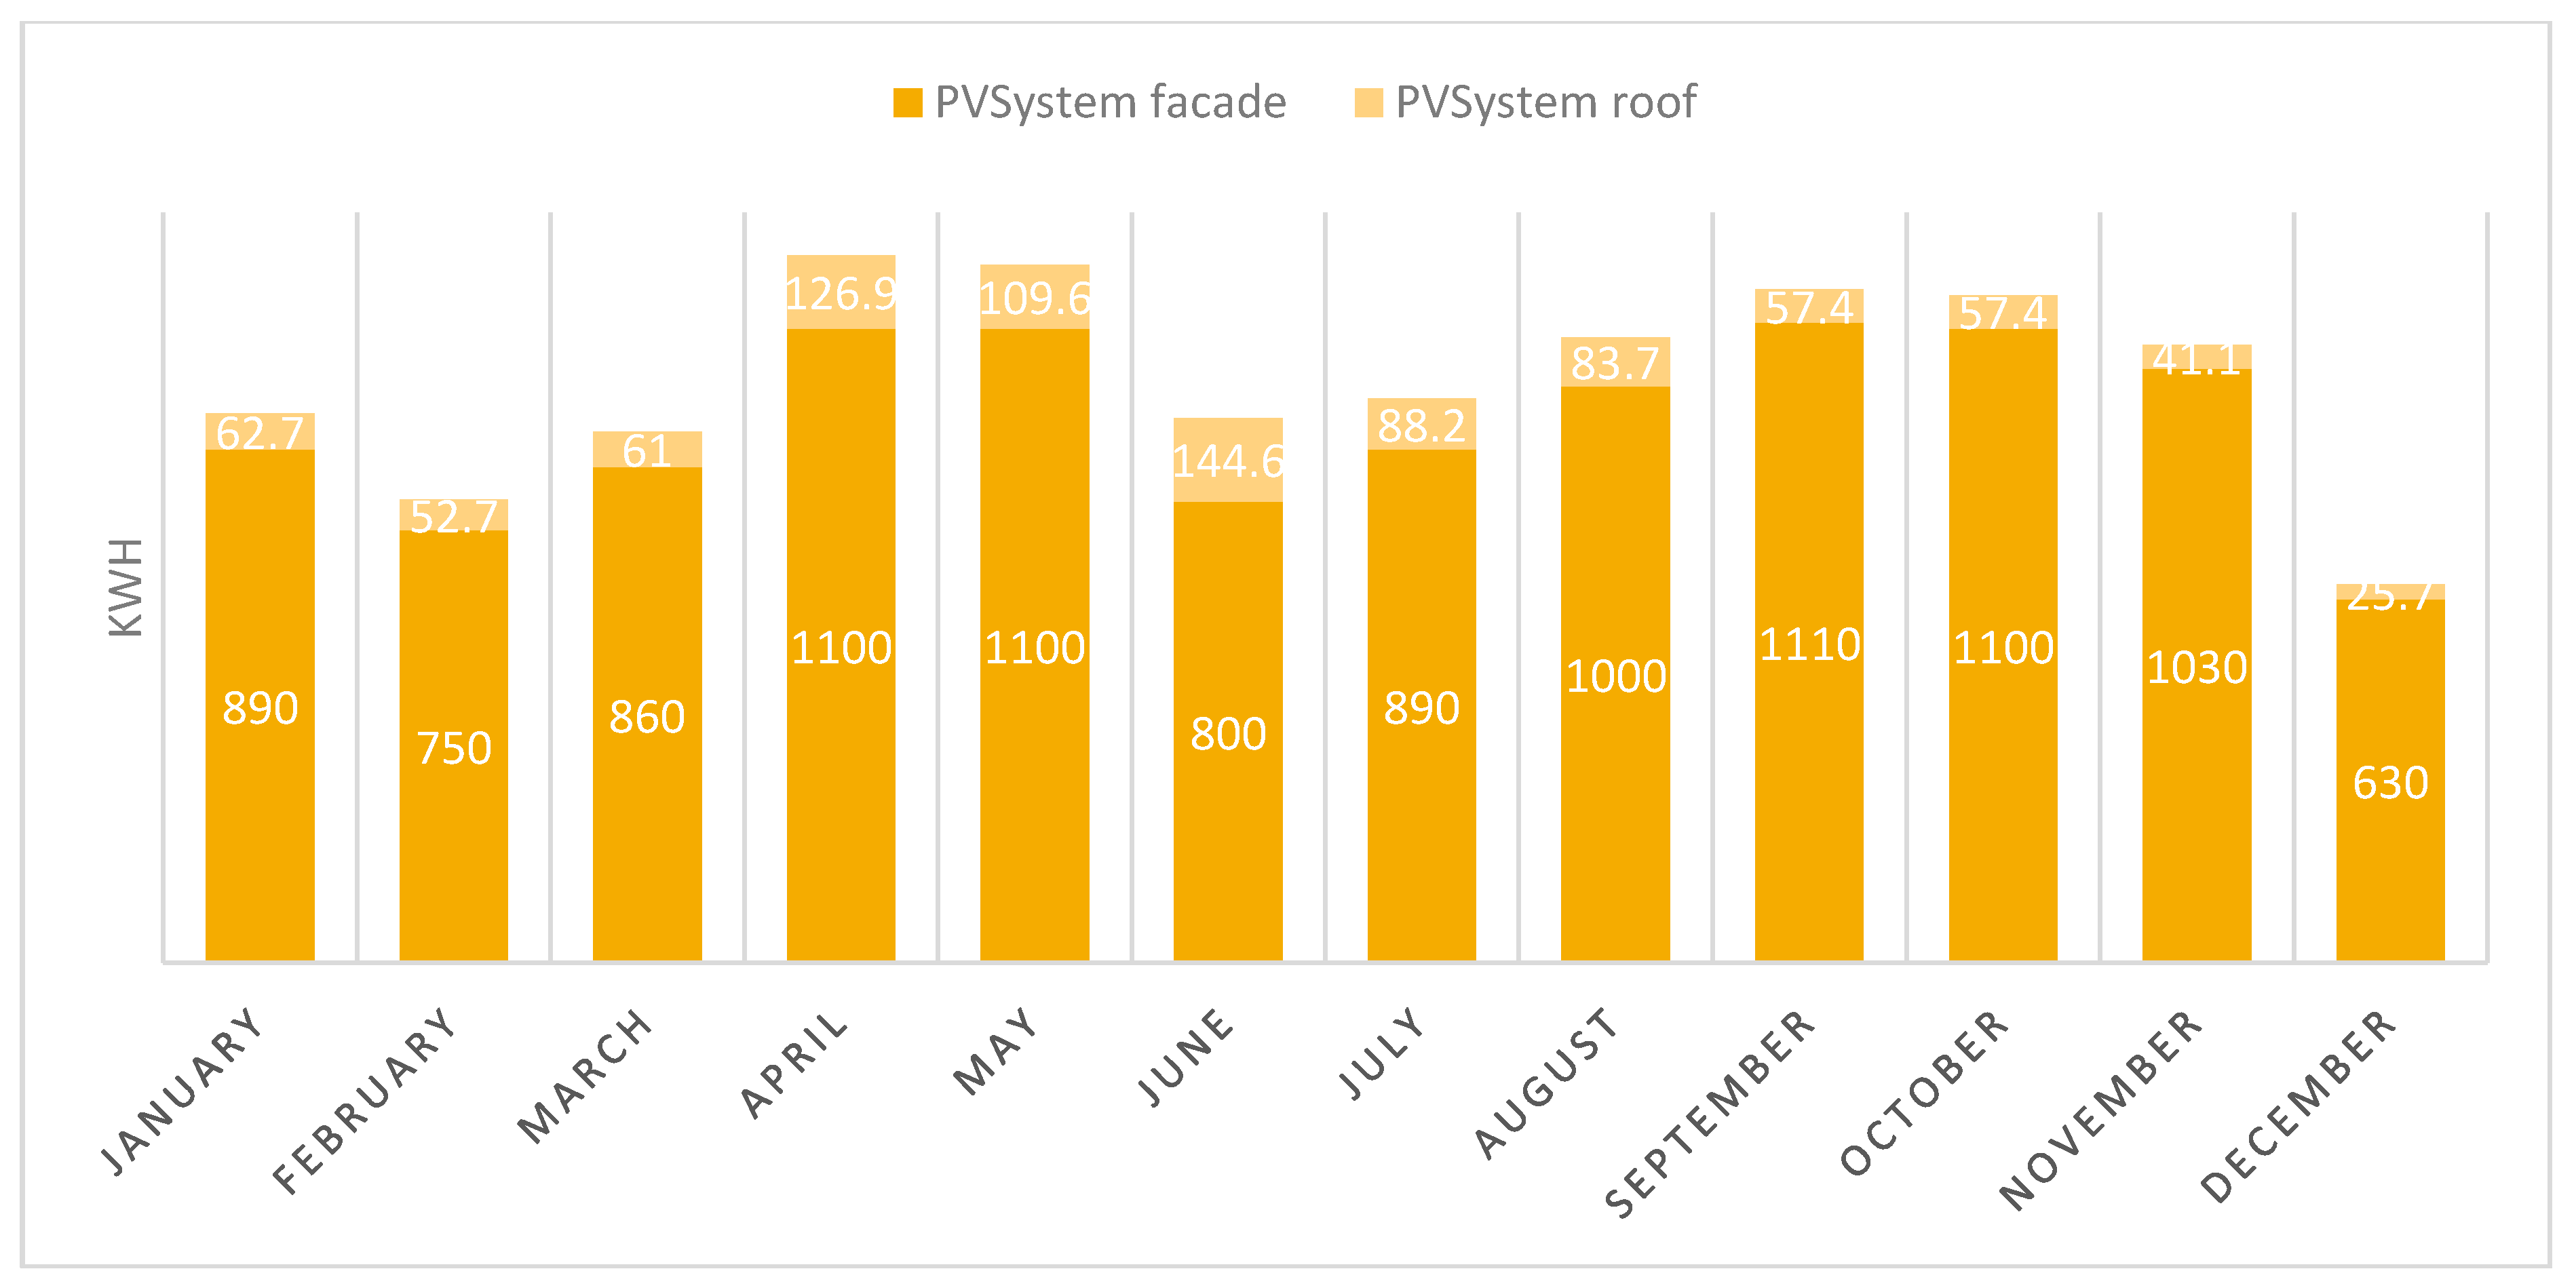
3.4. Photovoltaic Modules
3.5. Environmental Impact: CO2 Emissions Savings
3.6. Operating Costs Saving
4. Conclusions
Author Contributions
Funding
Acknowledgments
Conflicts of Interest
Abbreviations
| LUCIA | Lanzadera Universitaria de Centros de Investigación Aplicada |
| nZEB | near Zero Energy Building |
| EAHX | Earth Air Heat eXchanger |
| PV | PhotoVoltaics |
| EU | European Union |
| EREC | European Renewable Energy Council |
| EPBD | European Performance Building Directive |
| HVAC | Heat Ventilation Air Conditioning |
| DHW | Domestic Hot Water |
| RER | Renewable Energy Ratio |
| CHP | Central Heat Power |
| EER | Energy Efficiency Ratio |
| DALI | Digital Addressable Lighting Interface |
| LED | Light-Emitting Diode |
| SCADA | Supervisory Control and Data Acquisition |
| LEED | Leadership in Energy & Environmental Design |
| LHV | Low Heating Value |
| AHU | Air Handling Unit |
| IAQ | Indoor Air Quality |
References
- 2030 Climate & Energy Framework; European Council of 23 and 24 October 2014; European Council: Brussels, Belgium, 2014.
- European Renewable Energy Council (EREC). Available online: https://ec.europa.eu/energy/intelligent/projects/en/partners/european-renewable-energy-council-1 (accessed on 10 September 2018).
- The European Parliament and the Council of the European Union. DIRECTIVE (EU) 2018/844 of the European Parliament and of the council of 30 May 2018 amending Directive 2010/31/EU on the energy performance of buildings and Directive 2012/27/EU on energy efficiency. Off. J. Eur. Union 2018, 156, 75–91. [Google Scholar]
- Oh, J.; Hong, T.; Kim, H.; An, J.; Jeong, K.; Koo, C. Advanced strategies for net-zero energy building: Focused on the early phase and usage phase of a building’s life cycle. Sustainability 2017, 9. [Google Scholar] [CrossRef]
- Deng, S.; Wang, R.Z.; Dai, Y.J. How to evaluate performance of net zero energy building—A literature research. Energy 2014, 71, 1–16. [Google Scholar] [CrossRef]
- Rey-Hernández, J.M.; Velasco-Gómez, E.; San José-Alonso, J.F.; Tejero-González, A.; Rey-Martínez, F.J. Energy analysis at a near zero energy building. A case-study in Spain. Energies 2018, 11. [Google Scholar] [CrossRef]
- Tsalikis, G.; Martinopoulos, G. Solar energy systems potential for nearly net zero energy residential buildings. Sol. Energy 2015, 115, 743–756. [Google Scholar] [CrossRef]
- González-González, S.L.; Tejero-González, A.; Rey-Martínez, F.J.; Andrés-Chicote, M. Alternative for summer use of solar air heaters in existing buildings. Energies 2017, 10, 1–16. [Google Scholar] [CrossRef]
- Good, C.; Andresen, I.; Hestnes, A.G. Solar energy for net zero energy buildings—A comparison between solar thermal, PV and photovoltaic-thermal (PV/T) systems. Sol. Energy 2015, 122, 986–996. [Google Scholar] [CrossRef]
- Peretti, C.; Zarrella, A.; De Carli, M.; Zecchin, R. The design and environmental evaluation of earth-to-air heat exchangers (EAHE). A literature review. Renew. Sustain. Energy Rev. 2013, 28, 107–116. [Google Scholar] [CrossRef]
- Ascione, F.; D’Agostino, D.; Marino, C.; Minichiello, F. Earth-to-air heat exchanger for NZEB in Mediterranean climate. Renew. Energy 2016, 99, 553–563. [Google Scholar] [CrossRef]
- Thiers, S.; Peuportier, B. Thermal and environmental assessment of a passive building equipped with an earth-to-air heat exchanger in France. Sol. Energy 2008, 82, 820–831. [Google Scholar] [CrossRef]
- Bruno, R.; Arcuri, N.; Carpino, C. The Passive House in Mediterranean Area: Parametric Analysis and Dynamic Simulation of the Thermal Behaviour of an Innovative Prototype. Energy Procedia 2015, 82, 533–539. [Google Scholar] [CrossRef]
- Vaz, J.; Sattler, M.A.; Brum, R.D.S.; Dos Santos, E.D.; Isoldi, L.A. An experimental study on the use of Earth-Air Heat Exchangers (EAHE). Energy Build. 2014, 72, 122–131. [Google Scholar] [CrossRef]
- Woodson, T.; Coulibaly, Y.; Traoré, E.S. Earth-Air Heat Exchangers for Passive Air Conditioning: Case study Burkina Faso. J. Constr. Dev. Ctries. 2012, 17, 21–33. [Google Scholar]
- Bisoniya, T.S.; Kumar, A.; Baredar, P. Experimental and analytical studies of earth-air heat exchanger (EAHE) systems in India: A review. Renew. Sustain. Energy Rev. 2013, 19, 238–246. [Google Scholar] [CrossRef]
- Niu, F.; Yu, Y.; Yu, D.; Li, H. Investigation on soil thermal saturation and recovery of an earth to air heat exchanger under different operation strategies. Appl. Therm. Eng. 2015, 77, 90–100. [Google Scholar] [CrossRef]
- Mohamed, A.; Hasan, A.; Sirén, K. Fulfillment of net-zero energy building (NZEB) with four metrics in a single family house with different heating alternatives. Appl. Energy 2014, 114, 385–399. [Google Scholar] [CrossRef]
- Moran, P.; Goggins, J.; Hajdukiewicz, M. Super-insulate or use renewable technology? Life cycle cost, energy and global warming potential analysis of nearly zero energy buildings (NZEB) in a temperate oceanic climate. Energy Build. 2018, 139, 590–607. [Google Scholar] [CrossRef]
- Yang, A.S.; Su, Y.M.; Wen, C.Y.; Juan, Y.H.; Wang, W.S.; Cheng, C.H. Estimation of wind power generation in dense urban area. Appl. Energy 2016, 171, 213–230. [Google Scholar] [CrossRef]
- Drysdale, D.; Mathiesen, B.V.; Paardekooper, S. Transitioning to a 100% renewable energy system in Denmark by 2050: Assessing the impact from expanding the building stock at the same time. Energy Effic. 2018, 1–19. [Google Scholar] [CrossRef]
- Kampelis, N.; Gobakis, K.; Vagias, V.; Kolokotsa, D.; Standardi, L.; Isidori, D.; Cristalli, C.; Montagnino, F.M.; Paredes, F.; Muratore, P.; et al. Evaluation of the performance gap in industrial, residential & tertiary near-Zero energy buildings. Energy Build. 2017, 148, 58–73. [Google Scholar] [CrossRef]
- Torgal, F.P.; Mistretta, M.; Kaklauskas, A.; Granqvist, C.G.; Cabeza, L.F. Nearly Zero Energy Building Refurbishment: A Multidisciplinary Approach; Springer: London, UK, 2014; ISBN 9781447155232. [Google Scholar]
- Carlisle, N.; Van Geet, O.; Pless, S. Definition of a “Zero Net Energy” Community; US National Renewable Energy Laboratory: Lakewood, CO, USA, 2009. [Google Scholar]
- Kottek, M.; Grieser, J.; Beck, C.; Rudolf, B.; Rubel, F. World map of the Köppen-Geiger climate classification updated. Meteorol. Z. 2006, 15, 259–263. [Google Scholar] [CrossRef]
- Tejero-González, A.; Andrés-Chicote, M.; García-Ibáñez, P.; Velasco-Gómez, E.; Rey-Martínez, F.J. Assessing the applicability of passive cooling and heating techniques through climate factors: An overview. Renew. Sustain. Energy Rev. 2016, 65, 727–742. [Google Scholar] [CrossRef]
- LEED Certification. Available online: https://new.usgbc.org/leed (accessed on 10 September 2018).
- Rey-Hernandez, J.M.; Yousif, C.; Gatt, D.; Velasco-Gomez, E.; San José-Alonso, J.; Rey-Martínez, F.J. Modelling the long-term effect of climate change on a zero energy and carbon dioxide building through energy efficiency and renewables. Energy Build. 2018, 174, 85–96. [Google Scholar] [CrossRef]
- Austrian Standards (Önorm). Available online: https://www.austrian-standards.at/ (accessed on 10 September 2018).
- Wilde, P. De Automation in Construction The gap between predicted and measured energy performance of buildings: A framework for investigation. Autom. Constr. 2014, 41, 40–49. [Google Scholar] [CrossRef]
- SIEMENS DESiGo. Available online: http://www.buildingtechnologies.siemens.com/bt/global/en/buildingautomation-hvac/building-automation/building-automation-and-control-system-europe-desigo/management-station/desigo-web/pages/desigo-web.aspx (accessed on 10 September 2018).
- ModBUS Protocol. Available online: http://www.modbus.org/ (accessed on 10 September 2018).
- Spanish Institute for Energy Saving and Diversification (IDAE) CO2 Conversion Factors. Available online: http://www.mincotur.gob.es/energia/desarrollo/EficienciaEnergetica/RITE/Reconocidos/Reconocidos/Otros documentos/Factores_emision_CO2.pdf (accessed on 4 September 2018).


| LUCIA nZEB Features | Facilities | Set Points |
|---|---|---|
| Area 7500 m2 | Biomass Boiler 300 kW | Summer 26 °C |
| Laboratories Area 5150 m2 | Absorption System 176 kW (EER 0.7) | Winter 21 °C |
| Volume 22,500 m3 | Conventional Air Cooling system 232.7 kW (EER 3.3) | Humidity 40–60% |
| Thermal transmittance 0.157 W/m2K | EAHX 56 wells, 0.2 m diameter, 16 m bured pipes | |
| DALI (T5 and LED) 9.7 W/m2 | HVAC by 4-tube fancoil system | |
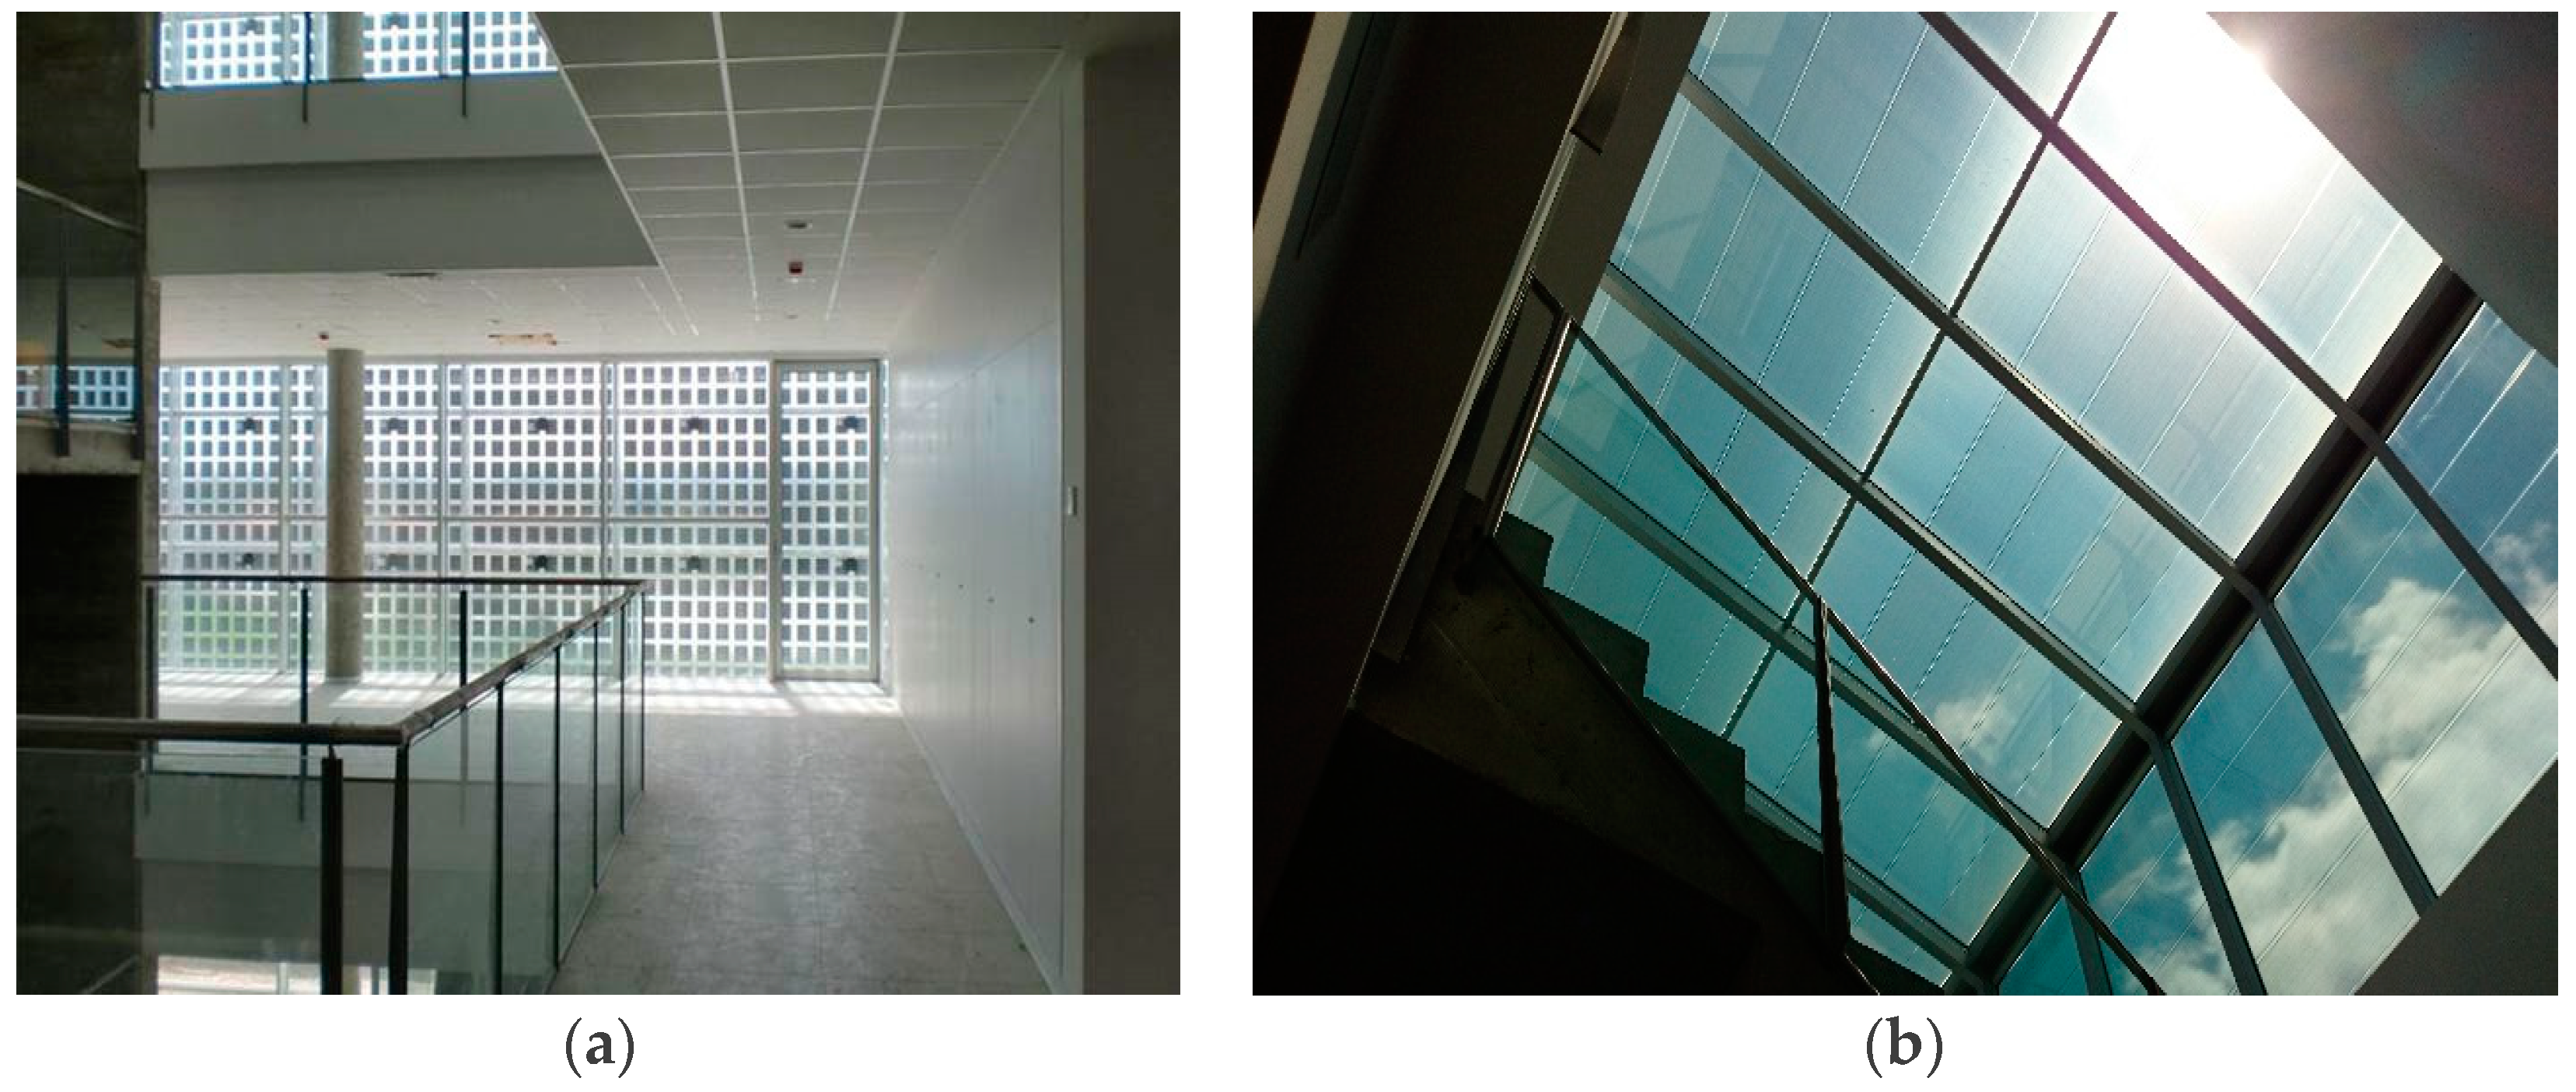
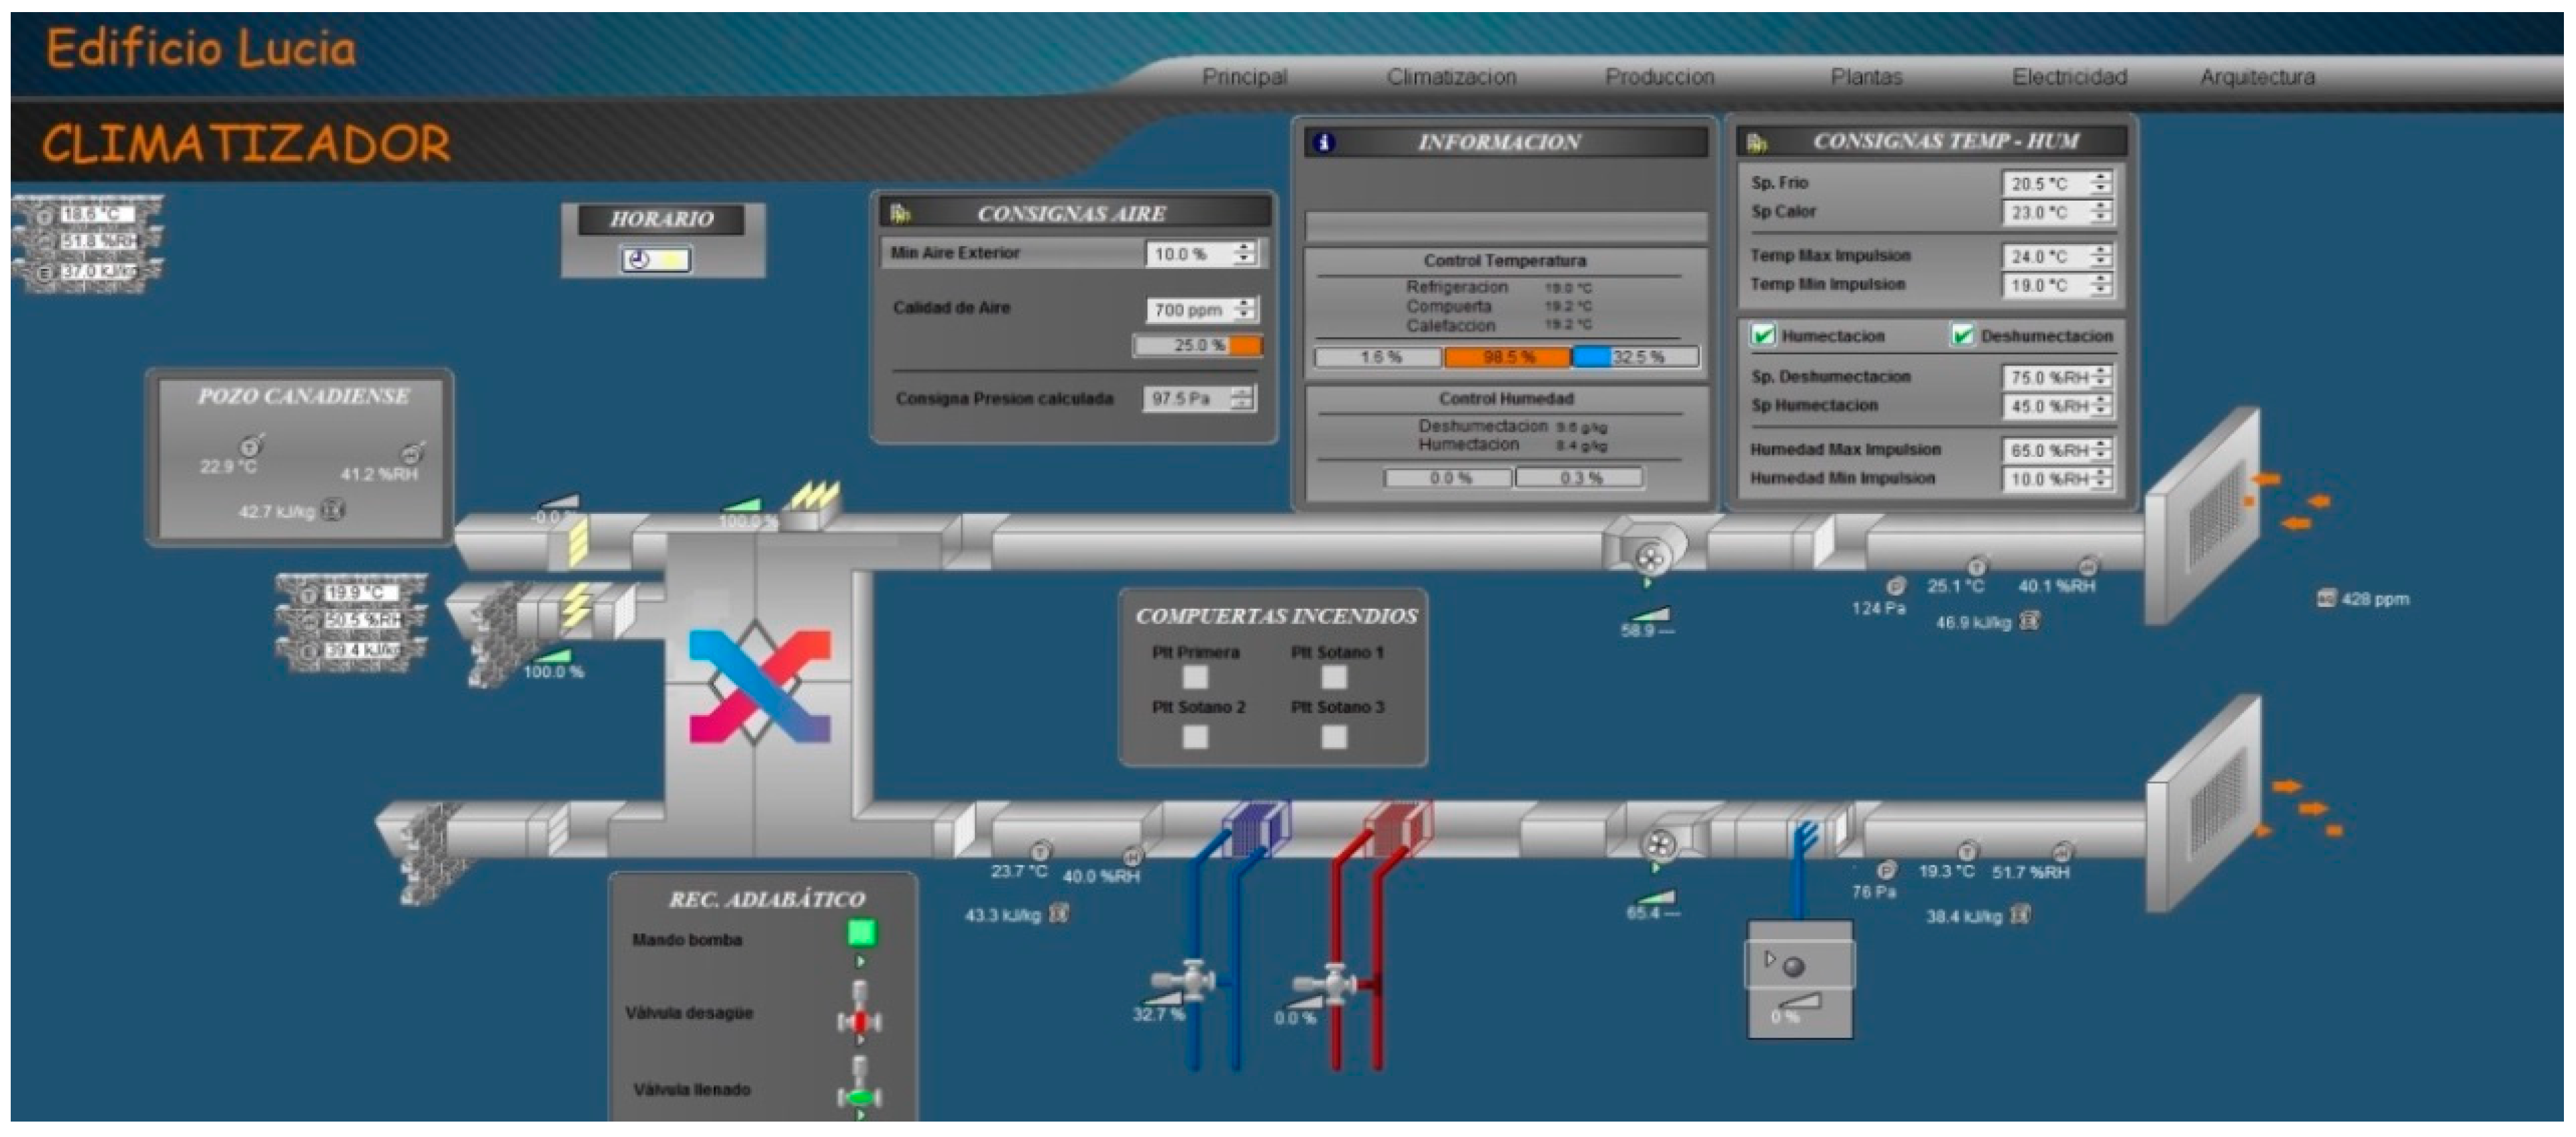
| Solar Tubes (Natural Lighting) | SCADA (DESIGO, Siemens) | |
| ZigZag Shaped Façade (auto shading) | ||
| South orientation |
| PVFacade | PVRoof | |||
|---|---|---|---|---|
| PV 1 | PV 2 | PV 3 | PV 4 | |
| Power (W) | 10,080 | 1680 | 840 | 2520 |
| Power per item (W) | 180 | 140 | 140 | 140 |
| Total surface covered (m2) | 98.33 | 42.58 | 21.29 | 63.87 |
| Inversor Power (W) | 10,000 | 2000 | 1200 | 2500 |
| Azimuth | 35° | 35° | 35° | 145° |
| Tilt Angle | 90° | 5° | 90° | 5° |
| Energy | Source of Energy Demand | MWh |
|---|---|---|
| Cooling | Chiller | 87.98 |
| Absorption System | 34.22 | |
| Pumps & Fans | Supply air flow HVAC System | 62.30 |
| Return air flow HVAC System | 55.11 | |
| Heating | Indoor heating (biomass boiler) | 173.24 |
| DHW (biomass boiler) | 7.22 | |
| Lighting | Lighting | 78.14 |
| Electrical (kg CO2/Year) | PVSystems | PVfacade + roof | PVfacade + roof | PVfacade + roof |
|---|---|---|---|---|
| 7899 | 7899 | 7899 | ||
| Natural Gas | Diesel | LPG | ||
| Thermal (kg CO2/year) | EAHX System | 95,350 | 134,144 | 114,046 |
| biomass boiler | 20,202 | 28,421 | 24,163 | |
| TOTAL (kg CO2/year) | 123,451 | 170,464 | 146,107 |
| Electrical (€/year) | PVSystems | Biomass | PVfacade + roof | PVfacade + roof | PVfacade + roof |
|---|---|---|---|---|---|
| 1461 | 1461 | 1461 | |||
| Natural Gas | Diesel | LPG | |||
| Thermal (€/year) | EAHX System | 18,696 | 28,889 | 27,937 | 26,642 |
| Biomass boiler | 18,222 | 21,309 | 20,321 | ||
| Total (€/year) | 18,696 | 43,573 | 50,707 | 48,423 |
© 2018 by the authors. Licensee MDPI, Basel, Switzerland. This article is an open access article distributed under the terms and conditions of the Creative Commons Attribution (CC BY) license (http://creativecommons.org/licenses/by/4.0/).
Share and Cite
Rey-Hernández, J.M.; Velasco-Gómez, E.; San José-Alonso, J.F.; Tejero-González, A.; González-González, S.L.; Rey-Martínez, F.J. Monitoring Data Study of the Performance of Renewable Energy Systems in a Near Zero Energy Building in Spain: A Case Study. Energies 2018, 11, 2979. https://doi.org/10.3390/en11112979
Rey-Hernández JM, Velasco-Gómez E, San José-Alonso JF, Tejero-González A, González-González SL, Rey-Martínez FJ. Monitoring Data Study of the Performance of Renewable Energy Systems in a Near Zero Energy Building in Spain: A Case Study. Energies. 2018; 11(11):2979. https://doi.org/10.3390/en11112979
Chicago/Turabian StyleRey-Hernández, Javier M., Eloy Velasco-Gómez, Julio F. San José-Alonso, Ana Tejero-González, Sergio L. González-González, and Francisco J. Rey-Martínez. 2018. "Monitoring Data Study of the Performance of Renewable Energy Systems in a Near Zero Energy Building in Spain: A Case Study" Energies 11, no. 11: 2979. https://doi.org/10.3390/en11112979
APA StyleRey-Hernández, J. M., Velasco-Gómez, E., San José-Alonso, J. F., Tejero-González, A., González-González, S. L., & Rey-Martínez, F. J. (2018). Monitoring Data Study of the Performance of Renewable Energy Systems in a Near Zero Energy Building in Spain: A Case Study. Energies, 11(11), 2979. https://doi.org/10.3390/en11112979