Article

A New Indicator of Transient Stability for Controlled Islanding of Power Systems: Critical Islanding Time

1
School of Electrical Engineering, Zhejiang University, Hangzhou 310027, China
2
State Grid Zhejiang Ningbo Power Supply Company, Ningbo 315000, China
*
Author to whom correspondence should be addressed.
Energies 2018, 11(11), 2975; https://doi.org/10.3390/en11112975
Submission received: 10 October 2018 / Revised: 25 October 2018 / Accepted: 29 October 2018 / Published: 1 November 2018
(This article belongs to the Section F: Electrical Engineering)

Abstract

:
Transient stability after islanding is of crucial importance because a controlled islanding strategy is not feasible if transient stability cannot be maintained in the islands created. A new indicator of transient stability for controlled islanding strategies, defined as the critical islanding time (CIT), is presented for slow coherency-based controlled islanding strategies to determine whether all the islands created are transiently stable. Then, the stable islanding interval (SII) is also defined to determine the appropriate time frame for stable islanding. Simulations were conducted on the New England test system–New York interconnected system to demonstrate the characteristics of the critical islanding time and stable islanding interval. Simulation results showed that the answer for when to island could be easily reflected by the proposed CIT and SII indicators. These two indicators are beneficial to power dispatchers to keep the power systems transiently stable and prevent widespread blackouts.

1. Introduction

The ever-rising energy demand has made power systems operate close to their operation limits because their network expansions cannot meet the growth requirement of loads in the power systems [1,2,3]. Thus, power systems are becoming more vulnerable to disturbances, and the risks of power system failures are increasing. Preventive islanding [4,5,6] is one solution to prevent widespread blackouts and to maintain the transient stability of the power systems [7,8]. When all conventional protection and control measures fail, and the system tends to get into this state with widespread blackout, the last line of defense is to split a large network into a number of smaller, sustainable islands [9,10,11]. This not only prevents an outage from spreading, but also reduces the number of customers affected and makes resynchronization easier [12].
Several methods have been proposed to divide a system into islands. In Reference [13], the ordered binary decision diagram (OBDD)-based system splitting strategy is proposed based on static power flow information, and the transient stability of the splitting strategy is simulated. In Reference [14], a searching method of the splitting boundary is presented, which aims at the minimization of the load–generation imbalance in each island. In Reference [15], a two-step spectral clustering strategy is presented to split the power system into islands based on the weak coupling of generators. In Reference [16], a hierarchical spectral clustering method is proposed to form controlled islanding with minimal power flow disruption. With these splitting strategies, the first step is to determine coherent groups of generators, and slow coherency is usually utilized to identify coherent generators. Slow coherency is based on the observation of oscillations of large-scale power systems, and has been used to split seriously disturbed power systems into islands to prevent a widespread blackout. In Reference [6], the coherent generator groups are identified by implementing the DYNRED (Dynamic Reduction Program) of EPRI (Electric Power Research Institute), and then an automatic islanding program is proposed to search the optimum cut sets with minimal generation–load imbalance. In Reference [17], the DYNRED package is employed to identify the coherent generators, and then a max-flow min-cut algorithm in graph theory is employed to search the minimal cut sets with minimal generation–load imbalance for the controlled islands. In Reference [18], a decision tree (DT) is proposed to form controlled islanding with slowly coherent generator groups considered. It is also used to evaluate the security and stability of the power systems after islanding. In Reference [19], the slow coherency method is simply introduced, and a graph simplification method is presented for easy determination of the optimum cut set of a large-scale power system. In Reference [15], the method of the weak coupling among generators is taken to cluster the generators with slow coherency, then the spectral clustering strategy is presented to split the power system into controlled islands. It can be seen in this islanding method that the coherent generators are determined by using eigenvalue analysis results, which is based on the linearized generation model of one operating point, and only one islanding scheme is obtained for all kinds of disturbances in different locations. This means that only steady stability was considered in this kind of islanding method, and the transient stability of power systems after islanding was neglected. So, the optimized islanding scheme cannot guarantee that the split islands are transiently stable. It can also be seen in the slow coherency-based islanding method that every coherent generation group is split into one island, so the number of the split islands is determined by the number of coherent groups of generators. This would lead to too many split islands and long resynchronization time, which would increase the risk of reintroducing disturbances into the power systems. Furthermore, only one islanding strategy is optimized by the traditional slow coherency-based islanding method for removing the impact of different kinds of disturbances. This traditional method is disturbance independent.
Transient stability after splitting is of crucial importance because a splitting strategy will not be feasible if transient stability cannot be maintained in the islands created. However, no indicator for measuring the transient stability of the splitting strategies exists. Given this background, a new indicator, the critical islanding time (CIT), is presented in this paper to describe the maximal duration of implementing the islanding strategy for which all the split islands remain transiently stable, which can be considered as the transient stability margin of islanding. Based on this indicator, the transient stability of islanding strategies can be fully considered, and different islanding strategies can be compared from the transient stability aspect.

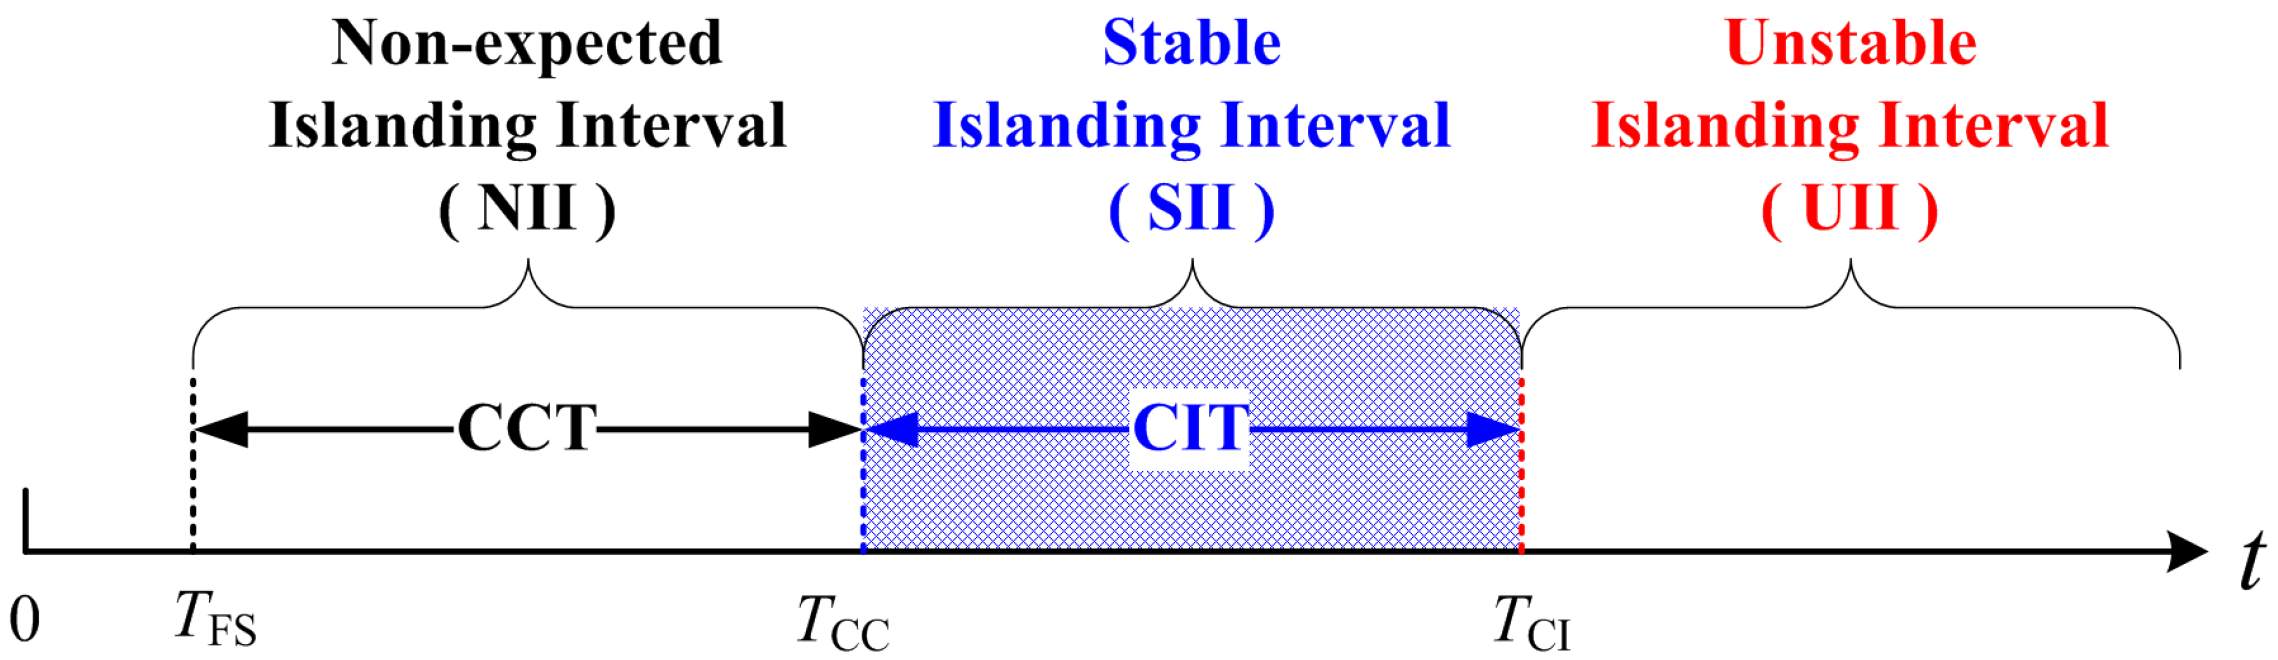
2. Critical Islanding Time for Controlled Islanding Strategies in Interconnected Power Systems

2.1. Slow Coherency-Based Controlled Islanding Strategies

Slow coherency is based on the observation of oscillations of large-scale power systems. Oscillations in power systems can be classified into local modes and inter-area modes. When the fast local dynamics have decayed, the generators in the same area swing together, so they are “coherent” with respect to the slow modes [20]. There are three main methods for identifying coherent groups of generators, which are based on generator angles [21], phase angle measurement [22,23], and modal analysis [24,25], respectively. For the first method, the coherent groups of generators are determined by observing the generator angle’s curves, obtained by nonlinear time domain simulation. This method is very simple, but the results are easily influenced by the assumed disturbances, and the transient stability of power systems is greatly impacted by the given threshold for determining the unstable states. For the second method, the coherency groups of generators are identified online by analyzing the real generator angles, which are recorded by phase measurement units with fast Fourier transform (FFT) [26], Hilbert–Huang transform [27], principal or independent components analysis techniques [28,29], etc., but this method is difficult to utilize to forecast the unstable states in advance. The dynamics of power systems are considered in the determination of slow coherency for the first and second methods, but these two methods are difficult to utilize to forecast the unstable states in advance. For the third method (i.e., modal analysis-based coherency identification method), the coherent groups of generators are determined by eigenvalue analysis on linearized power system models, and so it is a frequency domain approach, and the dynamics of power systems are not considered.
In this paper, modal analysis is used to demonstrate the traditional slow coherency-based islanding method. Slow coherency can group generators based on their participation in the selected inter-area modes of oscillation, as determined by eigenvalue analysis. In the slow coherency method based on modal analysis, the number of coherent groups is first determined by the selected r lowest frequency modes. The eigenvector matrix W of the r lowest frequency modes can then be computed. Coherency is determined by comparing the angles between the row vector wi of W. Hence, it was defined in Reference [30] that the states xi and xj of a system x = Ax are slow coherent with respect to a set of r slowest modes μa of the system if and only if the difference between the i-th and j-th rows of W are within a specified range. A is the system state matrix, and μa = {λ1, λ2, …, λr} are the eigenvalue vectors of A. According to the tolerance-based slow coherency determination method, the generator coherency index is defined as [31,32]:
C i j = w i w j T | w i | | w j | ,
where wi and wj are respectively the i-th and j-th row vectors of the slow right eigenvector transfer matrix W. If Cij is larger than a pre-determined threshold value ε, it is concluded that the i-th generator is coherent with the j-th generator. Hence, the coherent groups of generators can be determined by this generator coherency index.
After the coherent groups of generators have been determined, the next step is to search for an optimum cut set to split the power system into several islands. There are many possible methods to do this, such as minimal cut set, minimal cut set with minimum net flow, K-means technique, K-way partitioning, multi-way balanced graph partitioning, and angle modulated particle swarm optimization [33]. In this paper, we use the minimal cut set method in which minimal power flow disruption is taken as the optimization objective, considering the coherency groups obtained in the first step.

2.2. Critical Islanding Time for Transient Stability of Controlled Islanding

There are many indices for evaluating the quality of obtained islanding strategies. Power flow disruption and power imbalance are the two main indices, as any islanding should minimize a shock to the system caused by islanding itself and the islands should be as balanced as possible. However, transient stability after islanding is of crucial importance because an islanding strategy is not feasible if transient stability cannot be maintained in the islands created. To quantify it, we will define the critical islanding time (CIT) as the maximum time for implementing an islanding strategy (i.e., the maximum time when islanding can still save the system).
Suppose that the initial system disturbance is a short-circuit fault that is cleared in a time slightly longer than the critical clearing time (CCT). Hence, the system will lose stability if no islanding is employed. For a given power system splitting strategy, CIT is defined as the time period from the critical clearing time to the last acceptable instant when islanding is effective for preventing instability, as illustrated in Figure 1. Hence, CIT is the maximum time for implementing a controlled islanding strategy, that is, the maximum time when islanding can still save the power system (i.e., all islands split) from instability.
If CIT = 0, the controlled islanding strategy would lead to transiently stable or unstable islands in a given power system, which is a critical margin of CIT. For identification of the transiently stable or unstable splitting strategies, CIT = 0 is employed for a transiently unstable strategy and CIT = 0+ for a transiently stable one in this paper. If CIT ≥ 0+, the islanding strategy would lead to transiently stable islands in the power system. The larger the CIT, the more time for implementing the splitting strategy, and the larger the stability margin of islanding. Hence, the appropriate islanding time should be within the time period from critical clearing time TCC to the final acceptable time for islanding TCI, which is defined as the stable islanding interval (SII). In this interval, the splitting strategy will lead to stable islands. If the splitting implementation time is earlier than TCC, the time for implementing the splitting strategy will be too early since the fault may be cleared before TCC and is unexpected. So, the non-expected islanding interval (NII) is defined as the time period from the fault starting time TFS to its TCC. If the islanding time is larger than the final acceptable time for islanding TCI, the time for implementing a splitting strategy is too late because the power system will lose stability. Hence, the unstable islanding interval (UII) is defined as the time period after TCI. In sum, critical islanding time (CIT), stable islanding interval (SII), and non-expected islanding interval (NII), which are focused by power dispatchers in power system operations, can be defined as follows.
Definition 1.
Critical islanding time (CIT) is the maximum time for implementing an islanding strategy (i.e., the maximum time when islanding can still save the system).
Definition 2.
Stable islanding interval (SII) is the time period from critical clearing time to the final acceptable time for islanding.
Definition 3.
Non-expected islanding interval (NII) is the time period from the fault starting time to its critical clearing time.
In this paper, the step-by-step time-domain simulation method and trial-and-error method are employed to check the transient stability index of the power system after islanding, such as calculating CCT and CIT. In practical implementation, we envisage using one of the fast, direct methods for transient stability assessment.

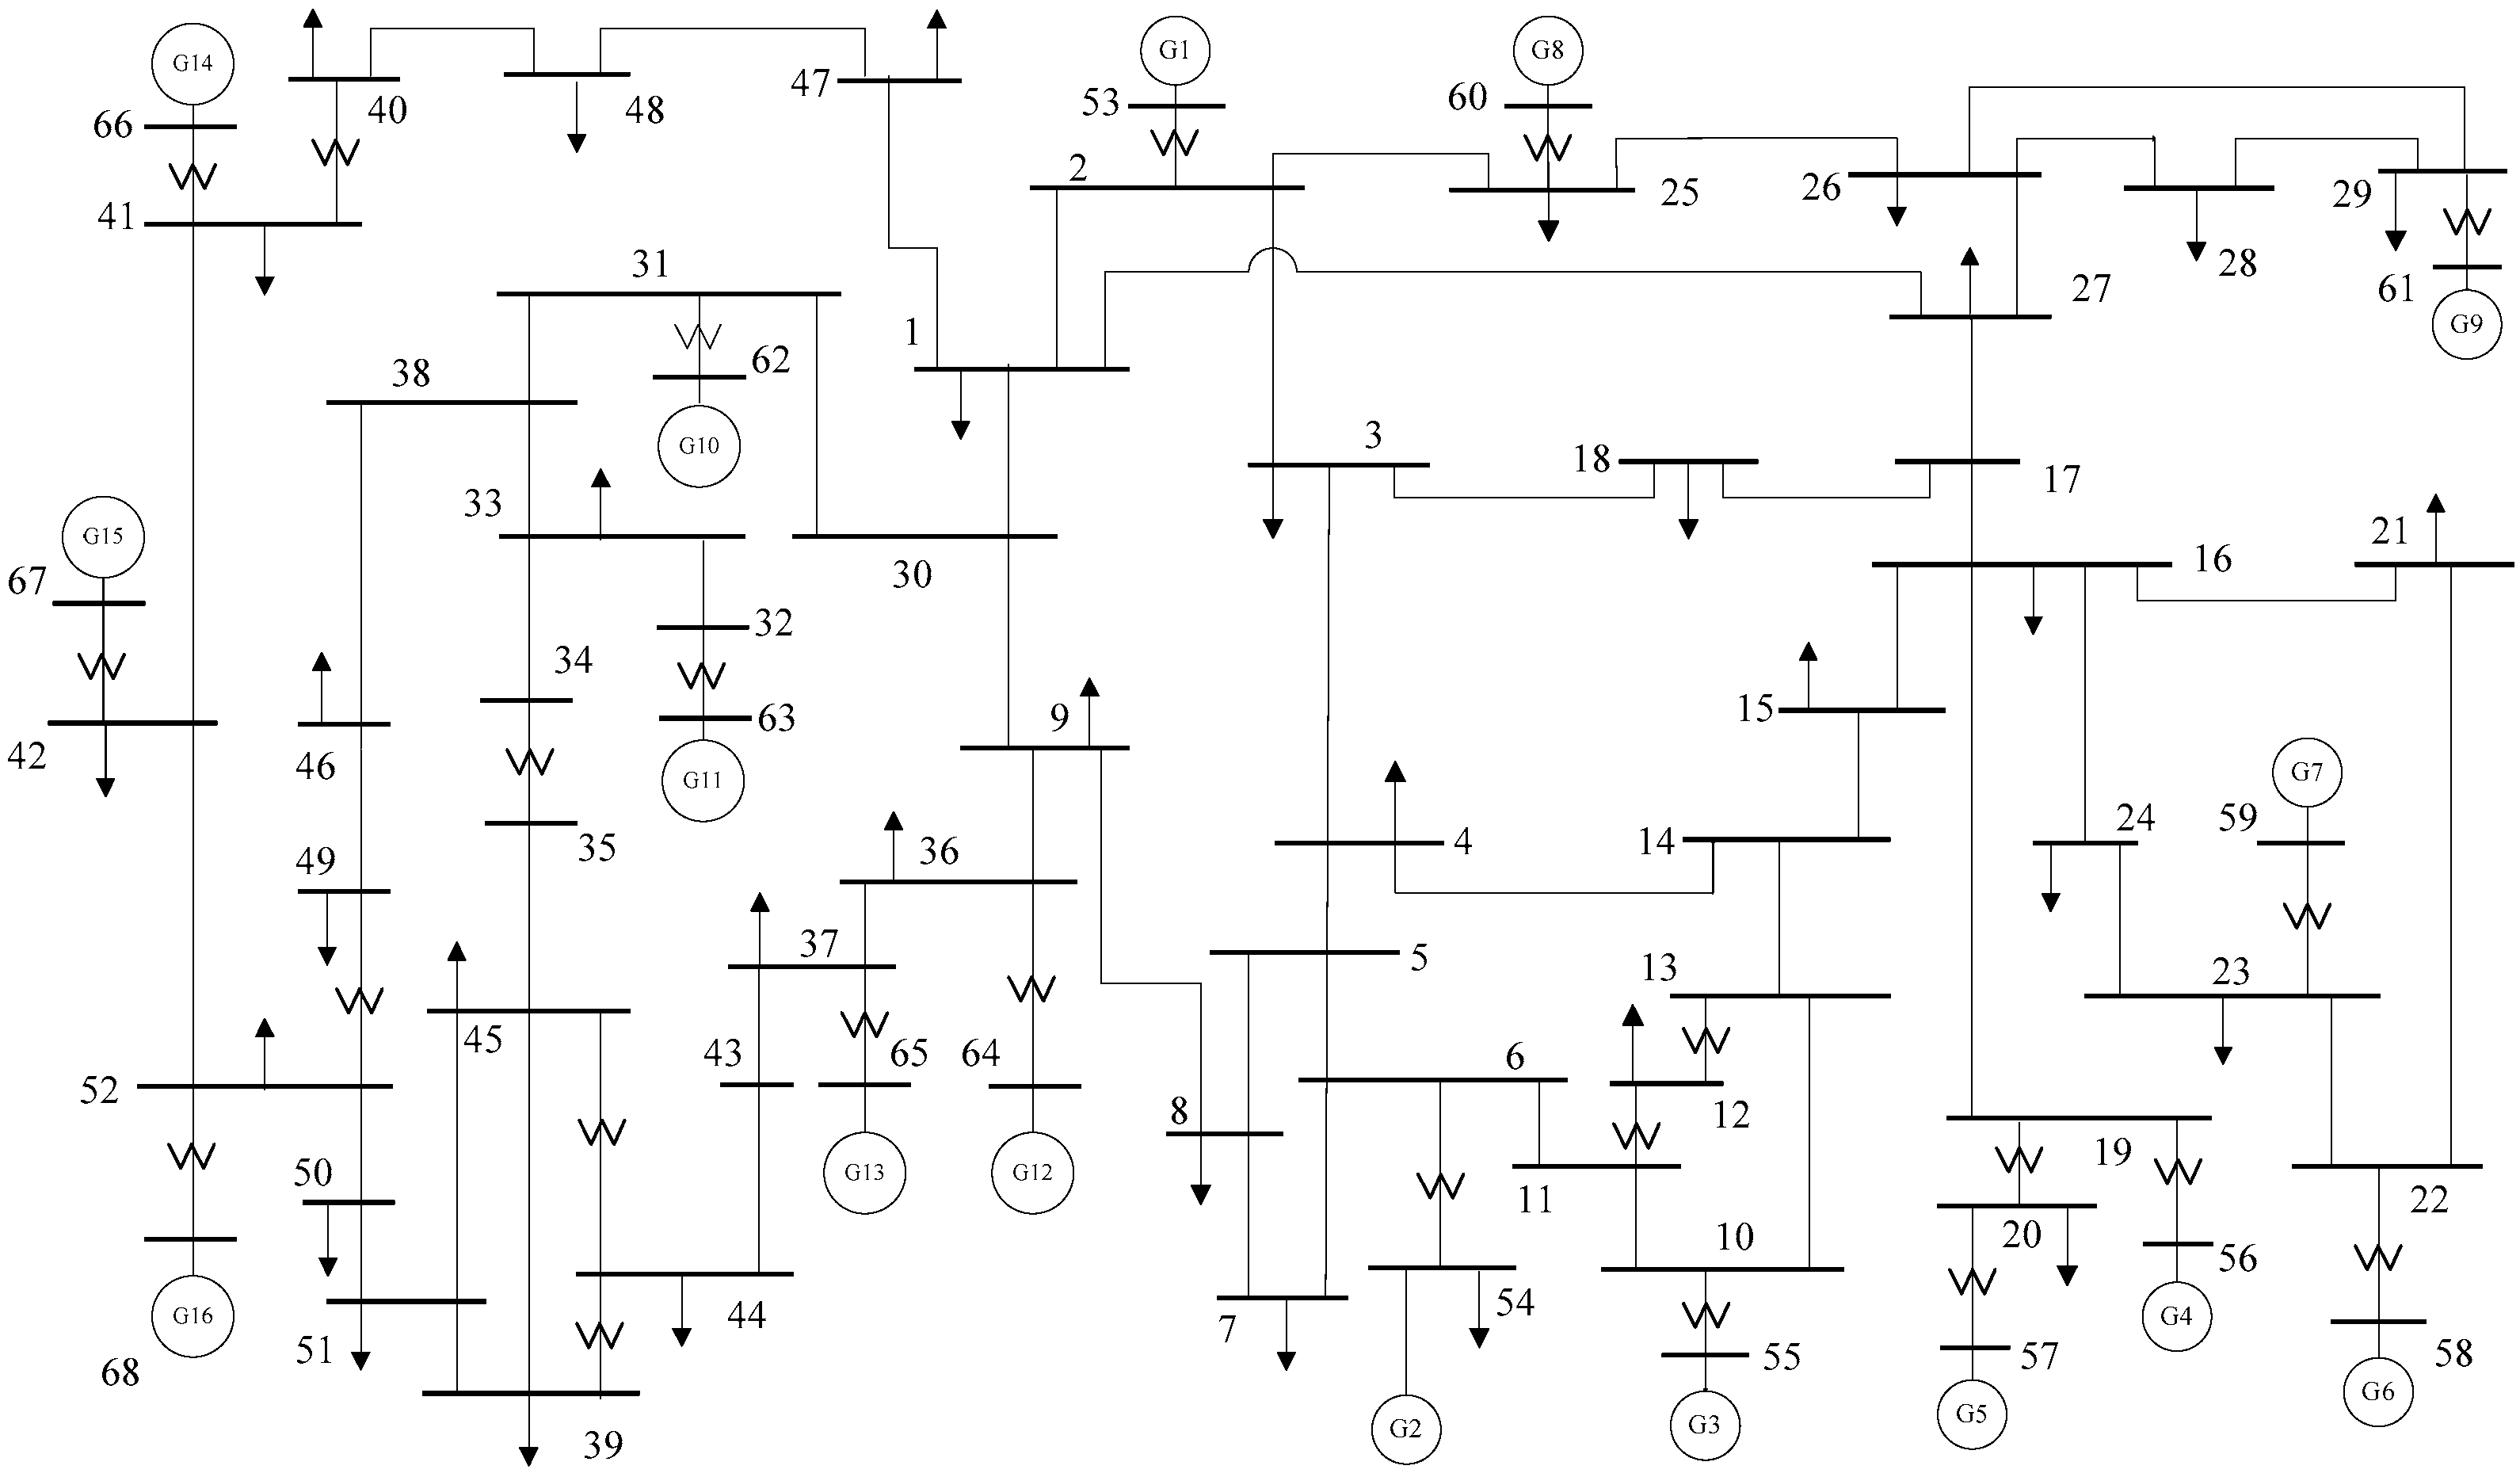
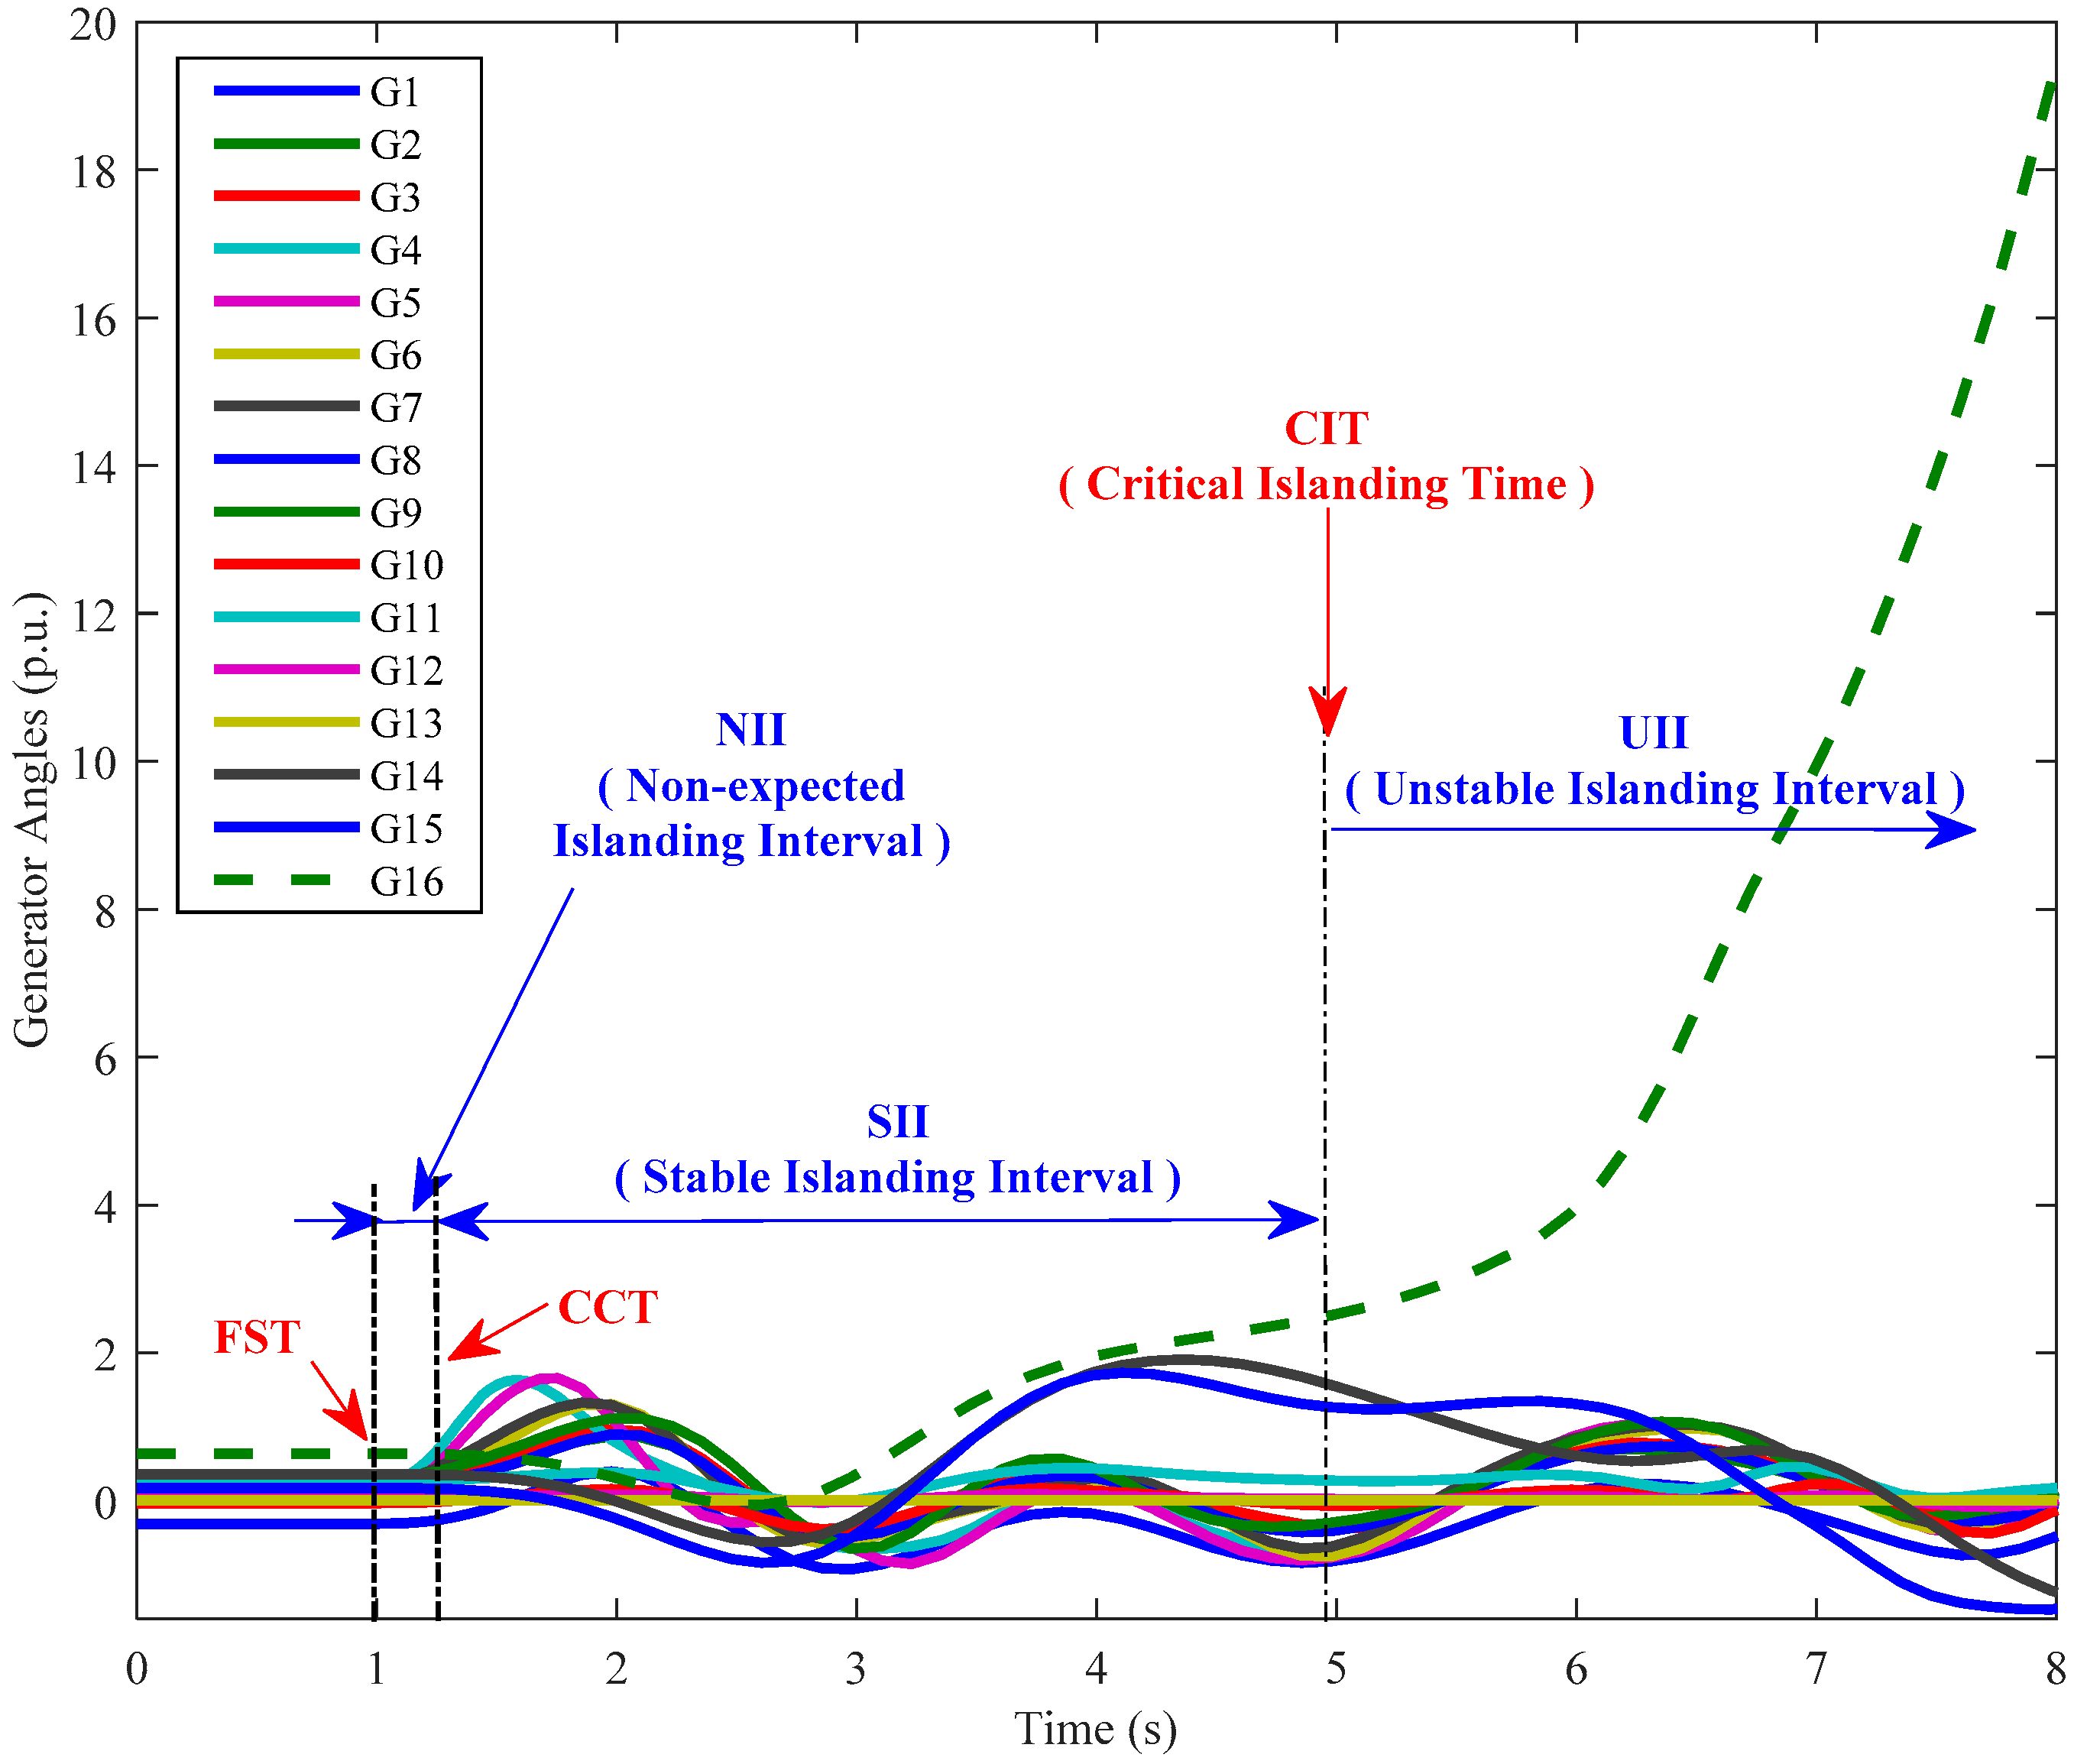
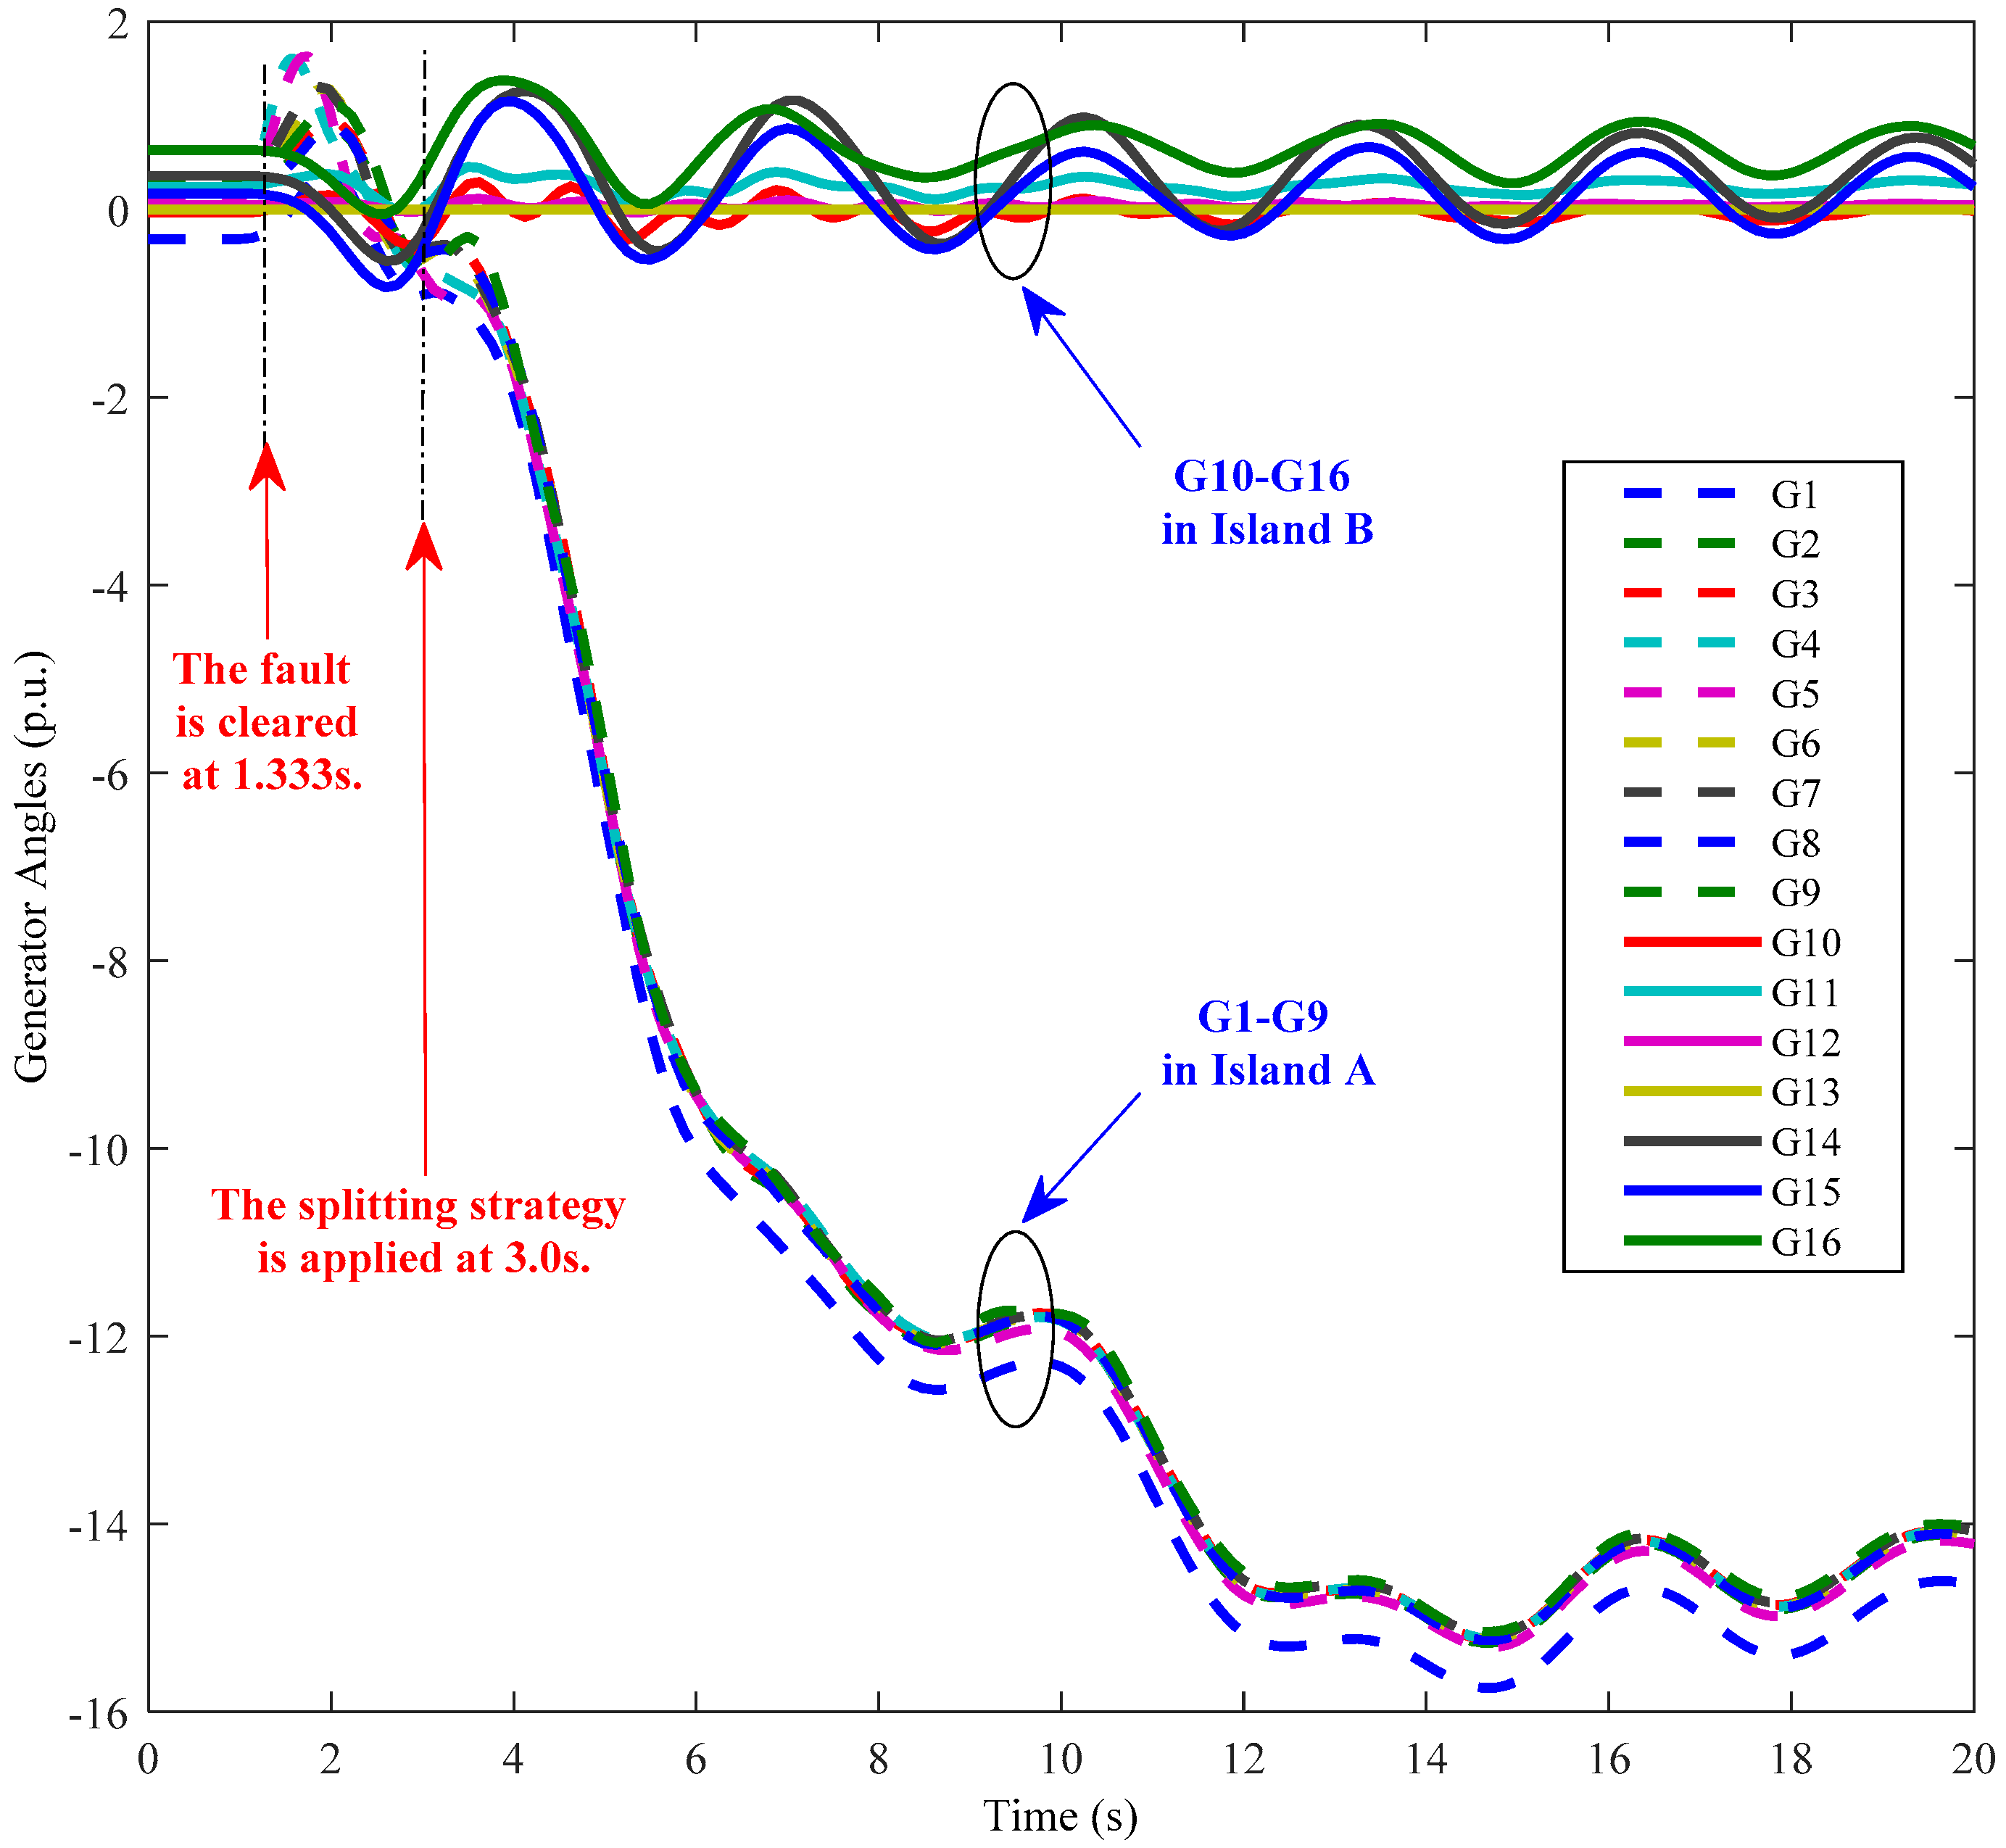
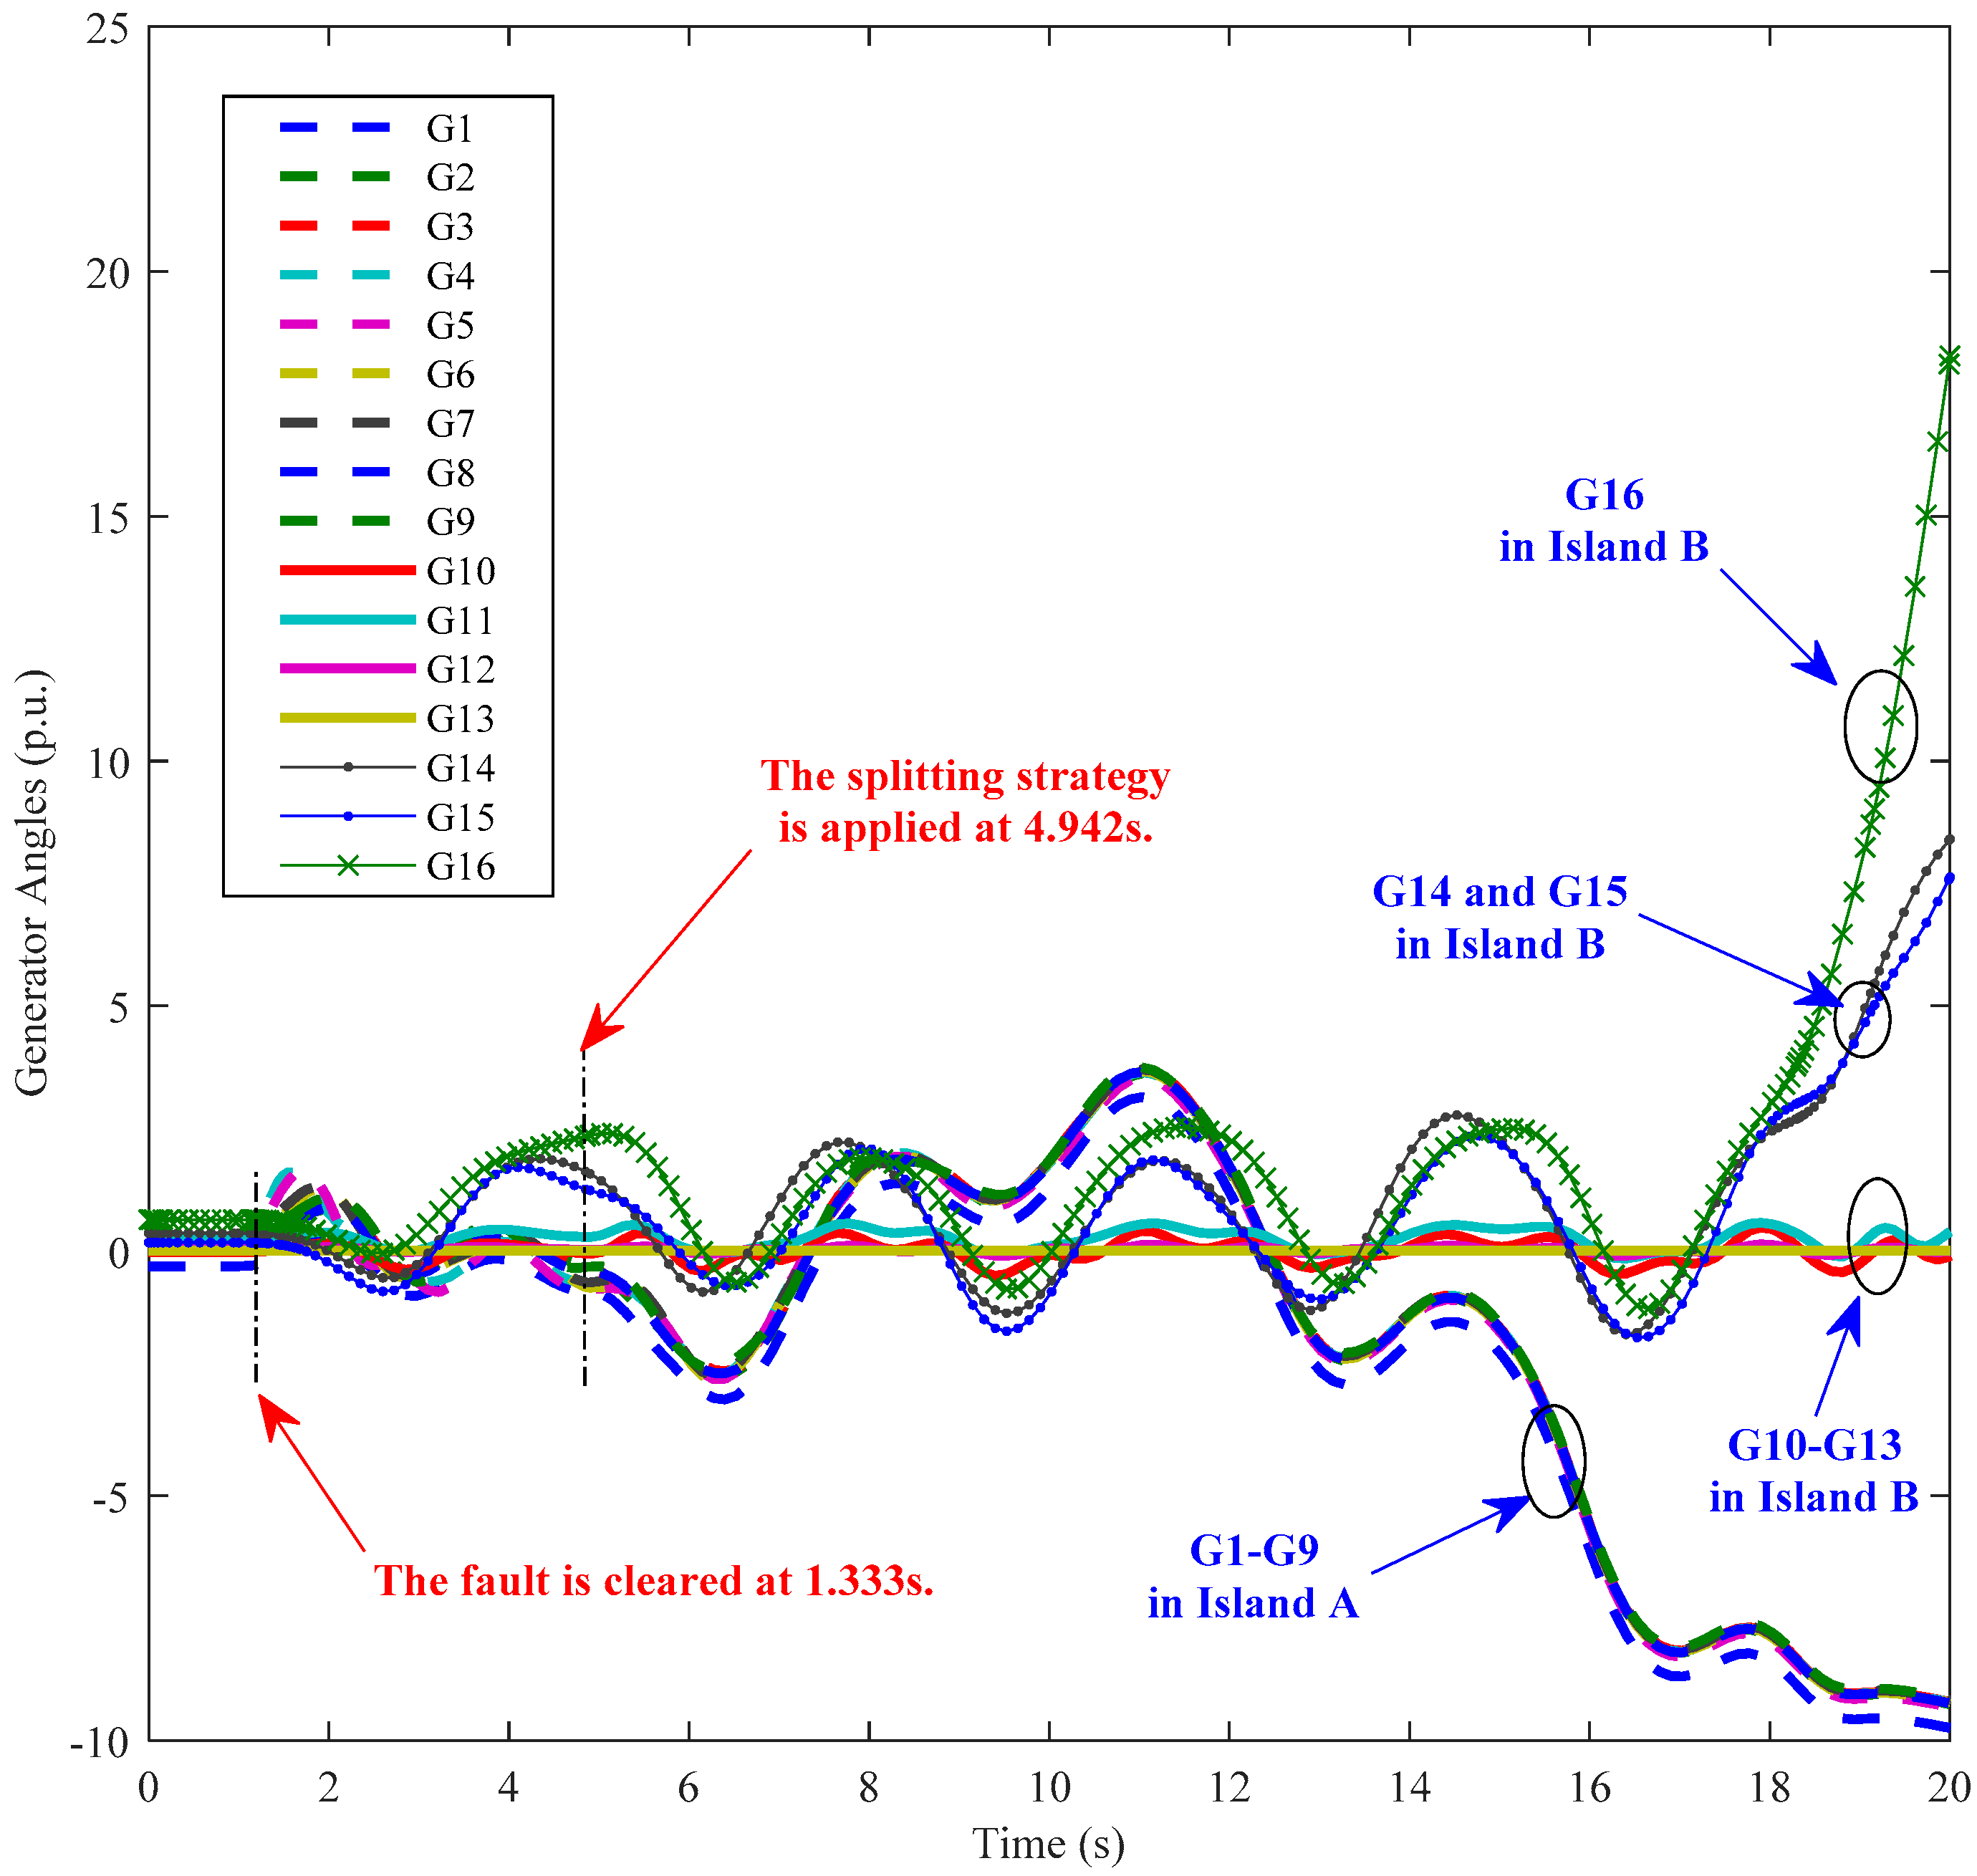
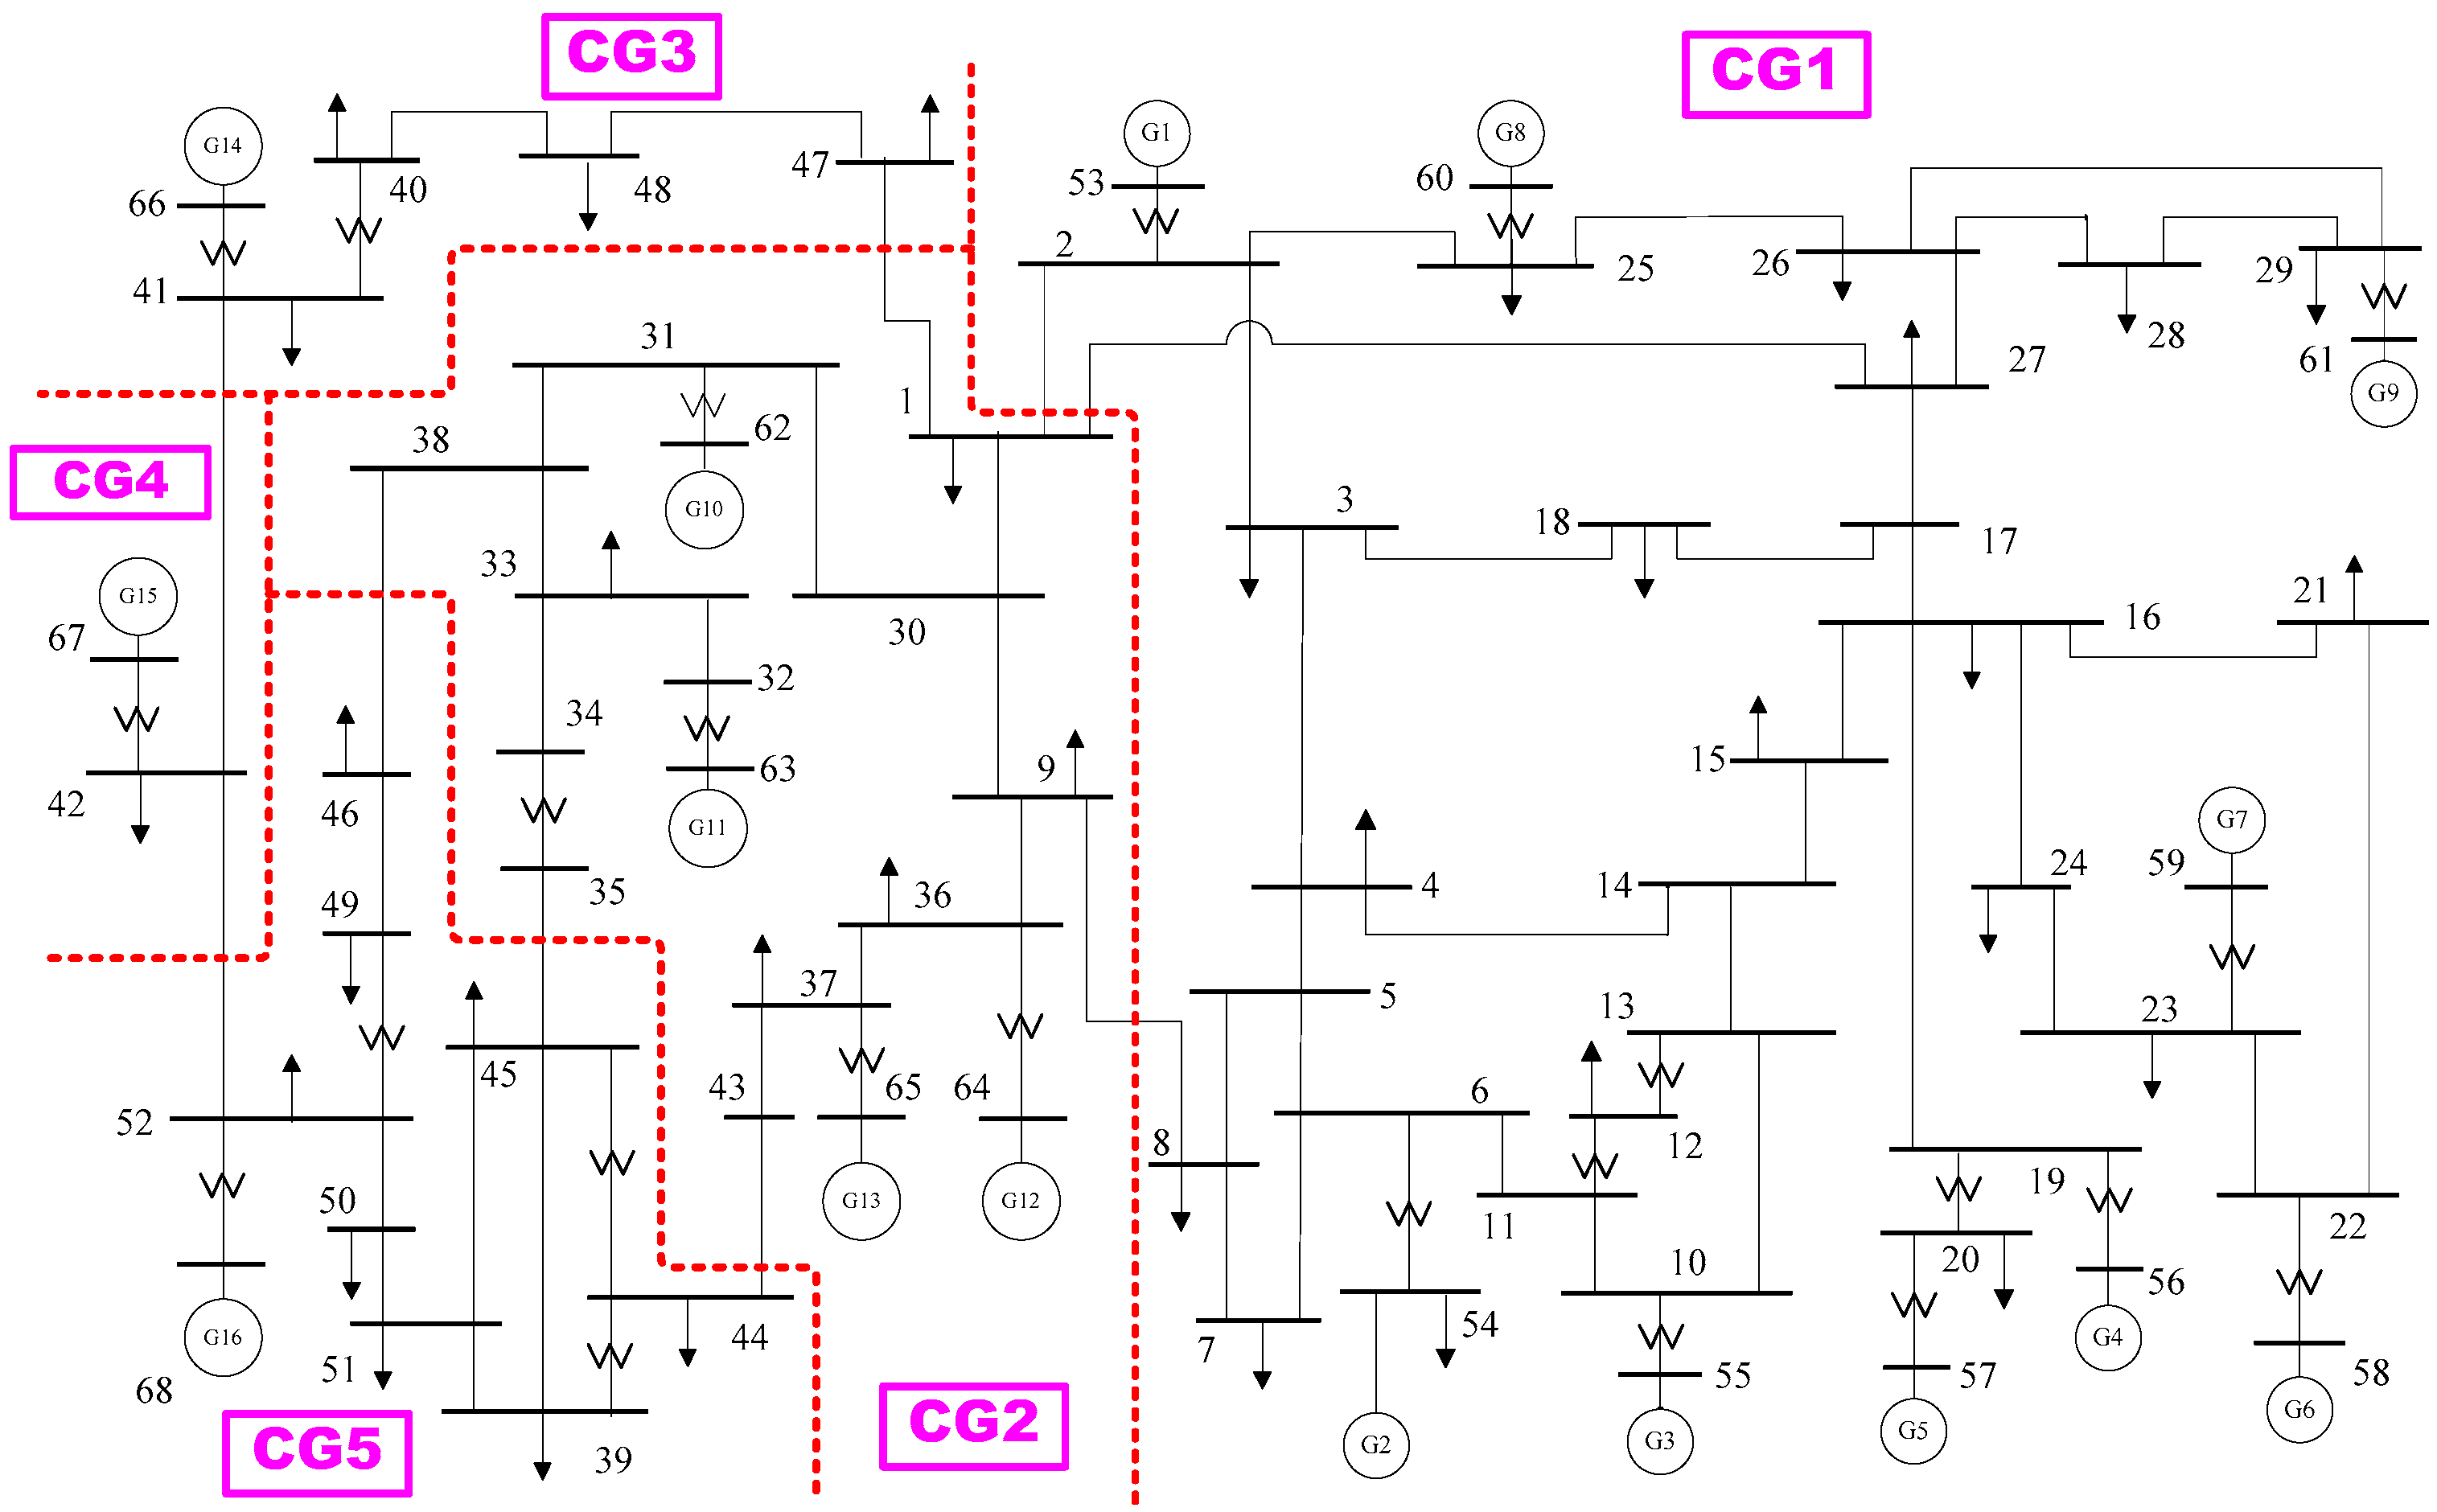
3. Simulation Results

The 68-bus New England test system (NETS)–New York (NYPS) interconnected system [34] consists of 16 generators, as shown in Figure 2. Generators G1–G9 are in New England, and G10–G16 in New York and its neighborhood. In the power system, the four-order generator model was used for all the generators. The detailed data associated with this power system can be found in Reference [20]. The simulations were performed on a laptop with Intel® Core(TM) i5-5200U CPU @ 2.20 GHz, 8 GB 2400 MHZ DDR4 memory (Lenovo, Beijing, China), and the computing environment was MATLAB 2016a (MathWorks, Natick, MA, USA). The power system analysis toolbox (PSAT) developed by Federico Milano [35] was utilized to perform time domain simulation to identify the transient stability of power systems.
For easy and clear demonstration, it was assumed that the splitting strategy for the interconnected power system was to disconnect the interconnection lines (i.e., Lines 1–2, 1–27, and 8–9) between NETS and NYPS. So, the whole interconnected system was split into two islands, the NETS island (Island A with G1–G9) and the NYPS island (Island B with G10–G16), and Bus 19 was taken as an example for demonstrating the relationships among CCT, CIT, NII, SII, and UII, which are shown in Figure 3. As shown in Figure 3, the fault was applied in bus 19 at fault starting time 1.0 s; the CCT was equal to 0.332 s after fault starting time; and the CIT was equal to 3.609 s after the CCT. Furthermore, the NII, SII, and UII were (1.0 s, 1.332 s], (1.332 s, 4.941 s], and (4.941 s, +∞) respectively. If the splitting strategy were implemented before 1.332 s, it would lead to unnecessary splitting because the fault might be cleared before its CCT. If the splitting strategy were implemented after 4.941 s, the power system would not maintain a transiently stable state even if the splitting strategy was implemented. If the splitting strategy were implemented within the SII (1.332 s, 4.941 s], the two islands split would be transiently stable.
Suppose that the fault applied at 1.0 s in bus 19 was cleared at 1.333 s, which is just beyond its CCT. The splitting strategy was applied at 3.0 s, which is within its CIT. Figure 4 shows the angle curves of the generators when the splitting strategy was applied. It can be seen that the interconnected power system was split into two islands, Island A (with G1–G9) and Island B (with G10–G16), and the generators in each island remained synchronous, which means that each island was transiently stable after splitting.
Next, suppose that the same splitting strategy was applied at 4.942 s, which is just beyond its CIT. Figure 5 shows the angle curves of the generators. It can be seen that Island A, with G1–G9, stayed transiently stable after splitting, but Island B, with G10–G16, could not stay transiently stable because there are three coherent groups in Island B (i.e., G16, G14–G15, and G10–G13), and different groups oscillate with each other.
After the above demonstration, the slow coherency-based controlled islanding method was employed to determine the splitting strategies and their new transient stability indicators for the 68-bus New England test system (NETS)–New York (NYPS) interconnected system. Using the slow coherency-based islanding method, 16 generators were divided into five coherent groups, as follows:
  • Coherent Group 1 (CG1): G1–G9;
  • Coherent Group 2 (CG2): G10–G13;
  • Coherent Group 3 (CG3): G14;
  • Coherent Group 4 (CG4): G15;
  • Coherent Group 5 (CG5): G16.
Figure 6 shows five coherent groups of generators in a 16-generator 68-bus power system, and the optimal cut sets among these coherent groups of generators. Thus, the optimal islanding strategy obtained by the traditional method was to split the power system into five islands, and its optimal cut set was {1–2, 1–27, 8–9, 1–47, 38–46, 35–45, 43–44, 41–42, 42–52}.
Then, all cases (i.e., faults in every node) were tested to demonstrate the presented indicator of transient stability for the splitting strategy, and the results are shown in Table 1. It can be seen from Table 1 that the CITs for the faults in Buses 1, 7, 8, 20, 25–28, 30–35, 38–40, 43–45, 50, 51, 57, 60, and 62 were equal to 0, which means that the splitting strategies could not maintain the transient stability of the power systems, even after the splitting strategies were utilized. Therefore, the other control strategies should be considered for maintaining the transient stability of the power systems. The CCTs for the faults in Buses 12 and 46–49 were larger than 20 s, which means that the transient stability of the power system was maintained for these cases, so the splitting strategies were not required. The CITs for the faults in the other buses were different for the splitting strategies, so the different time that is appropriate to execute the splitting strategies should be taken for various faults in the power system. Furthermore, the different SIIs which are appropriate to execute the splitting strategies are also given for various faults in the power system, which are beneficial to power dispatchers for keeping the power system transiently stable and preventing widespread blackouts.

4. Conclusions

This paper presents a new indicator, critical islanding time (CIT), for determining whether the islands attained are transiently stable when a splitting strategy is implemented as the last resort for preventing a cascading event and/or a large area blackout from occurring. Slow coherency-based controlled islanding strategies are given for checking the presented CIT indicator, and the stable islanding interval (SII) is also defined for determining the time period from critical clearing time to the final acceptable time for islanding. Simulation results of the 68-bus New England test system (NETS)–New York (NYPS) interconnected system showed that CIT can reflect the transient stability of splitting strategies for power systems, and determine a time interval (i.e., SII) for implementing the splitting strategies which could keep the islands created transiently stable. The simulation results showed that the answer for when to island could be easily reflected by the proposed CIT and SII indicators, and two indicators are beneficial to power dispatchers for keeping the power systems transiently stable and preventing widespread blackouts.

Author Contributions

Z.L. and F.W. conceptualized the study; Z.L., Y.Z., and S.L. performed the analyses; H.Z., H.W., and Y.D. acquired funding; Z.L., Y.Z., and S.L. performed investigations; H.Z., H.W., and C.H. acquired resources; Z.L., Y.Z., and S.L. wrote the original draft; and F.W., Y.D., H.Z., and L.Y. reviewed and edited the manuscript.

Funding

This research was jointly funded by Zhejiang Provincial Natural Science Foundation of China grant number LY17E070003, National Natural Science Foundation of China grant number 51777185, and Science and Technology project of State Grid Corporation of China grant number 52110418000V.

Acknowledgments

The first author would like to thank Janusz Bialek for his assistance and Engineering and Physical Science Research Council (EPSRC) grant number EP/G060169/1 for support when he visited Durham University.

Conflicts of Interest

The authors declare no conflict of interest.

References

  1. Vahidnia, A.; Ledwich, G.; Palmer, E.; Ghosh, A. Generator coherency and area detection in large power systems. IET Gener. Trans. Distrib. 2012, 6, 874–883. [Google Scholar] [CrossRef] [Green Version]
  2. Bai, F.F.; Liu, Y.; Liu, Y.L.; Sun, K.; Bhatt, N.; Rosso, A.D.; Farantatos, E. A measurement-based approach for power system instability early warning. Prot. Control Mod. Power Syst. 2016, 1, 17–25. [Google Scholar] [CrossRef]
  3. Huang, J.H.; Ge, S.Y.; Han, J.; Li, H.; Zhou, X.M.; Liu, H.; Wang, B.; Chen, Z.F. A diagnostic method for distribution networks based on power supply safety standards. Prot. Control Mod. Power Syst. 2016, 1, 1–8. [Google Scholar] [CrossRef]
  4. Sun, K.; Zheng, D.; Lu, Q. Splitting strategies for islanding operation of large-scale power systems using OBDD-based methods. IEEE Trans. Power Syst. 2003, 18, 912–923. [Google Scholar] [CrossRef]
  5. Franco, R.; Sena, C.; Taranto, G.N.; Giusto, A. Using synchrophasors for controlled islanding—A prospective application for the Uruguayan power system. IEEE Trans. Power Syst. 2013, 28, 2016–2024. [Google Scholar] [CrossRef]
  6. You, H.; Vittal, V.; Wang, X.M. Slow coherency-based islanding. IEEE Trans. Power Syst. 2004, 19, 483–491. [Google Scholar] [CrossRef]
  7. Han, C.; Zhao, Y.; Lin, Z.; Ding, Y.; Yang, L.; Lin, G.; Mo, T.; Ye, X. Critical lines identification for skeleton-network of power systems under extreme weather conditions based on the modified VIKOR method. Energies 2018, 11, 1355. [Google Scholar] [CrossRef]
  8. Song, H.; Wu, J.; Wu, K. A wide-area measurement systems-based adaptive strategy for controlled islanding in bulk power systems. Energies 2014, 7, 2631–2657. [Google Scholar] [CrossRef]
  9. Arraño-Vargas, F.; Rahmann, C.; Valencia, F.; Vargas, L. Active splitting in longitudinal power systems based on a WAMPC. Energies 2018, 11, 51. [Google Scholar] [CrossRef]
  10. Zhao, Y.; Lin, Z.; Ding, Y.; Liu, Y.; Sun, L.; Yan, Y. A model predictive control based generator start-up optimization strategy for restoration with microgrids as black-start resources. IEEE Trans. Power Syst. 2018, 33, 7189–7203. [Google Scholar] [CrossRef]
  11. Goo, B.; Hur, J. Estimation for expected energy not served of power systems using the screening methodology of cascading outages in south Korea. Energies 2018, 11, 81. [Google Scholar] [CrossRef]
  12. Lin, Z.; Wen, F.; Ding, Y.; Xue, Y. Data-driven coherency identification for generators based on spectral clustering. IEEE Trans. Ind. Inform. 2018, 14, 1275–1285. [Google Scholar] [CrossRef]
  13. Sun, K.; Zheng, D.; Lu, Q. A simulation study of OBDD-based proper splitting strategies for power systems under consideration of transient stability. IEEE Trans. Power Syst. 2005, 2, 389–399. [Google Scholar] [CrossRef]
  14. Wang, C.G.; Zhang, B.H.; Hao, Z.G.; Shu, J.P.; Li, P.; Bo, Z.Q. A novel real-time searching method for power system splitting boundary. IEEE Trans. Syst. 2010, 11, 1902–1909. [Google Scholar] [CrossRef]
  15. Ding, L.; Gonzalez-Longatt, F.M.; Wall, P.; Terzija, V. Two-step spectral clustering controlled islanding algorithm. IEEE Trans. Power Syst. 2013, 2, 75–84. [Google Scholar] [CrossRef]
  16. Sanchez-Garcia, R.J.; Fennelly, M.; Norris, S.; Wright, N.; Niblo, G.; Brodzki, J.; Bialek, J.W. Hierarchical spectral clustering of power grids. IEEE Trans. Power Syst. 2014, 9, 2229–2237. [Google Scholar] [CrossRef]
  17. Yang, B.; Vittal, V.; Heydt, G.T. Slow-coherency-based controlled islanding-a demonstration of the approach on the August 14, 2003 blackout scenario. IEEE Trans. Power Syst. 2006, 21, 1840–1847. [Google Scholar] [CrossRef]
  18. Senroy, N.; Heydt, G.T.; Vittal, V. Decision tree assisted controlled islanding. IEEE Trans. Power Syst. 2006, 21, 1790–1797. [Google Scholar] [CrossRef]
  19. Xu, G.Y.; Vittal, V. Slow coherency based cutset determination algorithm for large power systems. IEEE Trans. Power Syst. 2010, 25, 877–884. [Google Scholar] [CrossRef]
  20. Rogers, G. Power System Oscillations; Kluwer Academic Publishers: Boston, MA, USA, 2000. [Google Scholar]
  21. Machowski, J.; Bialek, J.W.; Bumby, J.R. Power System Dynamics: Stability and Control; John Wiley & Sons: West Sussex, UK, 2008. [Google Scholar]
  22. Jonsson, M.; Begovic, M.; Daalder, J. A new method suitable for real-time generator coherency determination. IEEE Trans. Power Syst. 2004, 19, 1473–1482. [Google Scholar] [CrossRef]
  23. Lin, Z.; Wen, F.; Ding, Y.; Xue, Y.; Liu, S.; Zhao, Y.; Yi, S. WAMS-based Coherency Detection for Situational Awareness in Power Systems with Renewables. IEEE Trans. Power Syst. 2018, 33, 5410–5426. [Google Scholar] [CrossRef]
  24. Ramaswamy, G.N.; Verghese, G.C.; Rouco, L.; Vialas, C.; DeMarco, C.L. Synchrony, aggregation, and multi-area eigenanalysis. IEEE Trans. Power Syst. 1995, 10, 1986–1993. [Google Scholar] [CrossRef]
  25. Chow, J.H. A nonlinear model reduction formulation for power system slow coherency and aggregation. Lect. Notes Contr. Inf. Sci. 1996, 208, 282–298. [Google Scholar]
  26. Lo, K.; Qi, Z.; Xiao, D. Identification of coherent generators by spectrum analysis. IEE Proc Gener. Transm. Distr. 1995, 142, 367–371. [Google Scholar] [CrossRef]
  27. Senroy, N. Generator coherency using the Hilbert–Huang transform. IEEE Trans. Power Syst. 2008, 23, 1701–1708. [Google Scholar] [CrossRef]
  28. Anaparthi, K.; Chaudhuri, B.; Thornhill, N.; Pal, B.C. Coherency identification in power systems through principal component analysis. IEEE Trans. Power Syst. 2005, 20, 1658–1660. [Google Scholar] [CrossRef]
  29. Ariff, M.A.M.; Pal, B.C. Coherency identification in interconnected power system-an independent component analysis approach. IEEE Trans. Power Syst. 2013, 28, 1747–1755. [Google Scholar] [CrossRef]
  30. Chow, J.H. Slow coherency and weak connections. Lect. Notes Contr. Inf. Sci. 1982, 46, 127–151. [Google Scholar]
  31. Chow, J.H. New algorithms for slow coherency aggregation of large power systems. Pro. Workshop Syst. Control Theory Power Syst. 1995, 64, 95–116. [Google Scholar]
  32. Joo, S.K.; Liu, C.C.; Jones, L.E.; Choe, J.W. Coherency and aggregation techniques incorporating rotor and voltage dynamics. IEEE Trans. Power Syst. 2004, 19, 1068–1075. [Google Scholar] [CrossRef]
  33. Liu, L.; Liu, L.; Cartes, D.A. Slow coherency and angle modulated particle swarm optimization based islanding of large scale power systems. Adv. Eng. Inform. 2009, 23, 45–56. [Google Scholar] [CrossRef]
  34. Lin, Z.; Wen, F.; Ding, Y.; Xue, Y. Wide-area coherency identification of generators in interconnected power systems with renewables. IET Gener. Trans. Distrib. 2017, 11, 4444–4455. [Google Scholar] [CrossRef]
  35. Milano, F. Advances in Power System Modelling, Control and Stability Analysis; IET: London, UK, 2016. [Google Scholar]
Figure 1. Critical islanding time (CIT) and stable islanding interval for controlled islanding. CCT: Critical clearing time.
Energies 11 02975 g001
Figure 2. The 68-bus New England test system (NETS)–New York (NYPS) interconnected system.
Energies 11 02975 g002
Figure 3. Demonstration on CCT, CIT, NII, SII, and UII for splitting strategies.
Energies 11 02975 g003
Figure 4. Generator angles of the power system after splitting within CIT.
Energies 11 02975 g004
Figure 5. Generator angles of the power system after splitting beyond CIT.
Energies 11 02975 g005
Figure 6. The splitting strategies for the NETS–NYPS interconnected power system.
Energies 11 02975 g006
Table 1. The results of CCT, CIT, and SII for all cases of the NETS–NYPS interconnected power system.
Fault Bus No.CCT (s)CIT (s)SII (s)Fault Bus No.CCT (s)CIT (s)SII (s)
10.5290(1.529, 1.529]350.660(1.660, 1.660]
20.4522.162(1.452, 3.614]360.2772.248(1.277, 3.525]
30.4152.208(1.415, 3.623]370.2352.371(1.235, 3.606]
40.4112.229(1.411, 3.640]380.7900(1.790, 1.790]
50.3852.274(1.385, 3.659]392.1920(2.192, 3.192]
60.3692.294(1.369, 3.663]402.6410(2.641, 3.641]
70.4560(1.456, 1.456]410.5380.190(1.538, 1.728]
80.4480(1.448, 1.448]420.7110.804(1.711, 2.515]
90.4442.061(1.444, 3.505]430.7990(1.799, 1.799]
100.3862.315(1.386, 3.701]443.9050(3.905, 4.905]
110.4102.283(1.410, 3.693]450.7650(1.765, 1.765]
12>2046>20
130.4252.271(1.425, 3.696]47>20
140.4162.235(1.416, 3.651]48>20
150.3982.238(1.398, 3.636]49>20
160.2772.317(1.277, 3.594]500.6580(1.658, 1.658]
170.3372.259(1.337, 3.596]510.7390(1.739, 1.739]
180.4152.214(1.415, 3.629]520.2260.248(1.226, 1.474]
190.3322.378(1.332, 3.710]530.6532.062(1.653, 3.715]
200.3630(1.363, 1.363]540.4302.487(1.430, 3.917]
210.3792.320(1.379, 3.699]550.4052.455(1.405, 3.860]
220.3352.404(1.335, 3.739]560.3492.437(1.349, 3.786]
230.3572.395(1.357, 3.752]570.3710(1.371, 1.371]
240.3512.296(1.351, 3.647]580.3772.445(1.377, 3.822]
250.3620(1.362, 1.362]590.3832.517(1.383, 3.900]
260.3720(1.372, 1.372]600.3600(1.360, 1.360]
270.4250(1.425, 1.425]610.3052.655(1.305, 3.960]
280.3910(1.391, 1.391]620.4700(1.470, 1.470]
290.3372.649(1.337, 3.986]630.2830.605(1.283, 1.888]
300.4150(1.415, 1.415]640.3712.282(1.371, 3.653]
310.4520(1.452, 1.452]650.1602.34(1.160, 3.500]
320.2890(1.289, 1.289]660.3750.505(1.375, 1.880]
330.3550(1.355, 1.355]670.4064.164(1.406, 5.570]
340.4360(1.436, 1.436]680.1840.364(1.184, 1.548]

