Article

Influence of Wind Power on Intraday Electricity Spot Market: A Comparative Study Based on Real Data

by
Pedro M. S. Frade
1,2,
João V. G. A. Vieira-Costa
3,
Gerardo J. Osório
4,
João J. E. Santana
5 and
João P. S. Catalão
4,5,6,*
1
REN—Redes Energéticas Nacionais, SGPS, S.A, Av. dos Estados Unidos da America, 1749-061 Lisbon, Portugal
2
Instituto Superior Técnico, University of Lisbon, 1049-001 Lisbon, Portugal
3
Faculty of Engineering of the University of Porto, 4200-465 Porto, Portugal
4
C-MAST, University of Beira Interior, 6201-001 Covilhã, Portugal
5
INESC-ID, Instituto Superior Técnico, University of Lisbon, 1049-001 Lisbon, Portugal
6
INESC TEC and the Faculty of Engineering of the University of Porto, 4200-465 Porto, Portugal
*
Author to whom correspondence should be addressed.
Energies 2018, 11(11), 2974; https://doi.org/10.3390/en11112974
Submission received: 7 October 2018 / Revised: 25 October 2018 / Accepted: 30 October 2018 / Published: 1 November 2018

Abstract

:
Overtime, in the electricity sector, there has been a technological transfer to renewable electricity generation. With this change, processes, in the economic and availability terms, are expected to improve. In this new paradigm, society demands electricity without an impact on the environment and with the lowest possible cost. The wind power (WP) integration appears in this evolution process by achieving important technological advances, supporting in 2017 a growth of 44% of new projects in Europe, higher than any other renewable technology. However, the renewable energy sources (RES) integration in the electricity networks still presents technical difficulties and challenges, leading to challenges in the electricity markets (EMs). Therefore, this work evaluates the importance of WP and its influence on the Iberian Electricity Market (MIBEL), at the level of the intraday electricity spot market (IESM). This is an innovative study because literature usually focuses on day-ahead WP impact and this study focuses on intraday markets, which are closer to the consumption periods. The goal was to make an analysis on the impacts when betting on WP sources, in order to improve the market interaction with WP integration, considering as criteria the consumer satisfaction, in terms of lower electricity prices and WP availability. For this study, the market bids registered by the Iberian Electricity Market Operator (OMIE), from 2015 to 2017, ran over a new market simulator, specially developed for this proposal, considering a virtual market condition, but not considering the bids made by WP producers. The comparison of the results allowed the evaluation of the WP influence on the EM quantitative, which is noteworthy.

1. Introduction

Electricity production is currently considered a basic human activity since it is already related to many essential human activities, from social, health, security, transmission, and other structures’ backgrounds. As evidence of the human energy needs, the historical and predicted allocation for energy consumption of the different primary sources are described, as characterized by the US Energy Information Administration [1].
From the US report, it is evident that fossil resources are still in ascending consumption, together with natural gas and renewable resources, for a period from 2015 to 2040. The same idea is also shown in Reference [2] where a study achieved similar results for the worldwide primary energy consumption, where it is also described that human dependence is closely related to the growing consumption of electricity and the ways in which it is produced. It should be noted that in this study, 18% of worldwide needs for electricity are satisfied through nuclear resources.
However, nuclear power plants take superior effort to be integrated into the transmission networks due to the long periods of start-up and stabilization and also due to technical restrictions, since nuclear generation is not allowed to change abruptly. When in operation, nuclear generation is therefore used as the grid’s power base and energy is usually contracted in advance, in bilateral contracts or in future markets [3].
For the Portuguese and Spanish electricity production, and its dependency on conventional generation, the historical distribution and trend is similar to the ones described before, however, the integration of RES in the electricity production is prominent. In particular, for the Portuguese case, there is a strengthening of the bet on RES that has partly replaced the non-renewable production, with the goal of reducing the import balance [4,5]. The same can be observed for the Spanish case [6]. As an example, according to the data from the Portuguese Transmission System Operator (TSO)—Redes Energéticas Nacionais (REN) [7], during a period of 106 consecutive hours, from 11–17 February 2016, the electricity consumption in Portugal was totally satisfied with RES.
The worldwide installed capacity of WP generation had, at the end of 2016, a total global capacity of 454.4 GW, and of 168.7 GW in 2017, in Europe [8,9]. According to WindEurope [9], wind energy production is currently the most competitive in Europe. In 2017, with the new electricity production in Europe, wind technology accounted up to 44% of integration, more than any other technology. The presence of WP in electricity networks has beneficial impacts [10], reducing the needs for non-renewable resources and also reducing the polluting effects. Moreover, WP integration helps in the reduction of operational costs, considering that less fuel will be consumed through conventional generation, and consequently emissions are reduced. Hence, WP also has capacity value for electricity systems.
However, the possible negative impacts of WP integration should be evaluated in order to ensure that WP integration, along with its considerable benefits, are not impaired, and also to ensure the availability through the system operation [11]. The limited predictability and high inter-temporal variations of WP resources cause a complete spectrum of problems, ranging from shorter-term frequency shifts to long-term balancing problems, which involve a considerable number of new challenges and additional constraints to the operation of the system [12].
According to WindEurope [9], WP integration supports more than 11% of Europe’s electricity demand. By 2030, this integration is expected to increase to about 25% and become the backbone of the European electricity system. Also, in the framework of RES, a reinforcement of the role of WP integration is expected [13]. Considering the present and future rational use of fresh water, due to the increasing scarcity of fresh water, consequence of the ever-greater demand for human consumption, massive short-term limitations in the operation of hydroelectric power stations for the production of electricity are foreseeable [14].
For instance, in [15], the generalized autoregressive conditional heteroskedasticity (GARCH) regression method was used to obtain the daily electricity market price (EMP) considering the German EM as the case study. Then, the estimation was made by varying wind quantities and the prices of possible bids in the same way that EMP varies throughout the day, i.e., at times when the EMP is lower, the prices of possible bids would also be reduced, and the price variation of the possible offers, for the times when the EMP was higher, would increase by a similar proportion. A study was also made for the price volatility depending on the amount of available wind power. The main findings concerning the price volatility show that a higher EMP occurs when there is lesser wind production in the system, but it was also verified that when more wind power is introduced in the EM, the EMP faces more instability because price differences between hours would be much more significant.
More studies about the German market and the RES impacts are available in [16,17,18,19]. Considering another country with large share integration, Sweden, in Reference [20] was presented an analysis study regarding its EM. Similar features were found between the study areas and the results were concordant. Hence, the work described that by increasing of wind power, the EMP decreases. Moreover, the price volatility depends on the study area, considering that there are better areas than others to proceed with the flexibility of the production with other sources at similar prices, without changing the final value of the electricity. Hence, the EMP volatility is felt in the Nordic market where the study was applied, with similar findings as [21].
In Reference [22] two methodologies were used to identify the influence of wind integration in the Netherlands market. In the first methodology, an average hourly EMP was considered every day, considering an analytical regression for the withdrawal production with wind power. Moreover, a new EMP was determined, finding that there is an increment of 3.50€ in the average EMP in the case that wind power production is not considered. In the second methodology, with the division of all the hours of the year into four groups, according to the historical data on the amount of energy production, this time considering the wind power, it was found that with a lower quantity of EM existence, there is an increment in the EMP (in average 5%, as in the previous comparison). This situation is related to the differences between moments with higher (assumed total) amount of wind power, and the moments with lower (assumed as none) amount of wind power, in comparison with the previous methodology, reaching a difference of 11%, taking into account that wind power had lower integration in the Netherlands market (around 4%).
In Reference [23], the daily MIBEL was analyzed, where a constant wind power production of 400 MWh was assumed, and based on this assumption, the amount of wind power was withdrawn and replaced by an equal number of offers that were carried out, in the specific day, with another type of electricity production. The offers that would be accepted in the study would have a higher EMP value, and consequently, the final EMP would also be higher.
Such wind power withdrawal, of 400 MWh, was assumed to correspond with the Portuguese production capacity whereas the interconnections with Spain were not verified after the simulation. It can be admitted that the interconnection would have the capacity to make the transmission if necessary, although this was not verified, and neither was the raise of market splitting. Then, the proposals would be presented according to the rules of the daily spot market, and all the proposals are considered as simple ones. The existence of complex offers related to the start-up costs of the thermal units will be not considered in this study. The main finding was an increase in the EMP compared with the real EMP, as expected, with an average increment of 1.20 €/MWh. Hence, in Reference [24] a new software for the regional balancing mechanism transactions, for the day-ahead and intraday markets under TSO and other operators’ points of view was proposed and analyzed.
Based on the state-of-the-art, and in the same frame of mind as presented in [24,25,26,27], the present study tries to analyze the importance of WP and its influence on MIBEL, at the level of the IESM. To this end, the analysis is made attending to the impacts by betting on WP sources, in order to improve the market interaction with WP integration, considering as criteria the consumer satisfaction, in terms of lower electricity prices and the WP availability. Moreover, as the current work will show, and as the main contribution, the results allow the evaluation of the WP influence on the EM quantitative, which is specifically noteworthy in the Iberian IESM. As it will be explained in the next sections, it was noticeable that from the technical restrictions of the WP integration in the electricity networks, the wind producers could retake the offers previously elaborated. The reformulation could be elaborated in intraday markets, closer to the moments of electricity consumption. This possibility will mitigate some non-fulfilling offers due to the uncertainty of the expected production.
For this study, the market bids registered by the OMIE, from 2015 to 2017, were used and ran over a new market simulator, specially developed for this analysis, considering a virtual market condition, not considering the bids made by WP producers. The remaining manuscript is structured as follows: Section 2 describes the electricity production and transmission costs; in Section 3, the wind power influence in the MIBEL IESM is described; Section 4 describes and shows the IESM simulation results considering the proposed market simulator model; and finally, in Section 5, the main conclusions of this work are presented.

2. Electricity Production and Transmission Costs

2.1. Electricity Production Costs Overview

In spite of several ways of establishing the EMP, the value of EMP always depends on its stakeholders, which are in function of the consumers’ demand and purchase, production costs, and producers’ willingness to materialize the trading with profit that takes into account the associated risk, as well as the costs of transmission and distribution [28].
From the previous perspective, all the EM players are the key role, where the TSO is expected to increase his reliability and security of operation and the consumers have the expectation to obtain cheaper electricity tariffs in contrast own self-electricity production. The valuation is usually carried out by the segregating costs of the investment in the operating costs. It should be noted that the involved costs are variable and are a function of the consumed quantities, so there are other costs that are fixed and not dependent on those consumption quantities, such as the investment costs. According to the Portuguese Association for Renewable Energy’s (APREN) study, based on the data provided by the Portuguese energy enterprise (EDP), electricity production costs using the most common technologies are: 52 €/MWh for solar, 48 €/MWh for onshore WP, 68 €/MWh for hydro, 112 €/MWh for nuclear, 98 €/MWh for coal, and 87 €/MWh for gas cycle-combined [29]. These data are corroborated with the information provided in [30].

2.2. Electricity Production Incentives

In the case of RES production, some incentives were created mostly for environmental reasons. In many countries, the RES producers are subsidized in direct or indirect ways, and partially bearing the costs. In addition to each country’s individual freedom to apply for other additional benefits, in the Portuguese case, the European Commission guarantees the kind of support that is described below. The referred support is described in detail in [31]. The mean values of these measures, for WP, solar and hydro generation, are as follows [7]:
  • WP—The average incentive rate for the existing WP farms is around 75 €/MWh. However, the Portuguese Government has established a compensation return scheme that implies the return of part of those incomes to the National Electrical System. Regarding small production, this support corresponds to 70% of an annual reference tariff, which, for 2017, it was set at 95 €/MWh.
  • Solar—The indicative average rate of incentives for solar power farms is around 257 €/MWh. In the case of a solar power plant with a limit up to 5 MW of installed power, the average value is 380 €/MWh. For installed power between 5 and 10 MW, the average value is 270 €/MWh. Regarding small production, the tariff corresponds to 100% from the reference tariff, which for the year 2017, was set at 95 €/MWh.
  • Hydro—The indicative average rate of incentives for traditional hydropower plants has an average value of 93 €/MWh. For tidal power plants, in the case of pilot projects with a capacity of more than 4 MW, this average incentive is 260 €/MWh. In other cases, for the first 20 MW of installed power, the value is 191 €/MWh, from 20 to 100 MW the marginal value is 131 €/MWh, and for the subsequent 150 MW the marginal value is 101 €/MWh. In the case of small productions, the tariff corresponds to 60% of the reference, which for 2017, had a fixed value of 95 €/MWh.
It should be noted that small production means that all generating units have an installed power up to 250 kW.

2.3. CO2 Emission Costs

The CO2 emission rights were settled with the producers, and such emission rates are not required by the producers, these values’ rates can be transacted. In this sense, these rights are currently marketed in the secondary market, one of them being the European Emission Allowances [32].
The transaction value of this product, for instance, on 18 June 2018, was settled approximately at 15 €/ton. Thus, CO2 emission by thermal plants can be considered an additional cost to their production, which can be determined by multiplying the emissions by their market value. In the case of combined cycle natural gas power plants and coal-fired power plants, the sums are around 5.25 and 12.75 €/MWh, respectively.

2.4. WP Production and Transmission Costs

By making an exercise to know the approximate costs of producing onshore WP, the most common in the MIBEL, the information obtained was based on the generic information published on the IRENA [8] and WindEurope [9] platforms. According to WindEurope, the investment cost of WP integration is close to 1200 €/kW, which is lower than 4000 €/kW (by approximation), the cost when WP farms were started in 1983. The operation costs are highly variable due to several factors, however, considering Spain as the reference, the operation cost may vary between 0.012 and 0.015 €/kWh. So, in the Iberian Peninsula, the WP production cost is estimated at 0.05 €/kWh or 50 €/MWh. Figure 1 shows the global estimated average WP production costs worldwide from 1983 to 2018 [8]. For the transmission cost, the exercise done for the WP production is harder because it involves the amortization of investment costs, transport capacity, grid losses, maintenance and operation costs, maximum limits of transmission and distribution, scheduling and historical maintenance, environmental and safety costs [33].

3. Wind Power Influence in the MIBEL Intraday Spot Market

3.1. Proposed Model and Data Collection

Due to the complexity of the topic and the high volume of data that is involved, the analysis of the influence of WP in the IESM was structured in some pillars. Briefly, a multiplicity of market sessions is generated in MIBEL, with several term periods and spot solutions. So, in the first pillar of the proposed approach, in order to increase the focus of the analysis under study, it is carried out the selection of solutions in the MIBEL market that are important for the study.
According to the data from the OMIE [34], electricity was traded in the daily and intraday MIBEL markets, as was later confirmed by Reference [6], where is mentioned a volume transaction of 83.9% for 2016 and of 88.2% by 2017, where the WP integration has a strong intervention.
Moreover, it was important to identify which of the markets would be more influenced by the limitations of WP integration, namely, unpredictability, variability, and production inconstancy. It was noted that from the technical restrictions of the WP integration in the electricity networks, the wind producers opt, with some predominance, to make the offers for those moments as close as possible to the moments of electricity consumption, because in these electricity consumption moments, the possibility of some non-fulfilling offers will be mitigated due to the uncertainty of the expected production. Thus, due to its significance for the WP producers, it was decided to focus the proposed study on the intraday market, in the last negotiable session, for each hour period.
In a second pillar of the proposed approach, it was important to obtain the market data with information on all the bids submitted for the negotiation and identify all its details, including information from the production units, namely the energy sources used. Based on such data, the goal is to achieve the negotiation results, based on a market simulator that will be presented in the next section. The third pillar of the proposed approach focuses on the collection of the simulated results of the negotiation by withdrawing the productive units based on WP.
The market simulator was, therefore, the basis for obtaining the results, which leads us to the fourth and final pillar of the proposed approach where a comparison between the two scenarios, real trading and simulated trading without wind power, is made. In order to obtain the necessary market data, the OMEL website [35] was chosen, where all agents, units, relations between agents and units are listed, as well as all the offers to the market. However, there is no official source that provides information on the origin of the electricity produced by the various registered agents. It was difficult to identify the origin of all energy sources due to the lack of public, organized and official information. So, in order to mitigate the aforementioned problem, the information on the energy source produced by the agents was obtained with the support of APREN which, although not official, has proved to be reliable and quite complete.

3.2. Market Simulator Model

The first challenge in the development of the market simulator model was to enable the proposed model to execute the intraday market simulations in accordance with the MIBEL’s rules [36,37], in the last negotiable session for each time period, excluding the WP bids. Moreover, the algorithms, the programming code, and the entire technological solution were developed with a modular structure in order to facilitate their future evolutionary process, namely for the daily market and the other sessions of the intraday market.
For the market simulator construction, and as a starting point, it was verified the need to manage a massive amount of data. A large number of agents in the market (1954), the huge number of producing units involved (4555) and a massive number of offers to the market (99,852,142) were identified for the analysis. In other words, for each time period, there was an average of 3800 offers. It was also realized that the processing of these data by the proposed market simulator would be carried out by means of some relatively simple arithmetic operations, although with the need of using some operations with a large amount of data, with large dimensions matrices. Thus, the solution to be adopted would be to use the Database Management System (DBMS), supported with a user interface.
However, due to the amount of data, the solution chosen was conditioned to a single DBMS solution, or, Simple Query Language (SQL). Considering this option, it was important to ensure the compatibility of the selected DBMS with the user interface, and at the same time, ensure that the results to be obtained by the market simulator could easily be exported to a universal format for future treatment. The final solution found for the construction of the proposed market simulator was:
  • The Microsoft SQL Server Express 2017 [38]—DBMS [39], including the storage, data processing and management using the Translated SQL, or T-SQL;
  • The Microsoft Excel 2016—as the user interface and for the final treatment results, using the Microsoft Visual Basic for Applications (VBA) [40,41].

3.3. Data Structure and Market Simulator Functionalities

The information collected was stored in the market simulator database according to the following structure:
  • Agents;
  • Properties;
  • Units;
  • Offers;
  • Interconnection energy balances.
The relationships and functional conditions of the data were considered as follows:
  • The agents are the owners, totally or partially, of units through which agents make offers to the market;
  • The agents and the units have a unique code assigned by OMIE [34];
  • Each unit is registered in a specific market area, i.e., Portugal, Spain or the Iberian Peninsula borders.
Moreover, three modes of operation have been developed for the market simulator: “Mode 1”, “Mode 2” and “Mode 3”, all of them for the last negotiable session for each time period, as described below:
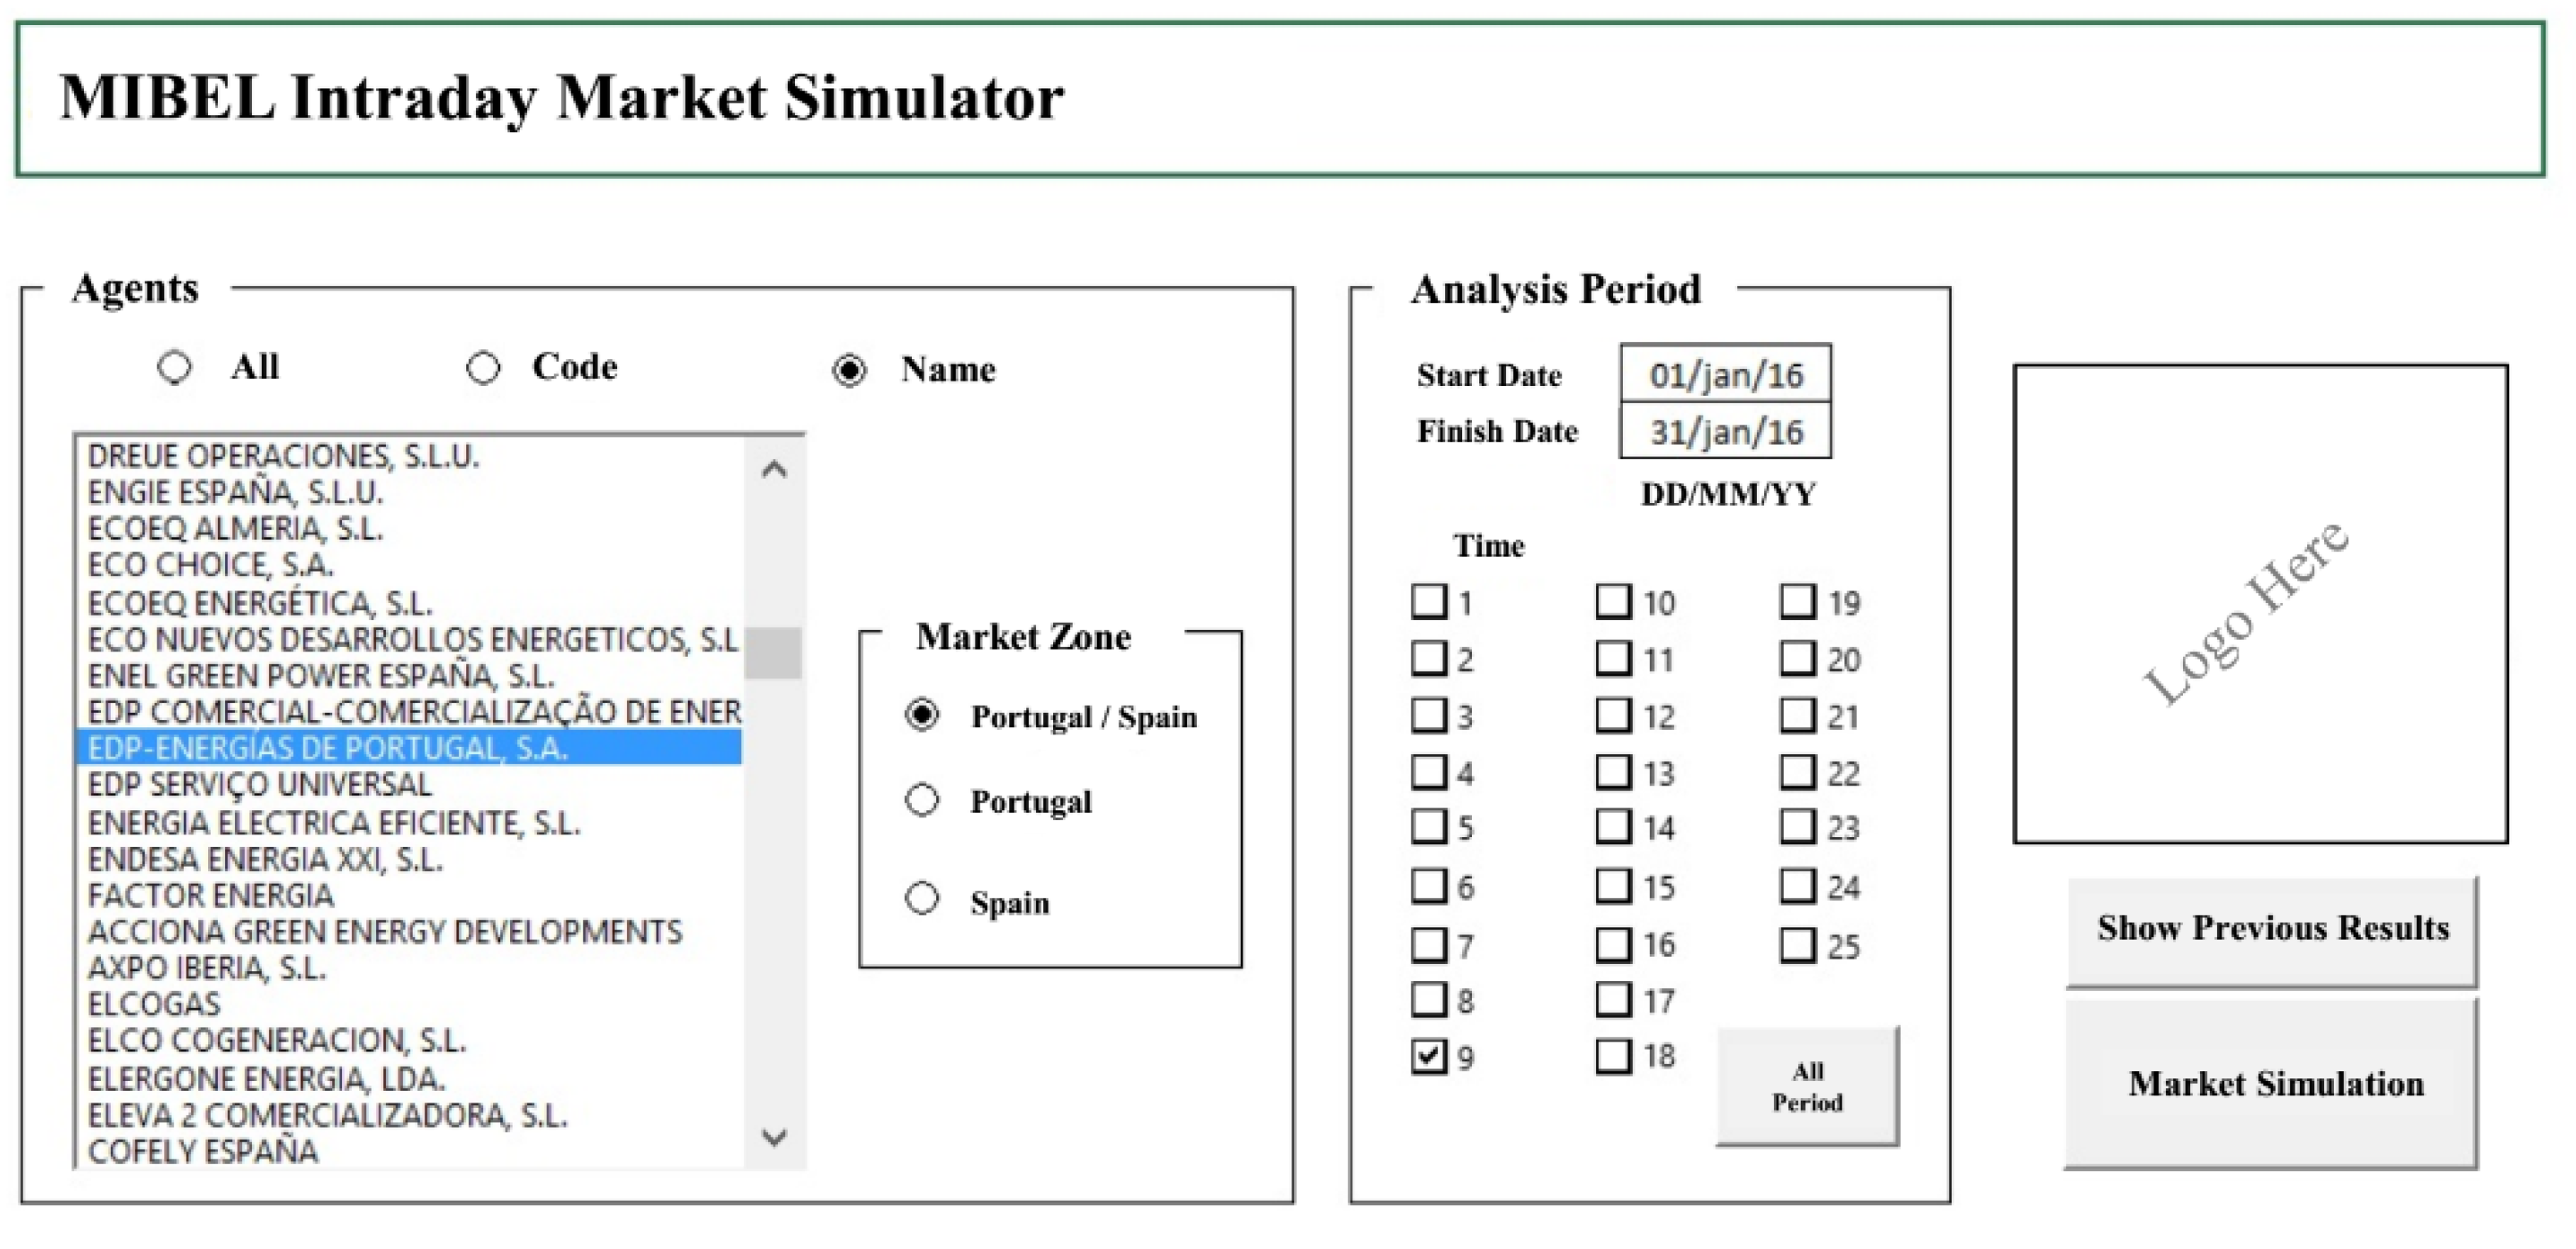
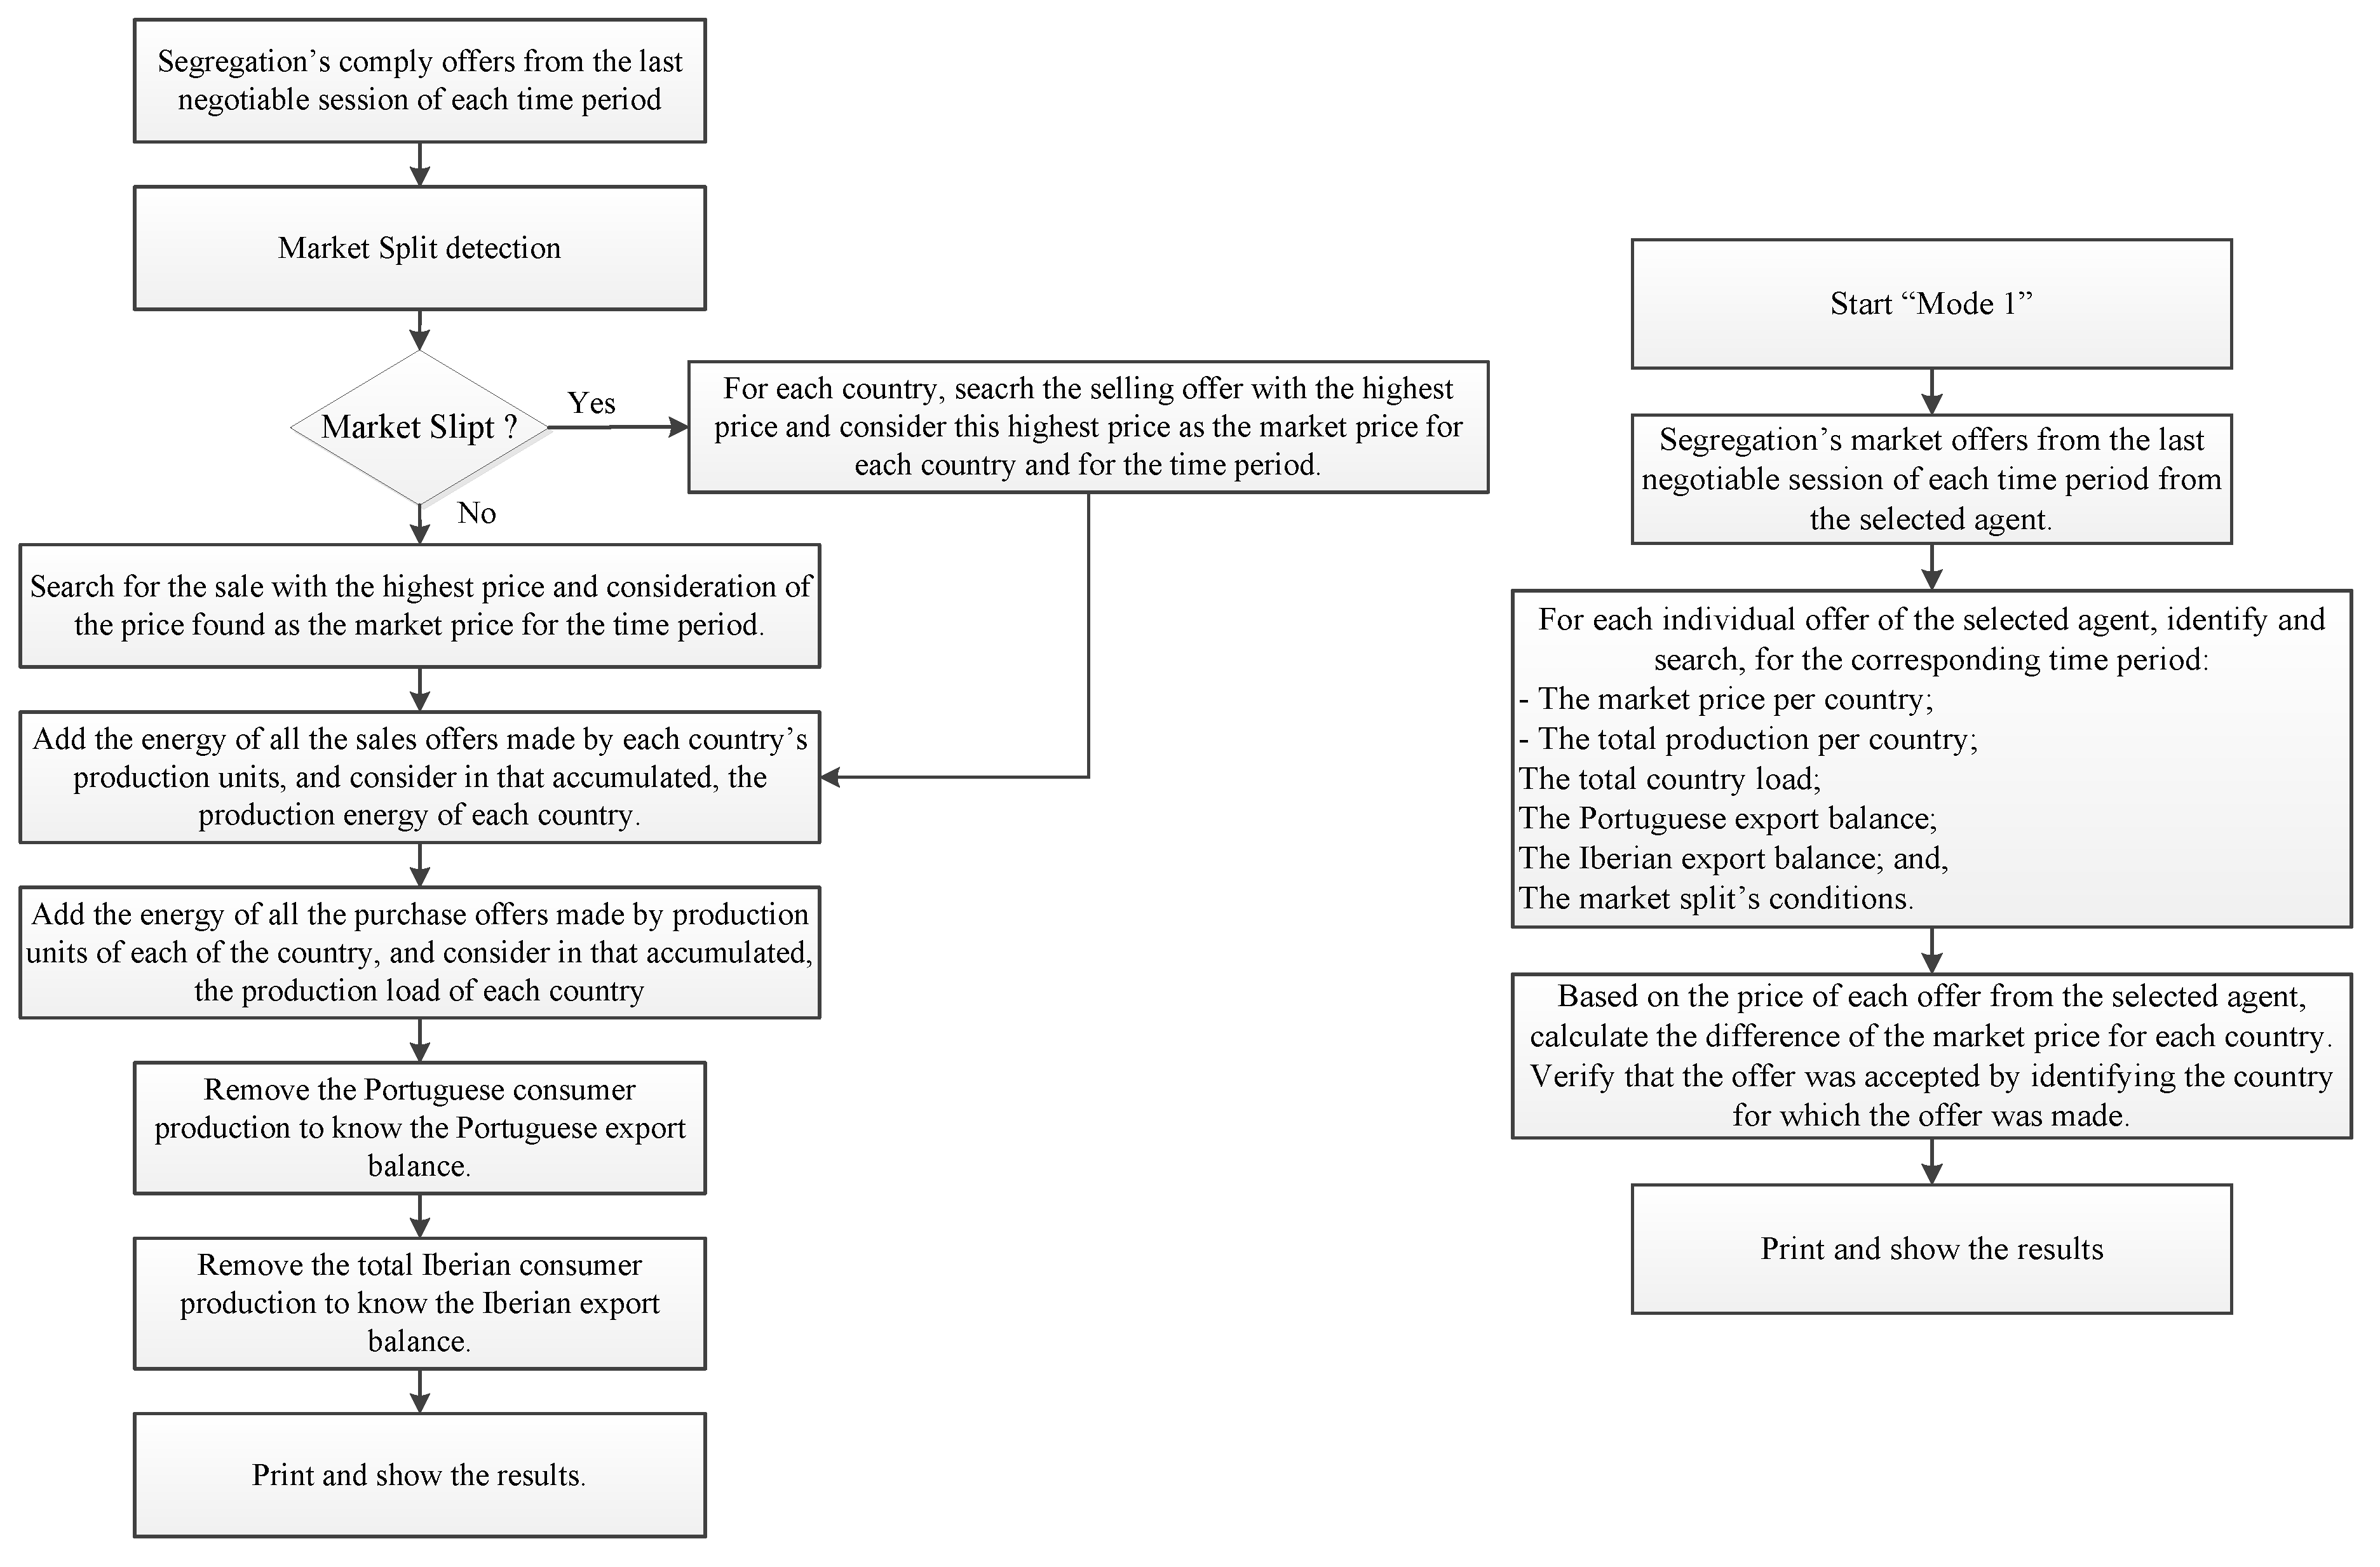
  • “Mode 1”: in this mode, it is proposed that the market simulator may present, based on the offers made to the market, the results obtained in the actual trading of the market, at any time. For this functional mode, the user interface is shown in Figure 2.
  • “Mode 2”: it allows the user to know all the information related to “Mode 1” and it also allows the selection of a particular agent, with the addition of having the possibility of knowing the agent’s interaction with each offer to the market. This mode is illustrated in Figure 3 and Figure 4, respectively. The user interface for this functional mode presents two alternatives in the agent’s selection, allowing each alternative the possibility of segregation by target country:
    Agent code selection or;
    Selection by Agent name.
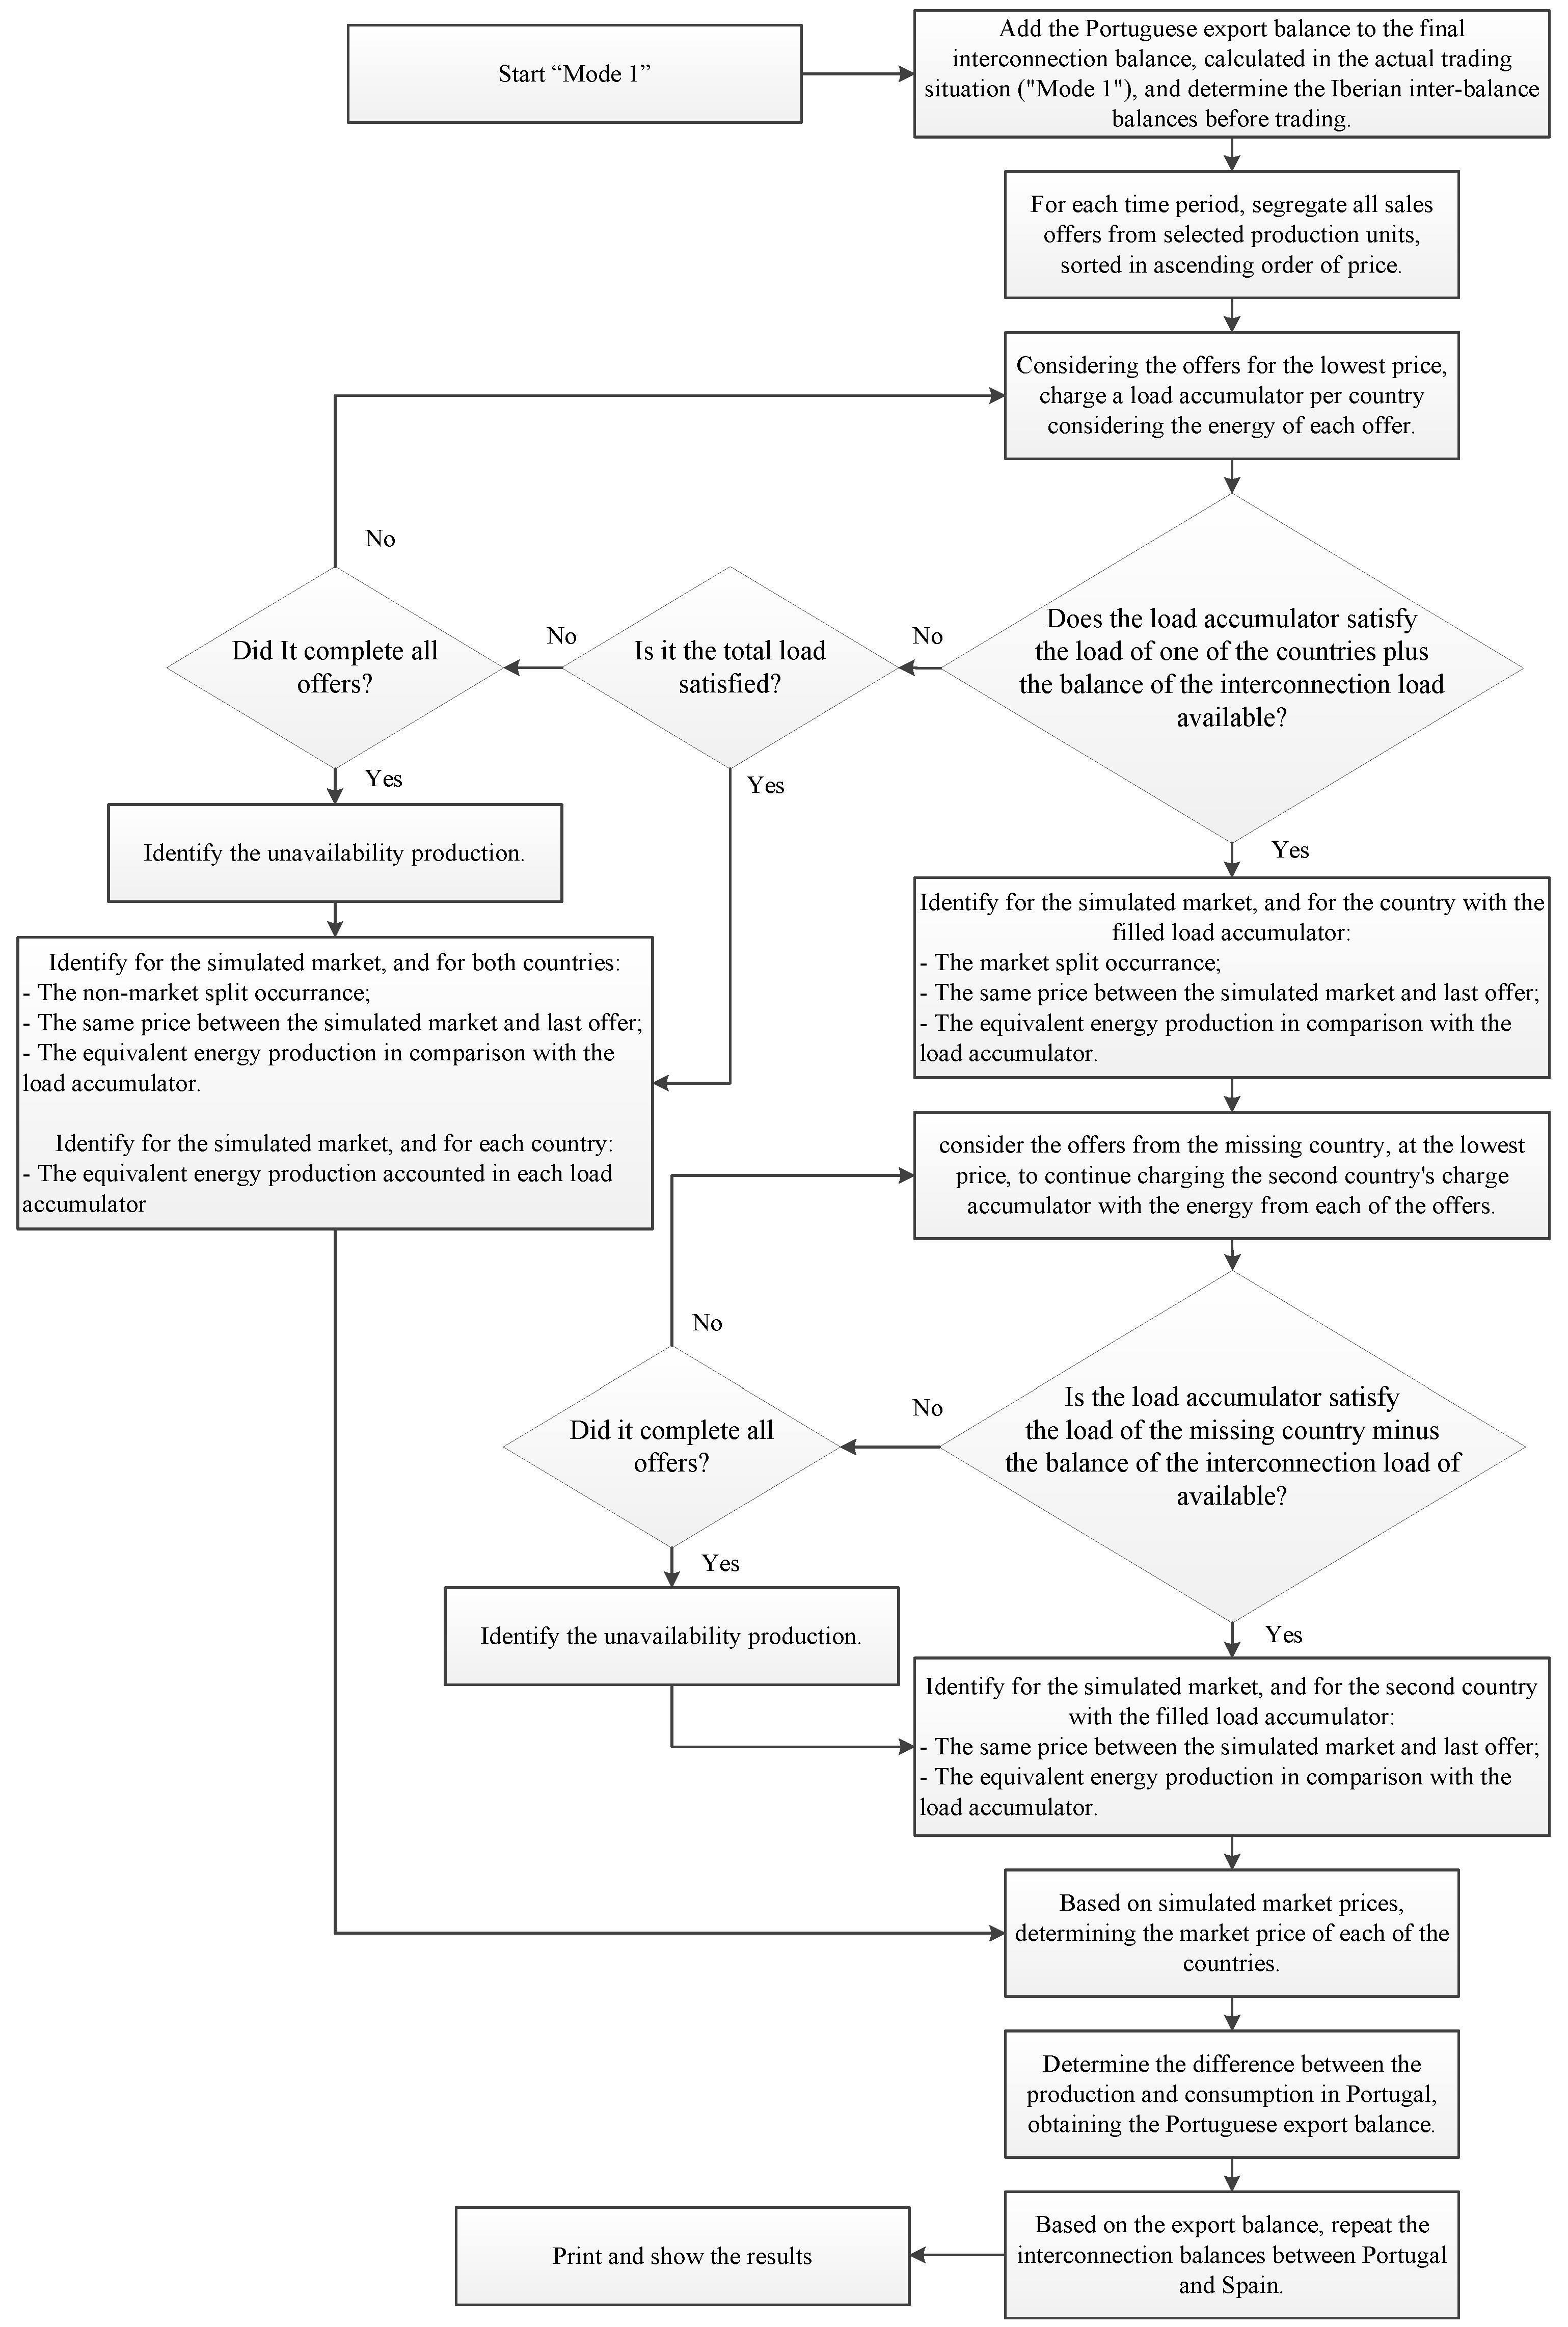
  • “Mode 3”: it enables the selection of the technology or technologies used in the electricity production. With this mode, the EM is simulated by withdrawing the bids from the deprecated production technologies. This interface display is similar to Figure 2.
In order to increase the reading and understanding of the proposed model, the simplified flowcharts with the algorithms of the market simulator three functional modes are presented in Figure 5 and Figure 6, respectively.

4. Intraday Spot Market Simulation Results

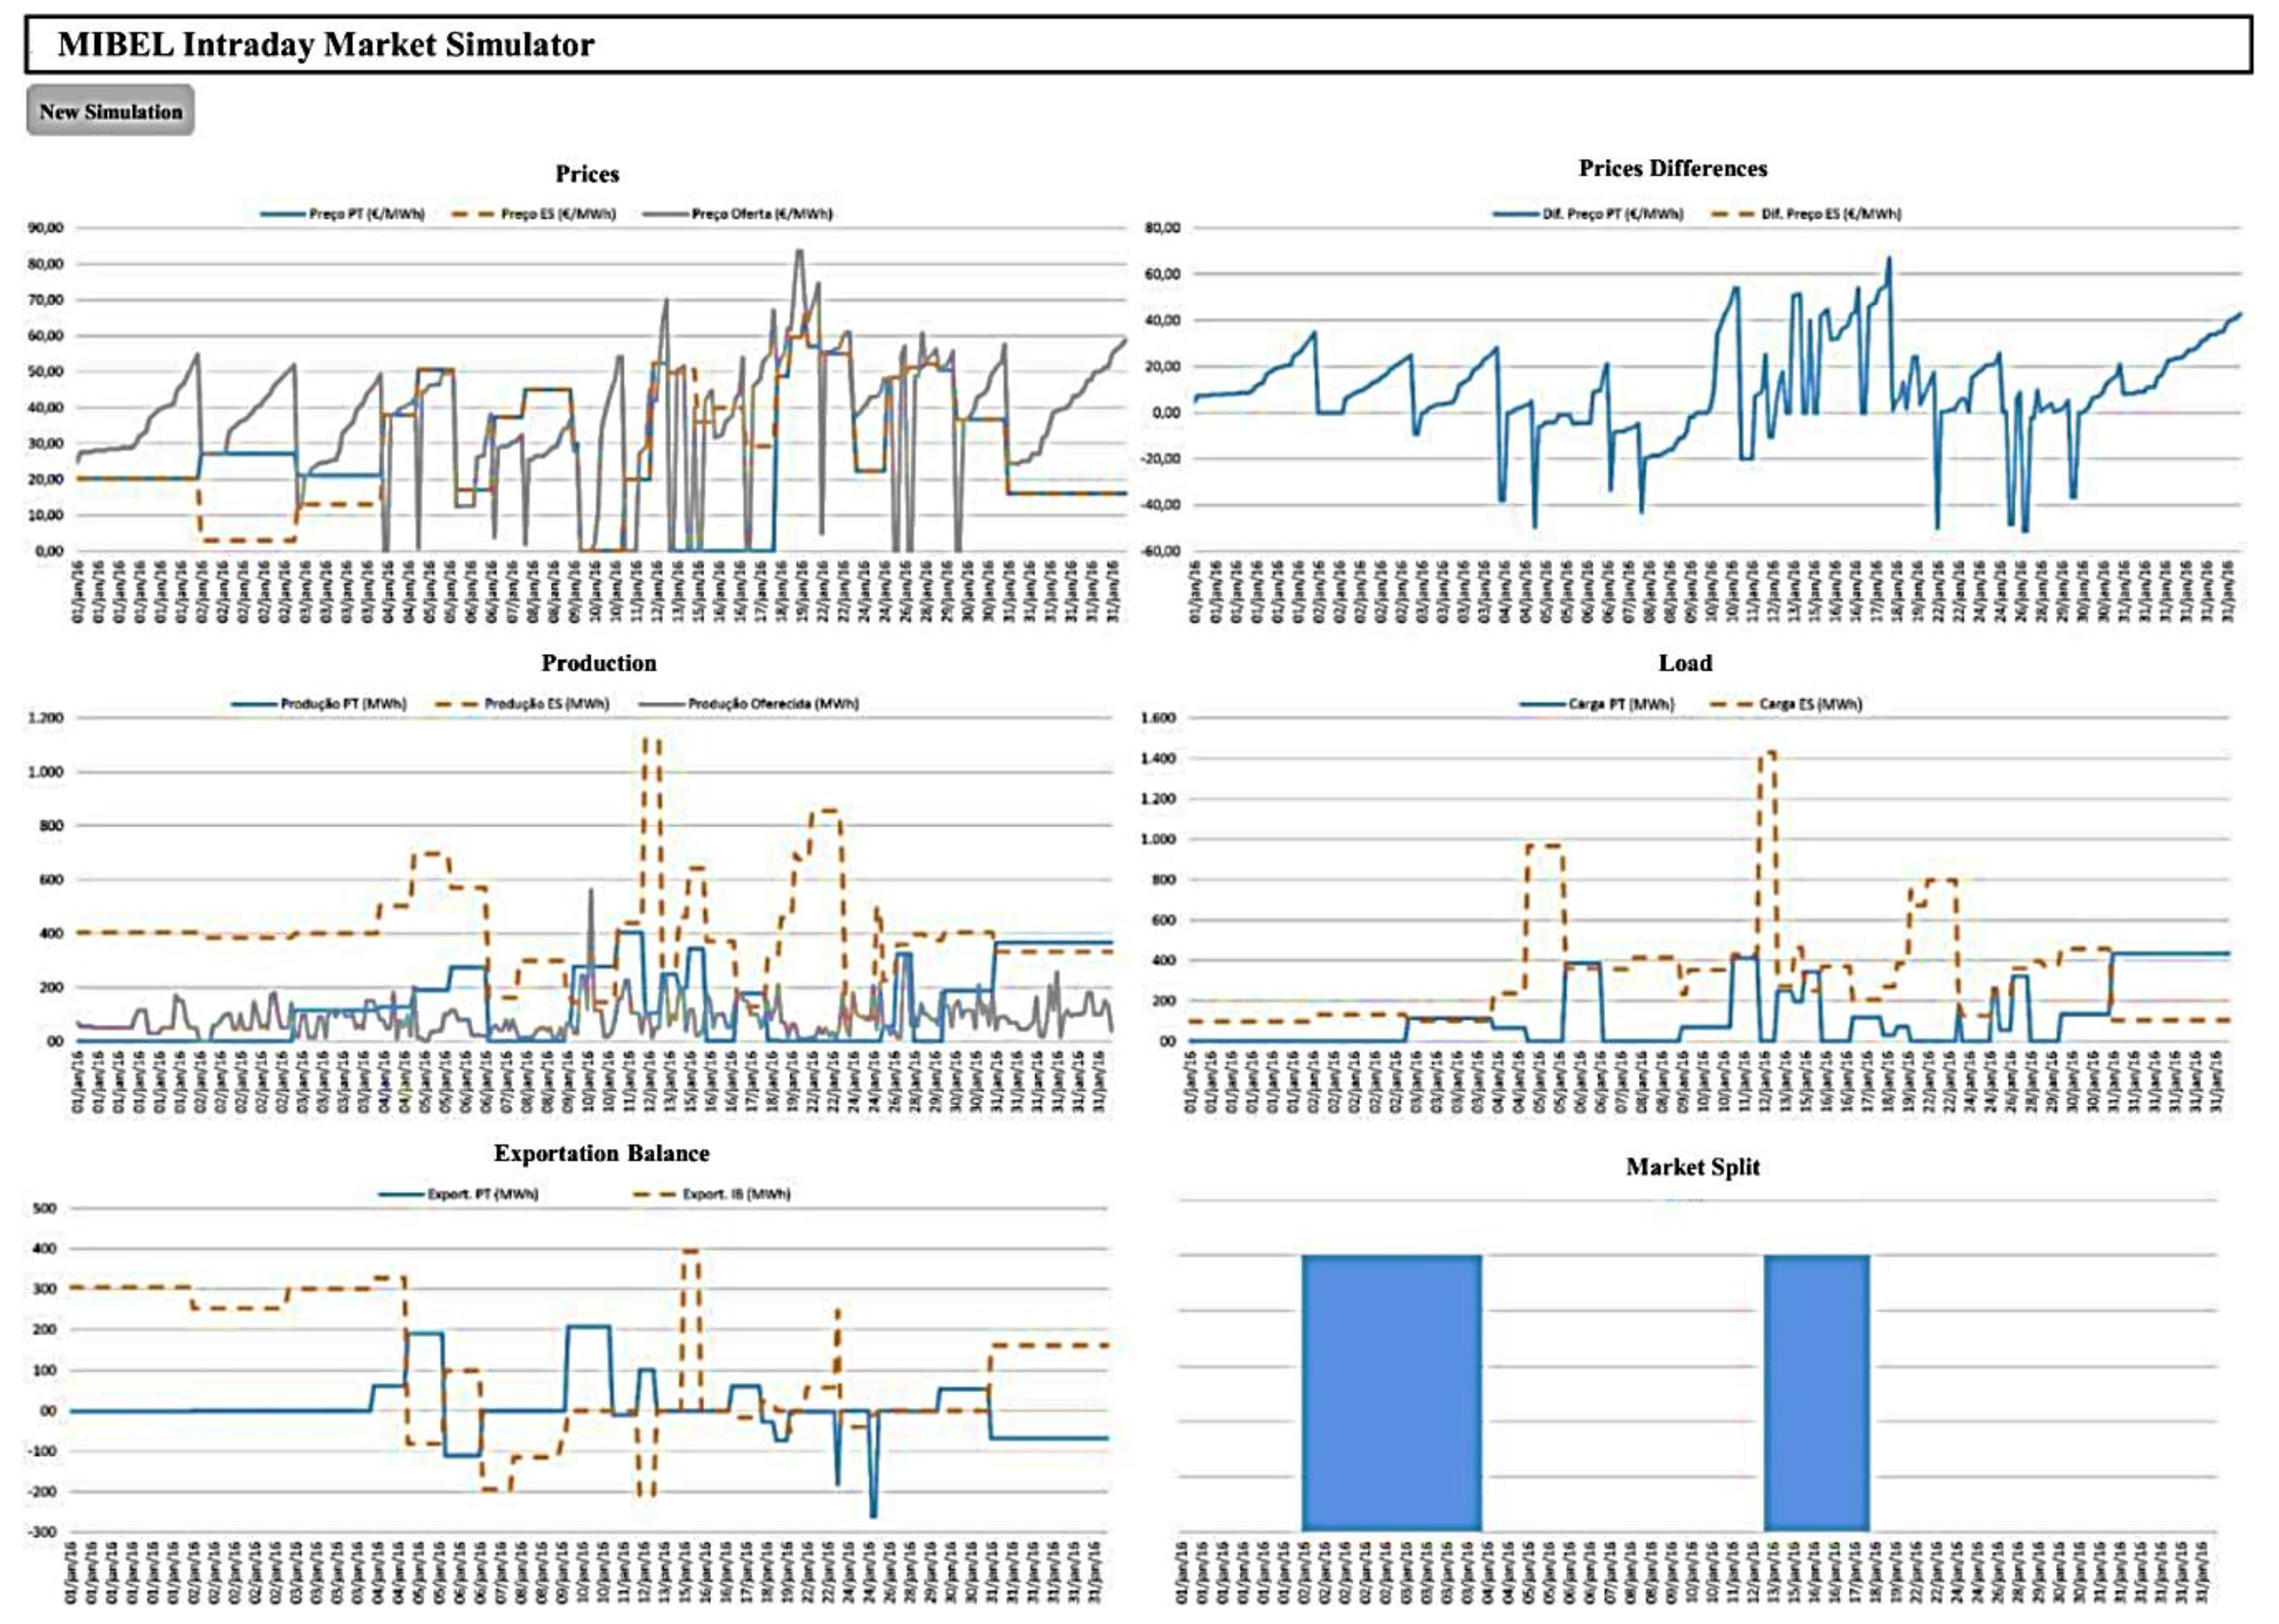
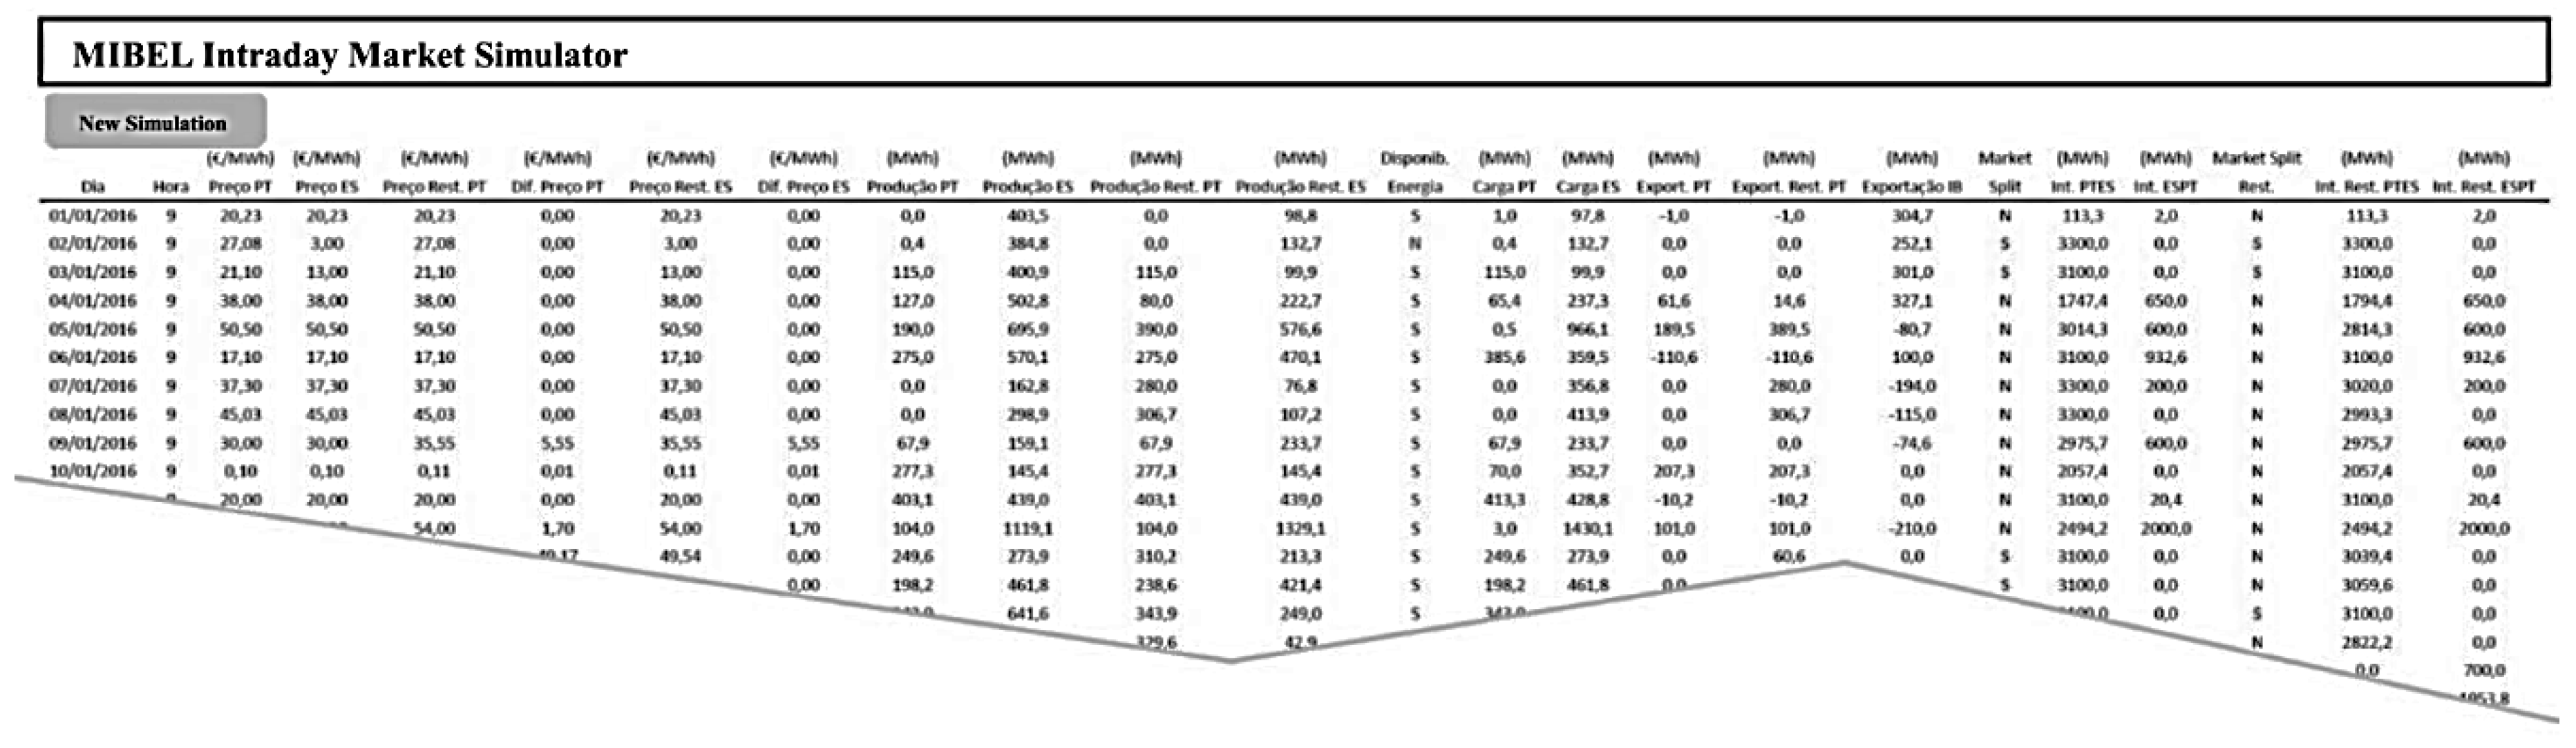
4.1. Market Simulator Layout

For each of the functional modes, the market simulator generates a table and a set of graphs. This data is produced in Microsoft Excel format, which makes it easy to export for complementary treatment. In “Mode 1”, the results obtained in a real trading market at any moment are obtained in a table format: EMP, productions and aggregation loads, market split, the transit interconnection energy (aggregated when the energy goes outside of the Iberian Peninsula) and interconnection balances available in the Portugal-Spain interconnection.
In addition, the application presents the following graphs: prices, production, load, export balance and market split condition. Similar to “Mode 1”, in “Mode 2” the results are obtained in a table format, which shows the real negotiation and all the individual offers of a particular agent, also adding, along with the data obtained with “Mode 1”: the price of the offer, the differences between prices as well as the energy accepted and contracted in the market. In addition, some graphs are presented as well: the EMP, the EMP difference, production, load, export balance and market split condition. A clear example of these outputs is shown in Figure 7 and Figure 8, respectively, for the Readers’ guidance.
With “Mode 3” it is possible to observe the table with the results obtained in the real negotiation, just as in “Mode 1”, adding new results considering the restrictions imposed on the production, namely: the EMP and differences for the EMP in the real market, the distribution information on the availability of energy in the system, the market split, the transit of energy, and the interconnection balances available in the Portugal-Spain interconnection.
As previous modes, some graphs are presented: the EMP, the EMP difference, production, load, export balance and market split condition, with the examples being shown in Figure 9 and Figure 10, respectively, for the Readers’ guidance.

4.2. Market Simulator Analysis

With the proposed market simulator, new market conditions were generated, with the restriction of the WP integration’s exclusion. Looking for an extended period, in order to increase the representativeness of the WP integration’s impact on the IESM, in the period from 2015 to 2017, for each hour of the day, the last session of the corresponding intraday market was simulated, in a total of 26,304 hourly periods. Among the results obtained, the following information has been selected:
  • Real Production and EMP with the WP integration restriction;
  • EMP differences with the restriction of the real EM;
  • Loads to be met in the EM;
  • The condition of the energy’s availability in the system with restriction;
  • The condition of the market split, with and without restriction;
  • Transits of energy in the Portugal-Spain interconnection.
The offers to the simulated market corresponded to the total energy transacted in the real market of 17.5 TWh, where 4.2 TWh corresponded to WP integration, which is close to 24% of the total energy.

4.3. Market Simulator Results Treatment

Although some data results obtained from the market simulator model were selected, these results have an impossible direct analysis, so, the solution found and chosen for this analysis was the data aggregation analysis. In order to find the indicators and follow a standard analysis within the realm of possibility, the results obtained from the market simulator were grouped according to three different models by:
  • Time period;
  • Time period with aggregation per day of the week and per month;
  • Aggregation by day of the week and per month.
Daily aggregation could have been carried out in another context, e.g., considering the business days, weekends, and holidays. However, for the Portuguese holidays and during the period under analysis, the number of holidays in business days, from Monday to Friday, was only 2.8% of the total number of days. The analysis according to this aggregation strategy presents even higher difficulties due to the non-coincidence of some holidays between Portugal and Spain, intensified by the fact that in Spain there are important differences by region.
Moreover, considering the Spanish regional lags of holidays, the impacts of these are reduced in the majority of the situations. In this sense, it was decided to perform the daily aggregation without removing the holidays. This aggregation model allows the observation of the influence, in the different time periods, of the WP integration’s identified differences. Moreover, with this aggregation strategy, it was intended to globally capture the possibility of some seasonality in this EMP and the loads in the specific market, in addition with the WP production’s influence on the EMP.

4.4. Results Analysis

Figure 11 shows the average hourly EMP differences between Portugal and Spain with the restriction from the real market. In this figure, the periods where the values and the increase values, if the WP restriction occurs, can be easily observed. During the off-peak period the impact was more pronounced in the Spanish Electrical System. In most of the remaining periods the impact was greater in the Portuguese one. During the morning period, the differences are also more pronounced in Portugal. Figure 12 and Figure 13 presents, respectively, the hourly average EMP standard deviation, from the real market with restriction between Portugal and Spain, and the hourly average loads to be satisfied in the EM. Moreover, Figure 14 shows the hourly condition of the energy’s average availability in the system with the WP integration’s restriction.
Regarding the influence of the WP integration in the last negotiable session for each time period of the MIBEL intraday market, it can be noted that without the WP integration:
  • There is a worsening of 1.56 €/MWh in the Portuguese EMP, and of 1.12 €/MWh in the Spanish one;
  • There is less EMP volatility;
  • There are less market splitting conditions;
  • There were no relevant variations in the maximum transits interconnection between Portugal and Spain;
  • There are more conditions for partial power outages.
The unavailability conditions verified are relative to the offers carried out in the studied market. In fact, it is expected that in the absence of WP integration, with the rising EMP, due to WP scarcity, other producers will be attracted to the EM. Additionally, in general, by analysing these findings, it can be inferred that WP integration is responsible for more power transits situations between Portugal and Spain, mainly from Portugal to Spain, where it is more likely to deplete the interconnection balances, creating market splitting conditions.
In Figure 12 it is possible to observe the strong increment of EMP volatility during the sunrise and sunset hours, due to the changes in temperature, and consequently, the increment of the air masses movement, which increases the volatility, and therefore, an increase can be seen in the wind farms output. In Figure 13, it is possible to observe a satisfaction in EM, in absolute values. More important than the effective values themselves is the difference between Spain and Portugal. The average value for the Portuguese electrical System is around 110 MWh and for Spain 550 MWh. This difference is coherent with the difference of the electrical Systems: The Spanish TSO is 5 to 6 times bigger than the Portuguese one.
Table 1 shows the EMP aggregation results, per hour, between Portugal and Spain. It is possible to observe the mean, the variance and the percentage of the EMP deviation between Portugal and Spain in the EM, considering the real EM and the EM without WP integration, i.e., with the WP integration’s restriction.
In Table 1 a market day base is reflected. It presents the mean value for each EMP hour. Columns 2 and 3 represent the EMP for each country presented in MIBEL. The existence of a difference indicates that, in the 3 analyzed years, in at least one period, market splitting occurs. The transmission network between countries has reached the maximum of its commercial capacity. However, the differences are only slightly noticeable meaning that the periods when these occur are few and/or if there exists a considerable number of splits, those are not in the same direction. The average value of the spilt is around 0.70 €/MWh. In the third and fourth columns the price without the WP integration is represented. Less difference can be seen when comparing these columns with columns 1 and 2.
Moreover, in the same trend, in Table 2 the aggregation results per hour are available, considering the energy availability and the EM conditions. In percentage, it is possible to observe the energy availability, the conditions of market split and the conditions of market split with the WP integration’s restriction throughout the day. The table allows a more condensed analysis of these conclusions. It is possible to observe an increase of the market price in both countries. Another conclusion is that the nonexistence of WP in both countries generates less periods of market splitting and, consequently, less periods were price is affected. This reality occurs because WP in the Iberian Peninsula, even without regarding the specific country, has some economic advantages (as subsides) in the market.
In Table 3 it is possible to observe the monthly EMP aggregation results between the Iberian countries, organized by quarters, from 2015 to 2017. In the same trend as observed in Table 1, it is possible to analyze the real EMP in Portugal and Spain, and the differences considering the WP integration’s restriction. This analysis is different from Table 1, because it allows an observation of the long run, by representing the values across time. Table 3 corroborates the conclusions of Table 1 because it gives an understanding of the existent production portfolio? in both Iberian countries. The first and second quarters correspond to Winter and Spring in the Northern Hemisphere, representing the period when there is more abundance of rain in Europe. The countries with a considerable quantity of hydro power have the possibility of having energy at a competitive price. This is observed in the first and second quarters of 2016, as it was a wet year in Iberia. On the other hand, 2017 was a considerable dry year, which explains why the differences from Winter to Summer were not very pronounced, regarding EMP. In addition to this fact, the existence of a considerable nuclear power plant in outage provokes a tremendous increase in the price, as it was possible to observe in January 2017.
Hence, Table 4 shows the daily EMP aggregation results between the Iberian countries, in the same analysis trend as previous tables, organized by weekly day. It is easy to observe the EMP evolution during the various days. The weekend has lower consumption as expected, specially Sunday. Monday and Friday have slightly lower consumptions than the rest of working days. The contiguity with the weekend could help to explain this fact.
In general, in MIBEL, Portugal gives Spain more energy than Portugal receives from Spain; a difference that is attenuated if the WP integration is not considered. In the real situation, the energy transit happened in the period under analysis, i.e., considering the Portugal to Spain direction it was 1.59 TWh and from Spain to Portugal it was 1.33 TWh, with a balance of 0.26 TWh. Without WP integration, the transit energy from Portugal to Spain would be 2.16 TWh and from Spain to Portugal would be 1.18 TWh, with a balance of 0.98 TWh. However, this difference is not significant when the total energy delivered to consumption in MIBEL is considered, in Portugal being 3.26 TWh and in Spain 13.54 TWh, with an overall value of 16.8 TWh. Also, it should be noted that the global value of production in Portugal is 150 TWh and in Spain is 750 TWh, for the same period under analysis.
In this analysis, it can be observed that in the MIBEL/IESM, there is no monthly seasonality of EMP and loads, nor monthly seasonality about the influence of WP integration in the EMP. However, by analyzing segregated daily EMP it is verified that, in this IESM, there is a strong weekly seasonality characterized by a strong fall of EMP, however, it does not have a weekly seasonal effect on the influence of WP integration in the EMP. Hence, these results are evident from the behavior of this adjustment market [36]. Therefore, the influence of WP integration is felt in the same way with different load regimes in the network, for example, the variations related to weekly seasonality.
The average EMP presented in this study was 46.08 €/MWh in Portugal and 46.75 €/MWh in Spain. Hence, it should be noted that RES production contributes to a reduction in emissions. Particularly in the case of the Iberian Peninsula, WP generation contributes significantly to the reduction of CO2 emissions. Considering that the Portuguese average annual consumption is around 50 TWh and the Spanish 250 TWh, RES generation represents about 25% in Portugal, and 21% in Spain, whereas the Iberian WP annual generation is 65 TWh [6,7].
For an equivalent replacement production, e.g., by considering a combined cycle production with natural gas, the estimated annual CO2 emission would be 22.8 million tons, which is equivalent to an annual economic value cost of 340 million Euros. By the same trend, in the case of usage of coal-fired power plants, the approximate annual cost would more than 800 million Euros. Reflecting the strongest overhead, directly or indirectly, on the production cost of the conventional power plants, it is possible to observe the importance of RES integration, in particular, WP integration, which has a great influence on the reduction of the EMP.

5. Conclusions

In this work, the impact of the WP integration on the IESM EMP was analyzed, considering the MIBEL as the case study. To deal with the necessary data, in order to analyze in detail the behavior of the MIBEL market, with or without WP integration, a DBMS/SQL structure was used in order to create a market simulator. It was also necessary to consider a time period of aggregation in order to clearly observe the influence of WP integration in the MIBEL market. Considering the obtained results, the main finding was that WP integration is responsible for more power transit situations between Portugal and Spain, mainly from Portugal to Spain, where it is more likely to deplete the interconnection balances, creating market splitting conditions.
Moreover, it was possible to observe that there is no big influence on the EMP when the analysis is made by week, holidays or weekends. However, it was possible to observe the strong increment of EMP volatility in the hours during sunrise and sunset, due to the changes in temperature, and consequently, the increment of the air masses movement, which increases the volatility, and therefore, an increase in the wind farms output can be seen. From the analysis carried out, it can be observed that in MIBEL there is no monthly seasonality of EMP and loads, nor monthly seasonality about the influence of WP integration in the EMP. Notwithstanding, by analyzing segregated daily EMP it is verified that, in this IESM, there is a strong weekly seasonality characterized by a strong fall of EMP. However, it does not have a weekly seasonal effect on the influence of WP integration in the EMP. In this sense, the average EMP presented in this study was 46.08 €/MWh in Portugal and 46.75 €/MWh in Spain. The intraday market is of capital importance because it allows any market agent to reformulate the market offers according to his interest. It is of special interest for WP producers because it has a variable source of production, permitting more accurate market sales while also minimizing the imbalances.

Author Contributions

P.M.S.F. and J.V.G.A.V.-C. conceived, designed and performed the numerical results; J.J.E.S. and J.P.S.C. contributed to the theoretical analysis; P.M.S.F., G.J.O. and J.P.S.C. wrote the paper.

Funding

J.P.S. Catalão acknowledges the support by FEDER funds through COMPETE 2020 and by Portuguese funds through FCT, under Projects SAICT-PAC/0004/2015—POCI-01-0145-FEDER-016434, POCI-01-0145-FEDER-006961, UID/EEA/50014/2013, UID/CEC/50021/2013, UID/EMS/00151/2013, and 02/SAICT/2017—POCI-01-0145-FEDER-029803.

Conflicts of Interest

The authors declare no conflict of interest.

Disclaimer

The views expressed in this paper are those of the authors and do not necessarily represent those of REN or any company belonging to REN.

Abbreviations

APRENPortuguese Association for Renewable Energy.
DBMSDatabase management system.
DSODistribution System Operator.
EDPPortuguese energy enterprise.
EMElectricity markets.
EMPElectricity market prices.
GARCHGeneralized auto regressive conditional heteroscedasticity.
IESMIntraday electricity spot market.
MIBELIberian Electricity Market.
OMIEIberian Electricity Market Operator.
PTPortugal.
RENPortuguese Transmission System Operator. (Redes Energéticas Nacionais).
RESRenewable energy sources.
SPSpain.
SQLSimple query language.
TSOTransmission System Operator.
WPWind power.

References

  1. US Energy Information Administration. International Energy Outlook 2017. 2017. Available online: https://www.eia.gov/outlooks/ieo/pdf/0484(2017) (accessed on 31 May 2018).
  2. BP British Petroleum P.L.C. BP Energy Outlook 2018. 2018. Available online: https://www.bp.com/en/global/corporate/energy-economics/energy-outlook.html (accessed on 31 October 2018).
  3. World Nuclear Association. Information Library and Country Profiles. Available online: http://www.world-nuclear.org/information-library/country-profiles.aspx (accessed on 31 May 2018).
  4. Azofra, D.; Jiménez, E.; Blanco, J.; Saenz-Díez, J.C. Wind power merit-order and feed-in-tariffs effect: A variability analysis of the Spanish electricity market. Energy Convers. Manag. 2014, 83, 19–27. [Google Scholar] [CrossRef]
  5. Evangelos KAndersson, J.; Serletis, A. Electricity prices, large-scale renewable integration, and policy implications. Energy Policy 2017, 101, 550–560. [Google Scholar] [Green Version]
  6. Red Eléctrica de España. Spanish Electrical System Report. 2017. Available online: http://www.ree.es/es/estadisticas-del-sistema-electrico-espanol/informe-anual/informe-del-sistema-electrico-espanol-2017 (accessed on 1 June 2018).
  7. REN. REN Technical Data. 2016. Available online: http://www.centrodeinformacao.ren.pt/PT/InformacaoTecnica/DadosTecnicos/REN%20Dados%20T%C3%A9cnicos%202016.pdf (accessed on 1 June 2018).
  8. International Renewable Energy Agency (IRENA). Renewable Power Generation Costs in 2017; IRENA: Abu Dhabi, United Arab Emirates, 2018; Available online: http://www.irena.org/publications/2018/Jan/Renewable-power-generation-costs-in-2017 (accessed on 1 June 2018).
  9. Wind Europe. Wind in Power 2017: Annual Combined Onshore and Offshore Wind Energy Statistics. 2018. Available online: https://windeurope.org/wp-content/uploads/files/about-wind/statistics/WindEurope-Annual-Statistics-2017.pdf (accessed on 4 June 2018).
  10. Ibrahim, H.; Ghandourb, M.; Dimitrovaa, M.; Ilincac, A.; Perrond, J. Integration of wind energy into electricity systems: Technical challenges and actual solutions. Energy Procedia 2011, 6, 815–824. [Google Scholar] [CrossRef]
  11. Katzenstein, W.; Apt, J. The cost of wind power vaiability. Energy Policy 2012, 51, 233–243. [Google Scholar] [CrossRef]
  12. Renewables Grid Initiative. RGI Annual Report 2015. 2015. Available online: https://renewables-grid.eu/fileadmin/user_upload/Files_RGI/RGI_Publications/RGI_Annual_Report_2015.pdf (accessed on 4 June 2018).
  13. Hirth, L.; Ueckerdt, F.; Edenhofer, O. Integration costs revisited: An economic framework for wind and solar variability. Renew. Energy 2015, 54, 925–939. [Google Scholar] [CrossRef]
  14. Público Newspaper. Falta de Água Nas Barragens Faz Disparar Importação de Eletricidade. 2012. Available online: https://www.publico.pt/2012/04/23/economia/noticia/falta-de-agua-nas-barragens-faz-disparar-importacao-de-electricidade-1543271 (accessed on 5 June 2018).
  15. Ketterer, J.C. The impact of wind power generation on the electricity price in Germany. Energy Econ. 2014, 44, 270–280. [Google Scholar] [CrossRef] [Green Version]
  16. Ocker, F.; Ehrhart, K.-M. The “German Paradox” in the balancing power markets. Renew. Sustain. Energy Rev. 2017, 67, 892–898. [Google Scholar] [CrossRef]
  17. Cludius, J.; Hermann, H.; Matthes, F.C.; Graichen, V. The merit order effect of wind and photovoltaic electricity generation in Germany 2008–2016: Estimation and distributional implications. Energy Econ. 2014, 44, 302–313. [Google Scholar] [CrossRef]
  18. Hildmann, M.; Ulbig, A.; Andersson, G. Empirical analysis of the merit-order effect and the missing money problem in power markets with high RES shares. IEEE Trans. Power Syst. 2015, 30, 1560–1570. [Google Scholar] [CrossRef]
  19. Dilling, M.; Jung, M.; Karl, J. The impact of renewables on electricity prices in Germany—An estimation based on historic spot prices in the years 2011–2013. Renew. Sustain. Energy Rev. 2016, 57, 7–15. [Google Scholar] [CrossRef]
  20. Wirdemo, A. The Impact of Wind Power Production on Electricity Price Volatility: A Time-Series Analysis; Luleå Tekniska Universitet: Luleå, Sweden, 2017; p. 66. Available online: http://www.diva-portal.org/smash/get/diva2:1128192/FULLTEXT01.pdf (accessed on 6 June 2018).
  21. Holttinen, H.; Koreneff, G. Imbalance costs of wind power for a hydro power producer in Finland. Wind. Eng. 2012, 36, 53–68. [Google Scholar] [CrossRef]
  22. Nieuwenhout, F.; Brand, A. The Impact of Wind Power on Day-Ahead Electricity Prices in The Netherlands; Energy Research Centre of the Netherlands: Petten, The Netherlands, 2011; pp. 1–5. Available online: https://www.ecn.nl/docs/library/report/2011/m11111.pdf (accessed on 6 June 2018).
  23. Ferreira, J.E.B. O Impacto da Produção Eólica no Preço de Mercado; ISCTE Business School, IUL: Lisboa, Portugal, 2016; p. 81. Available online: https://repositorio.iscte-iul.pt/handle/10071/13740 (accessed on 7 June 2018).
  24. Cepisca, C.; Morcovescu, M.; Seritan, G.; Bardis, N.; Grigorescu, S.D.; Banica, C. Software solution implementation for regional balancing mechanism of electrical energy. Appl. Mech. Mater. 2013, 291–294, 1308–1311. [Google Scholar] [CrossRef]
  25. Clò, S.; Cataldi, A.; Zoppoli, P. The merit-order effect in the Italian power market: The impact of solar and wind generation on national wholesale electricity prices. Energy Policy 2015, 77, 79–88. [Google Scholar] [CrossRef]
  26. Wo, C.K.; Moore, J.; Schneiderman, B.; Ho, T.; Olson, A.; Alagappan, L.; Chawla, K.; Toyama, N.; Zarnikau, J. Merit-order effects of renewable energy and price divergence in California’s day-ahead and real-time electricity markets. Energy Policy 2016, 92, 299–312. [Google Scholar] [CrossRef]
  27. González-Aparicio, I.; Kapetaki, Z.; Tzimas, E. Wind energy and carbon dioxide utilisation as an alternative business model for energy producers: A case study in Spain. Appl. Energy 2018, 222, 216–227. [Google Scholar] [CrossRef]
  28. Browne, O.; Poletti, S.; Young, D. How does market power affect the impact of large scale wind investment in ‘energy only’ wholesale electricity markets? Energy Policy 2015, 87, 17–27. [Google Scholar] [CrossRef]
  29. Portuguese Association for Renewable Energy (APREN). Potenciar as Renováveis em Portugal. 2017. Available online: http://www.apren.pt/ (accessed on 1 June 2018).
  30. Breeze, P. The Cost of Power Generation: The Current and Future Competitiveness of Renewable and Traditional Technologies; Business Insights: Warwick, NY, USA, 2010; p. 147. [Google Scholar]
  31. Portuguese Decree Law. Decreto-Lei No. 225/2007, Diário da República No. 105/2007, Série I, 31 de Maio de 2007. 2007. Available online: https://dre.pt/pesquisa/-/search/638769/details/maximized (accessed on 31 May 2018).
  32. Den Bergh, K.V.; Delarue, E. Quantifying CO2 abatement costs in the power sector. Energy Policy 2015, 80, 88–97. [Google Scholar] [CrossRef]
  33. Chaves-Ávila, P.; Würzburg, K.; Gómez, T.; Linares, P. How renewable sources are changing EU electricity prices. IEEE Power Energy Mag. 2015, 29–40. [Google Scholar] [CrossRef]
  34. Iberian Electricity Market Operator (OMIE). Available online: https://www.omie.es (accessed on 1 June 2018).
  35. Spanish Market Operator (OMEL). Available online: https://www.omel.es (accessed on 4 June 2018).
  36. Iberian Electricity Market (MIBEL). Descrição do Funcionamento do MIBEL, Conselho de Reguladores do MIBEL. 2009. Available online: http://mibel.com/ (accessed on 7 June 2018).
  37. Spanish Government. Reglas de Funcionamiento de los Mercados Diario e Intradiario de Producción de Energía Eléctrica, Ministerio de Energía, Turismo y Agenda Digital, Boletín Oficial del Estado, No. 115, Sec. I. 2018. Available online: https://www.boe.es/boe/dias/2018/05/11/pdfs/BOE-A-2018-6295.pdf (accessed on 7 June 2018).
  38. Nielsen, P.; White, M.; Parui, U. Microsoft SQL Server 2008 Bible; Wiley Publishing, Inc.: Indianapolis, IN, USA, 2009; p. 1680. [Google Scholar]
  39. Golov, N.; Ronnback, L. Big data normalization for massively parallel processing databases. Comput. Stand. Interfaces 2017, 54, 86–93. [Google Scholar] [CrossRef]
  40. Green, J.; Bullen, S.; Bovey, R.; Alexander, M. Excel 2007 VBA Programmer’s Reference; Wiley Publishing, Inc.: Indianapolis, IN, USA, 2011; p. 1066. [Google Scholar]
  41. Linoff, G. Data analysis Using SQL and Excel; Wiley Publishing, Inc.: Indianapolis, IN, USA, 2008; p. 690. [Google Scholar]
Figure 1. Global average wind power production costs in onshore exploration [8].
Energies 11 02974 g001
Figure 2. User interface example in “Mode 1”.
Energies 11 02974 g002
Figure 3. User interface example in “Mode 2” by selecting the agent’s code.
Energies 11 02974 g003
Figure 4. User interface example in “Mode 2” by selecting the agent’s name.
Energies 11 02974 g004
Figure 5. Simplified market simulator flowchart in “Mode 1” (left) and “Mode 2” (right).
Energies 11 02974 g005
Figure 6. Simplified market simulator flowchart in “Mode 3”.
Energies 11 02974 g006
Figure 7. Sample result table considering the market simulator in “Mode 2”.
Energies 11 02974 g007
Figure 8. Sample result graphs considering the market simulator in “Mode 2”.
Energies 11 02974 g008
Figure 9. Sample result table considering the market simulator in “Mode 3”.
Energies 11 02974 g009
Figure 10. Sample result graphs considering the market simulator in “Mode 3”.
Energies 11 02974 g010
Figure 11. Hourly average electricity market price differences with the restriction from the real market.
Energies 11 02974 g011
Figure 12. Hourly average electricity market price standard deviation from the real market with restriction.
Energies 11 02974 g012
Figure 13. Hourly average loads to be satisfied in the electricity market.
Energies 11 02974 g013
Figure 14. Hourly condition of the average energy availability in the system with WP restriction.
Energies 11 02974 g014
Table 1. Electricity market price aggregation results, per hour, between Portugal (PT) and Spain (SP) in (€/MWh).
(€/MWh)EMP in PTEMP in SPEMP with WP
Restriction in PT
EMP with WP
Restriction in SP
EMP
Difference in PT
EMP
Difference in SP
TimeMeanσMeanσMeanσMeanσMean%Δσ (%)Mean%Δσ (%)
144.6214.4144.9113.8446.1913.8146.3113.511.573.5−4.21.403.1−2.4
241.2213.9241.4913.2842.7113.4342.8613.101.493.6−3.51.373.3−1.4
339.0913.8839.3513.1140.3913.6140.6912.971.303.3−1.91.353.4−1.1
437.5514.2537.7013.2838.7913.9439.1013.191.243.3−2.21.403.7−0.7
537.4014.3437.0913.5538.9213.9238.9213.351.524.1−2.91.844.9−1.5
638.2814.1538.1713.4739.8413.7339.9613.201.574.1−2.91.794.7−2.0
741.6014.2641.9013.6642.9313.7443.1613.271.333.2−3.71.273.0−2.8
845.2816.6546.4915.2346.8615.5747.3415.011.583.5−6.50.851.8−1.4
946.8117.6549.0915.3049.1115.5949.7615.042.304.9−11.70.671.4−1.7
1049.1117.0850.8815.1550.7315.5751.3514.981.623.3−8.80.470.9−1.2
1149.9516.2251.2314.8351.2415.0851.6914.681.302.6−7.00.460.9−1.0
1249.5815.6250.4714.5651.4014.6751.5214.471.823.7−6.11.052.1−0.6
1349.3715.6550.0914.6250.8814.7450.9714.551.513.1−5.80.881.8−0.4
1449.0815.5349.8814.4350.4214.7250.6514.391.332.7−5.20.781.6−0.3
1547.7515.1348.2014.6248.7914.6548.8814.611.052.2−3.20.681.4−0.1
1646.4015.6046.7315.2147.7515.3047.9215.121.352.9−2.01.202.6−0.6
1746.0615.8046.4015.4547.3715.4447.4315.341.312.8−2.31.042.2−0.8
1847.4615.9347.8215.6548.6715.5148.8115.401.212.6−2.60.992.1−1.6
1949.3216.4649.9216.0650.8015.9950.9515.821.483.0−2.81.032.1−1.5
2050.9416.3651.9215.3452.6715.6152.9315.321.733.4−4.51.001.9−0.1
2152.3215.2653.1314.2653.7614.6854.1214.131.452.8−3.80.991.9−1.0
2252.2115.4053.3413.8054.5313.9154.7113.622.334.5−9.71.372.6−1.3
2349.5714.9450.4713.6751.5713.9751.7613.562.004.0−6.51.292.6−0.8
2444.9914.4945.3713.8147.0214.0947.1513.792.034.5−2.71.783.9−0.2
Average46.0815.3746.7514.4247.6414.6447.8714.271.563.4−4.71.122.5−1.1
Table 2. Aggregation results, per hour, considering the energy availability and market conditions.
TimeEnergy AvailabilityMarket SplitMarket Split with WP Restriction
198.7%3.2%1.6%
298.3%4.7%2.6%
398.3%6.4%3.7%
497.1%8.2%5.7%
597.1%8.1%4.8%
698.5%6.4%3.7%
798.6%4.3%2.4%
898.8%6.3%2.4%
998.3%9.9%2.1%
1098.9%7.3%2.0%
1199.0%4.4%1.1%
1299.2%4.0%1.1%
1399.1%3.7%0.9%
1498.6%4.5%1.3%
1598.4%3.7%1.2%
1698.9%3.9%1.7%
1799.0%3.9%1.5%
1899.5%3.8%1.6%
1999.4%3.7%1.4%
2099.3%4.3%1.4%
2199.1%4.8%2.0%
2299.2%6.0%1.4%
2399.6%4.9%1.0%
2498.9%2.6%1.3%
Average98.7%5.1%2.1%
Table 3. Monthly EMP aggregation results between Iberian countries (€/MWh).
Month/YearEMP in PTEMP in SPEMP with WP
Restriction in PT
EMP Difference
in PT
EMP with WP
Restriction in SP
EMP Difference
in SP
1st QuarterJan./1551.5751.6552.961.4053.201.56
Fev./1541.1541.3143.152.0043.141.84
Mar./1541.7441.7542.700.9642.720.97
2nd QuarterApr./1545.9545.9247.201.2447.201.28
May/1544.5144.3945.891.3845.841.46
Jun./1554.2954.1655.220.9355.181.02
3rd Quarter Jul./1558.4458.4359.370.9359.370.93
Aug./1553.6653.6954.540.8854.620.94
Sep./1549.5449.5350.380.8450.380.84
4th QuarterOct./1548.7248.8949.801.0749.880.99
Nov./1551.1851.0552.691.5152.751.70
Dec./1551.4451.2552.561.1252.581.33
1st QuarterJan./1632.5934.5235.402.8135.841.31
Fev./1626.0826.7927.551.4727.821.03
Mar./1627.1527.6428.130.9828.350.71
2nd QuarterApr./1621.7123.4023.972.2624.951.55
May/1622.8425.2125.722.8826.501.29
Jun./1634.1038.4337.883.7939.130.70
3rd QuarterJul./1639.5040.4641.081.5941.320.86
Aug./1639.9940.0040.750.7640.750.75
Sep./1642.5142.9743.651.1543.700.73
4th QuarterOct./1652.1552.3453.070.9253.320.97
Nov./1656.2056.4357.771.5757.981.55
Dec./1658.1160.0460.572.4661.191.15
1st QuarterJan./1771.1772.6574.273.1074.521.86
Fev./1746.1549.9049.643.4951.191.28
Mar./1743.3542.8744.320.9744.241.37
2nd QuarterApr./1743.2843.4844.491.2144.721.24
May/1746.8046.8047.720.9247.720.92
Jun./1749.3149.6849.910.6150.150.48
3rd QuarterJul./1747.5447.7548.250.7048.310.56
Aug./1746.0946.1946.830.7546.860.66
Sep./1748.1448.1948.670.5348.720.53
4th QuarterOct./1756.0255.9757.031.0056.960.99
Nov./1760.3860.4961.360.9761.641.15
Dec./1757.6857.4259.011.3459.351.93
Table 4. Daily EMP aggregation results between Iberian countries (€/MWh).
DayEMP in PTEMP in SPEMP with WP
Restriction in PT
EMP Difference
in PT
EMP with WP
Restriction in SP
EMP Difference
in SP
Monday47.3947.7048.751.3648.891.18
Tuesday48.9549.5050.151.2050.440.94
Wednesday48.7349.2450.191.4650.391.16
Thursday48.7349.4350.191.4650.400.97
Friday47.6748.8749.331.6649.730.86
Saturday43.3644.0745.081.7245.371.30
Sunday38.5438.4939.841.3039.951.45

