Article

Transient Performance Analysis of the Solar Optical Guide Lighting System in Building Groups

1
College of Mechanical and Electrical Engineering, Hohai University, Changzhou 213022, China
2
Lyles School of Civil Engineering, Sustainable Materials and Renewable Technology (SMART) Lab, Purdue University, West Lafayette, IN 47906, USA
*
Author to whom correspondence should be addressed.
Energies 2018, 11(11), 2898; https://doi.org/10.3390/en11112898
Submission received: 28 September 2018 / Revised: 22 October 2018 / Accepted: 23 October 2018 / Published: 25 October 2018

Abstract

:
With accelerating urbanization, lighting problems frequently appears for residents at lower levels of buildings. In order to solve the sunlight blocking problem between high buildings, a new solar optical guide lighting (SOGL) system is proposed in this study. Numerical simulations are carried out to evaluate the SOGL system according to the light distribution both inside the buildings and between building groups at different times. Experimental setups are built to validate the simulated results. Main factors influencing the optical efficiency are discussed. It is found from this study that the SOGL system can realize the lighting purpose inside and between high buildings. The shadow areas between buildings are lightened into acceptable levels. The stronger the solar irradiation is, the higher the optical efficiency would be. And decreasing the ratio of optical guide pipe length to its radius would lead to the rise of optical efficiency.

1. Introduction

With accelerating urbanization, immigrants are swarming into cities. Half of the global population has already lived in cities, and by 2050 two-thirds of the world’s people are expected to live in urban areas [1]. In order to accommodate the ever-increasing population, more and more high-rise buildings are under construction in already congested urban environments. High-rise buildings often have many impacts on the surrounding cityscape. One main problem is that they can cast shadows, which can stretch for half a mile or more at sunset [2]. As such, it is hard for the residents at the low levels to obtain natural sunlight [3]. Many lighting methods are then used to satisfy the illuminating requirements, among which electrical lighting is one of the options. Not only is electrical lighting responsible for a significant amount of the electrical demand on a commercial building, but it can also cause excessive cooling loads. Statistical results show that lighting takes 20% of the total electricity consumption in buildings, among which only 25% is converted into light with the other 75% being thermal loss [4]. On the other hand, solar energy has the advantages of being clean, renewable, and free of charge. Solar lighting is another good option. Windows are the most traditional daytime lighting option. Katunský et al. examined the use of windows for natural illumination on two sides in a vertical industrial facility [5]. Gürlich et al. evaluated the daylight performance of a translucent textile membrane roof [6]. Utility costs for a building can be decreased when solar lighting is properly designed to replace electrical lighting using windows. However, due to the privacy and heat preservation, the window can only take up small areas of the building’s external walls [7,8]. The solar optical guide is another option for solar lighting. In the 1990s, a solar optical guide lighting (SOGL) device was successfully invented in the United States [9]. Laforet made the first SOGL system named “Himawari” [10]. In China, Shenyang Institute of Architectural Engineering and Nanjing Institute of Glass Research also made some contributions to commercialization of SOGL systems [11,12]. A set of SOGL system was installed in the underground garage in the central area of the Beijing Olympic Games in 2008, which was the first attempt to use the solar lighting in the public large building in China [13]. As the SOGL system achieved good feedback from commercial markets, design, simulation, and experimental studies were widely carried out to optimize its structures and parameters [14,15,16,17,18,19]. Earp et al. designed a SOGL system, which transported sunlight to remote areas of a building using a stack of pink, green and violet luminescent solar concentrators and clear polymethyl methacrylate (PMMA) light guides [14]. Wong et al. investigated a remote source solar lighting system to the enclosed lift lobbies of high-rise residential buildings in Hong Kong [15]. Kandilli et al. proposed a fibre optic bundles solar lighting system, which transferred concentrated solar energy via optical fibres. Experimental results showed that parameters affecting the solar lighting efficiency were the solar irradiation, the reflective materials and the solar spectrum [16]. Saunders et al. designed a passive solar lighting system, which consisted of a light collector with a boxlike system of diffusers. Results indicated that on clear days, average illumination levels could be over 300 lux [17]. Vázquez-Moliní et al. designed a horizontal sunlight collection device for SOGL systems, which consisted of a light collector at an external vertical wall of the building and a modular light guide between the horizontal ceiling and the light extractor [18]. Malet-Damour et al. carried out modeling and experimental studies to tubular daylight guide systems in buildings and found that the light distribution in the room was strongly related to the type of sky [19]. There are also many case studies on the performance of SOGL systems at different regions [20,21,22,23]. Wu and Li studied the lighting performance of a top lighting SOGL system in a meeting room in Beijing and found that the daily average illumination was 147.8 lux [20]. Baglivo et al. carried out a case study of SOGL devices for zenith light in Italy [21]. Zhang et al. designed straight light-pipes with various configurations under all weather conditions in the UK [22]. Toledo et al. analyzed the performance of a SOGL pipe prototype in Brazil and proposed the optimal SOGL pipe configurations [23].
It is of high significance to achieve efficient utilization of clean and renewable solar energy to supply natural lighting in buildings [13,20,21,22,23], especially to the lower levels and shadow areas [15]. However, most studies discussed the solar illumination inside the buildings [14,15,16,17,18,19,20,21,22,23]. There are few studies discussing the blocking problems between building groups. In the present study, a new solar optical guide lighting (SOGL) system is proposed to guide the sunlight “transmitting through” the buildings and lighten the shadow area between building groups. The new system is first designed. The light distribution inside and between buildings with the SOGL system is then simulated by using TracePro software. The simulated results are validated by an experimental setup. And the configuration sizes of the SOGL pipes are finally optimized.

2. Material and Methods

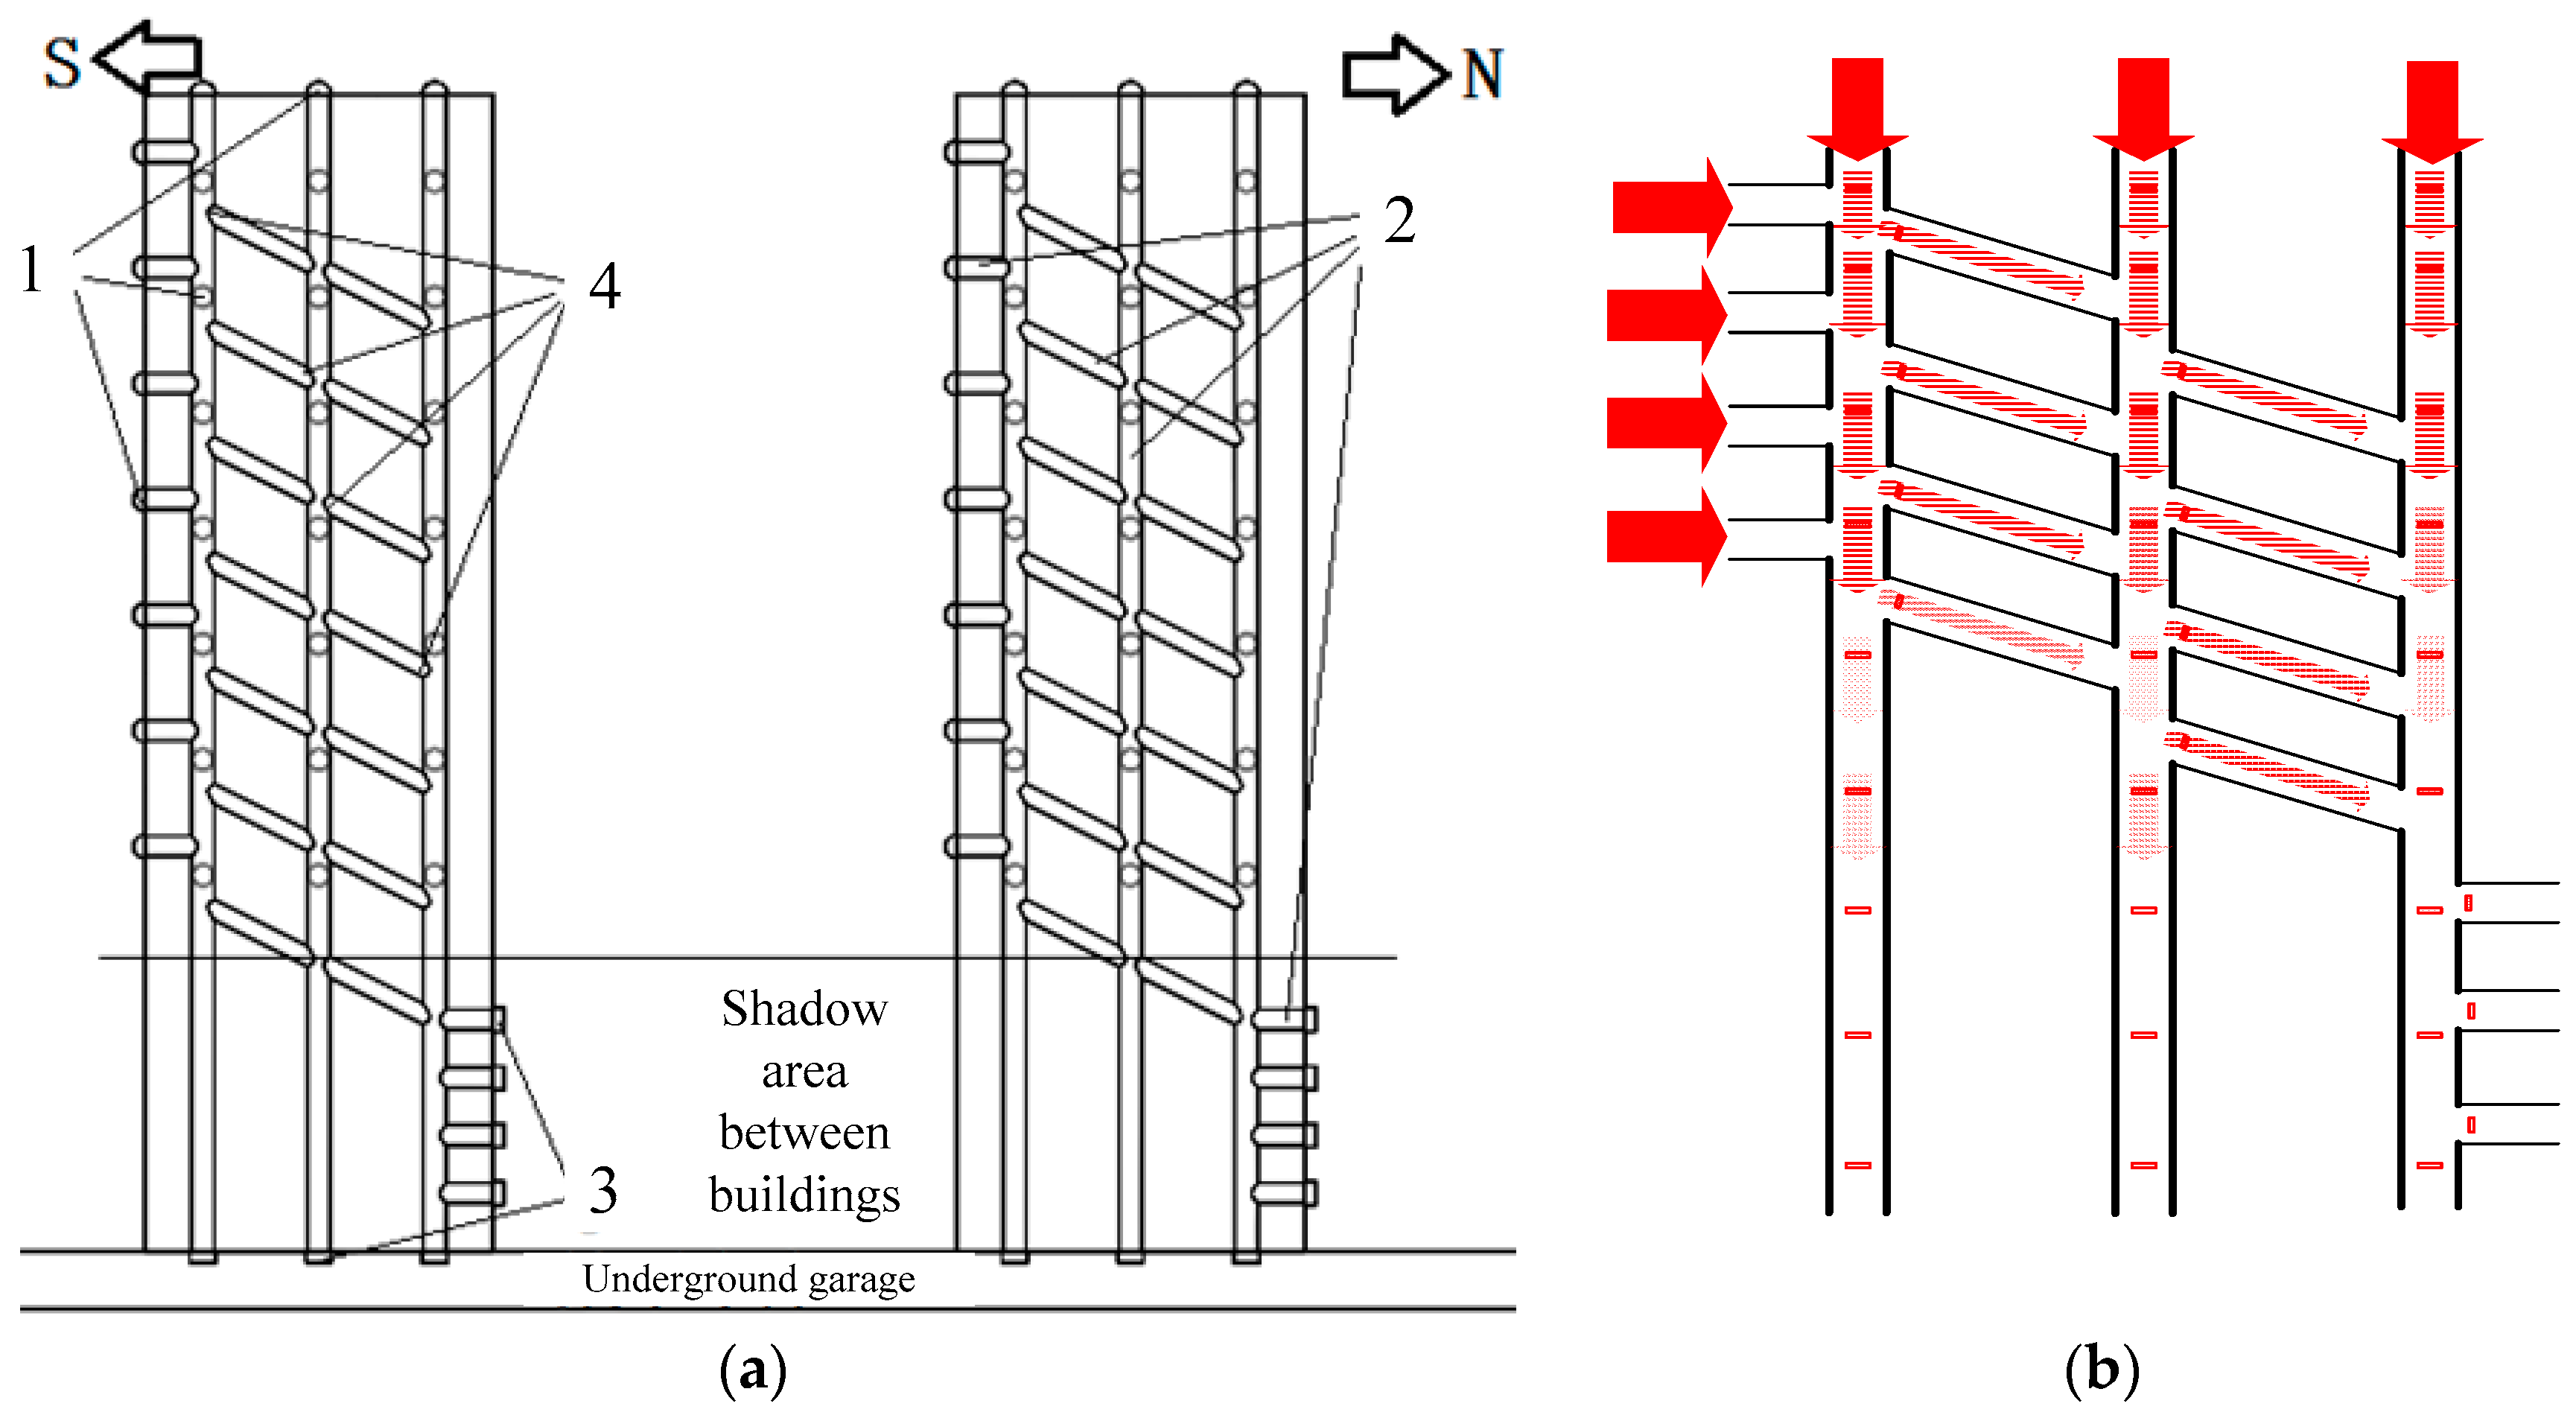
2.1. Design of a New SOGL System

Schematic of the designed SOGL system is shown in Figure 1. The SOGL system is composed of the lighting covers, optical guide pipes, diffusers, and node-dimming devices. As shown in Figure 1a, a lighting cover is used to prevent the dusts and vapor but allow all sunlight to enter the optical pipes. It is mainly distributed on the roof, the southern, the eastern and the western walls of the building. It is connected by the optical guide pipe. The optical guide pipe has two types: straight and elbow light guide pipes. The bend angle of the tube is 0–90° and can be adapted to the facilities of the building, i.e., the stairs, ventilating duct, and ceiling. The inner surface of the light guide pipe is plated with special films, ensuring very high reflectivity and stability. Diffusers are set at the outlet of the optical guide pipes. The node-dimming device is installed at the intersection of the optical guide pipes to control the transfer direction of the sunlight.
During the daytime, high buildings can receive sufficient direct sunlight from the roof and the southern walls. In the morning, the eastern walls can receive sufficient sunlight, but the western walls can only obtain some scattered or reflected light. Similarly, in the afternoon, the western walls can receive sufficient sunlight, but the eastern walls can only obtain some scattered or reflected light. However, the lighting conditions at lower levels and between buildings are poor all the daytime. Considering this, multi-node distributed light pipes and diffusers are located inside the rooms and the external walls of the lower levels as shown in Figure 1a. The collected light is transferred through the optical guide pipes, where it is redistributed by the node-dimming device. The purpose of the node-diming device is to transfer the inside sunlight to the required locations according to the local illumination condition. For example, when the underground garage needs lighting, the node-dimming device would transfer more sunlight directly downward to the garage. And when the shadow areas need illumination, more sunlight inside the optical guides would be transferred toward the external walls at the lower levels. The schematic of the light transfer pathway is shown in Figure 1b. The sunlight is evenly and efficiently irradiated to the lower levels of the buildings, the underground garage, and the shadow area between building groups, according to the outside solar irradiation conditions, the local illumination condition and the user requirement.

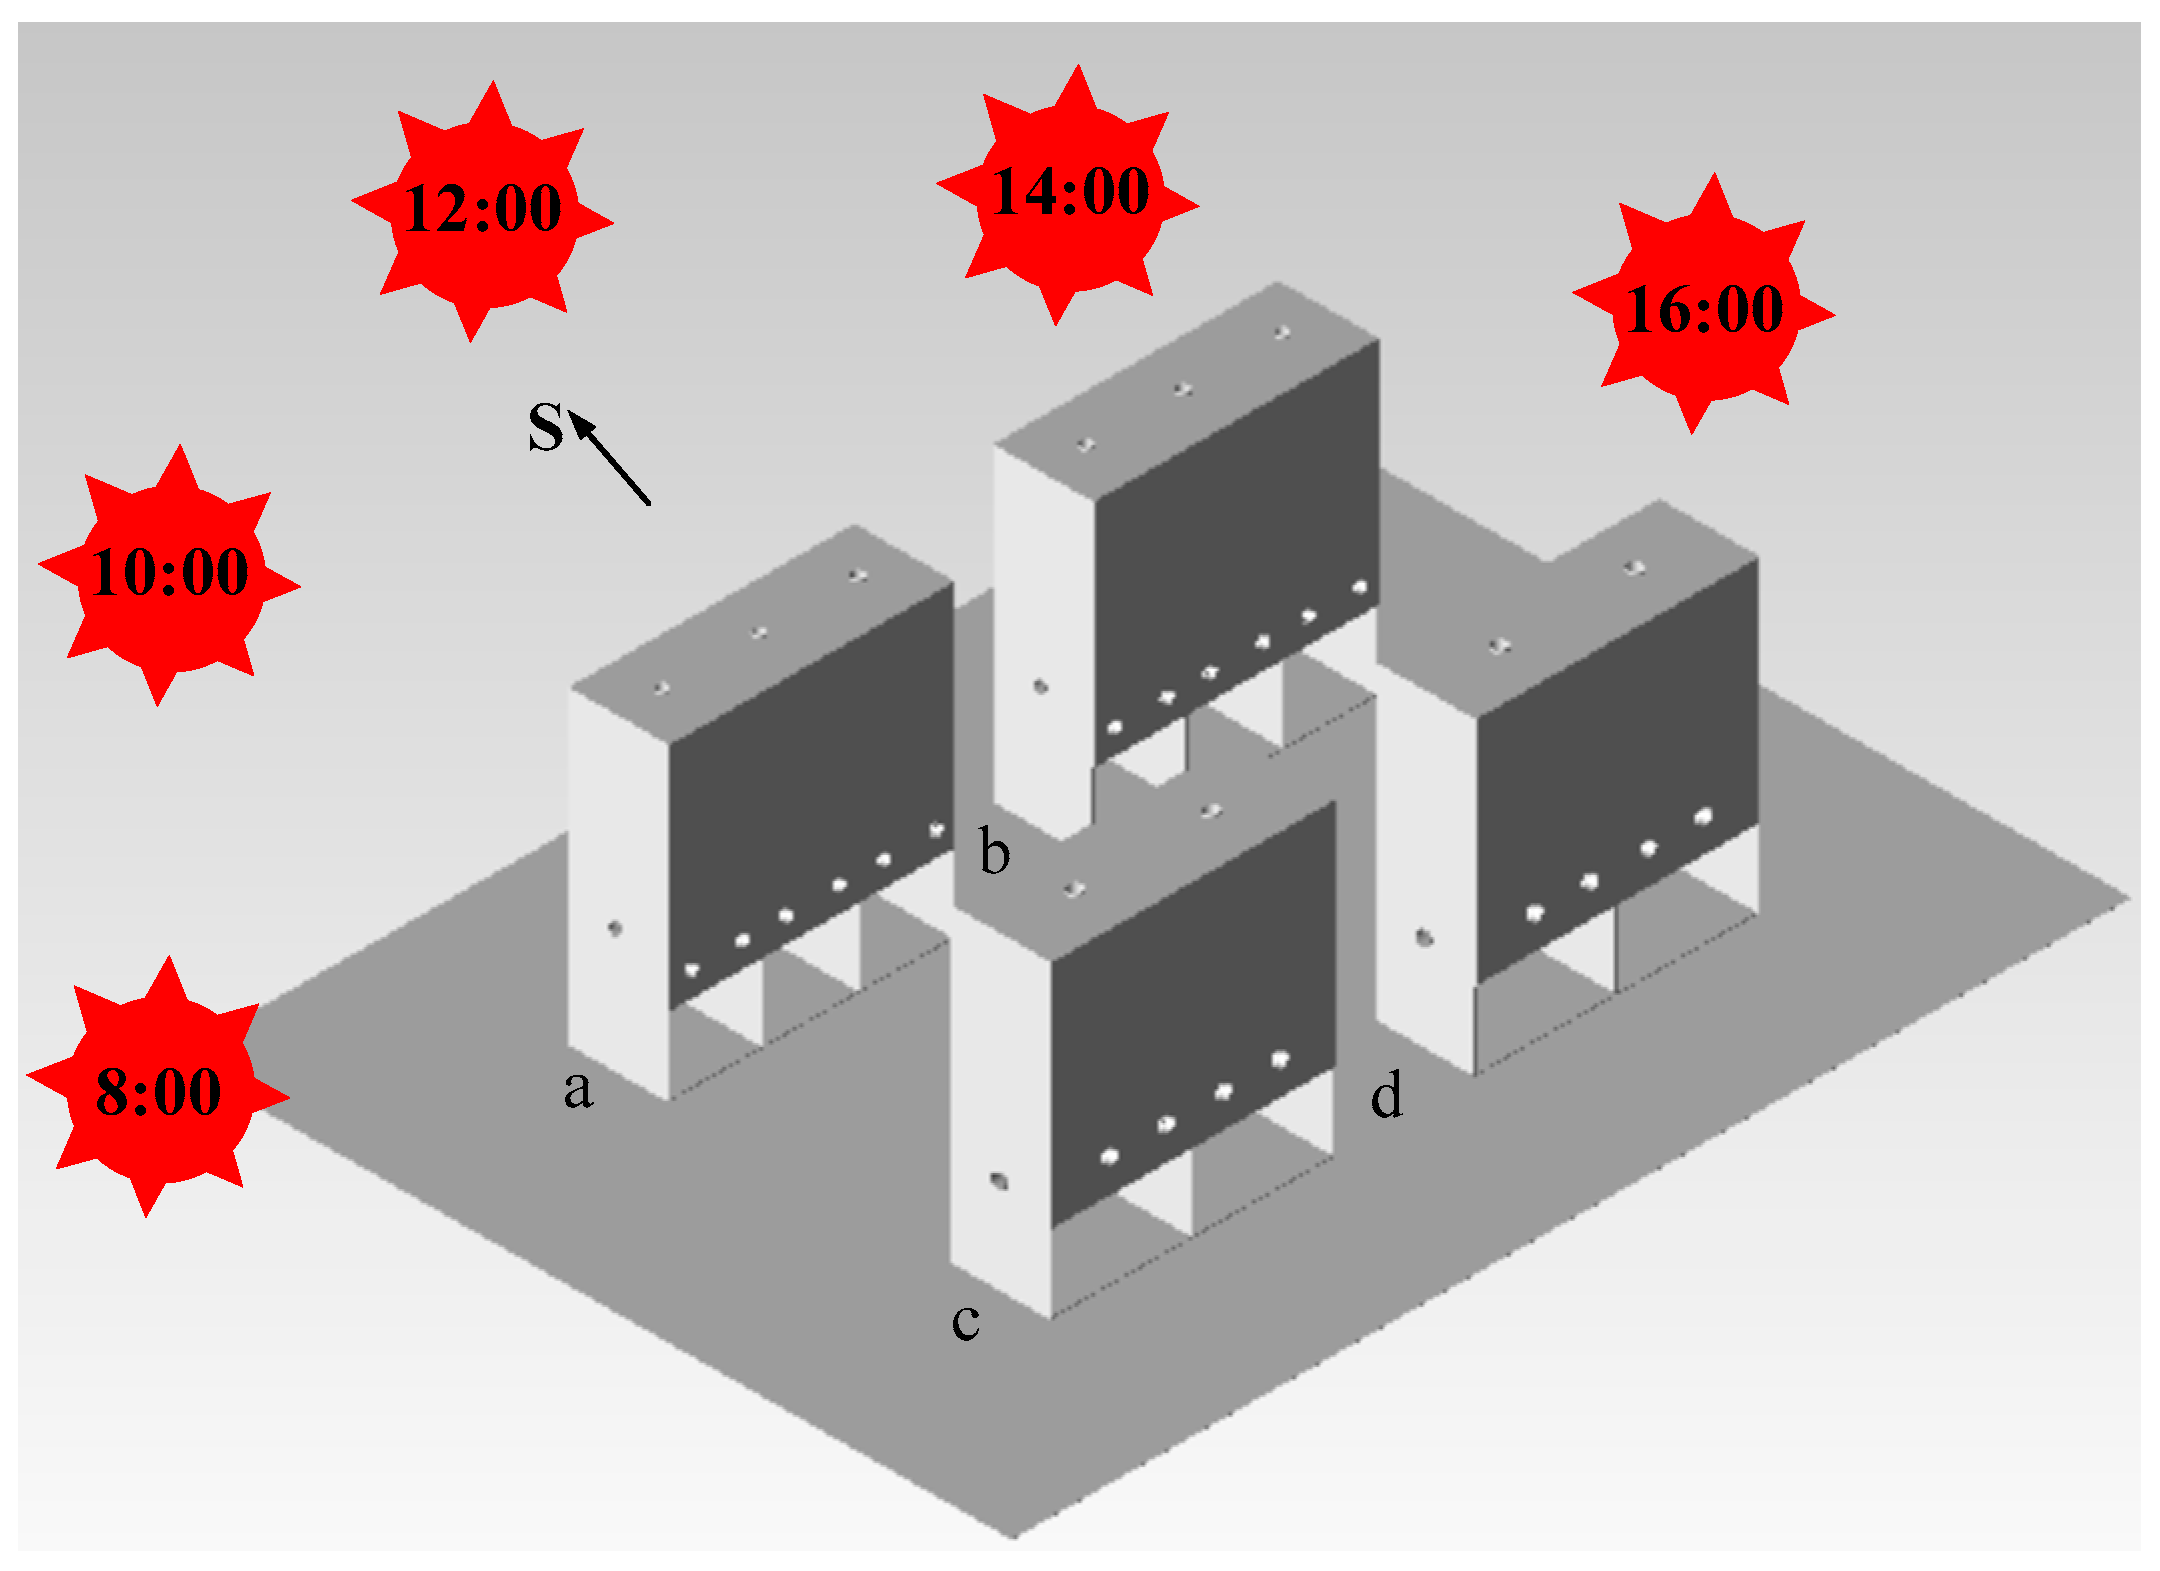
2.2. Model, Configuration and Materials

In order to obtain the performance of SOGL systems in building groups, four parallel high buildings are considered as one building group. The schematic of the building group is shown in Figure 2. These four buildings have the same dimension and all face directly to the south. Buildings a and b are at the south of Buildings c and d, respectively. In order to compare the illumination in different building structures, three rooms are set at the ground levels of Buildings a and b and two rooms are set at the ground levels of Buildings c and d. The SOGL system is correspondingly adopted to the structural of the buildings. Schematic of the SOGL system in the building group is also shown in Figure 2. Three lighting covers, which are connected by the vertical optical guide pipes, are arranged at the roofs of Buildings a and b. And two lighting covers, which are connected by the vertical optical guide pipes, are arranged at the roofs of Buildings c and d. One lighting cover, which is connected by the horizontal optical guide pipe, is respectively arranged at each eastern wall and each western wall of Buildings a, b, c and d. Six lighting covers, which are connected by the horizontal optical guide pipes, are arranged at the northern walls of Buildings a and b. Four lighting covers, which are connected by the horizontal optical guide pipes, are arranged at the northern walls of Buildings c and d. Configuration sizes of the buildings, the optical guide pipes in each building are shown in Table 1. The parameters in Table 1 follow the standard for daylighting design of buildings in China [24].
The sun travels through the sky and its position changes from time to time. The sun’s elevation angle H is defined as:
sin H = sin φ sin δ + cos φ cos δ cos t  
And the sun’s azimuth angle γs can be calculated using the following Equation:
cos γ s = sin φ cos δ cos t c o s φ s i n δ cos H  
where φ is the local geographical latitude, δ is the local solar declination angle and t is the solar hour angle. According to Equations (1) and (2), five sun positions are considered in this study as shown in Figure 2. Taking Changzhou city, China (32° N, 120° E) as the case, the corresponding solar elevation angle, azimuth angle and illumination intensity are shown in Table 2 [25].
The optical efficiency of the SOGL system is defined as:
η = Φ Φ 0  
where, η is the optical efficiency of SOGL system, Φ is the total luminous flux output from a diffuser and Φ0 is the total luminous flux collected by the lighting covers.
TracePro software is frequently used to simulate and optimize the light pipes, light guides, non-imaging lenses and mirrors with the Monte Carlo ray tracing method [26,27]. TracePro software is thus used to simulate the illumination of the SOGL system in the present study. The model is first built according to the configurations in Figure 2 and dimensions in Table 1. Then materials and parameters of light sources and surfaces are defined according to Table 3. The materials in Table 3 are selected in the database of TracePro Software and following the standard for daylighting design of buildings in China [24]. The lighting distribution inside the optical guide pipes is then simulated using Monte Carlo ray tracing method. During the simulation process, incident directions of the rays are calculated according to Table 2. The rays reach the building surfaces, the ground and the lighting covers. Rays reaching the lighting covers then enter the SOGL system, in which they are transferred towards different locations in the buildings. Different numbers of incident rays are set in the software until the ray numbers do not affect the final simulation results. Finally the illumination distributions inside the rooms and shadow areas are obtained.

3. Results and Discussion

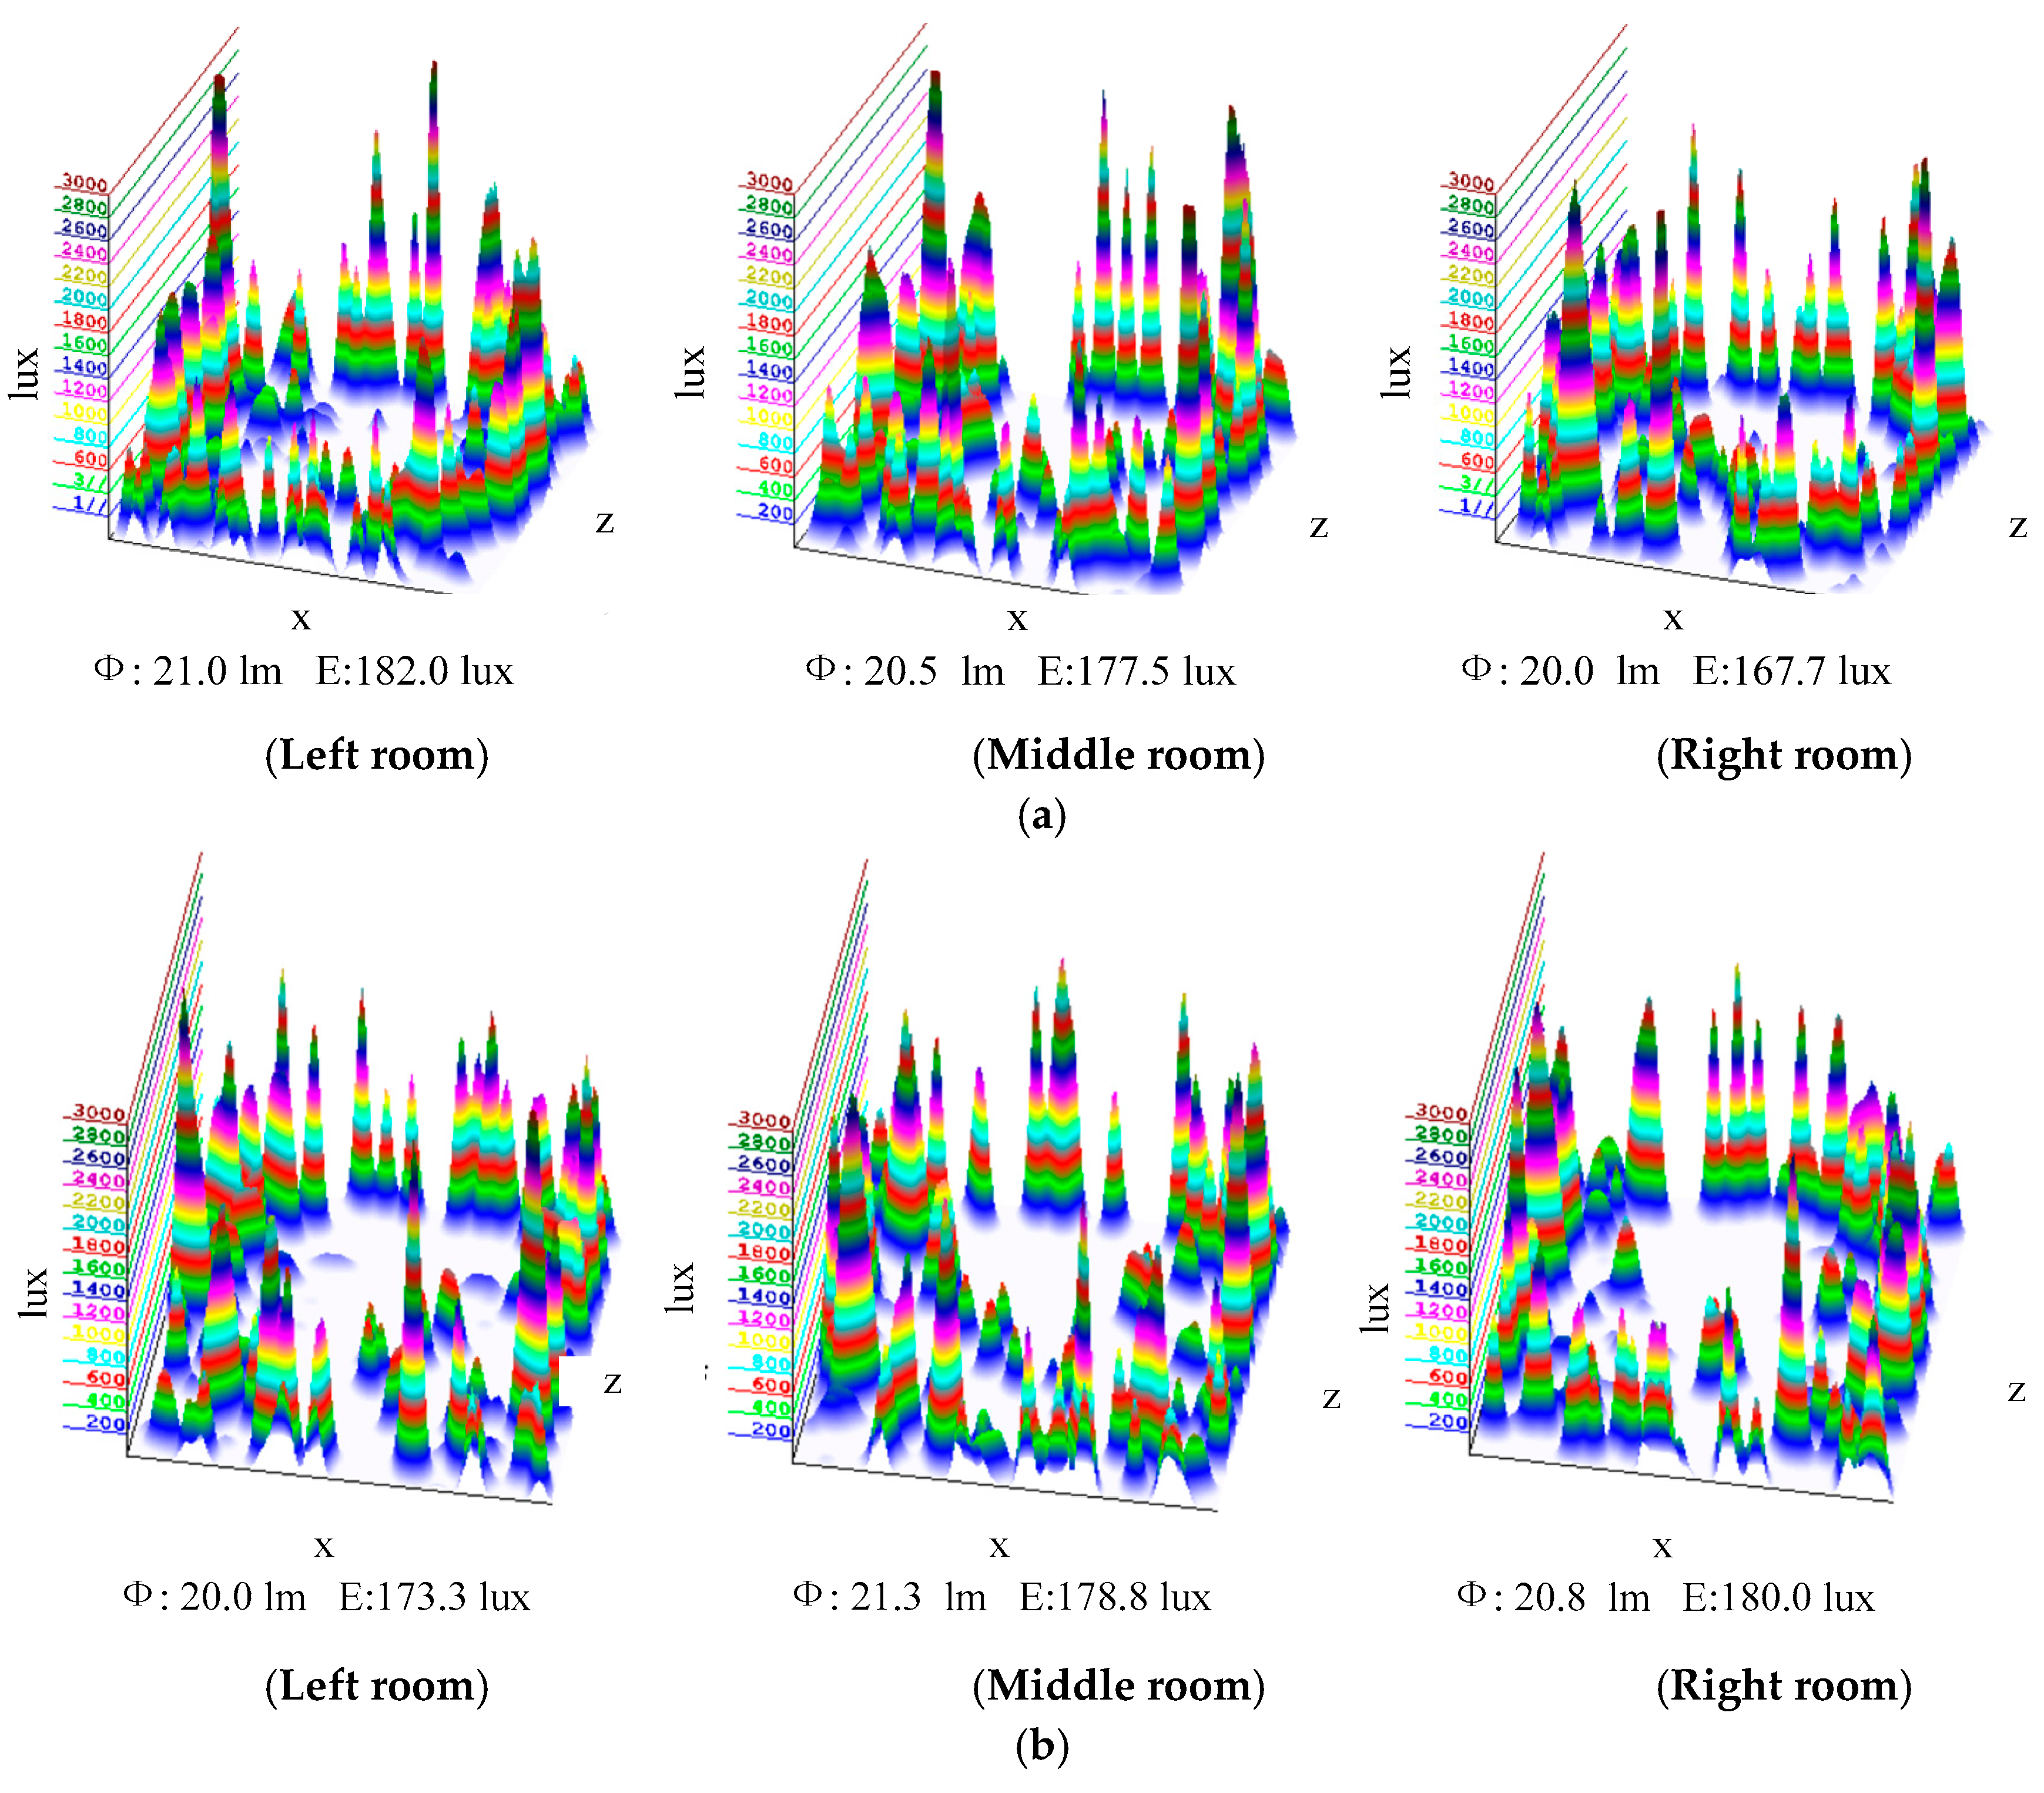
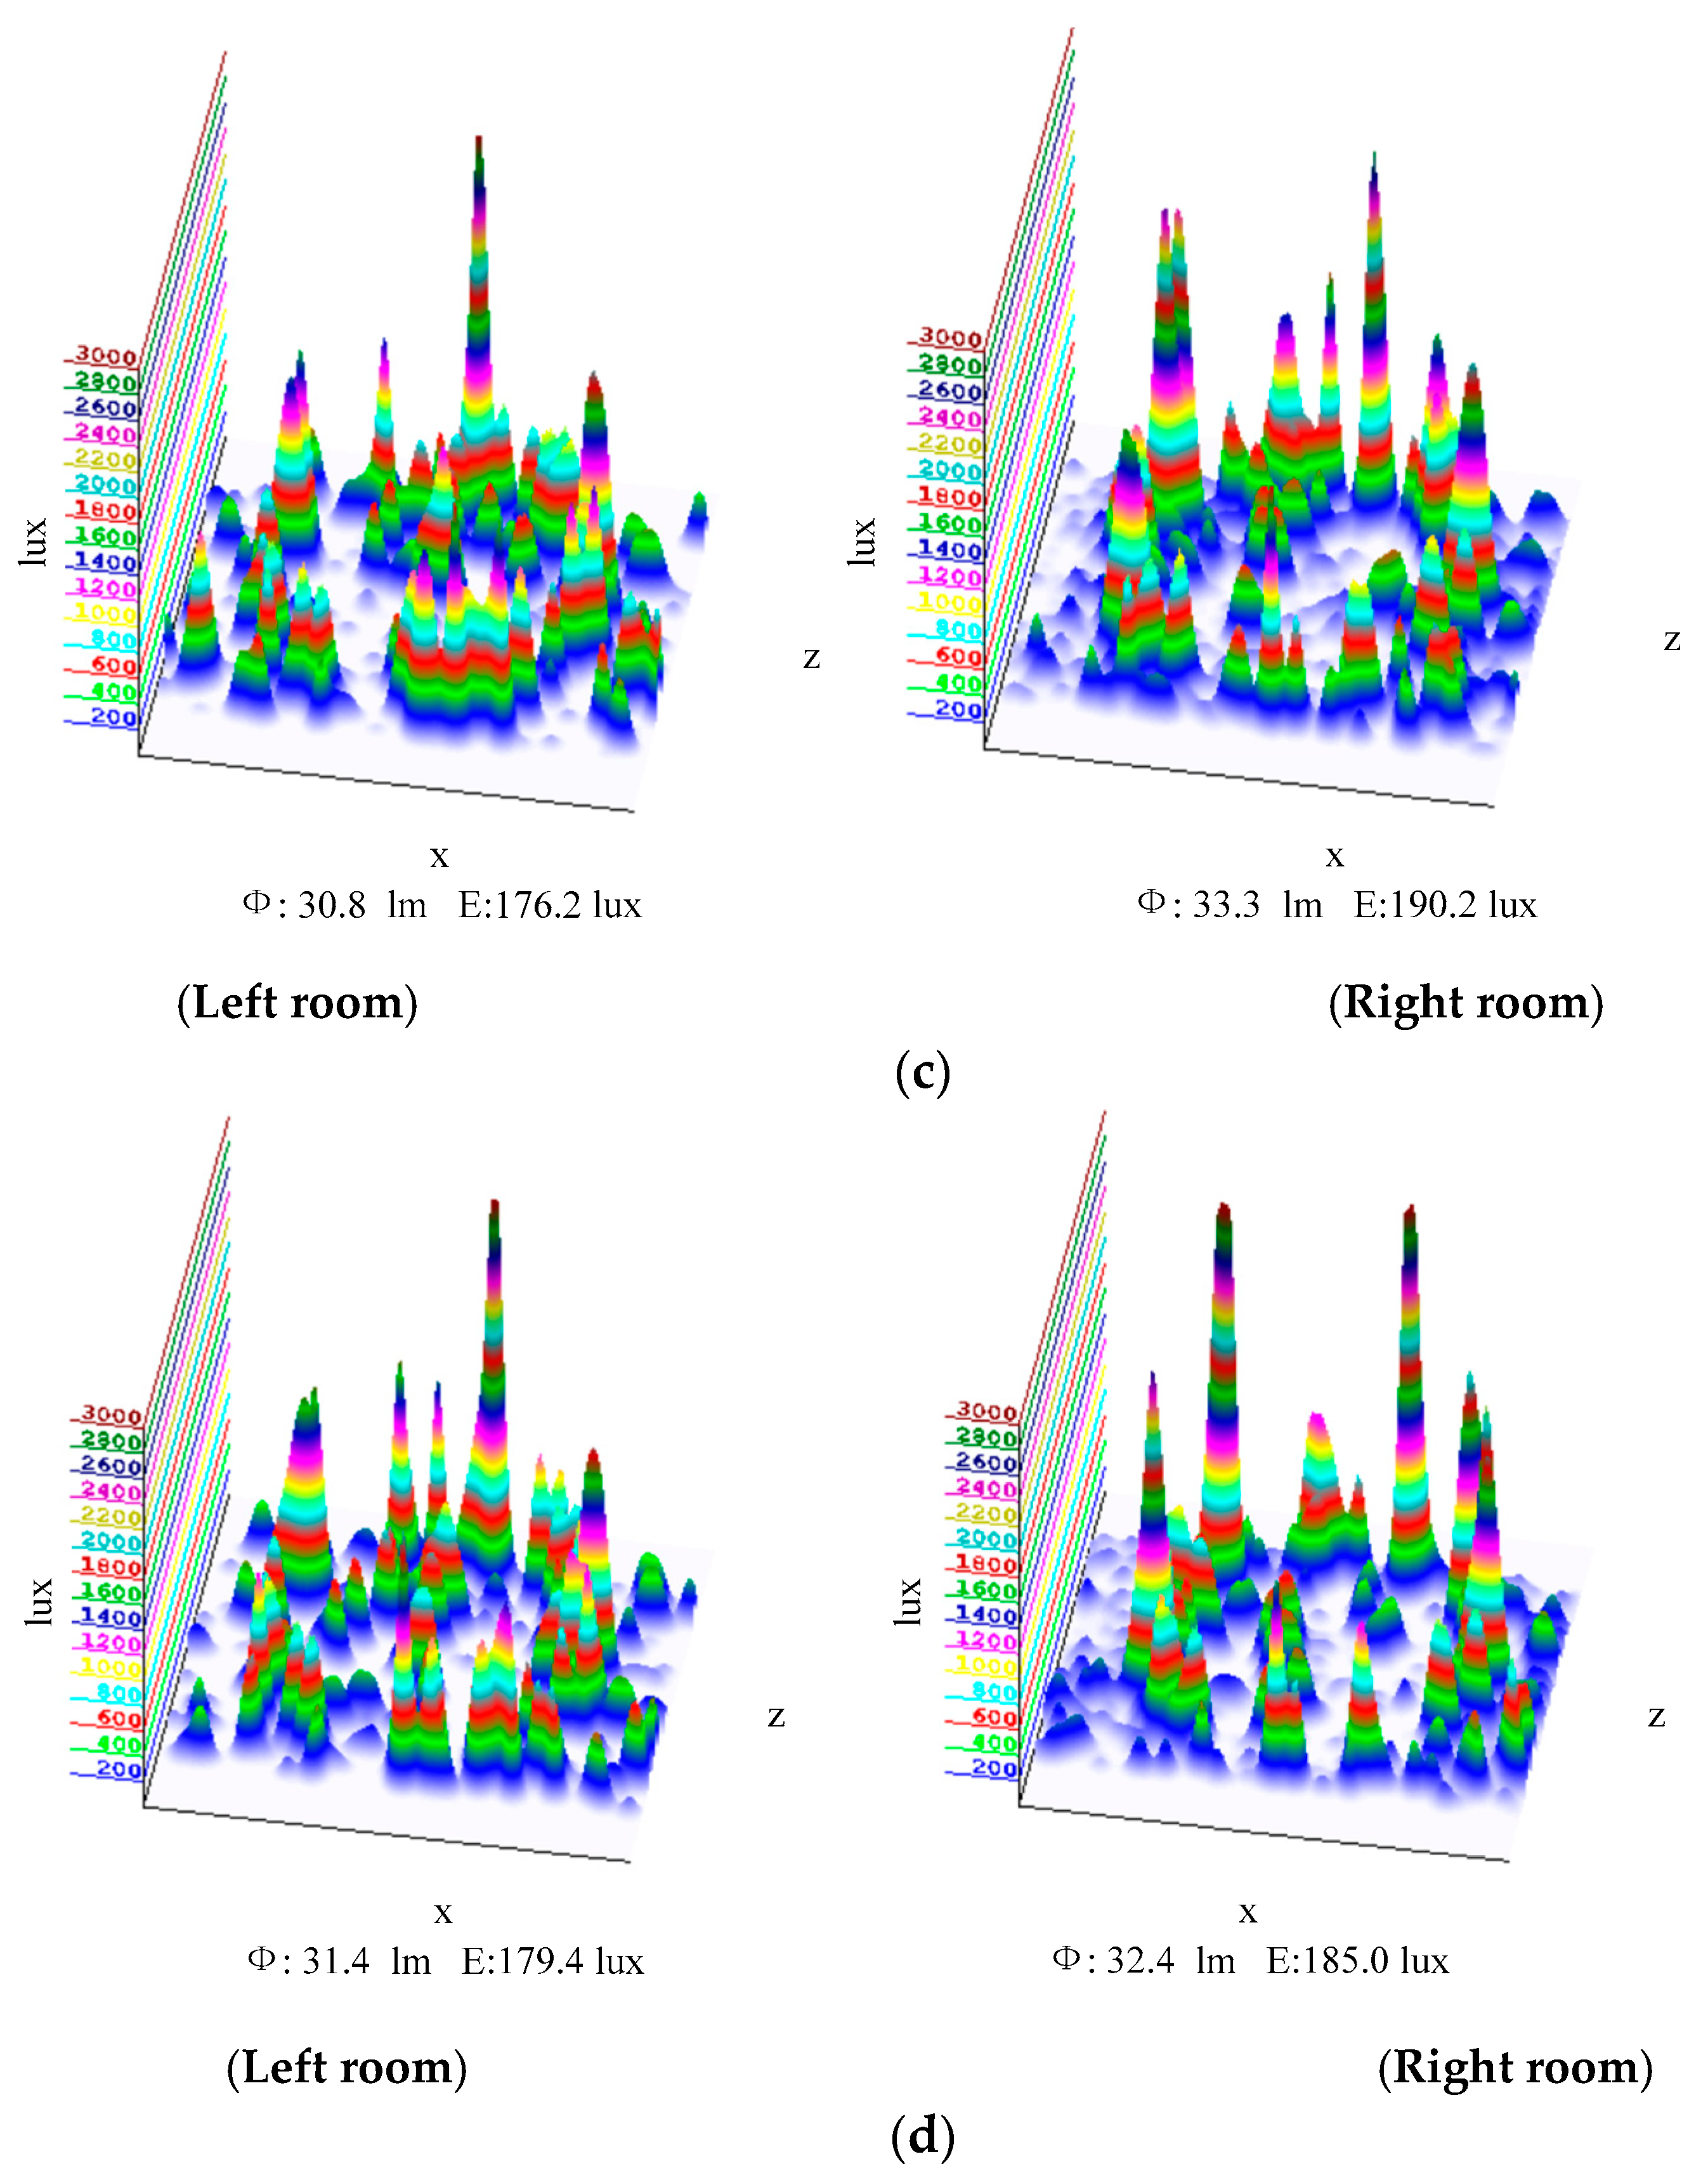
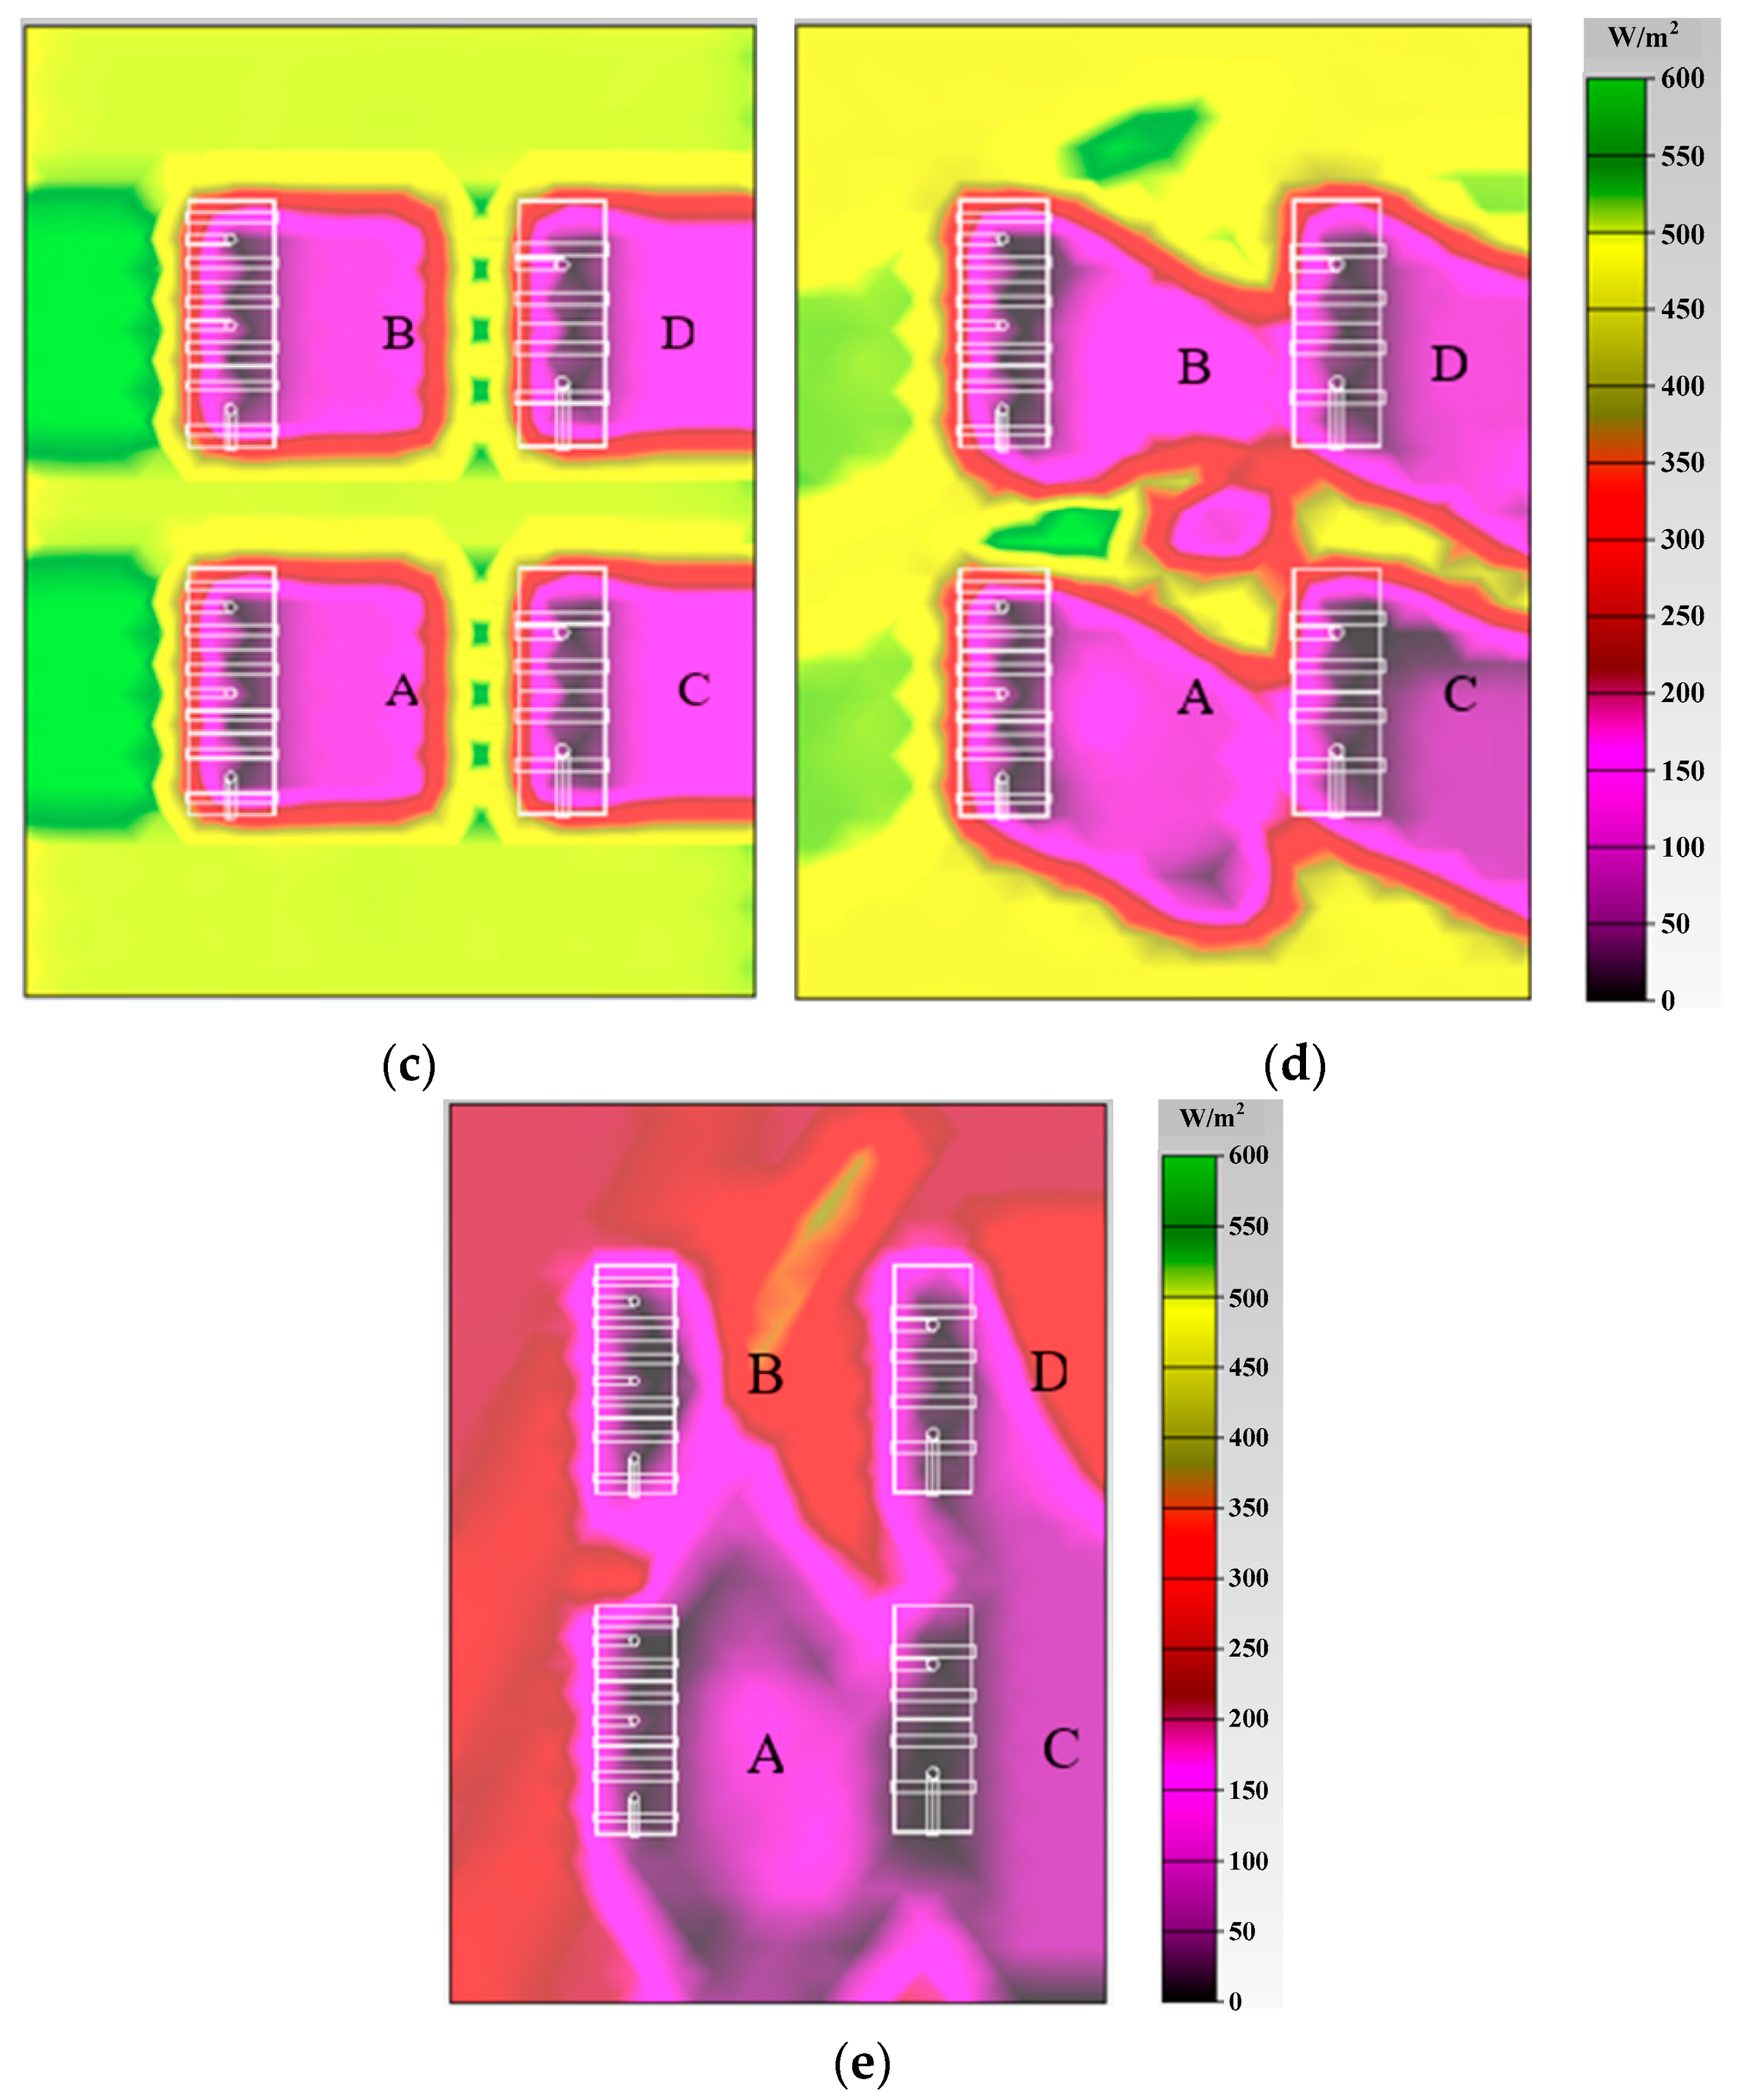
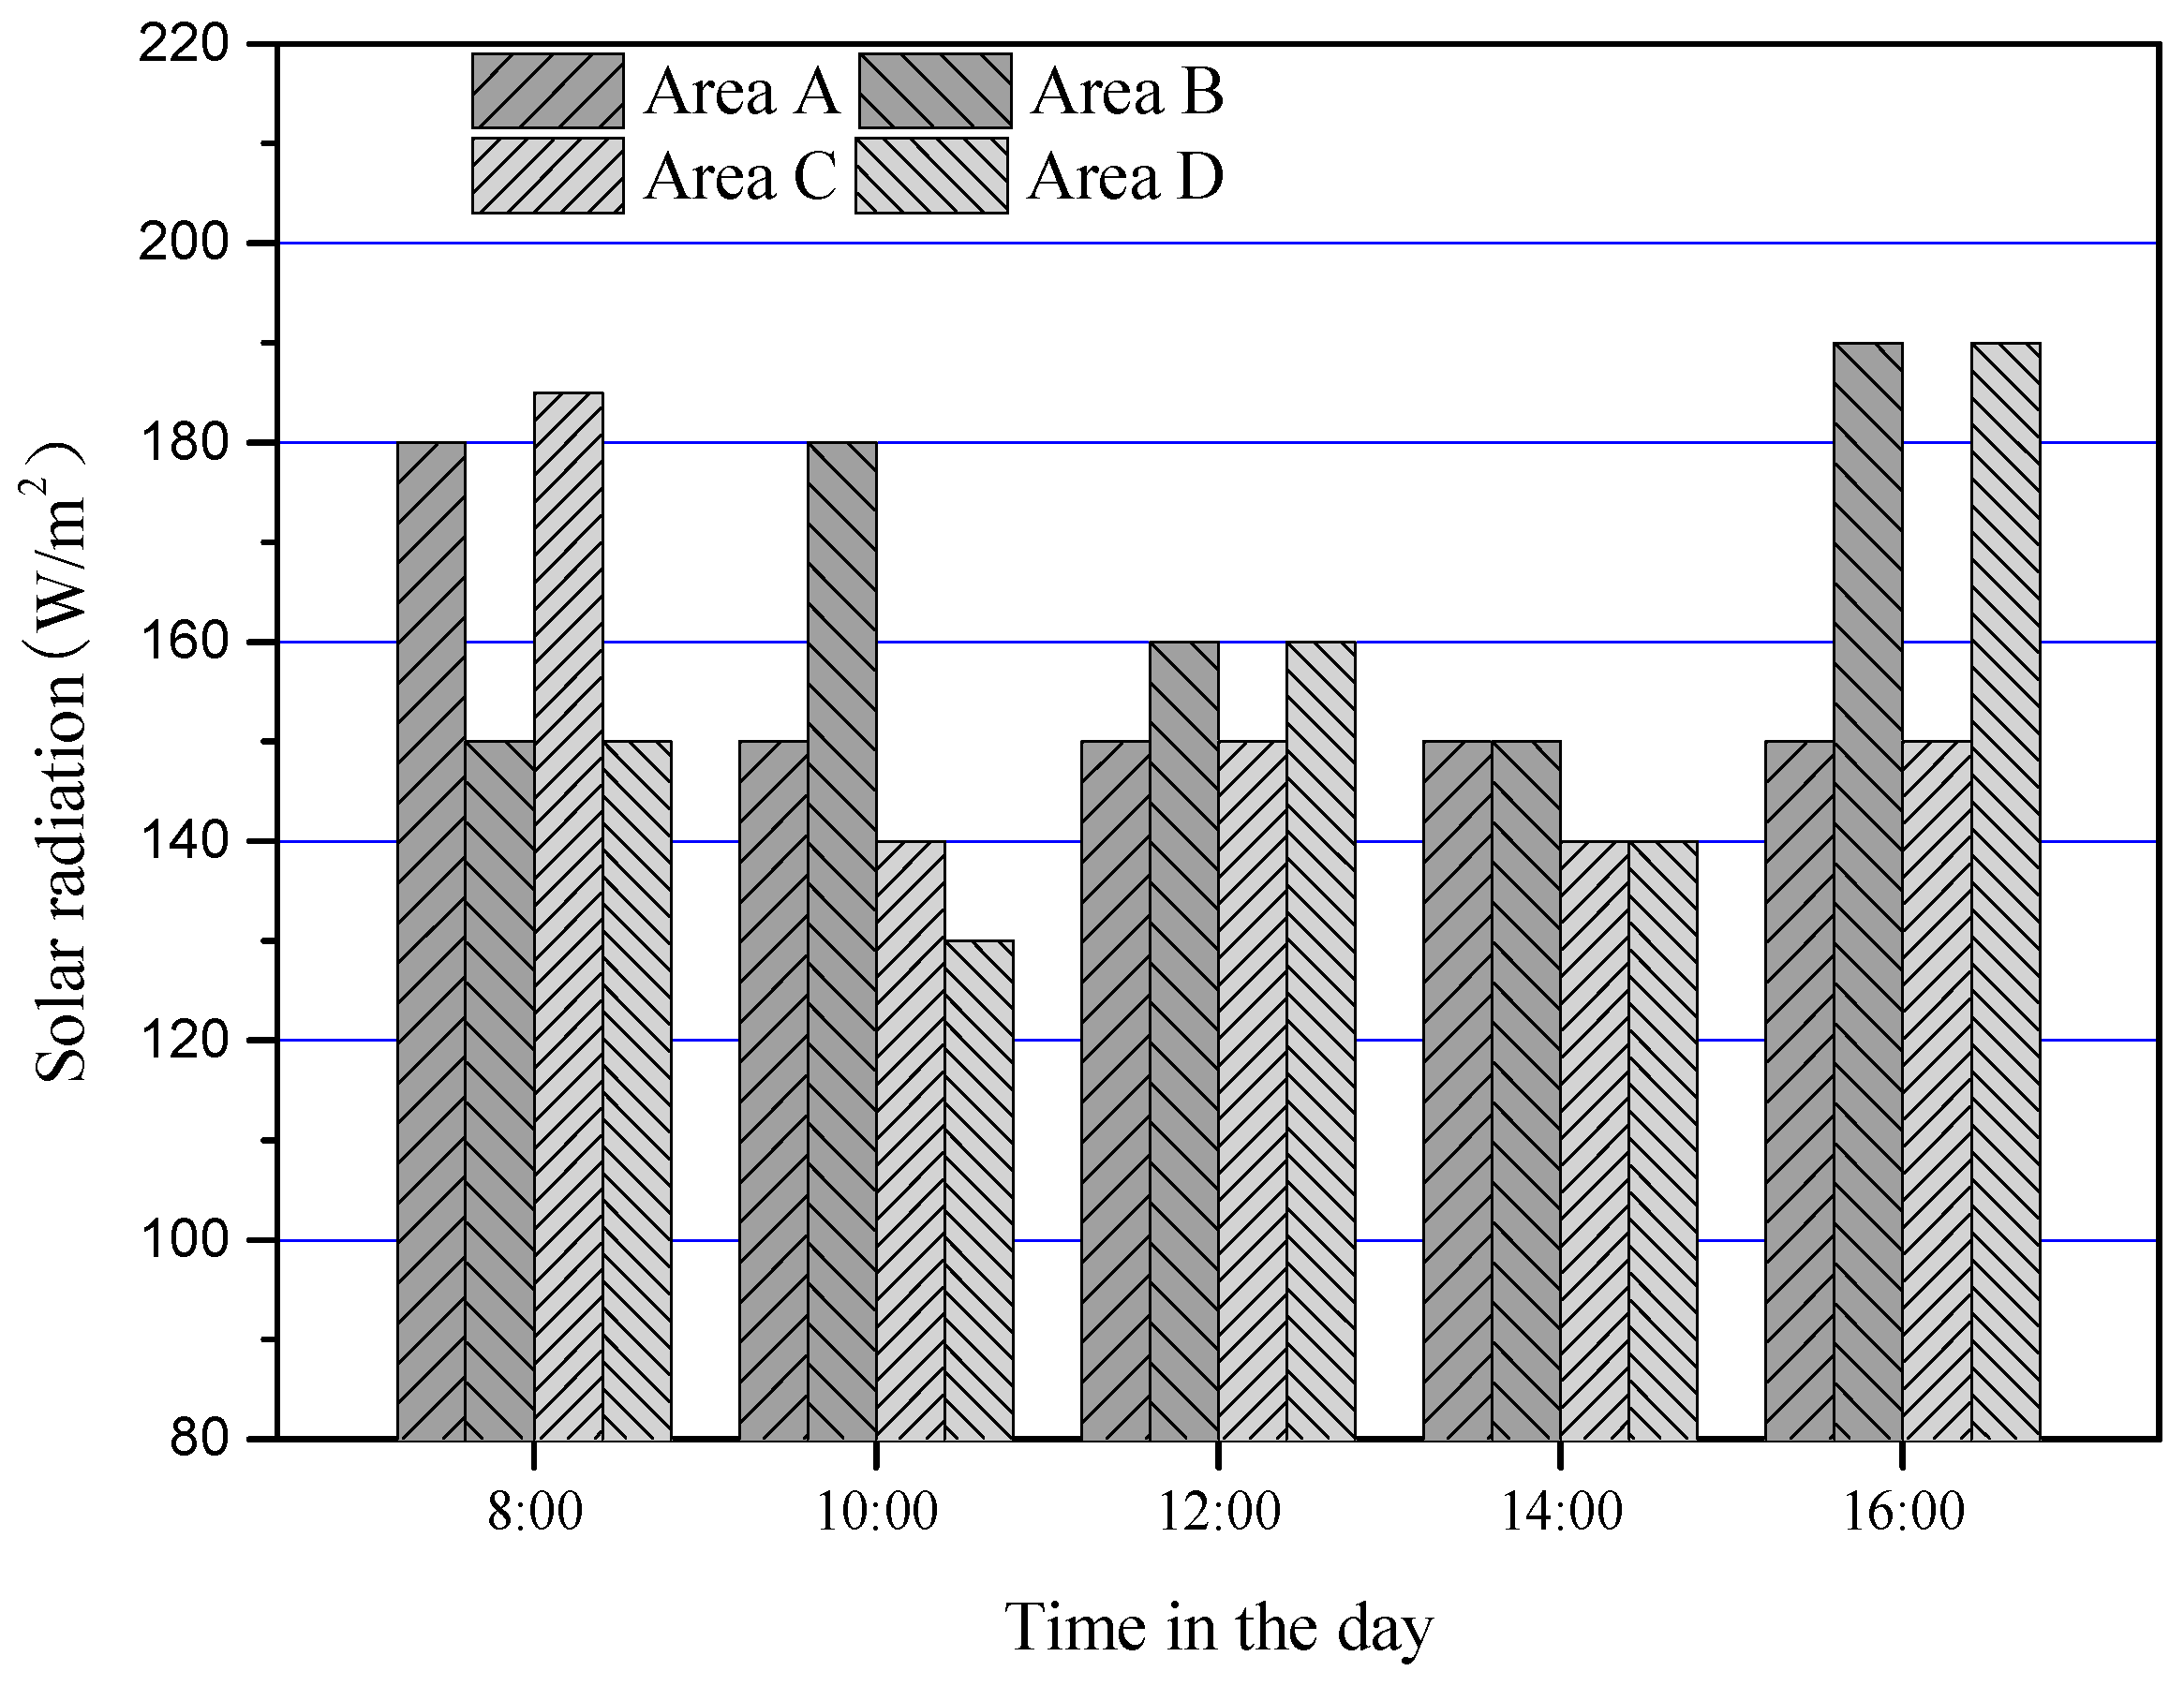
3.1. Simulation Results

Figure 3 shows the illumination distributions inside the rooms at the ground floor at 12:00. As shown in Figure 3, solar radiation can be effectively introduced into the buildings using the SOGL pipes. The illumination distributions in three rooms of Buildings a and b are mainly near the walls and the centre illuminations are relatively low. However, the illumination distributions in two rooms of Buildings c and d are more uniform than those in Buildings a and b. The detailed illumination values of ground floor rooms at 12:00 in Building a, b, c and d are shown in Figure 4, respectively. It is found that, the total luminous flux in two rooms of Buildings c and d are larger than those in Buildings a and b. The reason is that the total obtained sunlight is divided into two rooms in Buildings c and d, but it was divided into three rooms in Buildings a and b. Refer to the total luminous flux and the average illumination intensity in Figure 4a–d for details.
The simulated results of indoor illumination at different times are then summarized in Table 4. It is found from Table 4 that, from 8:00 to 16:00, the illumination intensity inside the ground floor rooms of each building first increases then decreases, reaching the maximum between 12:00 and 14:00, which matches well with the solar radiation intensity between 8:00 and 16:00 as shown in Table 2. At the same time, from 8:00 to 16:00, the incident sunlight angles first decreases then increases, which also leads to the illumination intensity tendency in Table 4. Between 8:00 and 12:00, the illumination intensity of building a is slightly greater than that of building b, and the illumination intensity of building c is slightly greater than that of building d. Between 12:00 and 16:00, the illumination intensity of the building b is slightly greater than that of the building a, and the illumination intensity of the building d is slightly greater than that of the building c. The reason is that the arrangement of the optical guide pipe is not symmetrical. In the morning, when sunlight comes from the East, there will be more sunlight collected by the lighting covers on the eastern walls. The western buildings (Buildings b and d), due to the shielding effect between buildings, are not as well illuminated as the buildings in the east (Buildings a and c). In the afternoon, the similar phenomena appear to the eastern buildings, which leads to the differences of illumination intensity in different buildings. Wu and Li reported their SOGL system′s average illumination intensity to be 147.8 lux [20]. Average illumination of Saunders et al.′s SOGL system was up to 300 lux [17]. Compared with their reports, it is found that the proposed SOGL system can realize the lighting purpose inside the high buildings.
With respect to the shielding effect, the illumination distributions at the shadow areas between buildings at different times are also simulated. The simulation results at different times are shown in Figure 5a–e.
From Figure 5, it is found that the lowest irradiance at the shadow areas of the building group reaches 120 W/m2. At 8:00 and 16:00 when solar irradiance is not abundant, the average irradiance can reach 120–300 W/m2. The average irradiance at the shadow area of each building is statistically calculated and shown in Figure 6. It is found from the figure that the change of average irradiance at the shadow area of each building does not form a clear rule with the change of time, compared with the tendency of illumination intensity inside the room. The fluctuation of irradiance at the shadow area of each building is small. The minimum average irradiance is 130 W/m2, and the maximum average irradiance is 190 W/m2. Solar radiation intensity and shadow area irradiance was not proportional. In the morning or afternoon, the irradiance at the shadow area is slightly larger than that at the noon. The reasons are found to be the solar elevation and azimuth angles. In the morning or in the afternoon, the sun does not directly at the south of the building, with a large portion of the sunlight coming from the gap between the buildings into the shadow areas. The radiation intensity directly from the sun is nearly ten times greater than that provided by the SOGL system, so the radiation intensity at the shadow areas of the buildings in the morning and afternoon is higher than that at noon. In other words, the contribution of SOGL system is greater at noon than that at other times.

3.2. Optical Efficiency

The optical efficiency of SOGL system of each building is shown in Table 5. As shown in Table 5, by changing the SOGL pipe configuration sizes, it is found that:
(1)
Between 10:00 and 12:00, the optical efficiencies of the SOGL systems reach the maximum. The higher the solar radiation intensity, the higher the SOGL system efficiency.
(2)
The optical efficiencies of SOGL systems in buildings c and d are slightly larger than those in Buildings a and b. For the same material, the smaller the ratio of optical pipe length to its diameter, the higher the system optical efficiency.
(3)
The system efficiency can be improved by reasonably increasing the diameter of the optical guide pipe and planning the shortest path of the SOGL pipes.

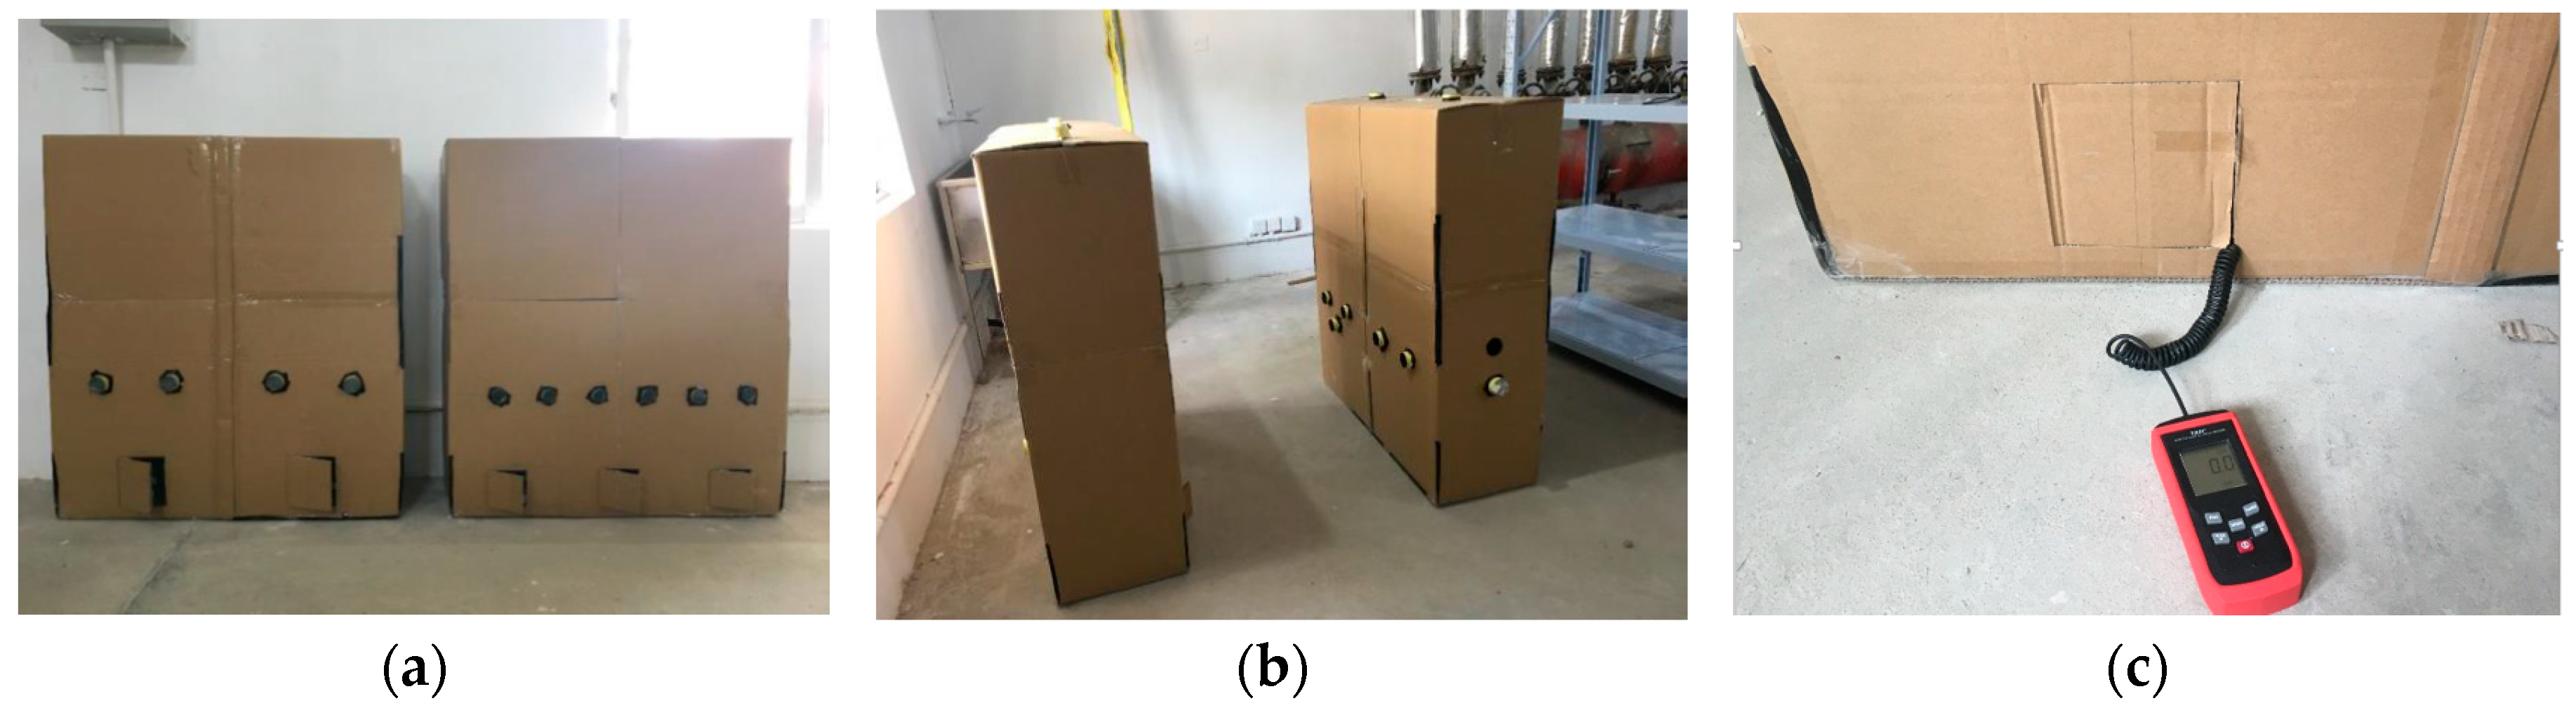
3.3. Experimental Validation

An experimental setup is built to validate the simulation results. It is established by using cardboard, silver paper and cellophane. The cardboard forms the framework of the buildings. The silver paper is rolled up acting as the optical guide pipes. The cellophane acts as the lighting cover and diffuser. Photos of the experimental setup are shown in Figure 7. The dimensions of the experimental setup and sizes of the SOGL system are reduced in proportion according to the dimensions in Table 1 and the proportional scale is 50:1. A halogen lamp is used as the lighting source. Different illumination intensities can be obtained by changing the distance between the halogen lamp and the cardboard buildings. Positions of the halogen lamp are set according to the practical sun positions in the sky in Table 2. A digital illuminometer is used to measure the illumination intensity inside the rooms, whose resolution is 0.1 lux and sampling rate is 2 times per second. The measured illumination intensity at different times are shown in Table 6. It is found that the measured data are much smaller than the simulated results. The reason is the limitation of equipment and material in the experimental study, i.e., the reflectivity of the optical guide pipes and the transmittance of the lighting covers and diffusers in the experimental study are much smaller than those in the simulation. This leads to the decrease of the optical efficiency in the experimental study. In order to accurately compare the data from the experiment and the simulation under the same boundary conditions, a correction coefficient α is introduced to modify the experimental data, which is defined as:
α = η 1 η 2  
where η1 is the simulated average efficiency, which is 0.65. And η2 is the experimentally measured average efficiency, which is 0.56. The correction factor is thus calculated to be 1.16.
The modified experimental results are obtained by using the originally measured data times the correction factor. The modified experimental results and their relative errors to the simulated results are summarized in Table 6. According to Table 6, the maximum relative error is 8.19%. It could be concluded that the simulated results is validated through the experimental study.

4. Conclusions

With the continuous expansion of the urban scale, buildings in cities are becoming higher and more crowded. To solve the increasing lighting problems in high buildings and dealing with the problem of shielding problem in building groups, a SOGL system is proposed in the present study. The illumination and radiation intensity inside and between building groups at different times are simulated and discussed. The following conclusions are obtained from this study:
(1)
The proposed SOGL system can realize the lighting purpose inside and between high buildings. The shadow areas between buildings are lightened into acceptable levels.
(2)
The greater the intensity of the solar radiation, the higher the system optical efficiency. The contribution of SOGL system is greater at noon than that at other times.
(3)
For the SOGL pipes with the same reflecting material, the smaller the ratio of optical pipe length to its diameter is, the higher the system optical efficiency would be. And the system efficiency can be improved by reasonably increasing the diameter of the optical pipe and planning the shortest path of the optical pipe.
The authors suggest that the control strategies of the node-dimming devices need more discussions in the further studies.

Author Contributions

All authors contributed equally to this work. Detailed contribution is described as follow: Formal analysis, H.Z. (Heng Zhang); Funding acquisition, F.C.; Investigation, F.C.; Software, H.Z. (Hao Zhou); Writing—original draft, F.C.; Writing—review & editing, N.L.

Funding

This research was funded by the National Natural Science Foundation of China (No.: 51506043), the China Scholarship Council (Grant No.: 201706715058) and the “Dayu Scholar” foundation of Hohai University.

Conflicts of Interest

The authors declare no conflict of interest.

References

  1. United Nations Population Division. World Urbanization Prospects: The 2014 Revision; Department of Economic and Social Affairs: New York, NY, USA, 2014; pp. 2–18. [Google Scholar]
  2. Liasis, G.; Stavrou, S. Satellite images analysis for shadow detection and building height estimation. ISPRS J. Photogramm. Remote Sens. 2016, 119, 437–450. [Google Scholar] [CrossRef]
  3. Ruffieux, D.; Wolfe, D.E.; Russell, C. The effect of building shadows on the vertical temperature structure of the lower atmosphere in downtown Denver. J. Appl. Meteor. 1990, 29, 1221–1231. [Google Scholar] [CrossRef]
  4. Dubois, M.C.; Blomsterberg, A. Energy saving potential and strategies for electric lighting in future North European, low energy office buildings: A literature review. Energy Build. 2011, 43, 2572–2582. [Google Scholar] [CrossRef]
  5. Katunský, D.; Dolníková, E.; Dolník, B. Daytime lighting assessment in textile factories using connected windows in Slovakia: A case study. Sustainability 2018, 10, 655. [Google Scholar] [CrossRef]
  6. Gürlich, D.; Reber, A.; Biesinger, A.; Eicker, U. Daylight performance of a translucent textile membrane roof with thermal insulation. Buildings 2018, 8, 118. [Google Scholar] [CrossRef]
  7. Yoon, Y.B.; Manandhar, R.; Lee, K.H. Comparative study of two daylighting analysis methods with regard to window orientation and interior wall reflectance. Energies 2014, 7, 5825–5846. [Google Scholar] [CrossRef]
  8. Huang, L.J.; Zhao, S.P. Perforated thermal mass shading: An approach to winter solar shading and energy, shading and daylighting performance. Energies 2017, 10, 1955. [Google Scholar] [CrossRef]
  9. Tsangrassoulis, A. A review of innovative daylighting systems. Adv. Build. Energy Res. 2008, 2, 33–56. [Google Scholar] [CrossRef]
  10. Arimoto, Y.; Homma, Y.; Furuune, H.; Tanaka, K.; Yokota, J.; Hara, K. Indoor gardens using the Himawari sunlight collection and transmission device. Acta Hortic. 1995, 391, 103–110. [Google Scholar] [CrossRef]
  11. Chen, S.H. Application of Natural Lighting Technology in Residential Building Design in Zhengzhou; Zhengzhou University: Zhengzhou, China, 2011. (In Chinese) [Google Scholar]
  12. Feng, W.; Li, H.M.; Zhao, J.W. Application of solar photoconductive lighting technology in underground construction. Sichuan Build. Sci. 2011, 37, 1. (In Chinese) [Google Scholar]
  13. Duan, W.; Zong, F.P.; Lin, R.C.; Cheung, K.P.; Kang, J. Underground garage light tube system in Olympic Common Domain. China Illum. Eng. J. 2008, 3, 1–7. (In Chinese) [Google Scholar]
  14. Earp, A.A.; Smith, G.B.; Franklin, J.; Swift, P. Optimisation of a three-colour luminescent solar concentrator daylighting system. Sol. Energy Mater. Sol. Cells 2004, 84, 411–426. [Google Scholar] [CrossRef]
  15. Wong, I.; Yang, H.X. Study on remote source solar lighting system application in high-rise residential buildings in Hong Kong. Energy Build. 2013, 60, 225–231. [Google Scholar] [CrossRef]
  16. Kandilli, C.; Ulgen, K.; Hepbasli, A. Exergetic assessment of transmission concentrated solar energy systems via optical fibers for building applications. Energy Build. 2008, 40, 1505–1512. [Google Scholar] [CrossRef]
  17. Saunders, R.M.D.; Simon, J.; Jahoor, S. Use of diffuser in passive daylight solar lighting. Renew. Energy 1996, 8, 223–226. [Google Scholar] [CrossRef]
  18. Vázquez-Moliní, D.; González-Montes, M.; Fernández-Balbuena, A.A.; García-Botell, A.; Pohl, W.; Galan, T.; Bernabéu, E. Horizontal daylighting system for office buildings. Energy Build. 2013, 67, 525–530. [Google Scholar] [CrossRef]
  19. Malet-Damour, B.; Guichard, S.; Bigot, D.; Boyer, H. Study of tubular daylight guide systems in buildings: Experimentation, modelling and validation. Energy Build. 2016, 129, 308–321. [Google Scholar] [CrossRef]
  20. Wu, Y.P.; Li, H. Experimental study on performance of top lighting solar light Pipes in the meeting room in winter in Beijing. Appl. Mech. Mater. 2012, 178–181, 29–32. [Google Scholar] [CrossRef]
  21. Baglivo, C.; Bonomolo, M.; Beccali, M.; Congedo, P.M. Sizing analysis of interior lighting using tubular daylighting devices. Energy Procedia 2017, 126, 179–186. [Google Scholar] [CrossRef]
  22. Zhang, X.; Muneer, T.; Kubie, J. A design guide for performance assessment of solar light-pipes. Light. Res. Technol. 2002, 34, 149–169. [Google Scholar] [CrossRef]
  23. Toledo, G.E.; Pelegrini, A.V.; Heemann, A. Design parameters for solar light pipes in the Brazilian context. Int. J. Sustain. Eng. 2016, 9, 251–258. [Google Scholar] [CrossRef]
  24. Ministry of Construction of the People′s Republic of China. Standard for Daylighting Design of Buildings; China Architecture & Building Press: Beijing, China, 2001. [Google Scholar]
  25. China Meteorological Data Sharing Service System. Available online: http://www.cma.gov.cn/2011qxfw/2011qsjgx/ (accessed on 28 September 2018).
  26. Chen, W.C.; Lai, T.T.; Wang, M.W.; Hung, H.W. An optimization system for LED lens design. Sol. Energy 2011, 38, 11976–11983. [Google Scholar] [CrossRef]
  27. Tekelioglu, M.; Wood, B.D. Solar light transmission of polymer optical fibers. Sol. Energy 2009, 83, 2039–2049. [Google Scholar] [CrossRef]
Figure 1. Schematic of the designed solar optical guide lighting (SOGL) system: (a) system vertical section view and (b) sunlight transfer inside the optical guide pipes. 1. Lighting cover, 2. Optical guide pipe, 3. Diffuser, 4. Node-dimming device
Energies 11 02898 g001
Figure 2. Schematic of the building group, the SOGL system and the distribution of light sources at different times in Changzhou, China (32° N, 120° E), where red suns show the time of day.
Energies 11 02898 g002
Figure 3. Illumination distribution inside the ground floor rooms of Buildings a, b, c, and d at 12:00.
Energies 11 02898 g003
Figure 4. (a) indoor illumination in ground floor rooms of Building a, (b) indoor illumination in ground floor rooms of Building b, (c) indoor illumination in ground floor rooms of Building c, and (d) indoor illumination in ground floor rooms of Building d. (Φ: total luminous flux, E: average illumination intensity).
Energies 11 02898 g004aEnergies 11 02898 g004b
Figure 5. The irradiance distribution at the shadow areas of the building group: (a) at 8:00, (b) at 10:00, (c) at 12:00, (d) at 14:00, and (e) at 16:00.
Energies 11 02898 g005aEnergies 11 02898 g005b
Figure 6. Average irradiance at the shadow area of each building.
Energies 11 02898 g006
Figure 7. The experimental setup of the SOGL system: (a) back view, (b) side view and (c) the ground floor room and the digital illuminometer.
Energies 11 02898 g007
Table 1. Dimensions of the buildings and configuration sizes of the SOGL system.
ParameterValue
Height of Buildings a, b, c, and d60 m
Length of Buildings a, b, c, and d50 m
Width of Buildings a, b, c, and d9 m
Distance between Building a and b12 m
Distance between Building a and c60 m
Distance between Building c and d12 m
Distance between Building b and d60 m
Lighting cover diameter of Buildings a and b40 cm
Lighting cover diameter of Buildings c and d50 cm
Optical guide pipe length of Buildings a and b7000 cm
Optical guide pipe length of Buildings c and d7500 cm
Optical guide pipe diameter of Buildings a and b40 cm
Optical guide pipe diameter of Buildings c and d50 cm
Diffuser diameter of Buildings a and b40 cm
Diffuser diameter of Buildings c and d50 cm
Table 2. The solar elevation angle, azimuth angle and illumination intensity at five times in Changzhou, China (32° N, 120° E).
Time8:0010:0012:0014:0016:00
Solar elevation angle (°)25.147.358.047.325.1
Solar azimuth (°)120150180210240
Solar radiation (W/m2)400500600500433
Intensity of illumination (lux)12,00013,50014,00013,50013,000
Table 3. Definition of material in each part of the system in TracePro software.
Defined PartMaterialReflectivityTransmittance
External wall of buildingALANOD-MIRO 80.28 scattering0
Interior wall of buildingALMECO-SACALL-1450.39 scattering0
Interior roof of buildingALMECO-SACALL-1060.80 scattering0
Indoor ground floor of buildingALANOD-600G30.19 scattering0
Diffuser at shadow areasSpherical lens (PMMA)0.050.90
Inner wall of light guide pipePolymer Film0.990
Diffuser in roomsSpherical lens (PMMA)0.050.90
Outdoor ground surfaceALANOD-600G30.19 scattering0
Table 4. Indoor illumination intensity at different times (unit: lux).
Time Building aBuilding bBuilding cBuilding d
8:00Rooms120.8105.891.7112.485.698.4112.4114.597.4109.5
Average106.198.8113.5103.5
10:00Rooms167.3155.0155.9159.2145.4165.5146.5154.6132.1150.2
Average159.4156.7150.6141.2
12:00Rooms177.5167.7182.0173.3178.8180.0176.2190.2179.4185.0
Average175.7177.4183.2182.2
14:00Rooms164.7162.5168.0162.0170.0174.3122.9189.1120.6199.3
Average165.1168.8156.0160.0
16:00Rooms120.1117.4101.5129.4100.7139.4112.3117.4114.7124.1
Average113.0123.2114.9119.4
Table 5. Average luminous flux and efficiency of the SOGL system in the building group at different times.
TimeParameterBuilding aBuilding bBuilding cBuilding d
8:00Φ (lm)37.134.639.736.2
Φ0 (lm)67.867.870.770.7
η0.5470.5100.5620.512
10:00Φ (lm)48.147.252.749.4
Φ0 (lm)76.376.379.579.5
η0.6310.6190.6630.622
12:00Φ (lm)61.558.464.663.8
Φ0 (lm)79.179.182.482.4
η0.7770.7380.7840.774
14:00Φ (lm)49.450.754.656
Φ0 (lm)76.376.379.579.5
η0.6470.6650.6870.704
16:00Φ (lm)39.641.843.145.3
Φ0 (lm)67.867.870.770.7
η0.5840.6160.6090.641
Table 6. The measured and modified illumination intensity of the SOGL system in the experimental study at different times in the day and their relative errors to the simulated results (α = 1.16).
Building NumberData TypeTime in the Day
8:0010:0012:0014:0016:00
Building aMeasured (lux)88.2132.5151.7140.3101.5
Modified (lux)102.3153.7176.0162.8117.7
Error (%)3.583.58−0.171.39−4.16
Building bMeasured (lux)84.1126.0150.9144.1104.7
Modified (lux)97.6146.2175.0167.2121.5
Error (%)1.216.701.350.951.38
Building cMeasured (lux)89.8125.7156.7136.596.5
Modified (lux)104.2145.8181.8158.3112.0
Error (%)8.193.190.76−1.472.52
Building dMeasured (lux)83.4118.2155.9139.698.3
Modified96.7137.1180.8161.9114.0
Error (%)6.572.900.77−1.194.52

