Article

Investigation on the Suction Reed Valve Motion with Sticky Force in a Refrigerator Compressor

School of Energy and Power Engineering, Xi’an Jiaotong University, Xi’an 710049, China
*
Author to whom correspondence should be addressed.
Energies 2018, 11(11), 2897; https://doi.org/10.3390/en11112897
Submission received: 18 September 2018 / Revised: 9 October 2018 / Accepted: 10 October 2018 / Published: 25 October 2018

Abstract

:
The valve motion strongly couples with the differential pressure between the cylinder and the suction and discharge plenum, which has a significant influence on the performance of the refrigerator compressor. To examine the interaction between the pressure and the reed valve motion, this paper presents an experimental investigation into the inner workings of the refrigerator compressor, particularly the p-V diagram and the motion of the suction valve. The refrigerator compressor was modified to conveniently mount the sensors. Three pressure sensors were installed to measure the p-V diagram and pressure pulsation, while a strain gauge was employed to measure the motion of the suction valve. The interaction between the differential pressure and the valve motion were clearly observed from the experimental results. It was found that there was a considerable power loss up to 14.5% in the suction process under experimental conditions. The sticky force of the oil had a significant effect on both the motion of the suction valve and the suction phase of the compressor. The delayed opening of the reed valve increased the amplitude of the pressure pulsation in the suction plenum. The experimental method which integrates the pressure variety and the valve movement proposed in this paper could contribute to the efficient testing and the optimization of the refrigerator compressor.

1. Introduction

To develop a highly efficient compressor, the dynamic characteristics of compressors must be fully understood by analyzing the interactions among the cylinder pressure, the valve motion, and the pressure pulsation. To improve the efficiency of the reciprocating compressor, experimental investigation, and numerical simulations are the main research methods as numerous factors can affect the analysis of the dynamic characteristic.
The pressure in a cylinder can be analyzed by p-V and logarithmic p-V diagrams. The work done by the piston can be calculated by the integral of pdV in one cycle [1]. Ma et al. measured the p-V diagram of the CO2 compressor and found the power losses at the suction valve was lower the discharge part [2]. Pichler et al. linearized the p-V diagram using a logarithmic p-V diagram to detect the leaking through reciprocating compressor valves in the expansion phase [3].
The research on valve dynamics of the reciprocating compressor has been conducted for many years. Numerical tools can help provide a deep understanding of valve dynamics. The first mathematical model of the reciprocating compressor was developed by Costagliola (1950) [4], which considered the valve dynamics and have been widely applied in the study of reciprocating compressors [5,6,7,8,9].
All previous models are semi-analytical, containing a number of empirical coefficients. Most investigators have devoted a considerable effort to evaluating these coefficients through experiments. Ma et al. conducted an experiment to investigate the discharge valve dynamics in the CO2 refrigeration reciprocating compressor. By analyzing the pressure-time diagram and the valve movement, they confirmed that the valve design can be optimized to obtain a proper valve movement [2].
Measuring the displacement of the reed valves in the refrigerator compressor is difficult due to the small size of the compressor. Bhakta et al. proposed and developed an indirect measurement outside the compressor to describe the dynamics of reed valves using a physics-based transfer function that translated these measurements into actual compressor reed valves motion [10]. Gasche et al. also studied the suction reed valve outside the compressor by measuring the instantaneous position of the reed valves with an extremely accurate optical sensor [11]. Nagata et al. measured the motion of the suction reed valve in a refrigerator compressor with a strain gauge [12], but the experimental setup was not described in detail. And Real et al. measured the valve motion in a small hermetic compressor using a fiber-optic displacement sensor [13].
A significant amount of research has been conducted to investigate the effect of the oil stiction on the opening of the valve. Khalifa et al. presented an analytical model for analyzing the dynamic behavior of a reed valve in the presence of oil. The primary reason for stiction was found to be the viscous force produced by dilating the oil film between the valve and its seat [14]. Rodrigo et al. also presented a model for the dynamic behavior of a ring-shaped lubricant oil film between a discharge valve and the seat. It was pointed out that typically for the discharge systems of domestic refrigeration compressors, viscous effects were the dominant component in the oil stiction force under dynamic conditions [15]. Yoshizumi et al. developed a coupling simulation algorithm, which including models of the oil film cavitation to obtain the two-dimensional oil film pressure distribution by numerically solving the Reynolds’ equation through the numerical method [16]. Brown et al. measured the stiction force in a test rig where the parameters of the seat geometry, the oil viscosity, and the rate of application of lift on the valve disc could be controlled [17]. Bauer examined three solutions to reduce the effect of sticking by reducing the amount of oil between the valve seat and the valve [18]. Giacomelli et al. pointed out the necessity of taking into account sticking effect in the mathematical model of the compressor [19]. Resch and Scheidl proposed that the stiction force in the narrow gap between the valve seat and the valve is dominated by the viscous flow as described by the Reynolds equation for lubricating gaps and by cavitation. It was experimentally found that the viscous flow could create a negative pressure for a very short time during the operation of the compressor [20,21,22]. However, none of the above-mentioned studies considered the effect of the presence of oil on valve dynamics, beyond that of a delay in valve opening.
Experimental and numerical studies have been also carried out to improve the efficiency of compressors in recent decades. Pichler et al. [23] proposed an automated method for the fault detection in valve cracked or broken under varying load conditions of the reciprocating compressor, which used the time-frequency representation of vibration measurement data to show typical patterns of the fault state. Aprea et al. [24] identified the current frequency of scroll and reciprocating compressors through a lot of experiments to find the optimal frequency under different cooling/heating loads in the energy, exergy and economy aspects. The result shows that the most energy saving frequency is 30 Hz for the two compressors studied. Wang et al. [25] presented the simulation of the complete compression cycle of a refrigeration compressor by a three-dimensional fluid structure interaction (FSI) model to investigate the effects of the rotation speed and valve parameters on the oscillation and delayed closure of the valve and obtain an empirical correlation to predict the characteristic rotation speed of the compressor. Jomde et al. [26] presented a reed valve simulation using CAE (The soft tools for solving problems of strain: Computer Aided Engineering) tools to analyze the influence of the valve thickness on valve lifting and obtained a model for the compressor design agreed well with the physical one. Belman-Flores [27] compared the actual parameters in the running process of the reciprocating compressor between the simulations by an artificial neural network model and a physical model, which found that the artificial neural network showed a better compressor simulation.
In this paper, Finite Element Method (FEM) is employed to investigate the instant plastic deformation and the strain during the reed movement while experiments are conducted to obtain the motion of the suction valve using the strain gauge. A specific experiment was creatively designed to record the motion of the suction reed valve and the pressure in the plenum and cylinder of a refrigerator compressor. Based on the measurement, the pressure-volume diagram of the cylinder, and the reed valve motion, and the suction pressure pulsation were acquired. The interaction between the pressure and the reed valve motion was analyzed, taking the stiction of oil into account. The proposed experimental method which integrates pressure variety and valve movement could contribute to an efficiency testing and the optimization of refrigerator compressor. The results of this study will be an important reference for the compressor design. Moreover, the combination of experiments and numerical simulation is proved as an effective solution to study and improve the dynamics of compressors and reed valves.

2. Experimental Method

An experimental investigation was performed to examine the interaction between the pressure and the reed valve motion in a refrigerator compressor, because the pressure is strongly coupled with the valve dynamics as the valve motion is a response to the pressure force it experiences, and the pressure evolves with the variation of the mass inflow and outflow through the valve at a particular lift. Through the experiments, the pressure-volume diagram, pressure pulsation in the suction and discharge pipes, and the suction valve displacement of the compressor were obtained and studied.

2.1. Refrigeration System

To adjust the operation condition of the compressor, a refrigeration system had been built up, as shown in Figure 1. The main refrigeration system consisted of a condenser with a fan, a refrigerator compressor, an evaporator with an electric heating belt, a manual throttling valve, a filter, and a pressure relief valve. The evaporator was heated with a heating belt. The balance valve was used to connect the evaporator and the condenser while charging the refrigerant. The operation condition can be coordinatively adjusted by the throttle valve, the heating belt, and the fan. R600a is chosen as the refrigerant of the refrigerator system as the GWP and ODP values of R600a are both around zero, which is promising as a substitute of R12. This has been added to the revised version.

2.2. Pressure Measurement

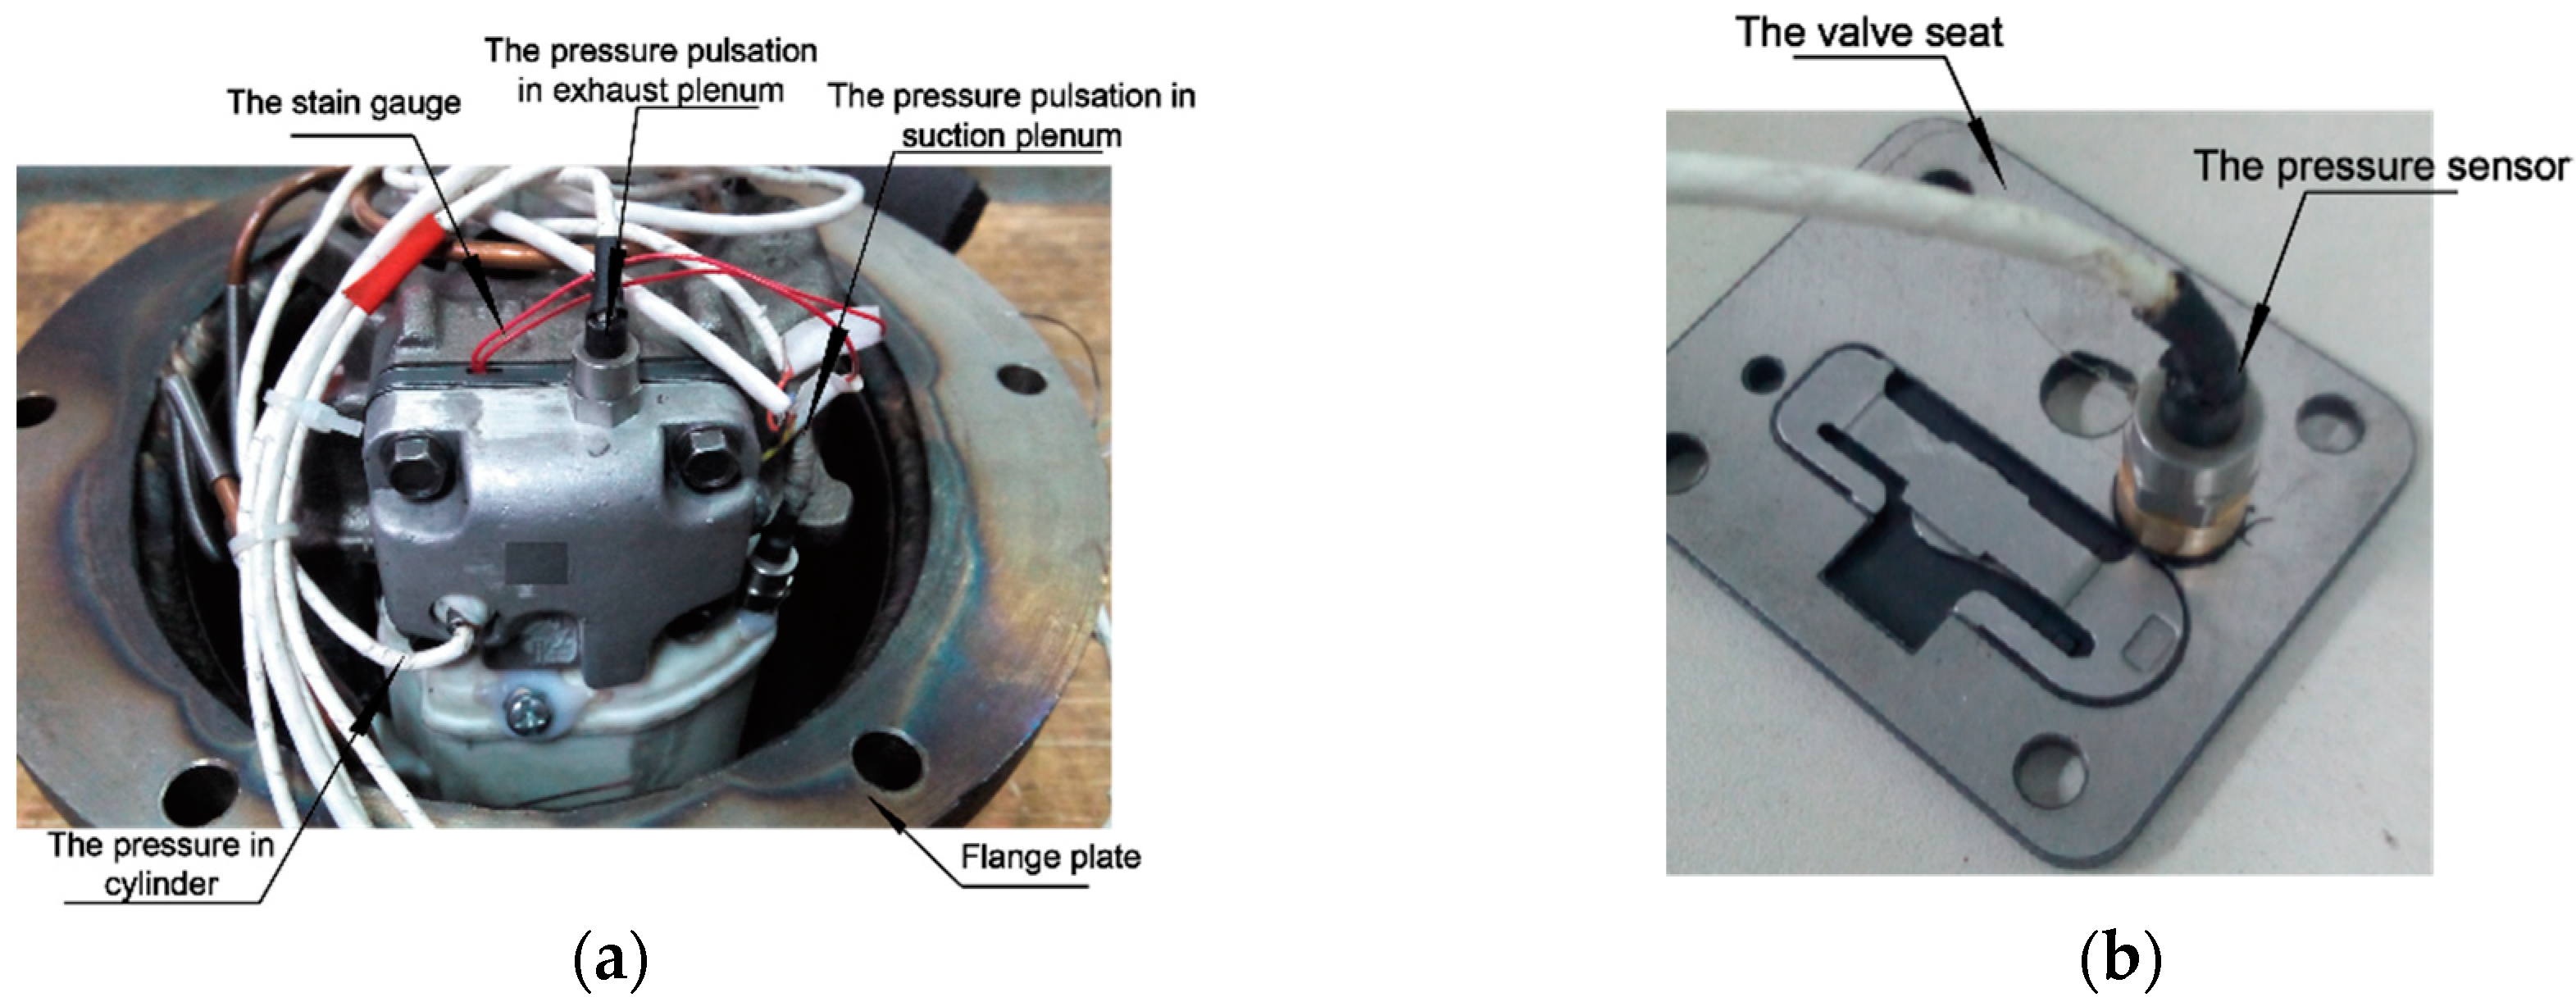
Recording the p-V diagram in experiments was complex due to the small size of the refrigerator compressor. The refrigerator compressor in this study was therefore refitted to conveniently mount the sensors. Conventionally, the shells of hermetic refrigerating compressors are welded together, but to facilitate the installation of the sensor, a flange plate is designed and used in this study, as shown in Figure 2a. Three high-precision pressure sensors were used to measure the transient pressure, which were installed as shown in Figure 2a considering the practical structure of compressors and the dimensions of sensors. The pressure pulsations in the suction and discharge plenums were measured by sensors mounted in the discharge plenum and the muffler, respectively. The sensor for recording the pressure in the cylinder was embedded in the valve seat, as shown in Figure 2b.
The compressor employed in this study is a modified facility based on an existing WQ153Y refrigerator compressor, the structural parameters of which are listed in Table 1. The high-precision pressure sensors with a sampling rate set as 50 kHz and the measurement accuracy of 0.1% were used to measure the transient pressure.

2.3. Measurement to Motion of Suction Reed Valve

A strain gauge was used in this study to measure the motion of the suction valve. Based on the FEM analysis, the plastic deformation at the base of the reed valve was found to be small and the strain was relatively large during the reed movement, as shown in Figure 3.
The strain gauge was located at the base of the suction valve as shown in Figure 4.
The valve displacement from the suction port can be calculated from the strain at the base of the suction valve as the displacement at the reed valve is nearly linear with the strain at the base of the reed valve according to the theory of material mechanics [12].
The relationship between the strain signal and the static deformation of the suction valve was obtained using the experimental setup, as shown in Figure 5a. The suction valve was fixed in the same way as that installed on the refrigerator compressor to record the strain signal, while a quantitative displacement of the head of the suction valve was recorded by a micrometer. The linear relation between the strain data and the displacement of the reed valve by this facility was obtained and shown in Figure 5b.
This relation is used to calculate the valve displacement in the operating compressor, so it is worthy to note that the reed valve with strain gauge used in the calibration setup was the same one employed in the experimental investigation in this paper.

2.4. The Refrigerator Compressor Kinematics

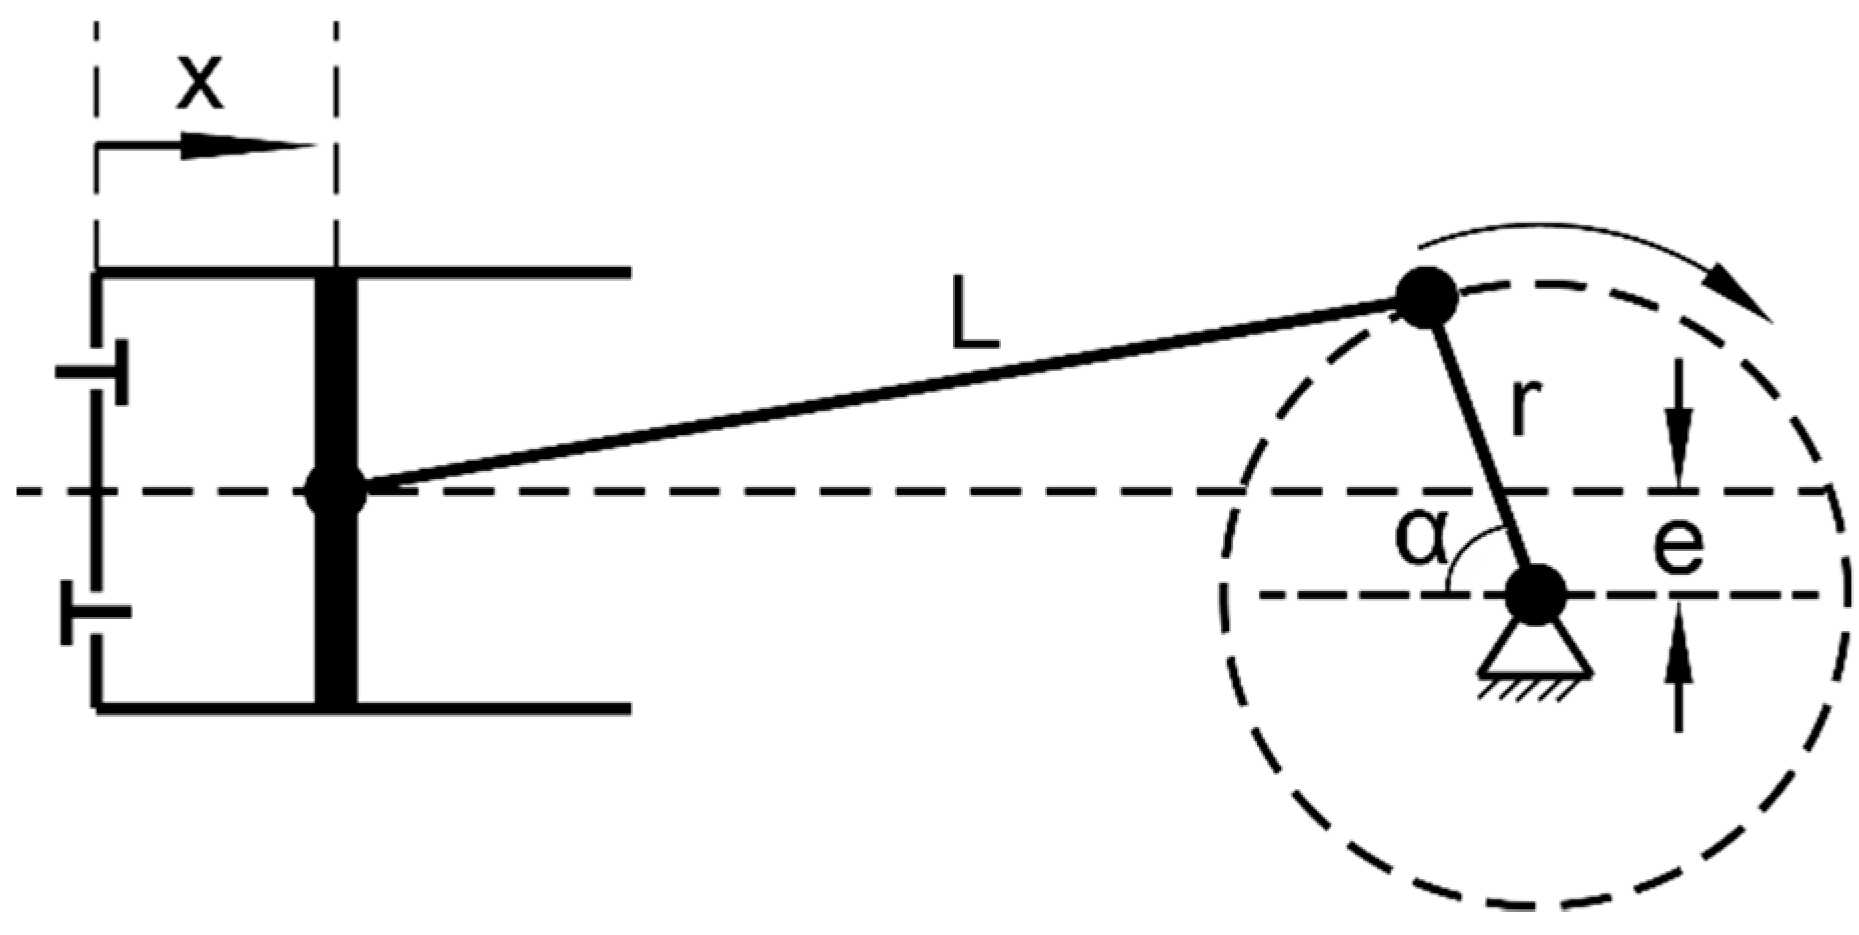
The piston movement is determined by the compressor crank, as shown in Figure 6. The piston position depends on the crank rotation angle, and is determined as Equation (1). In this study, the offset of the piston has been taken into account, which leads to a well-distributed lateral force on the piston. The piston is assumed to move from the bottom dead center (BDC) to the top dead center (TDC) at the start time.
x = r [ ( 1 cos α ) + λ 4 ( 1 cos 2 α ) e r λ sin α ]
The crank angle was measured by the gap sensor in this study. Figure 7 has been added to the manuscript to explain this measurement. A pulse signal is generated when big end of the connecting rod approaches the gap sensor indicating the lower stop point the piston reaches. A running cycle was finished between every two such pulse signals, which was evenly divided into 360 equal parts as the speed of the crankshaft was assumed uniform during the operation. Since there is an offset between the axe of the piston and the fixed position of the crank, the minimum and maximum volume of the compression chamber correspond with the crank angle 182.88 and 2.88, respectively.
The piston position can be obtained by measuring the value of crank angle as the position of the piston can be determined by the crank of the compressor, as shown in Equation (1).

2.5. Uncertainty Analysis

The error of the calculated variable is a function of the measured value, and the transfer formula of standard error can be expressed by Equation (2) (Yu Wang et al, 2013):
σ y = ( y x 1 ) 2 σ x 1 2 + ( y x 2 ) 2 σ x 2 2 + + ( y x n ) 2 σ x n 2
In this paper, the four variables considered in the investigation are the reed valve displacement, reed valve velocity, pressure and differential pressure. The pressure and reed valve displacement is measured directly, so the errors are solely those of the sensors. The differential pressure is calculated by the following equation:
Δ p = p i n p s
The reed valve velocity at the head is calculated by Equation (4):
v t = S t + Δ t S t Δ t
Applying the error transfer from Equation (2), the uncertainties are estimated and shown in Table 2.

3. Results and Discussion

The interaction between the pressure and the reed valve motion was studied by analyzing the pressure and the displacement of the reed valve in the experimental investigation. The p-V diagram inside the cylinder was analyzed with the suction valve motion and the pressure pulsation to obtain further information about the working cycle.

3.1. Pressure in the Cylinder

During the operation of the refrigerator compressor, the inner cycle is divided into four phases: compression, discharge, expansion, and suction. During the compression phase, the suction valve and the discharge valve are closed. The refrigerant pressure increases with the movement of the piston until the discharge reed valve opens. The pressure in the cylinder varies and pulsation generated when the discharge valve opens, due to the combined effects of the outlet flow rate and the piston motion. The pulsation is, in turn, the result of the interaction of the fluid flow with the automatic valve. After the discharge valve closes, the pressure continues to decrease due to the re-expansion of the dead volume, until the opening of the suction valve. In the suction phase, the pressure change is small, according to the volume variation law and the inlet flow rate when the interaction between the fluid flow and valve dynamics plays a fundamental role in the overall behavior of the system during this phase.
The experimental working conditions of the refrigerator during the experimental tests are listed in Table 3. Understanding the power consumption on the work cycle of compressors and its power losses can contribute to improving the performance. The operation of refrigerator compressor can be described by the pressure volume indicator diagram, which shows the pressure variation in the cylinder as a function of the volume of it, as shown in Figure 8. From the p-V diagram, the work exerted on the refrigerant and the flow losses through the valve can be obtained. The discharge loss was 5.2% while the suction loss was 14.5%, as shown in Figure 8. It was found that there is a considerable loss in the suction process, which required optimization.
The polytrophic exponent is considered constant during the refrigerant compression and expansion phase based on the thermodynamic analysis as the compression chamber is closed during these two phases. The thermodynamic parameters varied in the cylinder as shown in Equation (5):
p V n = c o n t
log p = log c o n t n log V
The polytrophic exponent cannot be obtained by observing the p-V diagram. Taking the logarithm of Equation (5), the linear relationship with slope n and intercept log c o n t can be obtained by Equation (6). The logarithmic p-V diagram was then obtained and shown in Figure 9.
The polytrophic exponent is used as a fault diagnosis indicator for the performance of the reciprocating compressor, such as the leaking and faultless valves which show a significant difference polytrophic exponent in the compression and expansion phase. In this study, the polytrophic exponents in the compression and expansion phases were 1.1035 and 1.1068, respectively. The approximate equal exponents illustrate that the heat transfer can be ignored at a high rotation speed and the compressor shows a faultless behavior.

3.2. Motion of the Suction Valve with Sticky Force

The valve motion is a critical factor when studying the working cycle in the cylinder as the valve motion strongly couples with the differential pressure between the cylinder and the suction and discharge plenum, and any change in the valve dynamics affect the mass flow rate of the refrigerant through the valves.
Figure 10 shows the measured differential pressure between the cylinder and the suction plenum as well as the valve lift profiles. In the suction phase (start at 216°), two big flutters were observed in the valve lift response, each corresponding to two pressure pulsations for each in the cylinder, which is shown in Figure 11. It was found that the differential pressure on the valve face dropped when the valve opened which rose when the valve closed. The characteristic of the motion suggested that the suction reed valve suffered an excessive stiffness. It would be specially mentioned that there is no value of reference to the displacement of the suction valve from 15° to 216° as the relationship between the strain signal and static deformation is inapplicable during this phase.
The oscillation of the reed velocity results from the fluid-solid coupling and the piston motion as shown in Figure 12. It was found that the peak value of the pressure difference was followed by a peak value of the velocity while that of the velocity was followed by the peak value of the displacement. A reduction of the reed valve velocity was observed when the reed valve reached the maximum displacement due to the decrease of the differential pressure in the cylinder and the increase of reaction force of the reed valve. The reed valve was then accelerated to close by the reaction force following a reduction in the gap between the valve and the valve seat. This gap reduction fostered an increase in the flow resistance, which increased the upstream pressure and, consequently, the reed valve was decelerated by the flow force. After this, the valve then hit the valve seat.
In practice, the valve could be covered with an oil film as the refrigerant vapor mixes with lubricating oil, so the space between the valve and valve seats was brushed with machine oil. The sticky force of oil between the valve and valve seat can be clearly observed in this study, as shown in Figure 11, particularly at two moments when the valve starts to leave the seat (216°–246.24° and 305.28°–321.12°). The sticky force prevented the valve from opening while the suction pressure was bigger than that in the cylinder. It was also shown in Figure 11, that the pressure drop in the cylinder and pressure rising in the suction plenum were observed during two special periods when the valve stayed contacted with the seat.
In the first special period (216°–246.24°), the pressure in the cylinder dropped excessively due to the delay in the opening of the suction valve because of the presence of oil, which can be found in Figure 13. During this period, the differential pressure increased to 0.37 bar, as shown in Figure 11. There was an increase in the speed and the deformation of the reed valve as the valve began to move due to the larger pressure difference. This sticky force deteriorated the operating conditions of the reed valve and reduced the fatigue life. The lower pressure at the start of the suction phase increased the suction loss and reduced its volumetric efficiency of the compressor. Another disadvantage of this type of movement is that the impinging of the reed valve against the valve seat could result in a structural damage to the valve.
During the second special period (305.28°~321.12°), the valve reached the valve seat after the first flutter. Rather than rebounding immediately, the valve stayed contacted on the seat until the pressure difference overcame the sticky force. It can be found from Figure 12 and Figure 10, during this period, when the velocity of the reed valve was close to zero and the valve was closed, the differential pressure rose to 0.32 bar due to a decrease in the pressure in the cylinder and an increase in the suction plenum. Comparing the maximum pressure difference in these specific two periods in Figure 12, the sticky force in the second period was lower than the first period due to the oil film movement caused by the suction valve motion.
In the suction case, a pressure pulsation in the suction chamber was observed during the suction process as the suction reed valve stayed contacted with the seat, which increased the power consumption of the compressor. As shown in Figure 13, there was a considerable pressure pulsation in the suction plenum with an amplitude of 8.94%. This means that the effect of the stick force of the oil should be taken into account when designing the muffler.
It was found that the suction valve was more sensitive to the influence of the sticky force than the discharge valve, as the surface of the suction valve was covered with a larger oil film than the discharge valve, while it was less sensitive to sticky force compare to the discharge pressure.
In terms of the compressor efficiency, this type of valve movement is detrimental as it reduces the mass of the refrigerant being sucked by the compressor. In an ideal situation, the largest mass flow rate can be achieved and the reed valve should remain open for a prescribed constant mass flow rate. On the other hand, the oil film between the valve and the valve seat can act as a viscous damper to alleviate vibrations when the valve opens. A layer of oil also causes an increase in the moving mass of the valve.
In this study, the magnitude of the sticky force was evaluated. The differential pressure between the cylinder and the suction plenum should approximately equal the sticky force when the suction valve was closed as there was no flow loss. The sticky force was approximately 0.37 bar and 0.32 bar in these two special periods, respectively. When the suction valve was opened, the sticky force decreased rapidly, and a loss of flow resulted from the differential pressure.

4. Conclusions

In this study, an experimental investigation was conducted on the interaction between pressure and reed valve motion of a refrigerator compressor, taking account of the sticky force of oil. Three pressure sensors were installed to measure the p-V diagram and the pressure pulsation, while a strain gauge was used to measure the motion of the suction valve. Several conclusions can be drawn as follows:
  • The experimental method which integrates pressure variety and valve movement presented in this study offers a promising tool for the development of high-performance refrigerator compressors. The strong coupling of the suction valve motion with the pressure in the cylinder and the suction plenum were clearly observed. The pressure pulsations in the cylinder were caused by the motion of the valve while the pressure pulsation in the suction chamber was generated as the reed valve stayed contacted with the valve seat during the suction process.
  • The flow loss through the suction valve was investigated in the experiment. There was a considerable power loss of up to 14.5% in the suction process was found under experimental conditions, while the differential pressure was up to 0.37 bar.
  • The sticky force of oil has a significant effect on both the motion of the suction valve and the suction phase of the compressor. Due to the sticky force, the valve stayed contacted with the valve seat in the suction process, which decreased the flow area of the valve and increased the suction loss. Furthermore, the speed and deformation of the valve were increased due to the sticky force.
  • During the suction process, there was an excessive reduction of the pressure in the suction chamber due to the flow loss in the muffler and the delayed opening of the reed valve while a pressure pulsation was generated as the reed valve stayed contacted on the valve seat, which increased the power consumption of the compressor.
  • The proposed experimental method which integrates the pressure variety and valve movement could contribute to an efficient testing and the optimization of refrigerator compressor. The combination of experiments and numerical simulations is an effective solution to study the dynamics of compressors and reed valves.

Author Contributions

Conceptualization: W.Z.; formal analysis: Z.X.; investigation: L.J.; methodology: X.P.; supervision: L.J.; validation: Z.X.; visualization: X.P.; writing—review and editing: W.Z.

Conflicts of Interest

The authors declare no conflict of interest.

Nomenclature

x The piston displacement from the TDC
r The crank radius
λ The ratio of the crank radius to the length of the connecting rod
α The crank angle
e The eccentric distance
Δ p The differential pressure
p i n The pressure in the cylinder

References

  1. Stouffs, P.; Mohand, T.; Pierre, W. Thermodynamic analysis of reciprocating compressors. Int. J. Therm. Sci. 2001, 40, 52–66. [Google Scholar] [CrossRef]
  2. Ma, Y.; He, Z.L.; Peng, X.Y.; Xing, Z.W. Experimental investigation of the discharge valve dynamics in a reciprocating compressor for trans-critical CO2 refrigeration cycle. Appl. Therm. Eng. 2012, 32, 13–21. [Google Scholar] [CrossRef]
  3. Pichler, K.; Lughofer, E.; Pichler, M.; Buchegger, T.; Klement, E.P.; Huschenbett, M. Detecting cracks in reciprocating compressor valves using pattern recognition in the pV diagram. Pattern Anal. Appl. 2015, 18, 461–472. [Google Scholar] [CrossRef]
  4. Wang, Y.; Feng, J.M.; Zhang, B.; Peng, X.Y. Modeling the valve dynamics in a reciprocating compressor based on two-dimensional computational fluid dynamic numerical simulation. Proc. Inst. Mech. Eng. Part E J. Process Mech. Eng. 2013, 227, 295–308. [Google Scholar] [CrossRef]
  5. Sun, S.Y.; Ren, T.R. New method of thermodynamic computation for a reciprocating compressor: Computer simulation of working process. Int. J. Mech. Sci. 1995, 37, 343–353. [Google Scholar] [CrossRef]
  6. Farzaneh-Gord, M.; Niazmand, A.; Deymi-Dashtebayaz, M.; RezaRahbari, H. Thermodynamic analysis of natural gas reciprocating compressors based on real and ideal gas models. Int. J. Refrig. 2015, 56, 186–197. [Google Scholar] [CrossRef]
  7. Dutra, T.; Deschamps, C.J. A simulation approach for hermetic reciprocating compressors including electrical motor modeling. Int. J. Refrig. 2015, 59, 168–181. [Google Scholar] [CrossRef]
  8. Stiaccini, I.; Galoppi, G.; Ferrari, L.; Ferrara, G. A reciprocating compressor hybrid model with acoustic FEM characterization. Int. J. Refrig. 2016, 63, 171–183. [Google Scholar] [CrossRef]
  9. Liu, G.B.; Zhao, Y.Y.; Tang, B.; Li, L.S. Dynamic performance of suction valve in stepless capacity regulation system for large-scale reciprocating compressor. Appl. Therm. Eng. 2016, 96, 167–177. [Google Scholar] [CrossRef]
  10. Bhakta, A.; Dhar, S.; Bahadur, V.; Angadi, S.; Dey, S. A valve design methodology for improved reciprocating compressor performance. In Proceedings of the 21th International Compressor Engineering Conference, West Lafayette, IN, USA, 14–19 July 2012. [Google Scholar]
  11. Gasche, J.L.; Arantes, D.M.; Andreotti, T. Experimental analysis of the fluid structure interaction in a suction valve model. In Proceedings of the 22nd International Compressor Engineering Conference, West Lafayette, IN, USA, 14–19 July 2014. [Google Scholar]
  12. Nagata, S.; Nozaki, T.; Akizawa, T. Analysis of dynamic behavior of suction valve using strain gauge in reciprocating compressor. In Proceedings of the 2010 International Compressor Engineering Conference, West Lafayette, IN, USA, 12–15 July 2010. [Google Scholar]
  13. Real, M.A.; Pereira, E.A.G. Using PV diagram synchronized with the valve functioning to increase the efficiency on the reciprocating hermetic compressors. In Proceedings of the 2010 International Compressor Engineering Conference, West Lafayette, IN, USA, 12–15 July 2010. [Google Scholar]
  14. Khalifa, H.E.; Xin, L. Analysis of stiction effect on the dynamics of compressor suction valve. In Proceedings of the 1998 International Compressor Engineering Conference, West Lafayette, IN, USA, 14–17 July 1998. [Google Scholar]
  15. Pizarro-Recabarren, R.A.; Barbosa, J.R., Jr.; Deschamps, C.J. Modeling the stiction effect in automatic compressor valves. Int. J. Refrig. 2013, 36, 1916–1924. [Google Scholar] [CrossRef] [Green Version]
  16. Yoshizumi, F.; Kondoh, Y.; Moroi, T.; Tamano, S.; Morinishi, Y. Numerical simulation on the opening delay of a discharge reed valve in compressors. In Proceedings of the 22nd International Compressor Engineering Conference, West Lafayette, IN, USA, 14–19 July 2014. [Google Scholar]
  17. Bauer, F. The influence of liquids on compressor valves. In Proceedings of the 1990 International Compressor Engineering Conference, West Lafayette, IN, USA, 17–20 July 1990. [Google Scholar]
  18. Pringle, S. Oil Stiction in Automatic Compressor Valves. Ph.D. Thesis, University of Strathclyde, Glasgow, UK, 1976. [Google Scholar]
  19. Giacomelli, E.; Giorgetti, M. Evaluation of oil stiction in ring valves. In Proceedings of the 1974 International Compressor Engineering Conference, West Lafayette, IN, USA, 10–12 July 2014. [Google Scholar]
  20. Resch, M.; Scheidl, R. A model for fluid stiction of quickly separating circular plates. Proc. Inst. Mech. Eng. Part C J. Mech. Eng. Sci. 2014, 228, 1540–1556. [Google Scholar] [CrossRef]
  21. Liu, Z.J.; Li, H.; Liu, K.J.; Yu, H.C.; Cheng, K.W. Design of high-performance water-in-glass evacuated tube solar water heaters by a high-throughput screening based on machine learning: A combined modeling and experimental study. Sol. Energy 2017, 142, 61–67. [Google Scholar] [CrossRef]
  22. Liu, Z.J.; Wu, D.; Yu, H.C.; Ma, W.S.; Gin, G.Y. Field measurement and numerical simulation of combined solar heating operation modes for domestic buildings based on the Qinghai-Tibetan plateau case. Energy Build. 2018, 167, 312–321. [Google Scholar] [CrossRef]
  23. Pichler, K.; Lughofer, E.; Pichler, M.; Buchegger, T.; Klement, E.P.; Huschenbett, M. Fault detection in reciprocating compressor valves under varying load conditions. Mech. Syst. Signal Process. 2016, 70, 104–119. [Google Scholar] [CrossRef]
  24. Aprea, C.; Mastrullo, R.; Renno, C. Determination of the compressor optimal working conditions. Appl. Therm. Eng. 2009, 29, 1991–1997. [Google Scholar] [CrossRef] [Green Version]
  25. Wang, T.; Guo, Y.; He, Z.L.; Peng, X.Y. Investigation on the delayed closure of the suction valve in the refrigerator compressor by FSI modeling. Int. J. Refrig. 2018, 91, 111–121. [Google Scholar]
  26. Jomde, A.; Bhojwani, V.; Kedia, S.; Jangale, N.; Kolas, K.; Khedkar, P.; Deshmukh, S. Modeling and simulation performance of reed valve in linear compressor. Mater. Today Proc. 2017, 4, 7228–7233. [Google Scholar] [CrossRef]
  27. Belman-Flores, J.M.; Ledesma, S.; Barroso-Maldonado, J.M.; Navarro-Esbrí, J. A comparison between the modeling of a reciprocating compressor using artificial neural network and physical model. Int. J. Refrig. 2015, 59, 144–156. [Google Scholar] [CrossRef] [Green Version]
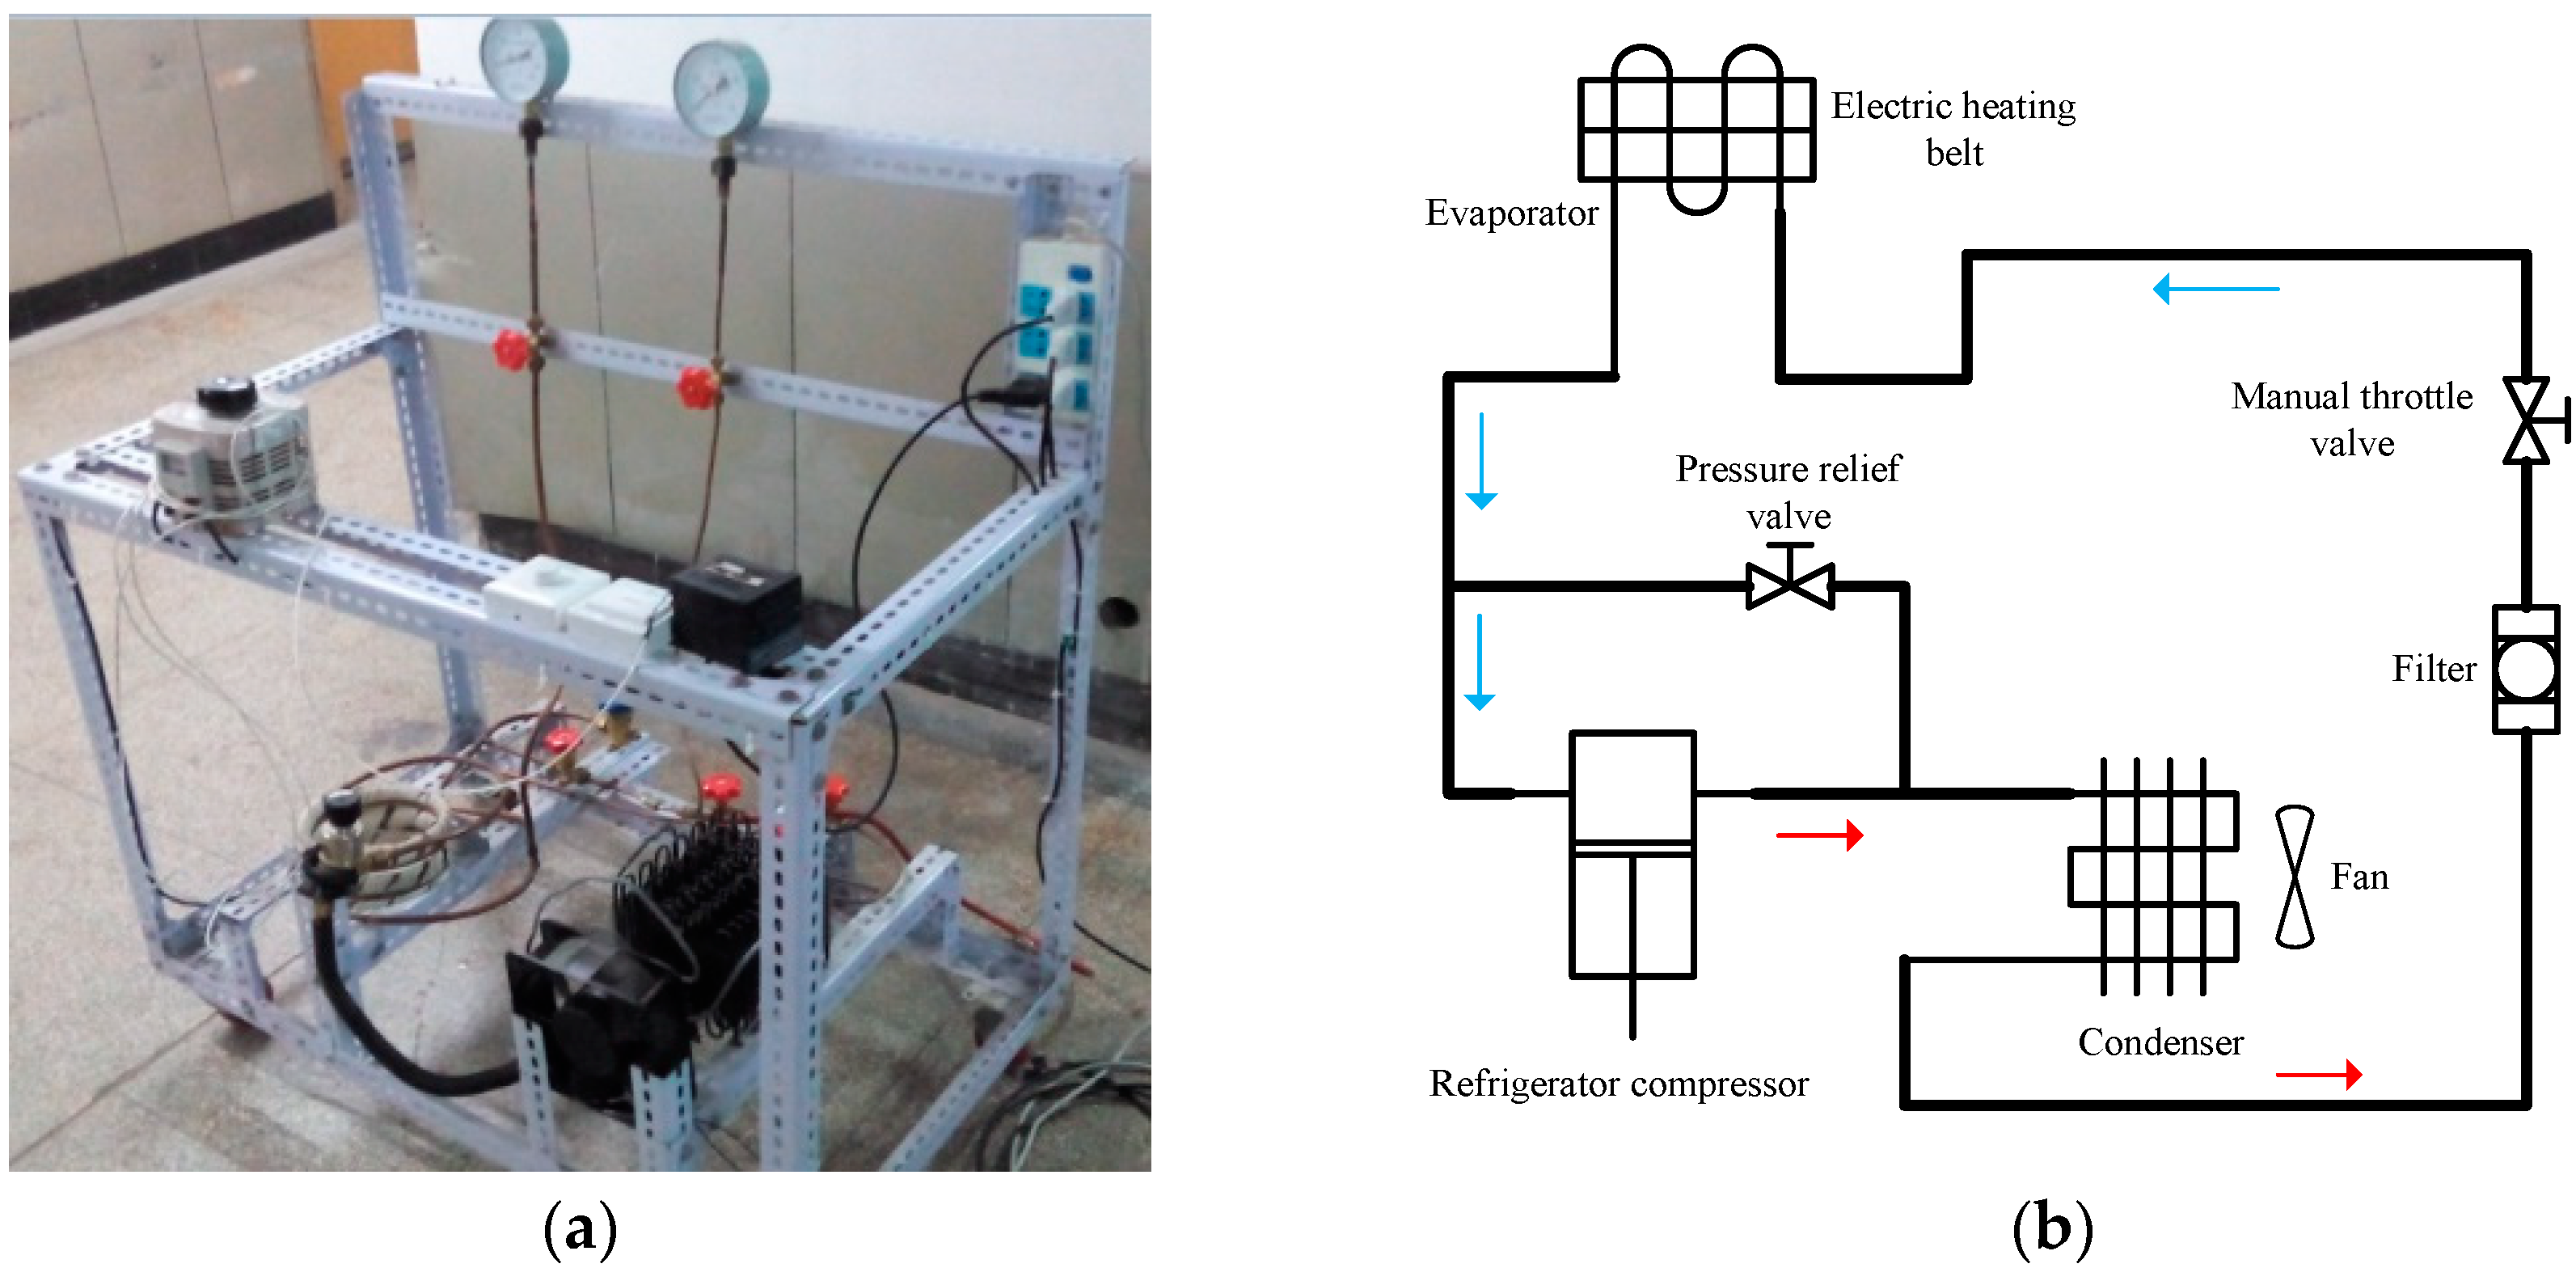
Figure 1. Test facility for refrigeration system: (a) The Laboratory Furniture; (b) The experimental system schematic figure.
Energies 11 02897 g001
Figure 2. Schematic of sensor installation: (a) The special experimental installation for strain; (b) The reed valve.
Energies 11 02897 g002
Figure 3. Deformation and strain of the reed valve.
Energies 11 02897 g003
Figure 4. Schematic of the strain gauge installation.
Energies 11 02897 g004
Figure 5. Calibration of the strain gauge: (a) The experimental facility; (b) The linear relation between the strain and the displacement of the reed valve.
Energies 11 02897 g005
Figure 6. Schematic diagram of the refrigerator compressor.
Energies 11 02897 g006
Figure 7. Explanation for the measure of the crank angle.
Energies 11 02897 g007
Figure 8. The p-V diagram.
Energies 11 02897 g008
Figure 9. Logarithmic p-V diagram.
Energies 11 02897 g009
Figure 10. Suction valve displacement.
Energies 11 02897 g010
Figure 11. Pressure pulsations during suction valve motion.
Energies 11 02897 g011
Figure 12. Suction valve motion.
Energies 11 02897 g012
Figure 13. The pressure pulsation in suction plenum.
Energies 11 02897 g013
Table 1. Structural parameters of the refrigerator compressor.
Compressor ParametersValue
Cylinder diameter31 mm
Connecting rod length39.5 mm
Crank radius12 mm
Rated speed2950 r·min−1
Table 2. Uncertainty of the measurement.
VariableUncertainty Value
Pressure0.1% (full scale)
Differential pressure0.14% (maximum)
Reed displacement1% (full scale)
Reed velocity2% (maximum)
Table 3. The working conditions.
Working Condition ParametersPressureTemperature
Suction0.574 bar0.8 °C
discharge5.80 bar