Article

Hybrid Imperialist Competitive and Grey Wolf Algorithm to Solve Multiobjective Optimal Power Flow with Wind and Solar Units

1
Department of Mechanical Engineering, University of Louisiana at Lafayette, Lafayette, LA 70504, USA
2
Department of Electrical and Computer Engineering, University of Louisiana at Lafayette, Lafayette, LA 70504, USA
*
Author to whom correspondence should be addressed.
Energies 2018, 11(11), 2891; https://doi.org/10.3390/en11112891
Submission received: 24 September 2018 / Revised: 18 October 2018 / Accepted: 21 October 2018 / Published: 24 October 2018
(This article belongs to the Special Issue Optimization Methods Applied to Power Systems)

Abstract

:
The optimal power flow (OPF) module optimizes the generation, transmission, and distribution of electric power without disrupting network power flow, operating limits, or constraints. Similarly to any power flow analysis technique, OPF also allows the determination of system’s state of operation, that is, the injected power, current, and voltage throughout the electric power system. In this context, there is a large range of OPF problems and different approaches to solve them. Moreover, the nature of OPF is evolving due to renewable energy integration and recent flexibility in power grids. This paper presents an original hybrid imperialist competitive and grey wolf algorithm (HIC-GWA) to solve twelve different study cases of simple and multiobjective OPF problems for modern power systems, including wind and photovoltaic power generators. The performance capabilities and potential of the proposed metaheuristic are presented, illustrating the applicability of the approach, and analyzed on two test systems: the IEEE 30 bus and IEEE 118 bus power systems. Sensitivity analysis has been performed on this approach to prove the robustness of the method. Obtained results are analyzed and compared with recently published OPF solutions. The proposed metaheuristic is more efficient and provides much better optimal solutions.

1. Introduction

Optimal power flow (OPF) is the mathematical tool used to find the optimal settings of the power system network [1]. The main target of the OPF problem is to optimize a specific objective function while satisfying feasibility and security constraints [2]. OPF has been broadly used in previous studies [3], and has served as a substantial optimization test problem because it is characterized as multidimensional, large-scale nonlinear nonconvex, and highly constrained [4,5]. Several OPF formulations have been developed during the last few decades in order to optimize the operation of an electric power system subject to physical constraints [6]. The emerging optimization problem uses different names and different objective functions [7]. A lot of OPF solution approaches have been developed, each with distinct mathematical characteristics and computational requirements [8,9]. In recent years, OPF optimization problems have regained importance due to the rapid adoption of distributed energy resources in the network [10]. The integration of distributed and intermittent renewable energy sources, such as photovoltaic (PV) systems and wind energy (WE), into modern power systems has introduced new types of challenges for operating and managing the power grid [11]. The stochastic nature of WE and PV units must be taken into consideration to ensure successful implementation of these intermittent energy sources to the network [12]. Solving the OPF problem has become more complicated with massive incorporation of renewable resources that impose volatile dynamics to the power grid because of their uncertainty.
Conventional optimization methods, like linear (LP) and nonlinear programming (NLP) [13], quadratic programming (QP) [14], interior point method (IPM), and Newton’s method [15] showed excellent convergence characteristics in solving OPF problems; however, they use theoretical assumptions not suitable for practical systems having non-differentiable, non-smooth, and nonconvex objective functions. Sometimes, the preceding approaches fail to represent the main characteristics of the fuel cost as a convex function [16]. Such a situation emerges when piecewise quadratic cost, valve points, and prohibited operating zones characteristics are presented [17]. Usually, multiple trials and accurate adjustment of associated parameters are needed to achieve the optimal solution for a specific problem. As a result, we need a faster and more robust algorithm to solve realistic OPF problems. Recently, many publications have focused on metaheuristics to solve hard optimization problems. Metaheuristics, based on a common set of principles which make it possible to design solution algorithms, may be used to overcome the abovementioned weaknesses. Most metaheuristics have the following features: they are inspired from nature, they do not use the objective function’s Hessian or gradient matrix, they make use of stochastic components, and they have many parameters that need to be adapted to the problem [18]. The following artificial intelligence based optimization methods have been successfully used to solve OPF problems: moth swarm algorithm, MSA [19]; modified particle swarm optimization, MPSO [20]; modified differential evolution, MDE [21]; moth-flame optimization, MFO [22]; flower pollination algorithm, FPA [23]; adaptive real coded biogeography-based optimization, ARCBO and real coded biogeography-based optimization, RCBBO [24]; grey wolf algorithm, GWO and differential evolution, DE [25]; modified Gaussian bare bones imperialist competitive algorithm, MGBICA and Gaussian bare bones imperialist competitive algorithm, GBICA [26]; artificial bee colony, ABC [27]; simulated annealing and hybrid shuffle frog leaping algorithm [28]; Lévy mutation teaching-learning-based optimization, LTLBO [29]; teaching learning-based optimization, TLBO [30]; hybrid MPSO and shuffle frog leaping algorithms, HMPSOSFLA, and particle swarm optimization, PSO [31]; Gbest-guided artificial bee colony, GABC [32]; differential search algorithm, DSA [33]; efficient evolutionary algorithm, EEA and eclectic genetic algorithm, EGA [34]; particle swarm optimization with aging leader and challengers, ALCPSO [35]. The above optimization approaches have been developed to solve simple and multiobjective OPF problems. These algorithms performed better than traditional mathematical programming techniques in solving multiobjective optimization problems because they are less affected by the Pareto front shape, and are capable of finding the optimal solutions sets in one run [36]. The assessment of these metaheuristics is commonly based on experimental comparisons.
The objective of this research is to develop an original metaheuristic called hybrid imperialist competitive and grey wolf algorithm (HIC-GWA) to solve twelve different cases of simple and multiobjective OPF problems for hybrid power systems that includes PV and WE sources, in order to find effective, faster, and better solutions. The potential and efficiency of the HIC-GWA are presented and evaluated on two standard test systems: IEEE 30 and IEEE 118 bus power systems. Simulation results are compared with the abovementioned optimization approaches. The proposed HIC-GWA is a combination of two algorithms: the imperialist competitive algorithm (ICA) and the grey wolf optimization (GWO). ICA is a sociopolitically inspired optimization strategy that has been proposed to handle tough optimization problems [37]. This approach exhibits good performance in terms of convergence rate and improved global optimum [38,39]. The GWO algorithm is an original swarm intelligence technique stimulated by the leadership hierarchy and hunting structure of grey wolves. This robust algorithm has been used in different complex problems because of the reduced number of random parameters and a faster convergence due to continuous reduction of search space [40,41]. Each optimization technique, ICA and GWO, possesses certain specific intelligence to search for the solution of a problem. Therefore, a collection of such abilities enhances the power of the proposed metaheuristic.

2. OPF Problem Formulation

2.1. Objective Functions

OPF research seeks to compute a steady state operating point that reduces cost, emission, loss, etc., while maintaining good system performance. The general OPF problem usually contains discrete and continuous control variables. It is a large-scale, nonconvex, and nonlinear optimization problem. OPF seeks to optimize the generation, transmission, and distribution of electric power with no disruption of flow, operating limits, or constraints. Similar, to other power flow analysis techniques, OPF also allows the determination of system’s state of operation, that is, the injected power, voltage, and current throughout the electric power system. In this context, a large array of OPF formulations and solution methods have been developed. Furthermore, OPF research is growing, due to contemporary electricity markets and integration of renewable energy sources.
The following objective functions are minimized by the proposed HIC-GWA:

2.1.1. Wind Cost Function

Wind energy is increasingly being integrated into the power grid due to its rapidly declining cost and emission free nature. The WE power cost function can be modeled as
C d , w , i = d w , i P w , i
Wind power operators get penalized if they fail to provide the scheduled amount of wind energy. Penalty costs consists of two parts: (1) underestimation cost which should be considered when available power of wind farm is not utilized, (2) overestimation cost which is calculated for buying power from alternate sources (reserves) or load shedding. These costs can be modeled as follows [12]:
C u e , w , i = K u e , w , i P w , i P w , r , i ( P P w , i ) f ( P ) d P
C o e , w , i = K o e , w , i 0 P w , i ( P w , i P ) f ( P ) d P
where i = 1 ,   2 , , n w and f ( P ) symbolizes the probability density function (PDF) of WE output power.
The WE total cost is given by the following function:
F 1 = i = 1 n w C O S T w , i = i = 1 n w C d , w , i + C u e , w , i + C o e , w , i
To model the unpredictable nature of wind speed, we use the Weibull distribution with PDF f ( V w ) and cumulative distribution function (CDF), F ( V w ) , defined as follows [12]:
f ( V w ) = K C ( V w C ) K 1 e ( V w / C ) K ,    V w > 0
F ( V w ) = 1 e ( V w / C ) K ,    V w > 0
The generated power of WE is computed as
P w ( V w ) = { 0        V w < V w , i n , V w > V w , o u t P w , r V w , r V w , i n V w V w , i n · P w , r V w , r V w , i n      V w , i n V w V w , r P w , r      V w , r V w V w , o u t
where
  • V w and V w , r symbolizes speed and rated speed of WE generators,
  • V w , i n and V w , o u t symbolizes cut-in and cut-out speed of WE generators,
  • K , C symbolizes shape and scale parameters of the Weibull distribution.

2.1.2. PV Cost Function

Photovoltaic systems are gaining popularity as a clean energy source due to their affordable cost and simple design. PV characteristics are highly dependent on various factors, including irradiance level, shades, and temperature, which makes it hard to accurately forecast its power production. The generation and penalty costs for PV power can be calculated as follows:
C d , p v , i = d p v , i P p v , i
C u e , p v , i = K u e , p v , i P p v , i P p v , r , i ( P P p v , i ) f ( P ) d P
C o e , p v , i = K o e , p v , i 0 P p v , i ( P p v , i P ) f ( P ) d P
where i = 1 , , n v and f ( P ) represent the PDF of the PV unit’s output power.
The total cost of PVs is given by the following function:
F 2 = i = 1 n v C O S T P V , i = i = 1 n v C d , p v , i + C u e , p v , i + C o e , p v , i
The PDF of the ith PVs’ output power is calculated as follows:
  • Solar cells or PV cells are hypersensitive to the amount of solar radiation. The PDF of solar radiation f ( R ) can be modeled by a beta distribution [12]:
    f ( R ) = Γ ( α + β ) Γ ( α ) Γ ( β ) R α 1 ( 1 R ) β
    where Γ ( . ) is the gamma function, α and β are parameters of the beta distribution, and R is the solar radiation.
  • The relation between power output of PV and output power of solar cell generator which is related to the solar radiation can be calculated as follows:
    P p v ( R ) = { P p v , r ( R 2 R C R S T D ) 0 R R C P p v , r ( R R S T D ) R C R R S T D P p v , r R S T D R
    where R C and R S T D are solar radiation in W/m2. Usually, a typical solar radiation point is set to 150 W/m2, and it is set to 100 W/m2 under standard conditions.

2.1.3. Basic Fuel Cost Function

The basic fuel cost is OPF’s most common objective function. A power plant’s fuel cost is commonly modeled as a quadratic function [42]:
F 3 = i = 1 n G a i + b i P G i + c i P G i 2
where i   represents   the   i th   power   plant   and   n G is the number of power plants. a i , b i , and c i are cost coefficients for the i th power plant. P G i is power of i th power plant.

2.1.4. Piecewise Quadratic Fuel Cost Function

For a given operating range, power plants usually use the most economical available fuel option. Such a system has piecewise quadratic fuel cost function
  F 4 = i = 1 n G f i ( P i )
Each quadratic piece of the fossil fuel cost can be calculated using the following function:
f i ( P i ) = k = 1 n f a i , k + b i , k P G i + c i , k P G i 2
where n f is the number of fossil fuel options for i th power plant and a i , k , b i , k , c i , k , are coefficients for the cost of i th power plant for k th fuel option.

2.1.5. Piecewise Quadratic Fuel Cost with Valve Point Loading

The generator cost is a convex function with an incremental heat rate curve, subjected to discontinuities caused by the steam admission valves in large turbines. The valve point effect must be included in order to have an accurate cost for each generating unit [43]:
F 5 = i = 1 n G a i + b i P G i + c i P G i 2 + | e i s i n ( f i ( P G i m i n P G i ) ) |
where e i and f i are valve point cost coefficients of i th power plant.

2.1.6. Emission Cost Function

To produce electricity, a fossil fuel power station burns natural gas, petroleum, or coal. Significant amounts of emission are produced during the burning process. In this paper, the emission level of the two important pollutants, nitrogen oxides (NOx) and sulfur oxides (SOx), are modeled by the following function [19]:
F 6 = i = 1 n G α i + β i P G i + γ i P G i 2 + ζ i e ( θ i P G i )
where, α i , β i , ζ i , and θ i are emission coefficients of i th power plant.

2.1.7. Power Loss Cost Function

To reduce the active power loss of transmission lines, the following power loss function has to be minimized [27]:
F 7 = i = 1 n l j = 1 j i n l G i j V i 2 + B i j V j 2 2 V i V j cos δ i j
where n l is the number of transmission lines, ( G i j , B i j ) are (real, imaginary) of ith jth components of the admittance matrix, δ i j is the angle separating the i th bus from the j th bus, and V i is the i th bus voltage.

2.1.8. Fuel Cost and Active Power Loss Cost Function

This function model two simple objectives: fuel cost and active power loss.
F 8 = F 3 + β 1 F 7
where β 1 is a weighting factor.

2.1.9. Fuel Cost and Voltage Deviation

One of the valuable quality and security indices is the voltage magnitude fluctuation from the specified reference value at each load bus. This function models both fuel cost and voltage deviation (VD).
F 9 = F 3 + β 2 i = 1 n L | 1 V L i |
where n L is the number of load buses, V L i is the i th voltage of load buses, and β 2 is a weighting factor.

2.1.10. Fuel Cost and Voltage Stability Enhancement

Voltage stability is the ability of a power system to sustain stable voltages at each bus within acceptable level after being exposed to a disruption. It is represented by indices like the L index, which has been introduced to evaluate the stability limit [19]. The L index is a quantitative measure of how close a point is to the system stability limit. Reducing the value of the L index is very important in power system planning and operations.
This function models the fuel cost and the L index maximum.
F 10 = F 3 + β 3 L m a x
where β 3 is a weighting factor.
The nodal admittance relates system voltages and currents as
I b u s = Y b u s × V b u s
Equation (23) can be reformulated by separating the PQ bus—active and reactive power; and the PV bus—active power and voltage magnitude.
[ I L I G ] = [ Y 1 Y 2 Y 3 Y 4 ] [ V L V G ]  
The L index is calculated by
L j = | 1 i = 1 G N γ j i V i V j |      j = 1 , 2 , , N L
γ j i = [ Y 1 ] 1 × [ Y 2 ]
where Y_1 and Y_2 are the system Y bus submatrices.
L m a x = max ( L j )      j = 1 , 2 , , n b

2.1.11. Fuel Cost and Voltage Stability Enhancement during Contingency Condition

Transmission lines outages are used to replicate a contingency condition. This function models both fuel cost and enhancement of voltage stability.
F 11 = F 3 + β 4 ( m a x ( L i ) )
where β 4 is a weighting factor.

2.1.12. Fuel Cost, Emission, Voltage Deviation, and Active Power Loss

This function models fuel cost, emission, voltage deviation, and active power loss.
F 12 = F 3 + β 5 F 6 + β 6 i = 1 n L | 1 V L i | + β 7 F 7
where β 5 , β 6 , and β 7 are weighting factors.

2.2. Constraints

The OPF optimization problem should satisfy the following constraints:
(1) Active and reactive power balances
P G i P D i = j = 1 n V i V j ( G i j c o s δ i j + B i j s i n δ i j )    i = 1 , . , n Q G i Q D i = j = 1 n V i V j ( G i j s i n δ i j B i j c o s δ i j )    i = 1 , . , n
where the number of power system bus is represented by n . P G i , Q G i , and P D i , Q D i are active and reactive power of generators and load, respectively, at the i th bus.
(2) The voltage magnitude of the power plant
V i m i n V i V i m a x ,    i = 1 , 2 , , n G
where V i m i n and V i m a x are minimum and maximum limit of i th bus voltage of power plants V i .
(3) Prohibited operating zones
There is a risk of machine or accessory failure when a power plant operates outside acceptable ranges, as shown in Equations (32)–(41).
{ P G i m i n P G i P G i , 1 l P G i , k 1 u P G i P G i , k l P G i , z u P G i P G i m a x    k = 1 , 2 , , z
where P G i , k l and P G i , k u are lower and upper bounds of the k th POZ of i th unit. P G i m i n and P G i m a x are active power boundaries of i th generator.
(4) Active and reactive power
P G i m i n P G i P G i m a x Q G i m i n Q G i Q G i m a x    , i = 1 , 2 , , n G
where Q G i m i n and Q G i m a x are boundaries’ reactive power of i th traditional generator.
(5) Phase shifter and transformer tap
P S i m i n P S i P S i m a x ,    i = 1 , 2 , , N p h a s e
T i m i n T i T i m a x ,    i = 1 , 2 , , N t a p
T i m i n and T i m a x are boundaries of i th tap changer transformer T i , P S i m i n , and P S i m a x are boundaries of i th phase shifter transformer P S i , and N t a p , N p h a s e , are the number of tap changer and installed phase shifter to the network.
(6) Shunt compensator
Q c , i m i n Q c , i Q c , i m a x    i = 1 , 2 , , N c a p
where Q c , i m i n and Q c , i m a x are the i th shunt compensator Q c , i limits. N c a p represents the number of capacitors linked to the network.
(7) Transmission line loading
| S i | S i m a x    i = 1 , 2 , , N l
where S i m a x is MVA’s maximum. N l is the number of lines.
(8) Active power of WE
0 P w , i P w , r , i
Each wind turbine is equipped with a squirrel cage induction generator modeled as PQ buses [44].
P w , i 2 + Q w , i 2 + V w w , i 2 Q w , i X i = 0
V w w , i 2 2 X i Q w , i 0
where X i is the sum of the leakage reactance of the stator and rotor of the i th wind turbine. V w w , i  and  Q w , i represents the voltage and the reactive power of the associated bus of the i th wind generator.
(9) Active power of photovoltaic
0 P p v , i P p v , r , i

3. New Hybrid Optimization Algorithm

In this research, a new metaheuristic HIC-GWA is considered to solve twelve cases of simple and multiobjective OPF problems. This approach is a combination of two algorithms: ICA and GWO. Each of such optimization techniques, ICA and GWO, possesses certain specific heuristics to search for the solution of a problem. Therefore, a collection of such abilities enhances the power of the proposed metaheuristic.

3.1. Imperialist Competitive Algorithm (ICA)

The ICA is stimulated by the sociopolitical aspect of imperialistic competition between countries in the same population. Countries can be colonies or imperialists. Powerful countries are selected to be imperialists. Colonies are distributed among imperialists based on imperialist’s power. Empires are formed with imperialist states and their colonies. Imperialistic competition between empires converge to one imperialist state which represent the optimum point of the ICA [37,38,39].

3.1.1. Creation of Initial Empires

A country is usually represented by an Nvar-dimensional array of variables that should be optimized.
country = [ P 1 , P 2 , , P N   v a r ]
The cost of each country is inversely proportional to its power.
The cost function f is given by
cost = f   ( country ) = f   ( P 1 , P 2 , , P N   v a r )
In the initialization process, the algorithm produces NCountry initial countries. A certain number of empires, Nimp, are formed with the most powerful countries. The remaining countries, Ncol, become colonies of the empires.
The cost of the n th imperialist is
C n = c n { c i } i m a x
The power of the n th imperialist is
p n = | C n i = 1 N i m p C i |
The n th empire’s initial number of colonies is
N C n = r o u n d { p n × N c o l }
where N c o l is the total number of original colonies.

3.1.2. Assimilation

To absorb their colonies, the imperialist states use different sociopolitical axes to make colonies move toward themselves. This movement can be modeled using different optimization axes. In a two-dimensional problem, colonies are absorbed by the imperialist using language and culture. Colonies will move toward the imperialist among these two axes. This acclimatization, modeled by approaching the colonies to the imperialist, will continue until all colonies are fully assimilated. This motion is represented by a uniform distribution:
x ~ U ( 0 , β × d )
where β ˃ 1. d   represents the distance separating the colony to the imperialist state.
A random deviation θ is added to the direction of movement to increase the search space around the imperialist. θ is represented by a uniform distribution.
θ ~ U ( γ , + γ )
where γ accommodates the fluctuation from the initial direction.

3.1.3. Revolution

Revolution is simulated to denote a shift in sociopolitical institutions that prohibits the convergence of a country to a local minimum which increases the exploration of this approach.

3.1.4. Exchanging Positions of a Colony and the Imperialist

The colony and the imperialist countries will change positions if the colony reaches a position with higher power than the imperialist.

3.1.5. Union of Empires

While moving toward the optimum solution, two imperialists may merge into one empire if they are too close to each other. Their colonies become colonies of the new empire which take the position of one of the two imperialists.

3.1.6. Total Empire Power

An empire’s total power is highly correlated to the power of the imperialist country, but it is slightly affected by the power of the colonies. An empire’s total cost is modeled as
T C n = C o s t ( i m p e r i a l i s t n ) + ξ m e a n { C o s t ( c o l o n i e s   o f   e m p i r e n ) }
where ξ is a positive small weight factor.

3.1.7. Imperialistic Competition

This competition is built on the total power of the empires. Empires try to take control of each other’s colonies to expand their territory. Every empire will have the possibility of possessing colonies that it is competing for. Powerful empires will control weaker colonies. The weakest colony of the weakest empire will be selected in the initiation process of the competition. An empire’s possession probability (PP) is proportional to the empire’s total power.
Empire’s normal total cost:
N T C n = T C n m a x i { T C i }
Empire’s possession probability:
P P n = | N T C n i = 1 N i m p N T C i |
The algorithm will stop after a predetermined number of iterations which represents maximum number of decades.

3.2. Grey Wolf Optimizer (GWO)

The GWO is a conventional swarm intelligence algorithm stimulated by the leadership hierarchy and hunting structure of grey wolves. This algorithm has been used in diverse complex problems because of its simplicity and robustness. The wolf colony ( N w ) is divided into four clusters: alpha (α), beta (β), delta (δ), and omega (Ω). The hunting mechanism involves three main steps: searching and approaching the prey, encircling and harassing the prey, and attacking the prey [40,41].

3.2.1. Social Hierarchy

The leaders α are mostly responsible for making decisions about hunting. They are considered as the fittest solution. The second-best candidates are the β wolves, based on the democratic behavior of the colony. Consequently, the δ wolves take place after the β wolves. The rest are assumed to be the ω wolves . The optimization (hunting) process is guided by α , β , and δ , with the ω wolves tracking them.

3.2.2. Encircling Prey

Hunting in groups is another compelling social behavior of grey wolves. A grey wolf can revise its position neighboring the prey in any random place using the following equations [40]:
D = | C × X p ( t ) X ( t ) |
X ( t + 1 ) = X p ( t ) A × D
where X p represent the prey’s location vector, X indicates the wolf’s location vector, t represents the current iteration; and A and C are coefficient vectors:
A = 2 a × r 1 a
C = 2 × r 2
where r 1 and r 2 are random vectors in [0, 1], and vector a components vary from 2 to 0, linearly, throughout the iterations.

3.2.3. Hunting

The α , β , and δ type wolves have better awareness about the possible prey’s position. Consequently, the initial three best solutions are saved. The other search agents should update their locations according to the position of the leading search agents [40] using Equations (55)–(61).
D α = | C 1 × X α X |
D β = | C 2 × X β X |
D δ = | C 3 × X δ X |
X 1 = X α A 1 × ( D α )
X 2 = X β A 2 × ( D β )
X 3 = X δ A 3 × ( D δ )
X ( t + 1 ) = X 1 + X 2 + X 3 3

3.2.4. Attacking Prey (Exploitation)

When attacking the prey, the value of a is reduced, which decreases the variation of A . If | A | < 1 , then, the next location of the search agent will be closer to the prey.

3.2.5. Search for Prey (Exploration)

The search is guided according to the α , β , and δ type grey wolves’ positions. They go in different directions to search for prey, and gather again to attack it. This divergence is modeled using | A | > 1 , which allows the GWO to search all over the space by forcing the search agent to get away from the prey. The C vector is another constituent of the GWO that helps exploration. It contains random values between 0 and 2 inclusive. This parameter provides random weights for prey to emphasize ( C 1 ) or deemphasize ( C < 1 ) the effect of prey in determining the distance in Equation (51). Consequently, the GWO exhibits a random behavior during optimization to avoid local optima and promote exploration. The GWO intentionally requires C to provide random values to accentuate exploitation/exploration during initial and final iterations. This helps if there is a stagnation of the local optima. C is not linearly decreased in comparison to A.

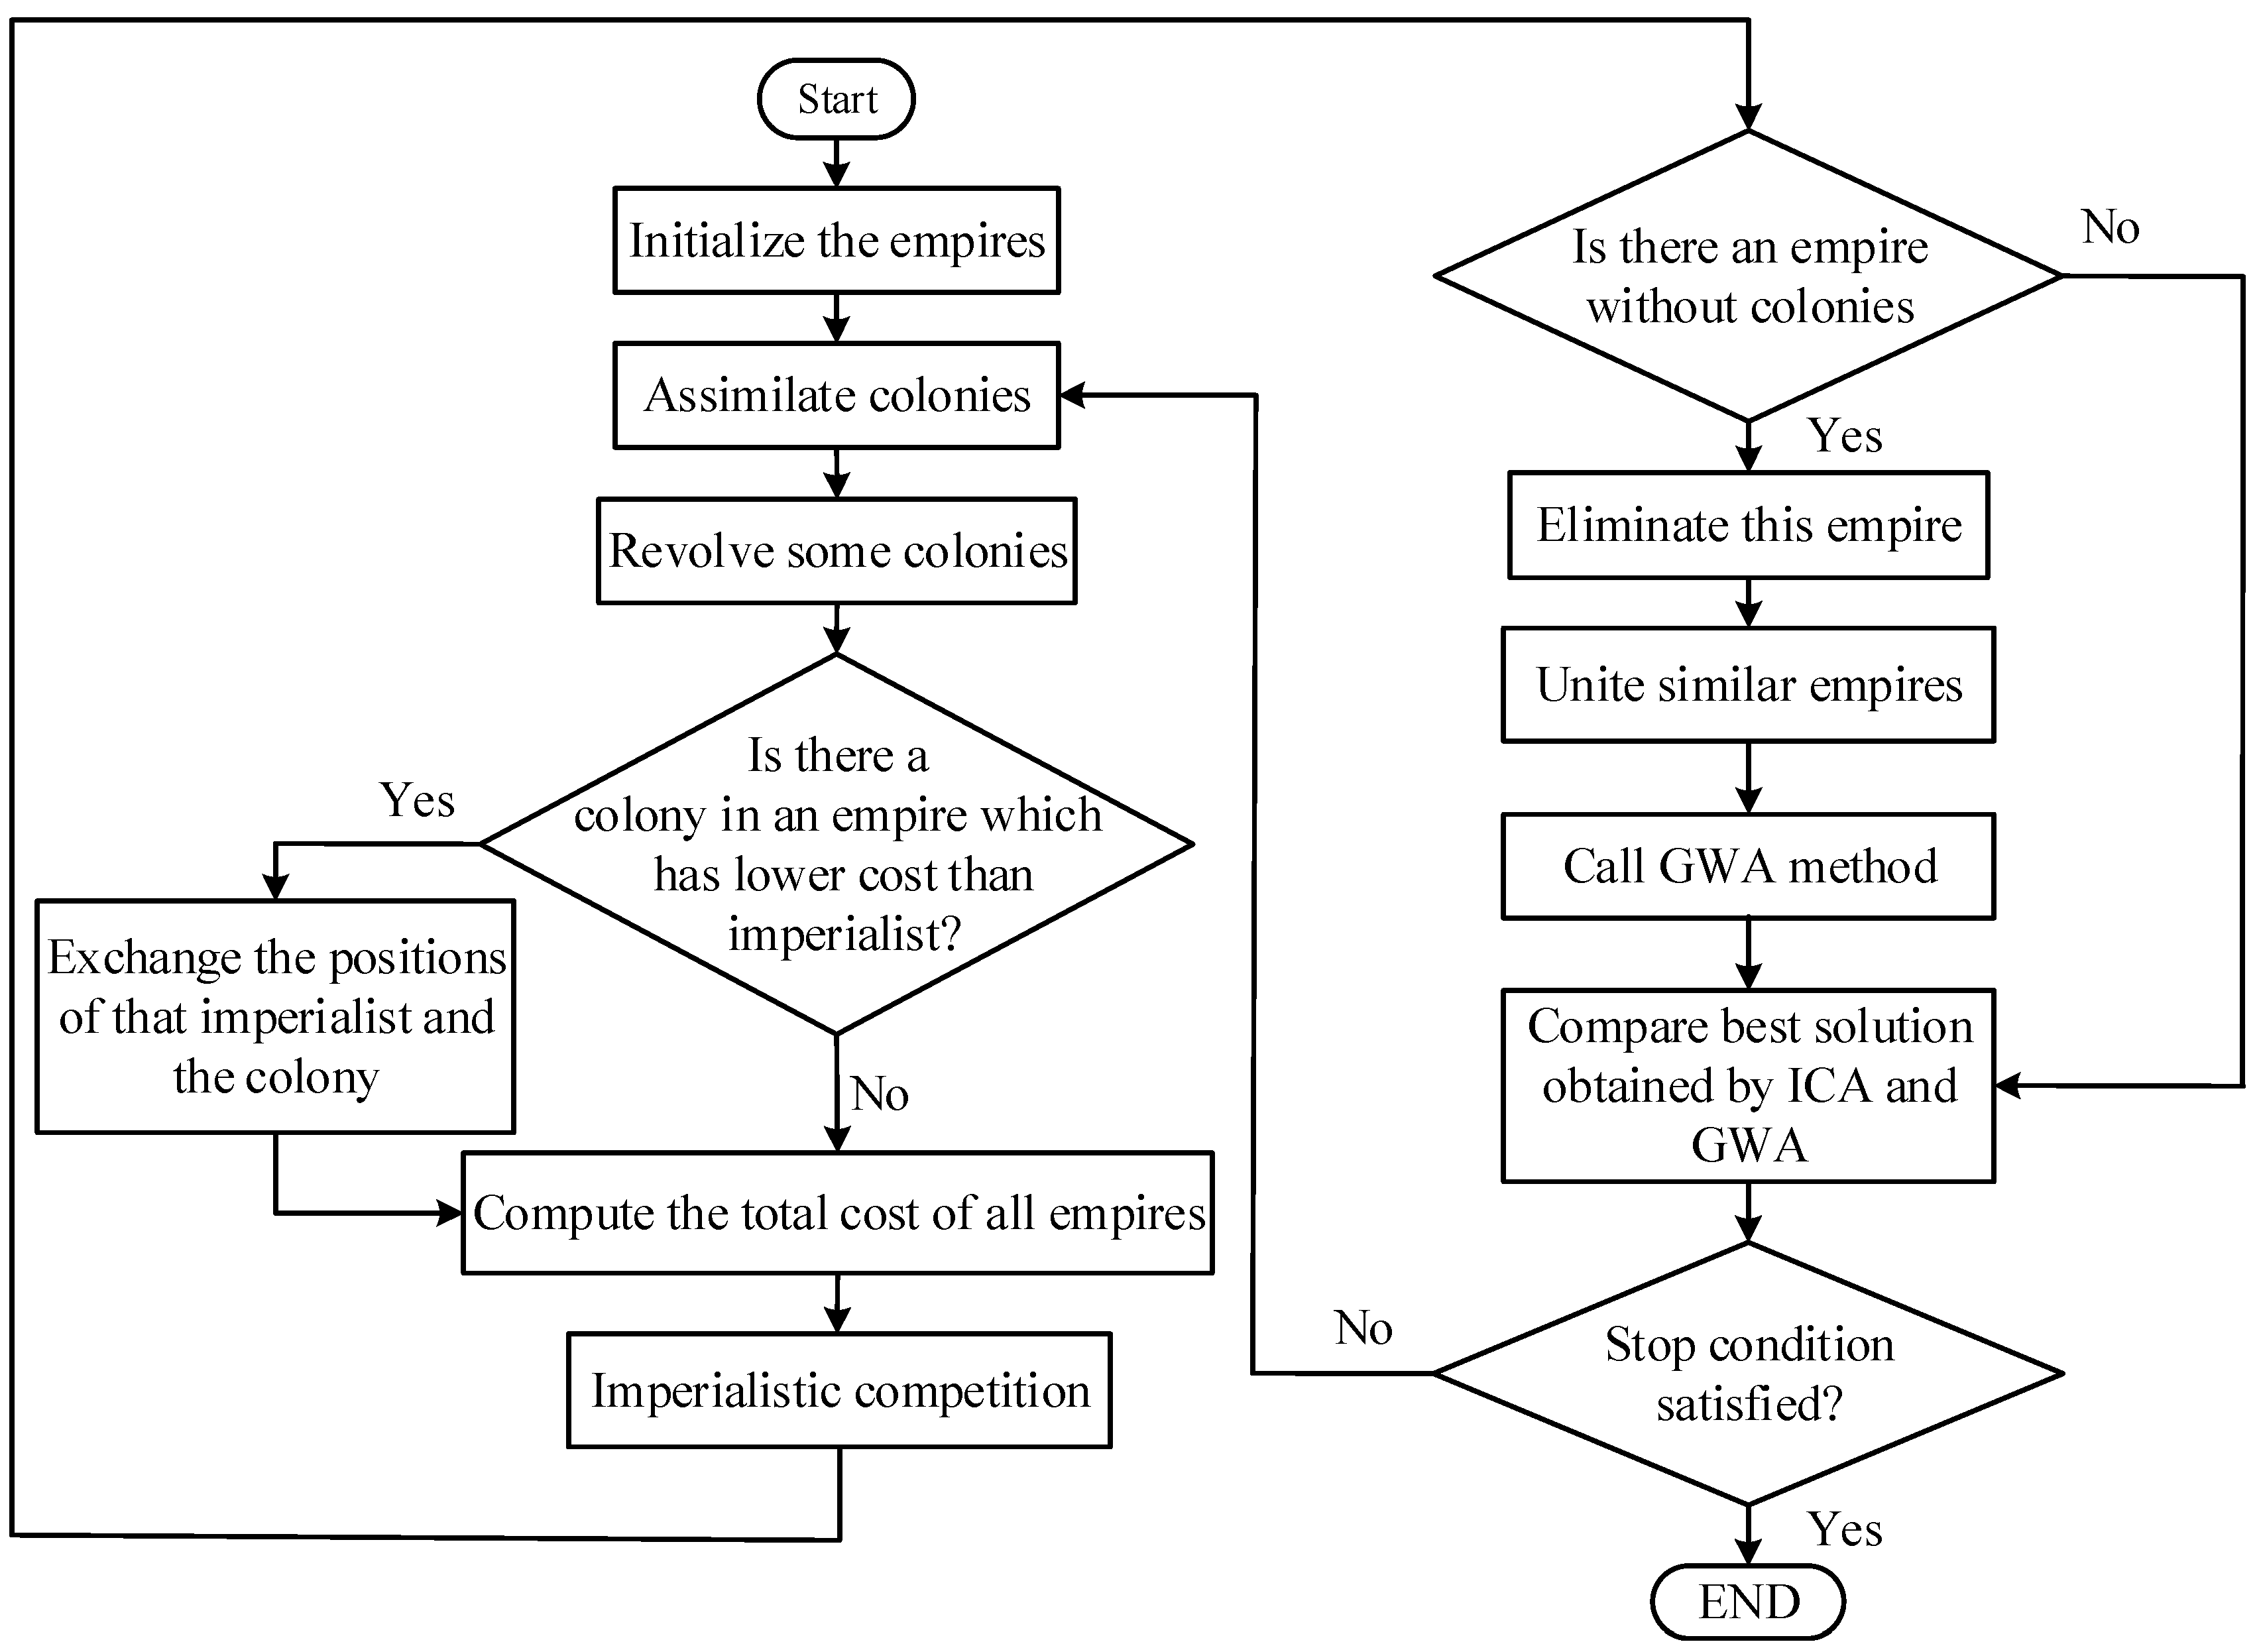
3.3. Hybrid IC-GWA Optimization Approach

Hybrid algorithms are created to increase the performance of an optimization algorithm. They combine the advantages of two or more algorithms. The HIC-GWA is a combination of two evolutionary algorithms where the GWO is used to enhance the exploration ability of the ICA as shown in Figure 1.
In this proposed approach, ICA is initialized first to solve the OPF optimization problem. The assimilation and revolution of colonies, imperialist competition, elimination, and uniting empires are performed. The best solution of ICA is calculated as an initial condition of the GWA. The solution of the GWA is saved as the best value if it is less than the ICA’s solution. The simulation continue until the stop condition is satisfied. The converged answer is achieved after termination of the algorithm.
The following steps show how to use the HIC-GWA to solve the OPF problem:
  • The power system data is specified. The HIC-GWA parameters are determined.
  • Initialize the countries randomly, calculate their costs, and use assimilation.
  • Revolution.
  • Exchange positions between imperialist and colony if it has a lower cost.
  • Unite similar empires.
  • Calculate the total cost of all empires.
  • Imperialist competition.
  • Discard powerless empires.
  • Use solution obtained by ICA as initial condition for GWA.
  • The lower solution between ICA and GWA is saved as best solution.
  • Go to step (ii) if the stop condition is not satisfied, otherwise, finish simulation.

4. Simulation Results

The HIC-GWA has been applied on the IEEE 30 and 118 bus power systems to solve 12 different cases of OPF problems. The maximum number of iterations is 500 for IEEE 118 bus power system, and 100 for the IEEE 30 bus power systems. Power systems parameters are given in Table 1. The setting of the proposed HIC-GWA approach can be found in Table 2. MATLAB 8.3 (R2014a) has been used to implement simulations on a personal computer with i7 CPU 3.0 GHz 8.0 GB RAM [45,46].
The initial population is represented by N c o u n t r y . Each population contains one vector with N v a r components, including bus voltage and active power of the power plant, transformer tap changers, and shunt power injection compensator. The parameter N v a r , given in Table 1 is different for each case.
Solutions using the proposed approach will be compared with recently published OPF solutions using different optimization methods and objective functions shown in Table 3.

4.1. IEEE 30 Bus Test System

This power test system is used to exhibit the efficiency of the HIC-GWA. The details for busses and line data are shown in [43]. The system active and reactive power are 283.4 MW and 126.2 MVAR.

4.1.1. Simple Objective OPF

The first five case studies have been used to solve simple objective OPF problems.
Case 1: Fuel Cost
This first single objective function considers minimizing the total fuel cost of power generation. It is modeled by the quadratic cost curve given in Equation (14). Simulation results, illustrated in Table 4, show that the fuel cost using the HIC-GWA is 798.20 ($/h).
Compared with solutions from state-of-the-art existing optimization approaches in Table 5, the proposed HIC-GWA has significantly reduced the total fuel cost.
The convergence curve of the total cost ($/h) for case 1 is shown in Figure 2. Note that it converged in less than 30 iterations.
Case 2: Piecewise quadratic fuel cost
Thermal generators produce electricity by burning fuels such as coal, petroleum, or natural gas. The model for the fuel cost curve is given by Equation (15). Simulation results, illustrated in Table 4, show that the fuel cost using the proposed approach is 645.85 ($/h). Compared with existing optimization methods in Table 6, HIC-GWA has significantly reduced the total fuel cost.
In cases 1 and 2, the proposed metaheuristic has a better convergence than recently published optimization methods.
Case 3: Piecewise quadratic fuel cost with valve point loading
The valve point loading effect is included in the cost function of Equation (17). Simulation results, illustrated in Table 4, show that the fuel cost using HIC-GWA is 902.25 ($/h). Compared with existing optimization methods in Table 7, HIC-GWA has significantly reduced the fuel cost in this case.
Case 4: Emission
The objective, in this case, is to reduce the emission level of important air pollutants like NOx and SOx, using the emission function described in Equation (18). Simulation results, illustrated in Table 4, show that the emission using HIC-GWA is 0.2009 (ton/h). Compared with existing optimization methods in Table 8, HIC-GWA has significantly reduced the emission level.
Case 5: Active power loss
To reduce transmission lines active power loss, we use the objective function given in Equation (19). Simulation results, illustrated in Table 4, show that the power loss using HIC-GWA is 2.61 (MW). Compared with existing optimization methods in Table 9, HIC-GWA has significantly reduced the power loss.
In cases 3, 4, and 5, the proposed metaheuristic showed a better exploration than recently published optimization methods that appear to be stuck at a local minimum.

4.1.2. Multiobjective OPF

In the next five cases, we used the proposed metaheuristics to find better solutions for multiobjective OPF problems. Table 10 summarizes the best solutions of the simulation results using the HIC-GWA approach for cases 6–10.
Case 6: Fuel cost and active power losses
Cases 1 and 5 have been combined to reduce the fuel cost and the active power losses using the multiobjective function given in Equation (20). Simulation results show that the fuel cost and power loss using HIC-GWA are 856.99 ($/h) and 4.04 (MW). Compared with MSA, MDE, MPSO, FPA, and MFO approaches in Table 11, HIC-GWA has significantly reduced the fuel cost and power loss.
Case 7: Fuel cost and voltage deviation
Voltage profile management is essential to ensure system security. Voltage profile improvement reduces the deviation of load bus voltage. A multiobjective function is presented in Equation (21) to reduce the voltage deviations and fuel cost simultaneously. Simulation results show that the fuel cost and voltage deviations using the proposed approach are 802.45 ($/h) and 0.10 (p.u), respectively. Compared with MSA, MDE, MPSO, FPA, and MFO approaches in Table 12, HIC-GWA has significantly reduced the fuel cost and voltage deviations.
Case 8: Fuel cost with voltage stability improvement
The L index describes the system stability by measuring the distance of the actual state of the system to the stability limit. We are using the objective function given in Equation (22) to reduce both fuel cost and voltage stability. Simulation results, illustrated in Table 13, show that the fuel cost and L index using the proposed approach are 797.80 ($/h) and 0.11 (p.u), respectively. Compared with MSA, MDE, MPSO, FPA, and MFO approaches in Table 13, HIC-GWA has significantly reduced the fuel cost and L index.
Case 9: Fuel cost with voltage stability improvement during contingency condition
We consider the previous case with disruption of line (2–6) to simulate N - 1 contingency. Best solutions for the fuel cost and the L index using HIC-GWA are 802.00 ($/h) and 0.11 (p.u), respectively. Compared with MSA, MDE, MPSO, FPA, and MFO approaches illustrated in Table 14, HIC-GWA has significantly reduced the fuel cost and L index during contingency condition.
Case 10: Fuel cost, voltage deviation, emission, and power loss
The multiobjective function defined by Equation (24) combines three previous cases: 4, 5, and 7 to minimize fuel cost, voltage deviation, emission, and power loss simultaneously. Simulation results, illustrated in Table 15, show that HIC-GWA has significantly reduced the fuel cost, emission, power loss, and voltage deviation compared with MSA, MDE, MPSO, FPA, and MFO approaches
In cases 6–10, the proposed metaheuristic showed a better exploration than recently published optimization methods that appear to be stuck at a local minimum.
The total cost convergence curve for case 10 is displayed in Figure 3. The HIC-GWA approach converged in less than 50 iterations.
Convergence curves of the fuel cost, voltage deviation, power loss, and emission are shown in Figure 4.

4.2. The IEEE 118 Bus Power System

The IEEE 118 bus test system [44], has been used for the next two cases to confirm the effectiveness of the HIC-GWA approach. The active and reactive power demand are 4242 MW and 1439 MVAR.
Case 11: Fuel cost
The function modeled by the quadratic cost curve given in Equation (14) is considered to minimize the total fuel cost of power generation. The simulation results, illustrated in Table 16, show that the HIC-GWA has significantly reduced the fuel cost compared with MSA, MDE, MPSO, FPA, and MFO approaches.
In this case, the proposed metaheuristic has a better convergence than recently published optimization methods.
Case 12: Fuel cost with renewable energy sources (Wind/PV)
The objective in this case is to use the HIC-GWA to minimize the fuel cost ( F 1 ) , wind cost ( F 2 ) , and PV cost ( F 3 ) for a system that includes renewable sources like WE and PV. The conventional power plants 12, 31, 66, 72, and 100 are replaced by five wind power units, and the conventional power plants 34, 36, 46, and 62 are replaced by four PV units. The simulation results are illustrated in Table 17.
The total cost convergence curve for case 12 is presented in Figure 5. The proposed HIC-GWA approach converged in less than 100 iterations.

4.3. HIC-GWA Robustness Analysis

Robustness analysis, which is a non-empirical form of confirmation, is an indispensable procedure in studying complex phenomena. A sensitivity analysis for case studies 1 and 11 has been performed to evaluate the robustness of the considered metaheuristic. Each parameter of the HIC-GWA has been perturbed by changing the values up and down. Likewise, optimization parameters values have been changed also to check the global effect of parameter’s variations on the solution of the OPF problem. The equivalent Pareto solutions are illustrated in Table 18. The deviation ratio between normal and perturbed solutions is calculated using the following equation:
D e v i a t i o n   ( % ) = N o r m a l   S o l u t i o n P e r t u r b e d   S o l u t i o n N o r m a l   S o l u t i o n × 100 ,
Small deviations affirm the robustness of the HIC-GWA to variation of parameters in solving OPF problems.
To confirm the robustness of the HIC-GWA, we compare best and worst fuel cost averages to recently published OPF optimization methods in Table 19. The proposed HIC-GWA has consistently better solutions over 30 trial runs.
Table 20 shows the convergence speed of the HIC-GWA compared to recently published optimization methods. With 14.34 (s), HIC-GWA is second fastest to MFO by one hundredth of a second.

5. Conclusions

A novel hybrid optimization method combining imperialist competitive and grey wolf algorithm, HIC-GWA, has been proposed, developed, and applied successfully to solve twelve different test cases of single and multiobjective OPF problems in two IEEE test power systems with a mixture of wind energy and photovoltaic units. The results show that this metaheuristic is found to be very effective for large-scale applications, due to fast convergence and very few chances to get stuck at local minima. Analysis of the obtained solutions, along with a comparative study with recently published OPF optimization algorithms, proved the validity, effectiveness, and robustness of the HIC-GWA in precisely providing a set of stable optimal solutions, computed under realistic conditions, for a hybrid power system. This is very important in managing modern power systems, which are incorporating an ever-increased number of alternative energy sources. The proposed metaheuristic outperformed current well known and powerful algorithms in the literature, which confirms its superiority and potential to find valid and accurate solutions for multiobjective optimization. Indeed, the proposed paradigm may be used as a tool to answer many specific features of large-scale complex systems in general, thereby motivating further studies.

Author Contributions

Conceptualization, J.B.; Methodology, J.B.; Software, J.B., and M.M.; Validation, J.B., and M.M.; Formal Analysis, J.B.; Investigation, J.B.; Resources, J.B.; Data Curation, J.B.; Writing-Original Draft Preparation, J.B.; Writing-Review & Editing, J.B., J.L., and T.C.; Visualization, J.B., M.M.; J.L.; and T.C.; Supervision, J.L., and T.C.; Project Administration, J.L., and T.C.; Funding Acquisition, T.C.

Funding

This research received no external funding.

Conflicts of Interest

The authors declare no conflict of interest.

Nomenclature

C d , i direct cost of WE and PV($/h)
C u e , i underestimating penalty cost of ith WE and PV ($/h)
C o e , i overestimating penalty cost of ith WE and PV ($/h)
C O S T i total cost of ith WE and PV ($/h)
d w , i direct cost coefficient of WE and PV ($/MW)
K u e , i underestimating coefficient cost of ith WE and PV ($/MW)
K o e , i overestimating coefficients cost of ithWE and PV ($/MW)
P w , i power of the ith WE (MW)
P p v , i power of the ith PV (MW)
P w , r , i rated power of the ith WE (MW)
P p v , r , i rated power of the ith PV(MW)
n w number of WEs
n v number of PVs

References

  1. Carpentier, J. Optimal power flows. Int. J. Elect. Power Energy Syst. 1979, 1, 3–15. [Google Scholar] [CrossRef]
  2. Momoh, J.A.; Koessler, R.J.; Bond, M.S.; Stott, B.; Sun, D.; Papalexopoulos, A.; Ristanovic, P. Challenges to optimal power flow. IEEE Trans. Power Syst. 1997, 12, 444–447. [Google Scholar] [CrossRef]
  3. Capitanescu, F.; Martinez Ramos, J.L.; Panciatici, P.; Kirschen, D.; Platbrood, L.; Wehenkel, L. State-of-the-art challenges and future trends in security constrained optimal power flow. Elect. Power Syst. Res. 2011, 81, 1731–1741. [Google Scholar] [CrossRef]
  4. Low, S.H. Convex Relaxation of Optimal Power Flow: Parts I & II. IEEE Trans. Control Netw. Syst. 2014, 1, 15–27. [Google Scholar]
  5. Panciatici, P.; Campi, M.; Garatti, S.; Low, S.; Molzahn, D.; Sun, A.; Wehenkel, L. Advanced optimization methods for power systems. In Proceedings of the 18th Power Systems Computation Conference (PSCC), Wroclaw, Poland, 18–22 August 2014; pp. 1–18. [Google Scholar]
  6. Cain, M.B.; O’Neill, R.P.; Castillo, A. History of Optimal Power Flow and Formulations. Available online: https://www.ferc.gov/industries/electric/indus-act/market-planning/opf-papers/acopf-1-history-formulation-testing.pdf (accessed on 18 June 2018).
  7. Molzahn, D.K.; Dorfler, F.; Sandberg, H.; Low, S.H.; Chakrabarti, S.; Baldick, R.; Lavaei, J. A survey of distributed optimization and control algorithms for electric power systems. IEEE Trans. Smart Grid 2017, 8, 2941–2962. [Google Scholar] [CrossRef]
  8. Frank, S.; Steponavice, I.; Rebennack, S. Optimal power flow: A bibliographic survey parts I and II. Energy Syst. 2012, 3, 221–289. [Google Scholar] [CrossRef]
  9. Baydar, B.; Gozde, H.; Taplamacioglu, M.C.; Kucuk, A.O. Resilient Optimal Power Flow with Evolutionary Computation Methods: Short Survey. In Power Systems Resilience; Mahdavi, T.N., Ed.; Springer: Cham, Switzerland, 2019. [Google Scholar]
  10. Thomson, M.; Infield, D. Network power-flow analysis for a high penetration of distributed generation. IEEE Trans. Power Syst. 2007, 22, 1157–1162. [Google Scholar] [CrossRef] [Green Version]
  11. Bonface, O.N.; Hideharu, S.; Tsuyoshi, F. Optimal power flow considering line-conductor temperature limits under high penetration of intermittent renewable energy sources. Int. J. Electr. Power Energy Syst. 2018, 101, 255–267. [Google Scholar]
  12. Morshed, M.J.; Ben Hmida, J.; Fekih, A. A probabilistic multiobjective approach for power flow optimization in hybrid wind-PV-PEV systems. Appl. Energy 2018, 211, 1136–1149. [Google Scholar] [CrossRef]
  13. Pourakbari-Kasmaei, M.; Sanches, J.R. Logically constrained optimal power flow: Solver-based mixed-integer nonlinear programming model. Int. J. Electr. Power Energy Syst. 2018, 97, 240–249. [Google Scholar] [CrossRef]
  14. Momoh, J.A.; Adapa, R.; El-Hawary, M.E. A review of selected optimal power flow literature to 1993. I. Nonlinear and quadratic programming approaches. IEEE Trans. Power Syst. 1999, 14, 96–104. [Google Scholar] [CrossRef]
  15. Momoh, J.A.; El-Hawary, M.E.; Adapa, R. A review of selected optimal power flow literature to 1993. II. Newton linear programming and interior point methods. IEEE Trans. Power Syst. 1999, 14, 105–111. [Google Scholar] [CrossRef]
  16. Ghasemi, M.; Ghavidel, S.; Akbari, E.; Vahed, A.A. Solving non-linear, non-smooth and non-convex optimal power flow problems using chaotic invasive weed optimization algorithms based on chaos. Energy 2014, 73, 340–353. [Google Scholar] [CrossRef]
  17. Ghasemi, M.; Ghavidel, S.; Aghaei, J.; Gitizadeh, M.; Falah, H. Application of chaos-based chaotic invasive weed optimization techniques for environmental OPF problems in the power system. Chaos Solitons Fractals 2014, 69, 271–284. [Google Scholar] [CrossRef]
  18. Boussaïd, I.; Lepagnot, J.; Siarry, P. A survey on optimization metaheuristics. Inf. Sci. 2013, 237, 82–117. [Google Scholar] [CrossRef]
  19. Mohamed, A.A.; Mohamed, Y.S.; El-Gaafary, A.A.M.; Hemeida, A.M. Optimal power flow using moth swarm algorithm. Electr. Power Syst. Res. 2017, 142, 190–206. [Google Scholar] [CrossRef]
  20. Karami, A. A fuzzy anomaly detection system based on hybrid pso-k means algorithm in content-centric networks. Neurocomputing 2015, 149, 1253–1269. [Google Scholar] [CrossRef] [Green Version]
  21. Dos Santos Coelho, L.; Mariani, V.C.; Leite, J.V. Solution of Jiles-Atherton vector hysteresis parameters estimation by modified Differential Evolution approaches. Expert Syst. Appl. 2012, 39, 2021–2025. [Google Scholar] [CrossRef]
  22. Mirjalili, S. Moth-flame optimization algorithm: A novel nature-inspired heuristic paradigm. Knowl. Based Syst. 2015, 89, 228–249. [Google Scholar] [CrossRef]
  23. Yang, X.S. Flower Pollination Algorithm for Global Optimization. In Unconventional Computation and Natural Computation; Springer: Berlin, Germany, 2012; pp. 240–249. [Google Scholar]
  24. Kumar, A.R.; Premalatha, L. Optimal power flow for a deregulated power system using adaptive real coded biogeography-based optimization. Int. J. Electr. Power Energy Syst. 2015, 73, 393–399. [Google Scholar] [CrossRef]
  25. El-Fergany, A.A.; Hasanien, H.M. Single and multiobjective optimal power flow using grey wolf optimizer and differential evolution algorithms. Electr. Power Compon. Syst. 2015, 43, 1548–1559. [Google Scholar] [CrossRef]
  26. Ghasemi, M.; Ghavidel, S.; Ghanbarian, M.M.; Gitizadeh, M. Multiobjective optimal electric power planning in the power system using Gaussian bare-bones imperialist competitive algorithm. Inf. Sci. 2015, 294, 286–304. [Google Scholar] [CrossRef]
  27. Adaryani, M.R.; Karami, A. Artificial bee colony algorithm for solving multiobjective optimal power flow problem. Int. J. Electr. Power Energy Syst. 2013, 53, 219–230. [Google Scholar] [CrossRef]
  28. Niknam, T.; Narimani, M.R.; Azizipanah, A.R. A new hybrid algorithm for optimal power flow considering prohibited zones and valve point effect. Energy Convers. Manag. 2012, 58, 197–206. [Google Scholar] [CrossRef]
  29. Ghasemi, M.; Ghavidel, S.; Gitizadeh, M.; Akbari, E. An improved teaching-learning-based optimization algorithm using Lévy mutation strategy for non-smooth optimal power flow. Int. J. Electr. Power Energy Syst. 2015, 65, 375–384. [Google Scholar] [CrossRef]
  30. Bouchekara, H.; Abido, M.A.; Boucherma, M. Optimal power flow using teaching-learning-based optimization technique. Electr. Power Syst. Res. 2014, 114, 49–59. [Google Scholar] [CrossRef]
  31. Narimani, M.R.; Azizipanah, A.R.; Zoghdar, M.S.B.; Gholami, K. A novel approach to multiobjective optimal power flow by a new hybrid optimization algorithm considering generator constraints and multi-fuel type. Energy 2013, 49, 119–136. [Google Scholar] [CrossRef]
  32. Roy, R.; Jadhav, H.T. Optimal power flow solution of power system incorporating stochastic wind power using Gbest guided artificial bee colony algorithm. Int. J. Electr. Power Energy Syst. 2015, 64, 562–578. [Google Scholar] [CrossRef]
  33. Abaci, K.; Yamacli, V. Differential search algorithm for solving multiobjective optimal power flow problem. Int. J. Electr. Power Energy Syst. 2016, 79, 1–10. [Google Scholar] [CrossRef]
  34. Reddy, S.S.; Bijwe, P.R.; Abhyankar, A.R. Faster evolutionary algorithm based optimal power flow using incremental variables. Int. J. Electr. Power Energy Syst. 2014, 54, 198–210. [Google Scholar] [CrossRef]
  35. Singh, R.P.; Mukherjee, V.; Ghoshal, S.P. Particle swarm optimization with an aging leader and challenger’s algorithm for the solution of optimal power flow problem. Appl. Soft Comput. 2016, 40, 161–177. [Google Scholar] [CrossRef]
  36. Coello Coello, C.A. A Comprehensive Survey of Evolutionary-Based Multiobjective Optimization Techniques. Knowl. Inf. Syst. 1999, 1, 269–308. [Google Scholar] [CrossRef] [Green Version]
  37. Khabbazi, A.; Atashpaz, G.E.; Lucas, C. Imperialist competitive algorithm for minimum bit error rate beamforming. Int. J. Bio-Inspired Comput. 2009, 1, 125–133. [Google Scholar] [CrossRef]
  38. Kaveh, A. Imperialist Competitive Algorithm. In Advances in Metaheuristic Algorithms for Optimal Design of Structures; Springer: Cham, Switzerland, 2017. [Google Scholar]
  39. Ardalan, A.; Karimi, S.; Poursabzi, O.; Naderi, B. A novel imperialist competitive algorithm for generalized traveling salesman problems. Appl. Soft Comput. 2015, 26, 546–555. [Google Scholar] [CrossRef]
  40. Mirjalili, S.; Mirjalili, S.M.; Lewis, A. Grey wolf optimizer. Adv. Eng. Softw. 2014, 69, 46–61. [Google Scholar] [CrossRef]
  41. Zhang, X.; Miao, Q.; Liu, Z.; He, Z. An adaptive stochastic resonance method based on grey wolf optimizer algorithm and its application to machinery fault diagnosis. ISA Trans. 2017, 71, 206–214. [Google Scholar] [CrossRef] [PubMed]
  42. Hooshmand, R.A.; Morshed, M.J.; Parastegari, M. Congestion management by determining optimal location of series FACTS devices using hybrid bacterial foraging and Nelder-Mead algorithm. Appl. Soft Comput. 2015, 28, 57–68. [Google Scholar] [CrossRef]
  43. Zimmerman, R.D.; Murillo-Sánchez, C.E. Matpower. Available online: http://www.pserc.cornell.edu/matpower (accessed on 18 June 2018).
  44. Shi, L.; Wang, C.; Yao, L.; Ni, Y.; Bazargan, M. Optimal power flow solution incorporating wind power. IEEE Syst. J. 2012, 6, 233–241. [Google Scholar] [CrossRef]
  45. Atashpaz-Gargari, E. Available online: https://www.mathworks.com/matlabcentral/fileexchange/22046-imperialist-competitive-algorithm-ica (accessed on 18 June 2018).
  46. Mirjalili, S. Available online: https://www.mathworks.com/matlabcentral/fileexchange/44974-grey-wolf-optimizer-gwo (accessed on 18 June 2018).
  47. Ghasemi, M.; Ghavidel, S.; Ghanbarian, M.M.; Gharibzadeh, M.; Azizi Vahed, A. Multiobjective optimal power flow considering the cost, emission, voltage deviation and power losses using multiobjective modified imperialist competitive algorithm. Energy 2014, 78, 276–289. [Google Scholar] [CrossRef]
  48. Electrical and Computer Engineering Department. Available online: http://motor.ece.iit.edu/data/ (accessed on 18 June 2018).
Figure 1. Flowchart of the proposed hybrid imperialist competitive and grey wolf algorithm (HIC-GWA).
Energies 11 02891 g001
Figure 2. Total cost convergence curve during iterations for case 1.
Energies 11 02891 g002
Figure 3. Total cost convergence curve for case 10.
Energies 11 02891 g003
Figure 4. Total cost components convergence curves for case 10.
Energies 11 02891 g004
Figure 5. Total cost convergence curve for case 12.
Energies 11 02891 g005
Table 1. Power system’s parameters.
CharacteristicsIEEE 30IEEE 118
Buses30[47]118[48]
Branches41 186
Load voltage24[0.95, 1.05] [0.94, 1.06]
Control variables ( N v a r ) 24130
Table 2. Setting of the proposed HIC-GWA approach.
ICA ParametersGWA Parameters
ξ N C o u n t r y β N i m p N w
30 bus118 bus30 bus118 bus30 bus118 bus
1.02151000.90520510
Table 3. Recently published approaches to solve OPF problems.
AcronymReferenceSimple ObjectiveMultiobjectiveFuel CostEmission P loss VD L Index
MSA[19]
MPSO[20]
MDE[21]
MFO[22]
FPA[23]
ARCBBO[24]
RCBBO[24]
GWO[25]
DE[25]
MGBICA[26]
ABC[27]
HSFLA-SA[28]
LTLBO[29]
TLBO[30]
HMPSO-SFLA[31]
PSO[31]
GABC[32]
DSA[33]
EEA[34]
EGA[34]
ALC-PSO[35]
Table 4. Optimal solution of IEEE 30 bus power system for case studies 1 to 5.
SolutionsCase 1Case 2Case 3Case4Case 5
Fuel cost ($/h)798.20645.85902.25959.541000.30
Emission (t/h)0.370.280.450.200.21
P loss (MW)8.866.5911.182.672.61
VD (p.u.)1.151.250.961.681.41
L index0.130.130.170.130.12
Table 5. Comparison of HIC-GWA with the literature for case study 1.
AlgorithmFuel Cost ($/h)Emission (t/h) P loss   ( MW ) VD (p.u.)L Index
MSA800.510.379.030.900.14
MPSO800.520.379.040.900.14
MDE800.840.36808365.000.780.14
MFO800.690.379.150.760.14
FPA802.800.369.540.370.15
ARCBO800.520.379.030.890.14
HSFLA-SA801.79
HIC-GWA798.200.378.861.150.13
Table 6. Comparison of HIC-GWA with the literature for case study 2.
AlgorithmFuel Cost ($/h)Emission (t/h) P loss   ( MW ) VD (p.u.)L Index
MSA646.840.286.800.840.14
MPSO646.730.286.800.770.14
MDE650.280.286.980.580.14
MFO649.270.287.290.470.14
FPA651.380.287.240.310.15
LTLBO647.430.286.930.89
TLBO647.92 7.111.420.12
HIC-GWA645.850.286.591.250.13
Table 7. Comparison of HIC-GWA with the literature for case study 3.
AlgorithmFuel Cost ($/h)Emission (t/h) P loss   ( MW ) VD (p.u.)L Index
MSA930.740.4313.140.450.16
MPSO952.300.307.300.720.14
MDE930.940.4312.730.450.16
MFO930.720.4413.180.470.16
FPA931.750.4312.110.470.15
HIC-GWA902.250.4511.180.960.17
Table 8. Comparison of HIC-GWA with the literature for case study 4.
AlgorithmFuel Cost ($/h)Emission (t/h) P loss   ( MW ) VD (p.u.)L Index
MSA944.500.20483.240.870.14
MPSO879.950.23257.050.570.14
MDE927.810.20934.850.400.15
MFO945.460.20493.430.710.14
FPA948.950.20524.490.430.14
ARCBO945.160.20483.260.860.14
MGBICA942.840.2048
GBICA944.650.2049
ABC944.440.20483.250.850.14
DSA944.410.25833.24 0.13
HMPSO-SFLA 0.2052
HIC-GWA959.540.20092.671.680.13
Table 9. Comparison of HIC-GWA solutions with the literature for case study 5.
AlgorithmFuel Cost ($/h)Emission (t/h) P loss   ( MW ) VD (p.u.)L Index
MSA967.660.20733.100.890.14
MPSO967.650.20733.100.960.14
MDE967.650.20733.160.770.14
MFO967.680.20733.110.920.14
FPA967.110.20766.570.390.14
ARCBO967.660.20733.100.890.14
GWO968.38 3.41
DE968.23 3.38
ABC967.680.20733.110.900.14
DSA967.650.20833.09 0.13
EEA952.38 3.28
EGA967.93 3.24
ALC-PSO967.77 3.17
HIC-GWA1000.300.20802.611.410.12
Table 10. Optimal solution of IEEE 30 bus power system for case studies 6 to 10.
SolutionsCase 6Case 7Case 8Case 9Case 10
Fuel cost ($/h)856.99802.45797.80802.00817.59
Emission (t/h)0.230.360.370.360.27
P loss   (MW)4.049.958.759.675.29
VD (p.u.)1.780.101.981.970.23
L index0.120.130.110.110.15
Table 11. HIC-GWA solutions compared with the literature for case 6.
SolutionsMSAMDEMPSOFPAMFOHIC-GWA
Fuel cost ($/h)859.19868.71859.58855.27858.58856.99
Emission (t/h)0.230.230.230.230.230.23
P loss   (MW)4.544.394.544.804.584.04
VD (p.u.)0.930.880.951.010.901.78
L index0.140.140.140.140.140.12
Total cost1040.811044.051041.221055.721041.671018.45
Table 12. Comparison of the proposed approach with different approaches for this case.
SolutionsMSAMDEMPSOFPAMFOHIC-GWA
Fuel cost ($/h)803.31803.21803.98803.66803.79802.45
Emission (t/h)0.360.360.360.370.360.36
P loss   (MW)9.729.609.929.939.879.95
VD (p.u.)0.110.130.120.140.110.10
L index0.150.150.150.150.150.13
Total cost814.15815.86816.00817.32814.35812.05
Table 13. Comparison of the proposed approach with different approaches for case 8.
SolutionsMSAMDEMPSOFPAMFOHIC-GWA
Fuel cost ($/h)801.22802.10801.70801.15801.67797.80
Emission (t/h)0.360.350.360.370.340.37
P loss (MW)8.989.069.209.328.568.75
VD (p.u.)0.930.890.830.880.841.98
L index0.140.140.140.140.140.11
Total cost814.94815.84815.44814.91815.43808.38
Table 14. Comparison of the proposed approach with different approaches for case 9.
SolutionsMSAMDEMPSOFPAMFOHIC-GWA
Fuel cost ($/h)804.48806.67807.65805.54804.56802.00
Emission (t/h)0.360.370.360.360.360.36
P loss (MW)9.9510.7210.7610.189.959.67
VD (p.u.)0.920.570.430.450.911.97
L index0.140.140.140.140.140.11
Total cost832.32834.63835.75833.84832.43823.06
Table 15. Comparison of the proposed approach with different approaches for case 10 of IEEE 30.
SolutionsMSAMDEMPSOFPAMFOHIC-GWA
Fuel cost ($/h)830.6829.1833.7835.4830.9817.6
Emission (t/h)0.30.30.30.20.30.3
P loss (MW)5.66.16.55.55.65.3
VD (p.u.)0.30.30.20.50.30.2
L index1.50.10.10.10.10.1
Total cost965.3973.6986.0971.9965.8944.0
Table 16. Comparison of HIC-GWA results with the literature for case study 11.
SolutionsMSAMDEMPSOFPAMFOHIC-GWA
Fuel cost ($/h)129640.72130444.57132039.21129688.72129708.08129633.70
P loss (MW)73.2671.64112.8574.3274.7176.80
VD (p.u.)3.071.311.152.542.383.13
L index0.060.070.070.060.060.06
Table 17. Optimal solution of IEEE 118 bus power system for case study 12.
Fuel cost ($/h)112,545.51
Wind cost ($/h)5340.42
PV cost ($/h)4211.38
P   loss (MW)76.64
VD (p.u.)3.13
L index0.06
Table 18. Sensitivity analysis for IEEE 30 bus and 118 bus power systems.
Parameters30 Bus Power SystemParameters118 Bus Power System
Cost ($/h)Deviation (%)Cost ($/h)Deviation (%)
Normal Solution798.200.0Normal Solution129,633.700.0
N C o u n t r y = 15 + 5797.38+0.1017 N C o u n t r y = 200 + 30129,631.93+0.00137
N C o u n t r y = 15 − 5799.07−0.1102 N C o u n t r y = 200 − 30129,636.79−0.00238
N i m p = 5 + 2797.33+0.1082 N i m p w = 40 + 10129,632.44+0.00098
N i m p = 5 − 2797.00+0.1491 N i m p w = 40 − 10129,630.66+0.00235
N w = 5 + 2797.12+0.1341 N w = 10 + 3129,631.77+0.00149
N w = 5 − 2798.98−0.0984 N w = 10 − 3129,634.92−0.00094
All (up)797.06+0.1420All (up)129,630.94+0.00213
All (Down)799.08−0.1110All (Down)129,645.84−0.00936
Table 19. Comparisons of the results obtained for case 2.
AlgorithmBest Cost ($/h)Worst Cost ($/h)Average Cost ($/h)
MSA646.84648.03646.86
MPSO646.73656.23649.86
MDE650.28653.40651.26
MFO649.27650.62649.89
FPA651.38654.33652.96
LTLBO647.43647.86647.47
ABC649.09659.77654.08
GABC647.03647.12647.08
HIC-GWA645.85647.03645.87
Table 20. Case 2 simulation time.
AlgorithmTime (s)
MICA-TLA30.74
LTLBO22.78
HMPSO-SFLA19.06
MPSO16.05
MDE15.63
MSA14.91
FPA14.79
HIC-GWA14.34
MFO14.33

