Hierarchical Scheduling Scheme for AC/DC Hybrid Active Distribution Network Based on Multi-Stakeholders

Abstract
:1. Introduction
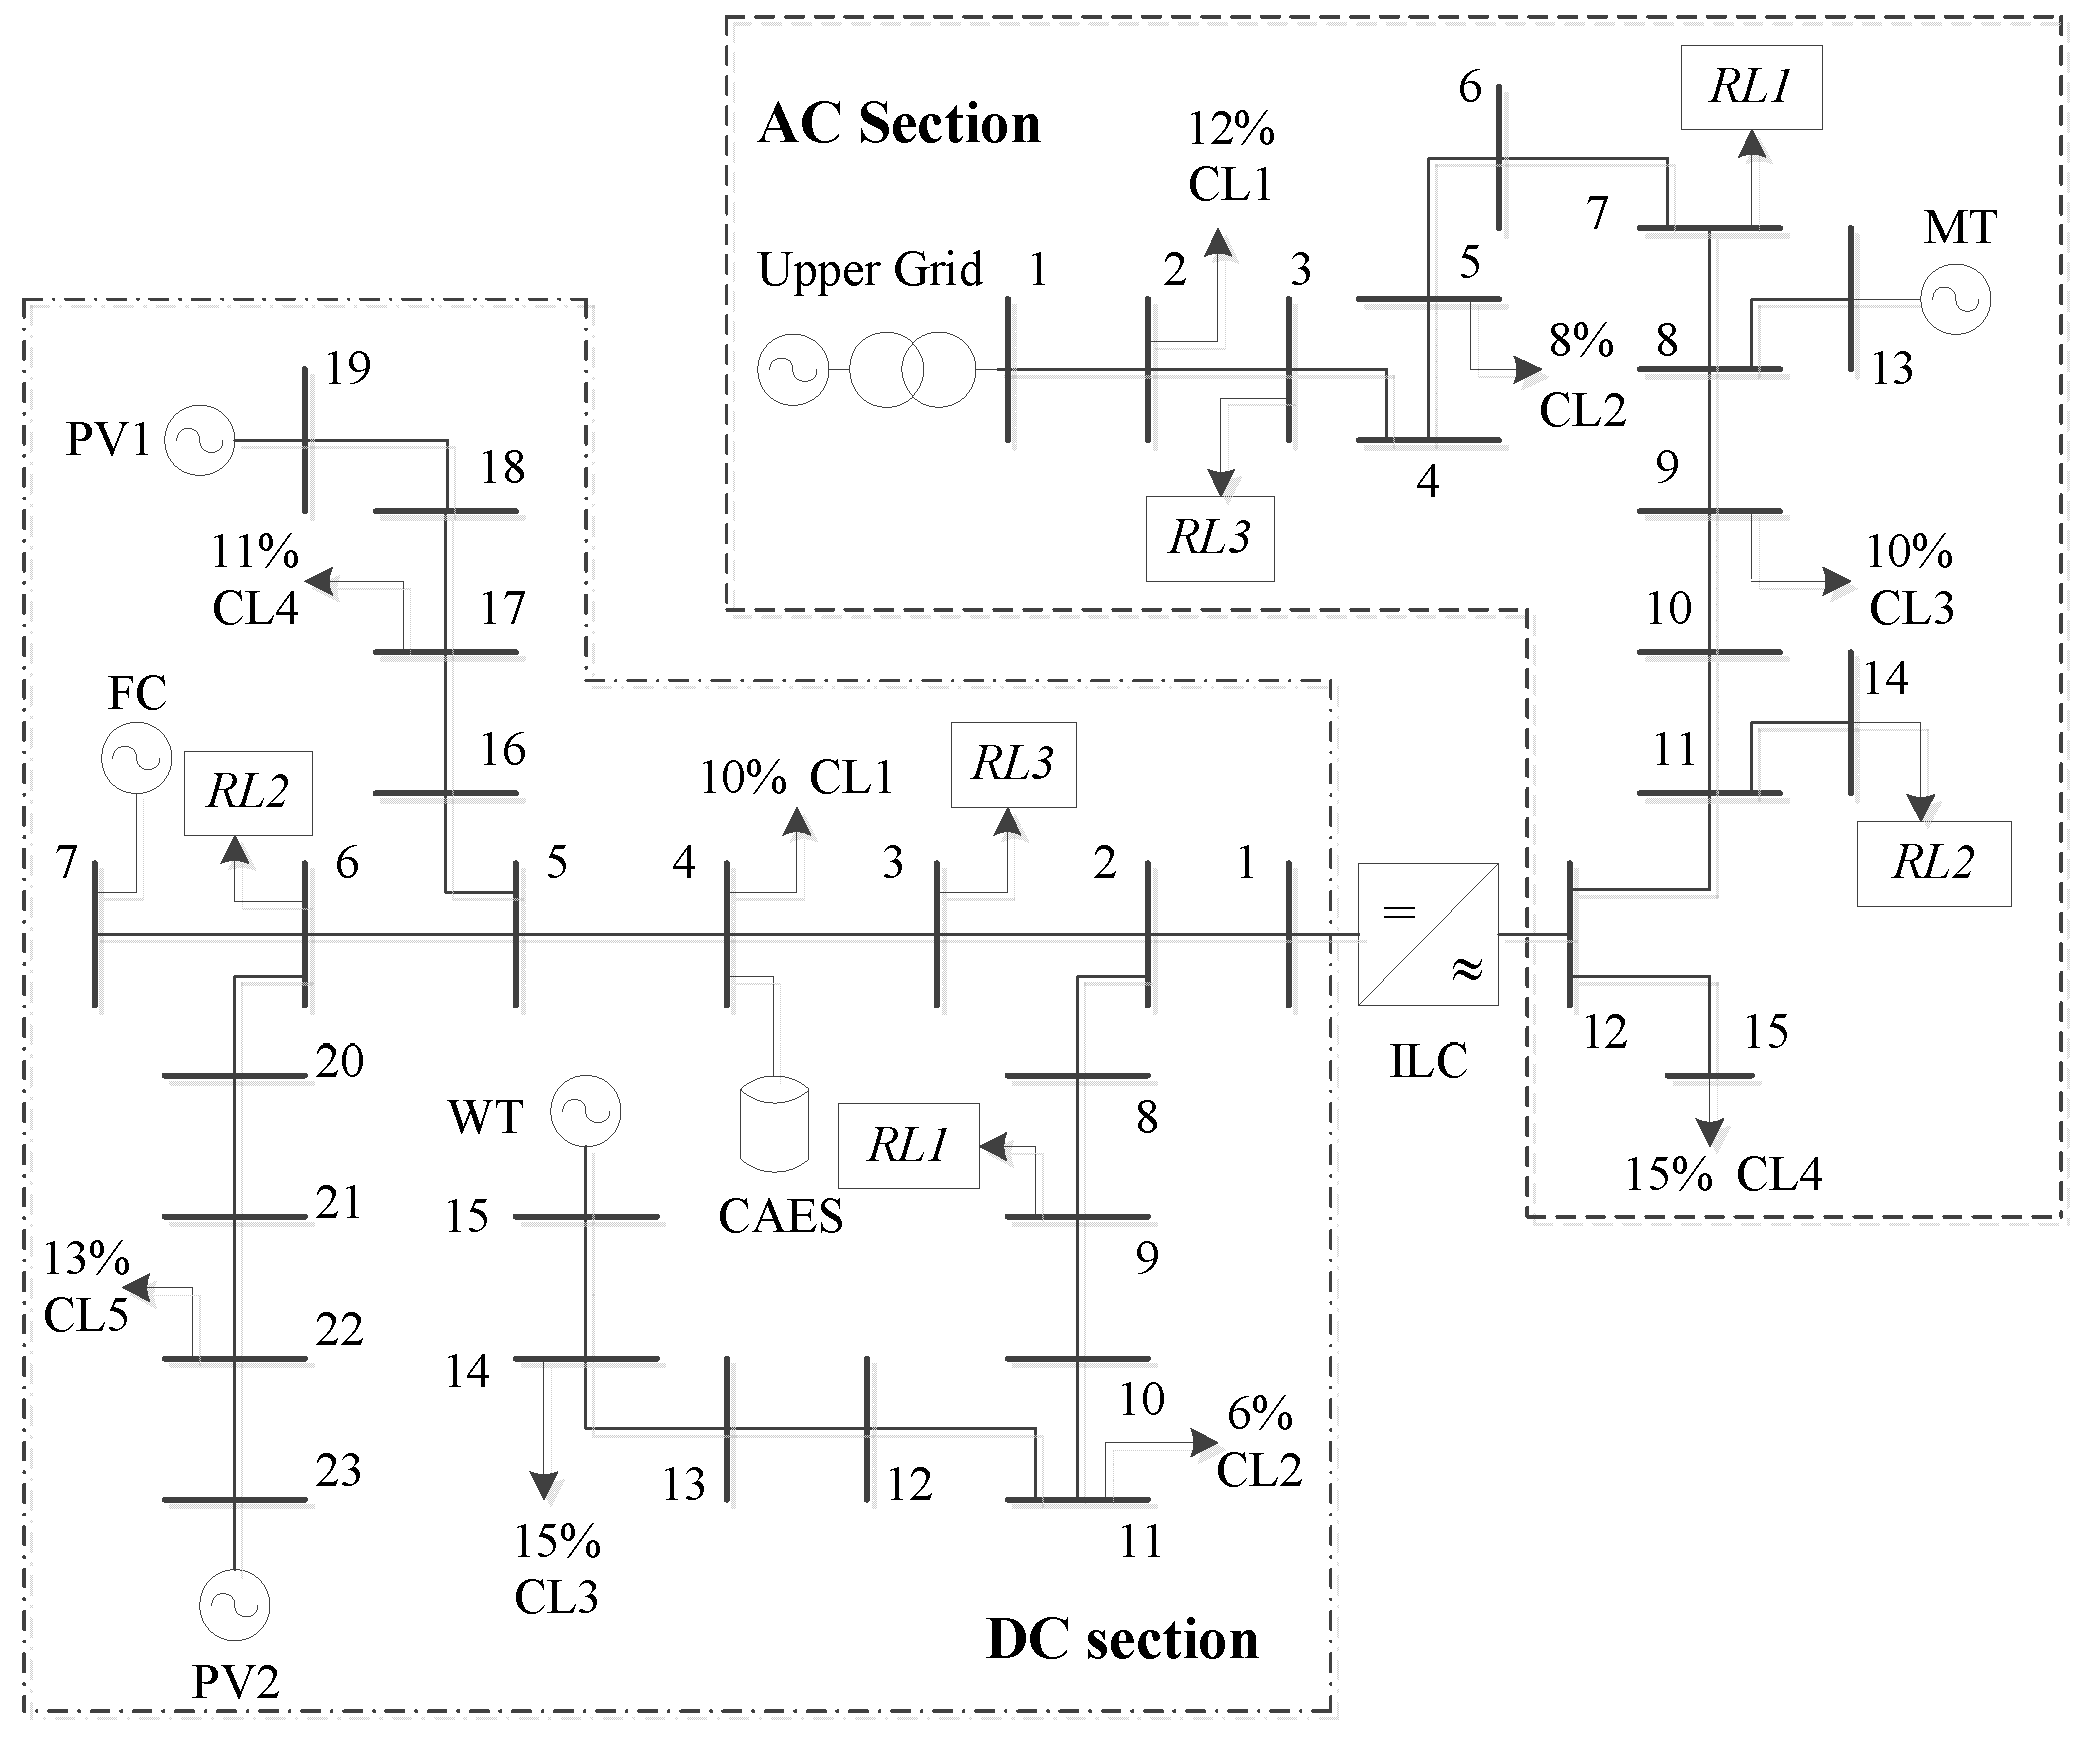
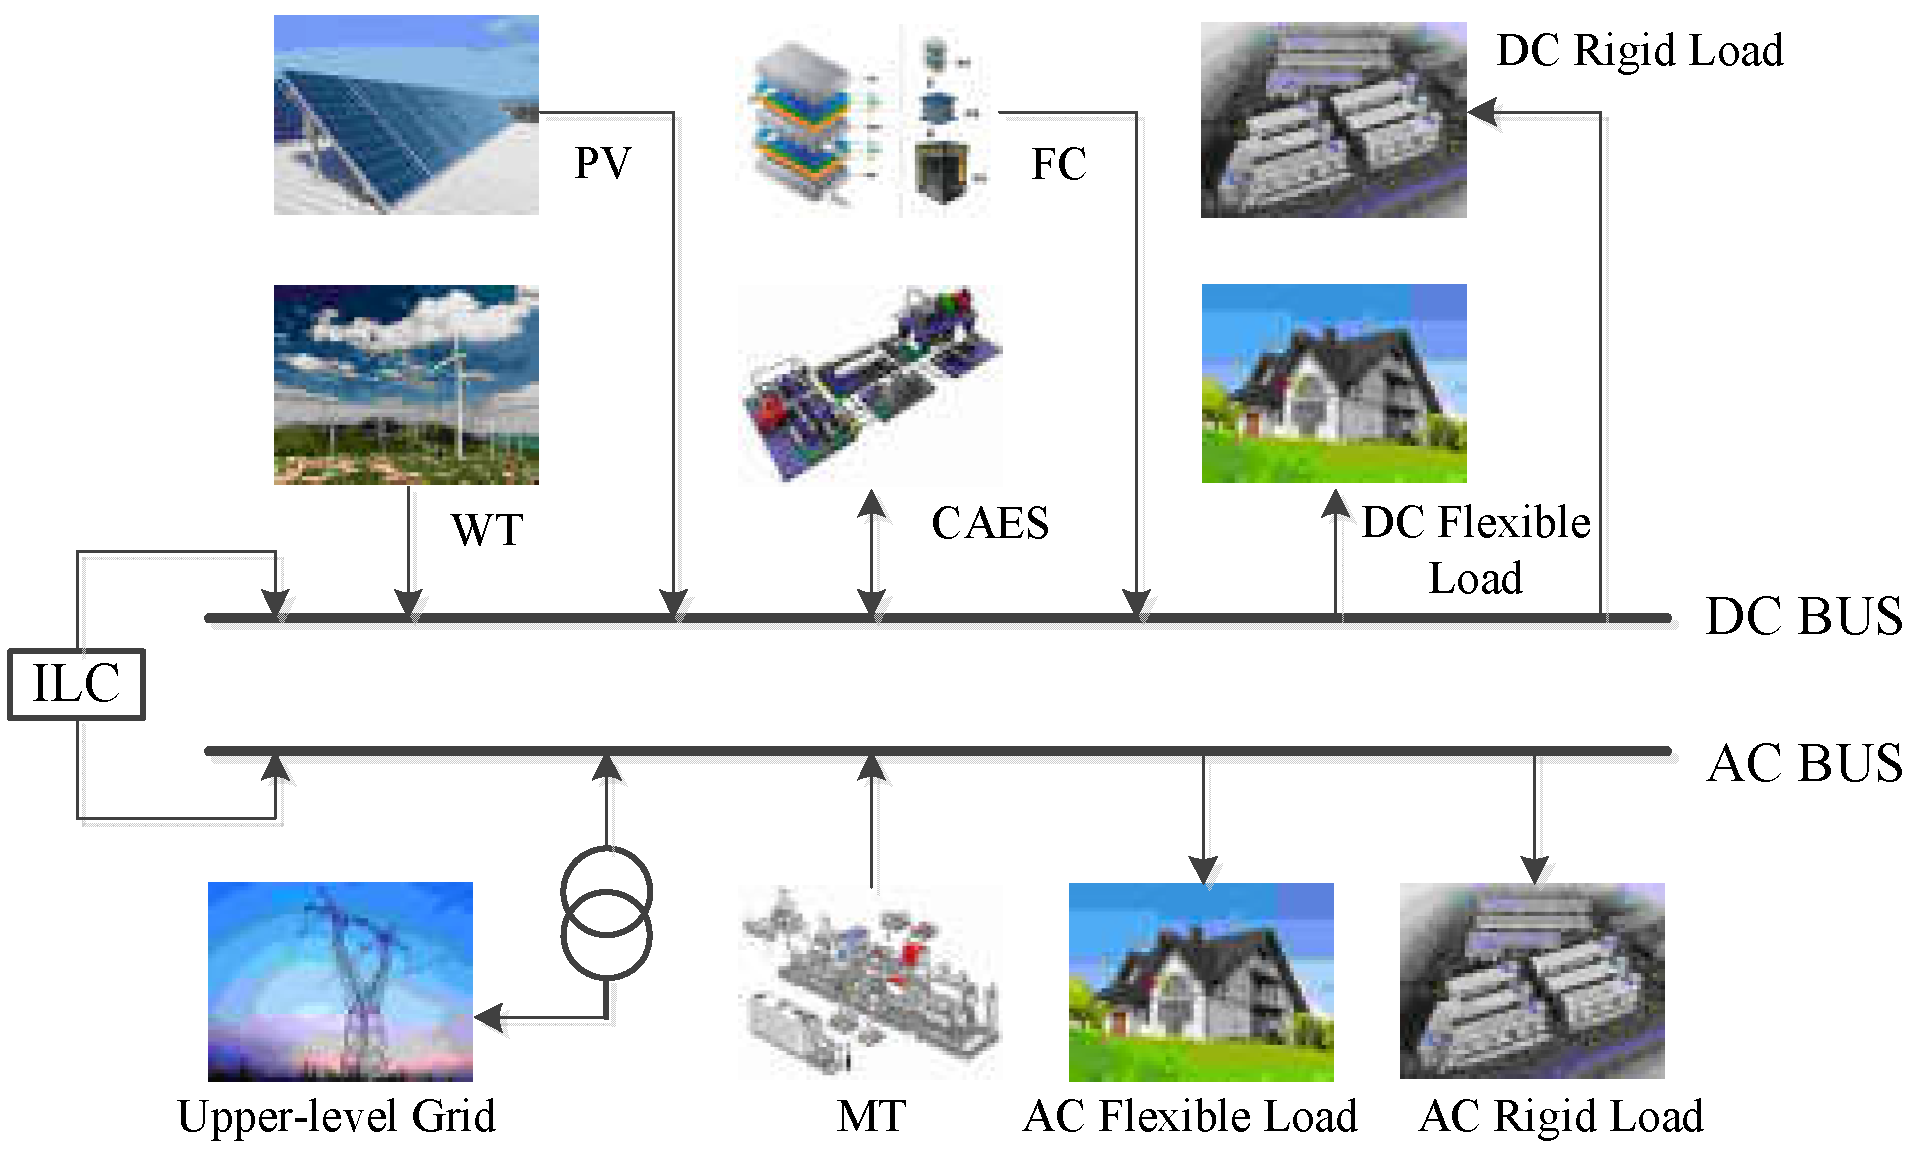
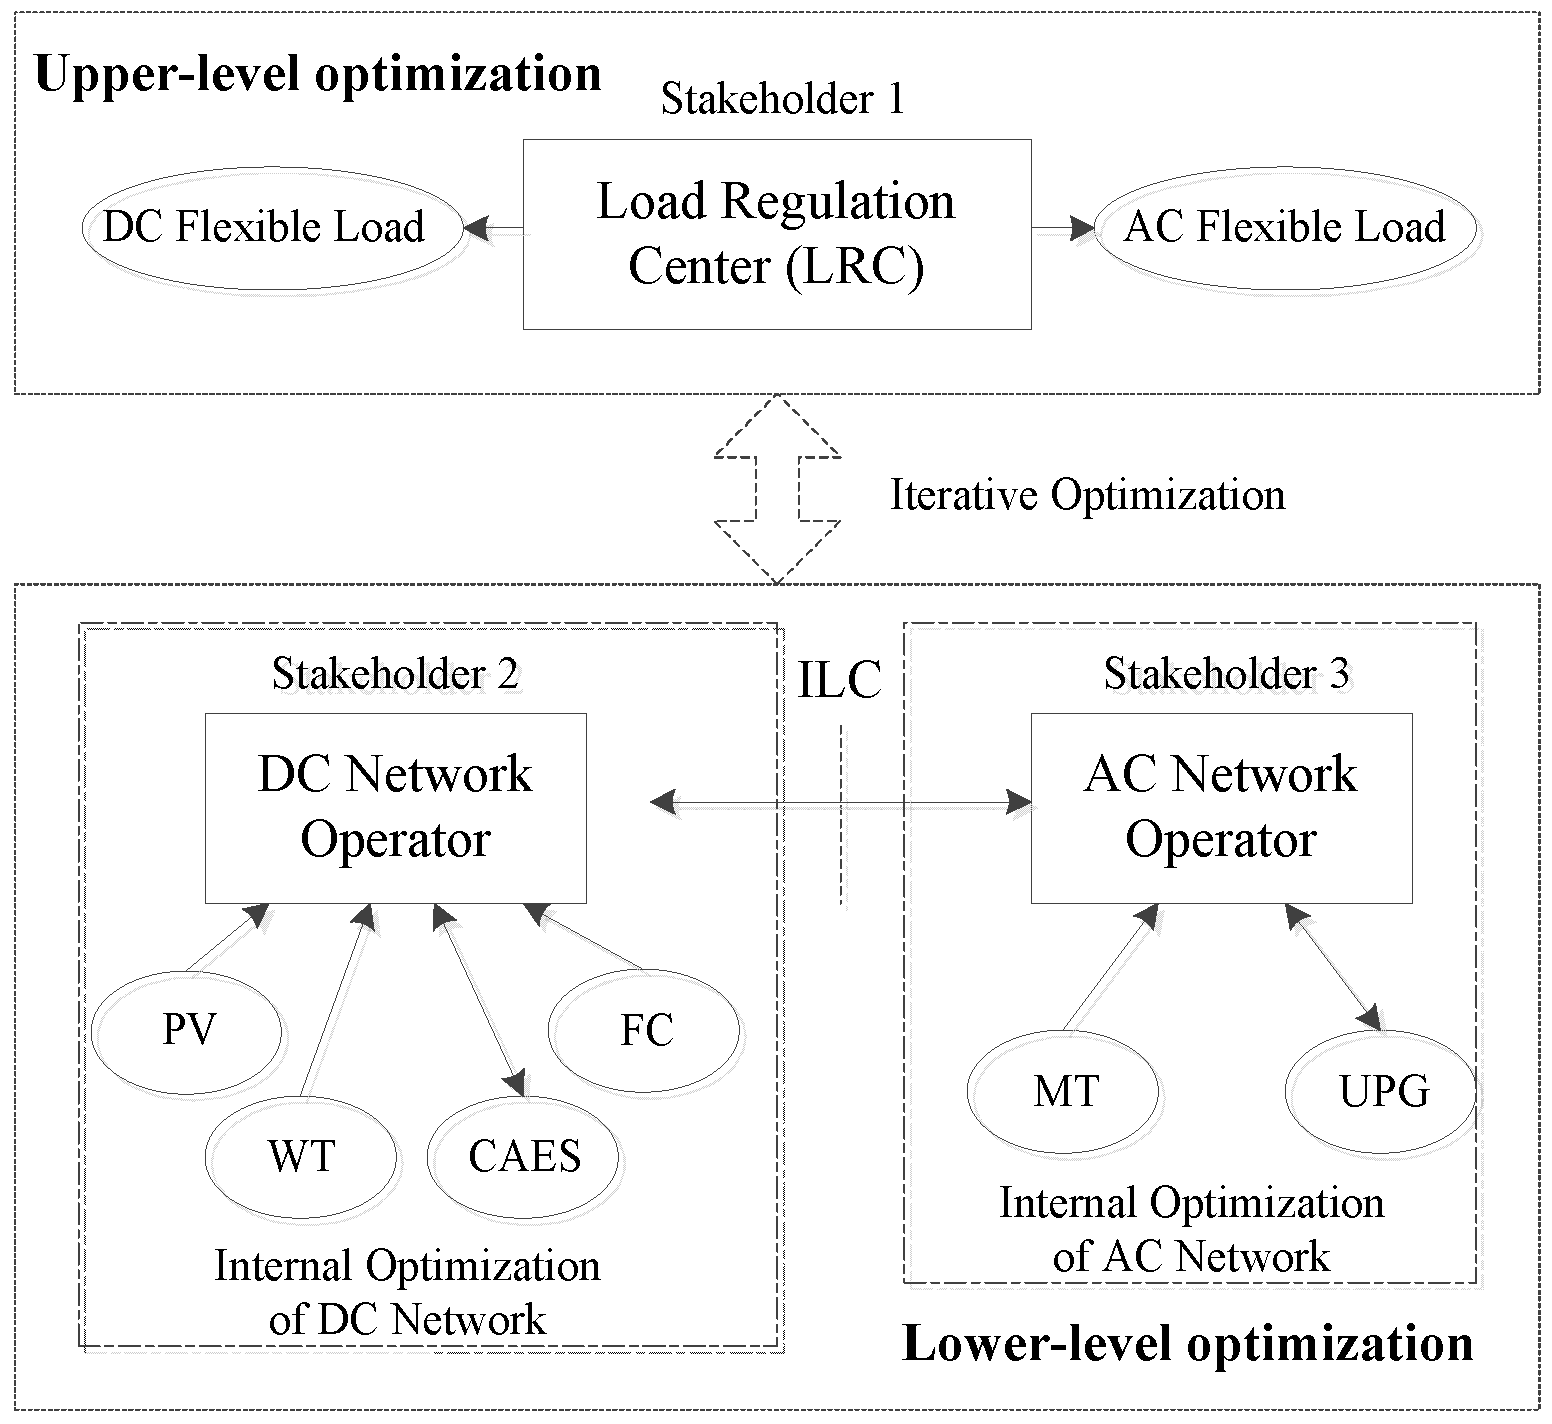
2. System Framework
3. Hierarchical Optimization Model
3.1. Optimization Model of the Upper Level
3.2. Optimization Model of the Lower Level
3.2.1. Optimization Model of the DC Section
3.2.2. Optimization Model of the AC Section
4. Model Solution
4.1. Discrete Wind-Driven Optimization Algorithm
- (1)
- Initialize the population size, set the maximum number of iterations, related parameters, and search boundaries, and define pressure functions.
- (2)
- Initialize the air mass points and assign the starting speeds and locations randomly.
- (3)
- Calculate the pressure value of the air particles in the current iteration and rearrange the population according to the pressure values.
- (4)
- Update the speeds of the air particles using Equation (24).
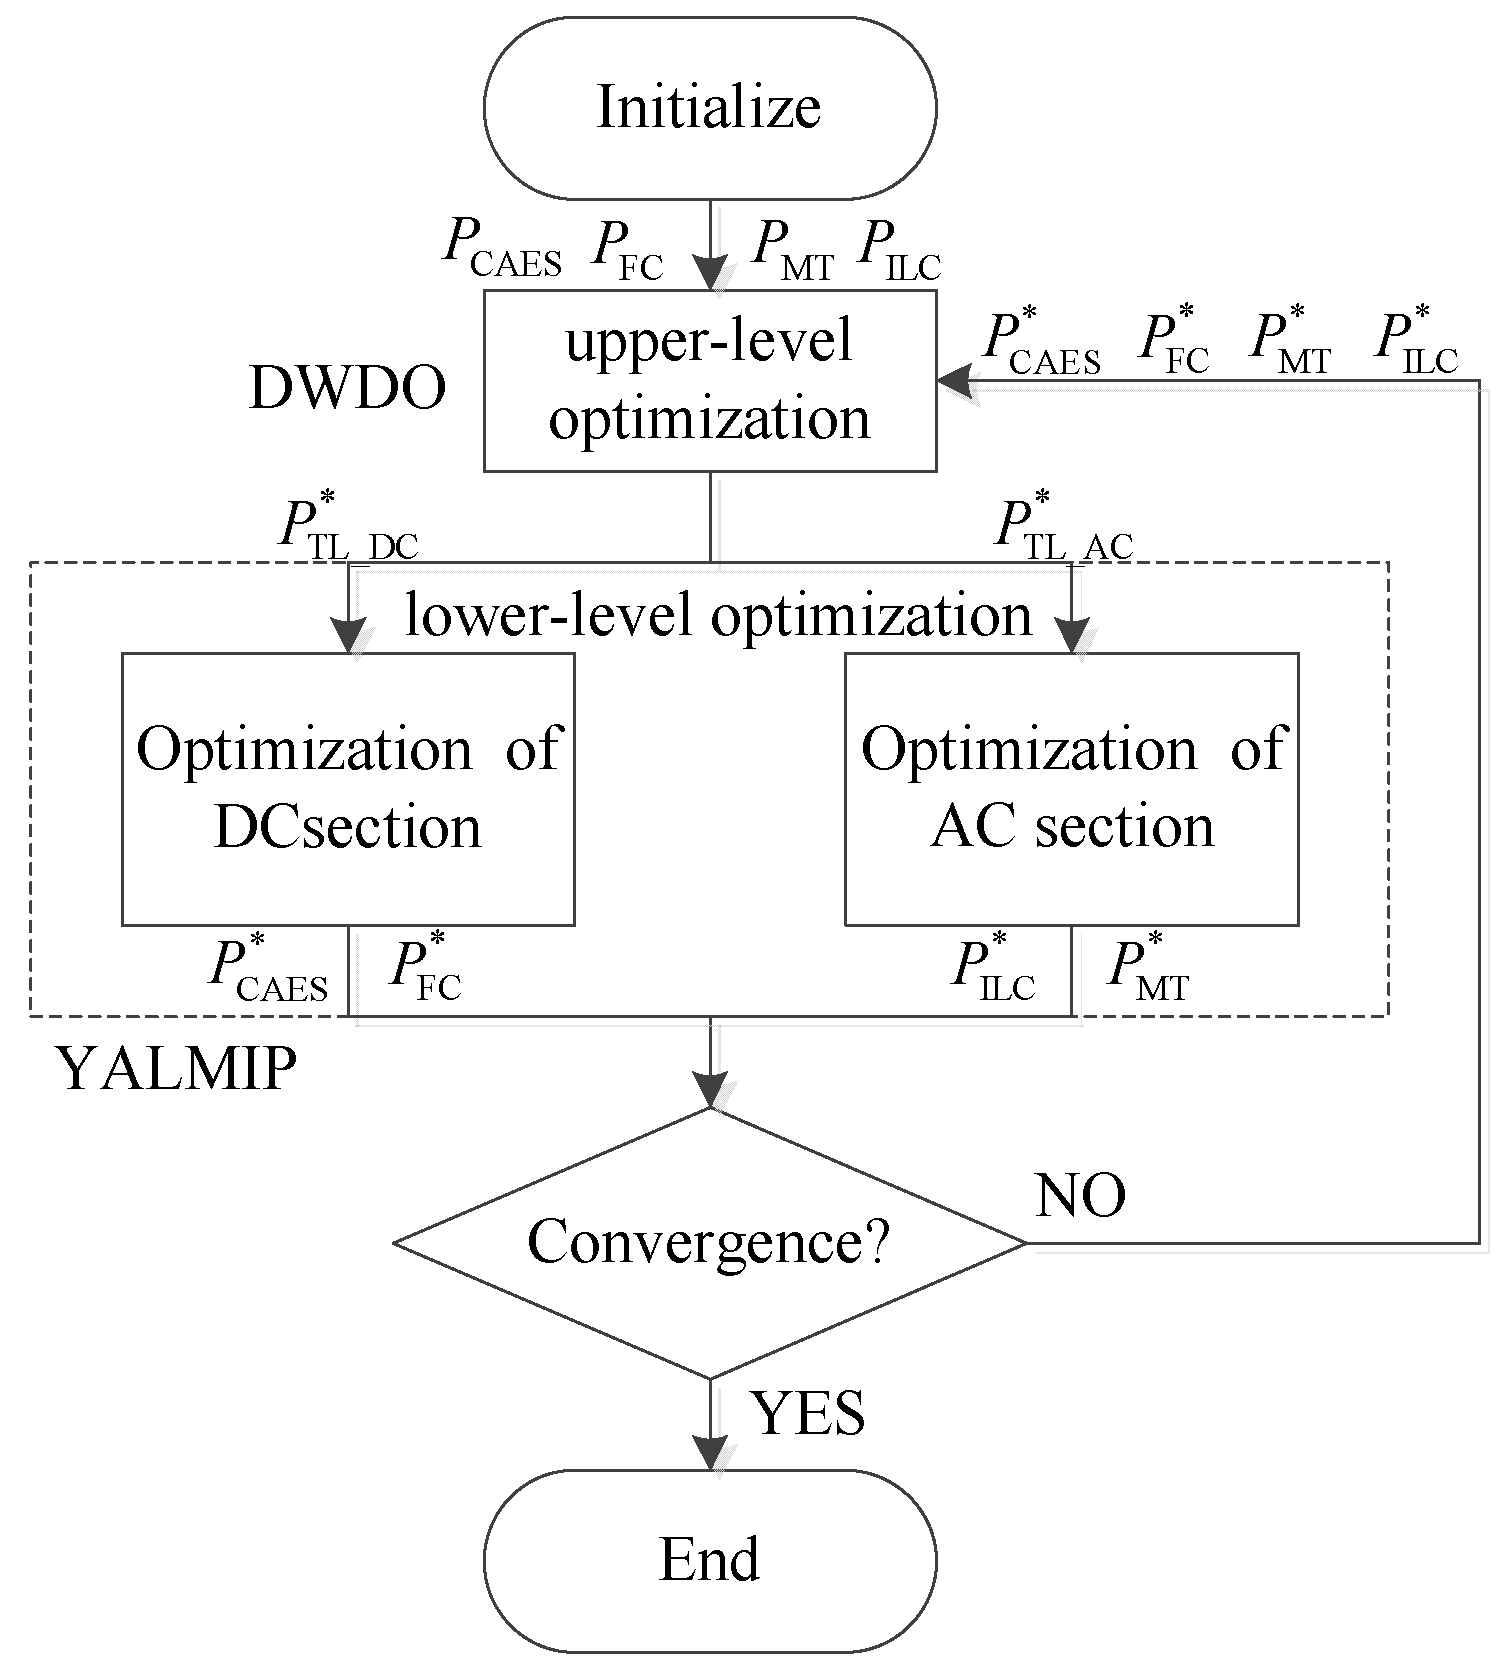
4.2. Solution Process of the Hierarchical Scheduling Model
- (1)
- Initialize the values of , , , using operation data of another similar day, and preset the planned output of the flexible loads.
- (2)
- Solve the upper-level optimization using DWDO, in order to obtain the optimized output of the flexible loads (,). In this process, we expect that PV and wind power can be absorbed as much as possible. In addition, as the AC side is connected to the upper-level power grid, its internal power adjustment ability is strong. Therefore, the optimization starts from the DC side in this step.
- (3)
- Solve the optimization of the DC and AC sections using YALMIP, in order to obtain , , , .
- (4)
- Determine whether the algorithm reaches a defined number of iterations or convergence accuracy. If the change of the system cost is lower than a certain constant between two iterations, the algorithm converges and then the result is presented. If not, go to step 2.
5. Case Study and Discussion
5.1. Economic Comparison
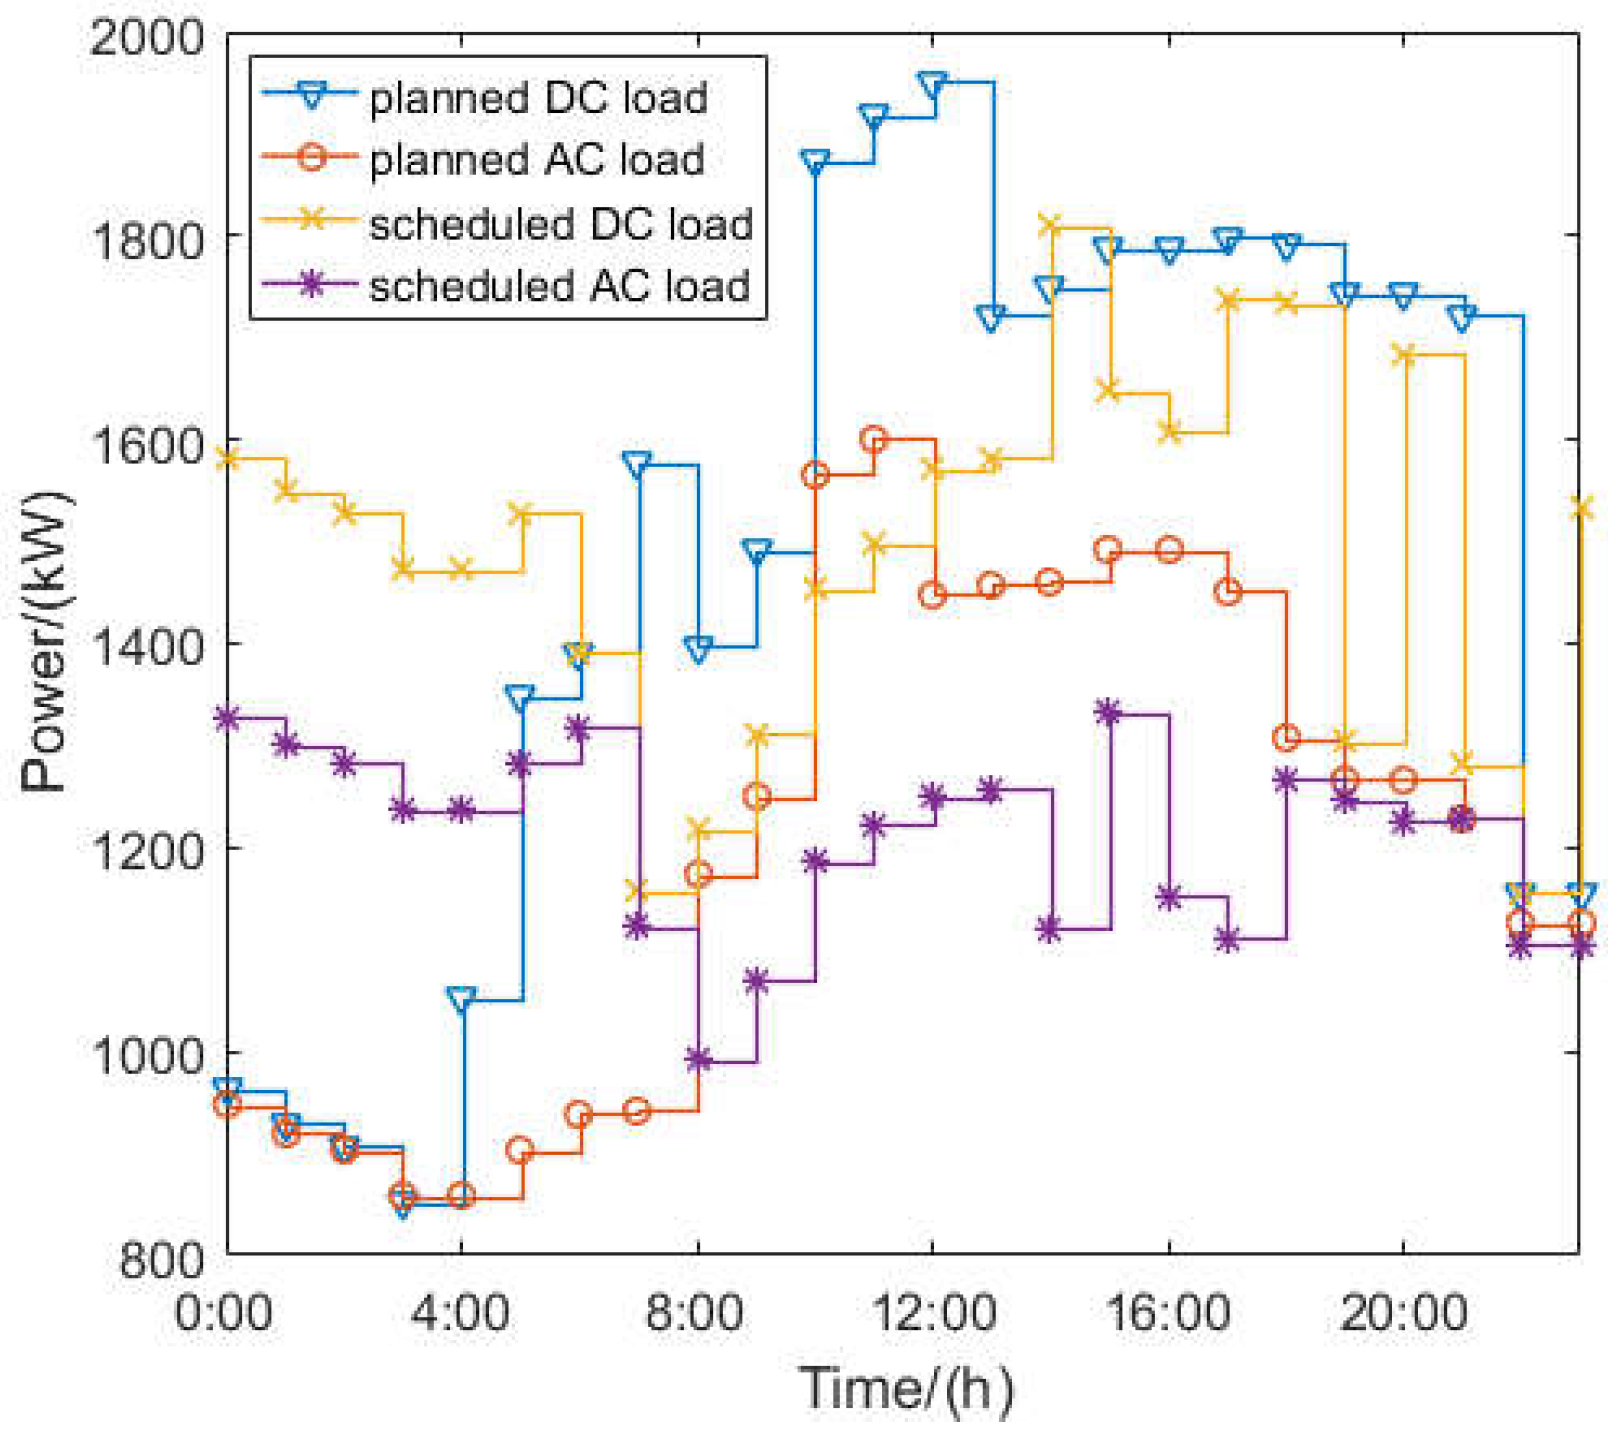
5.2. Scheduling Result of Loads
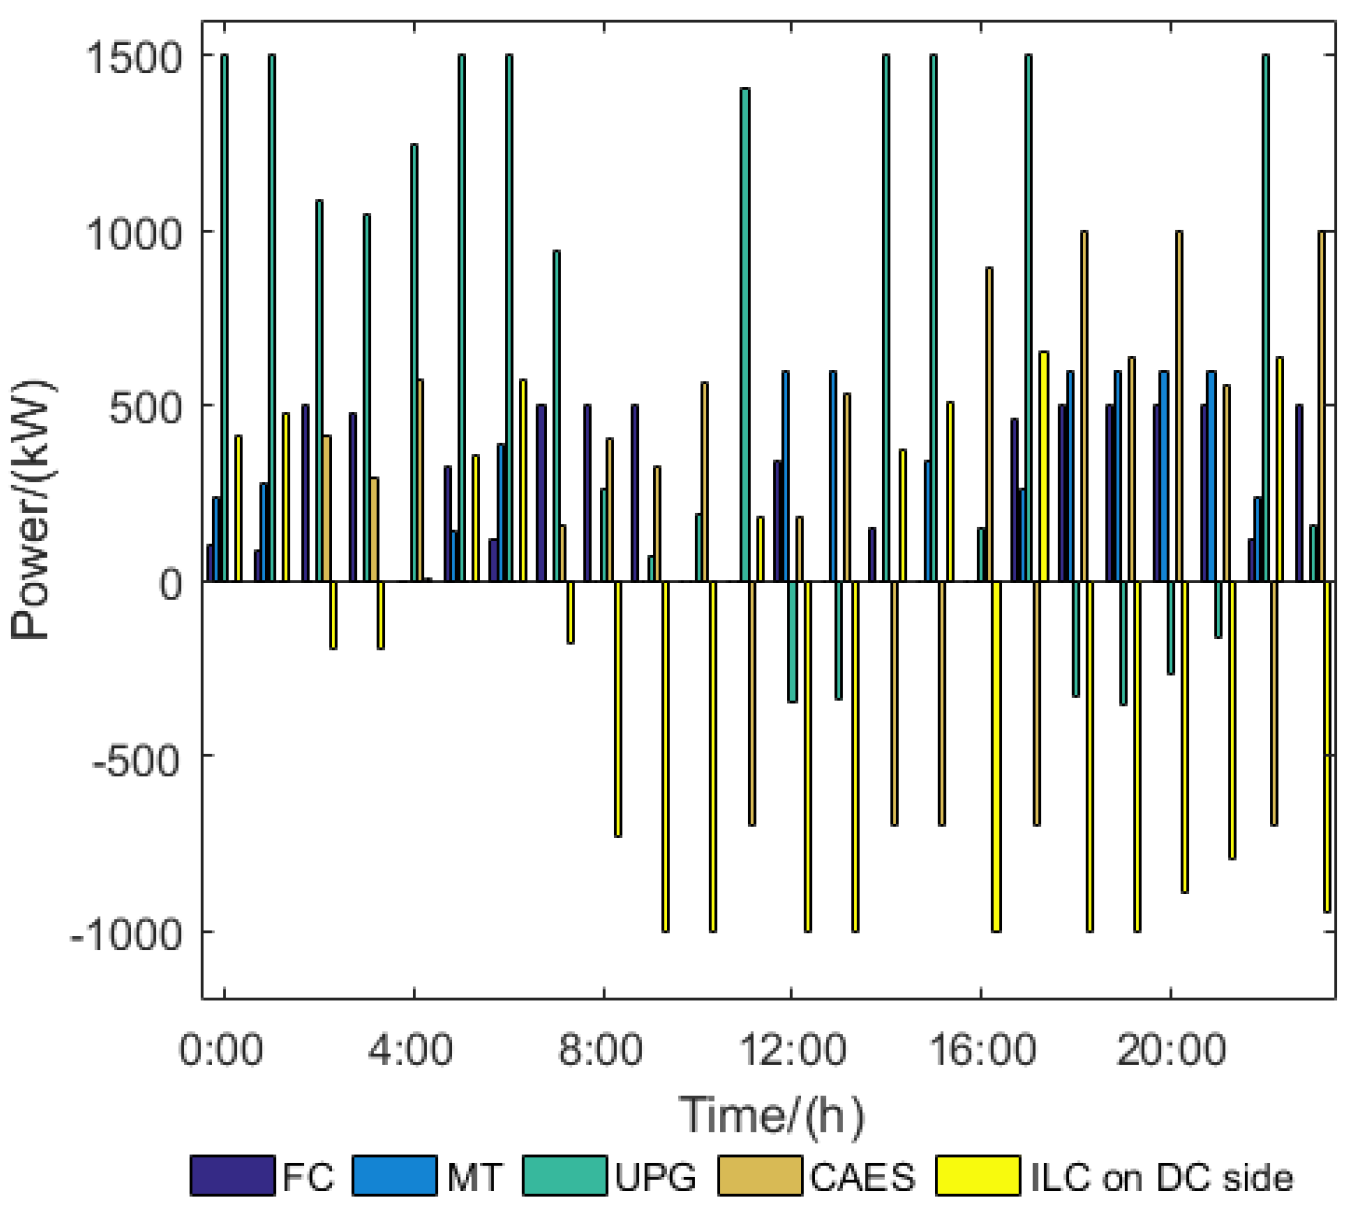
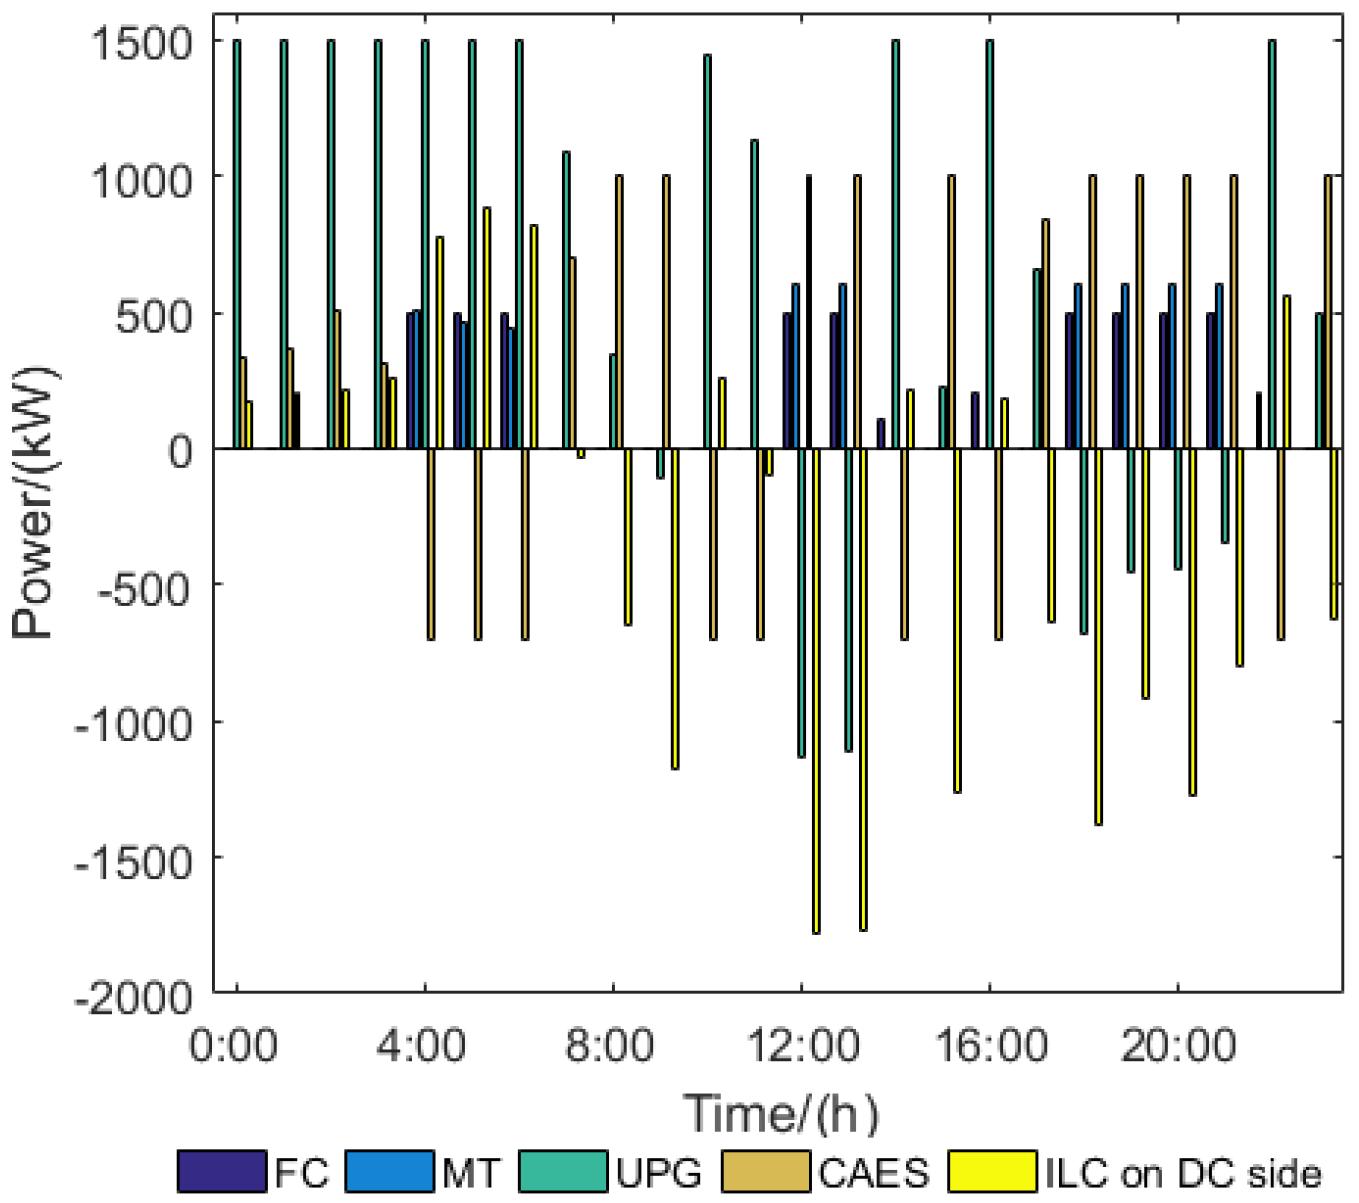
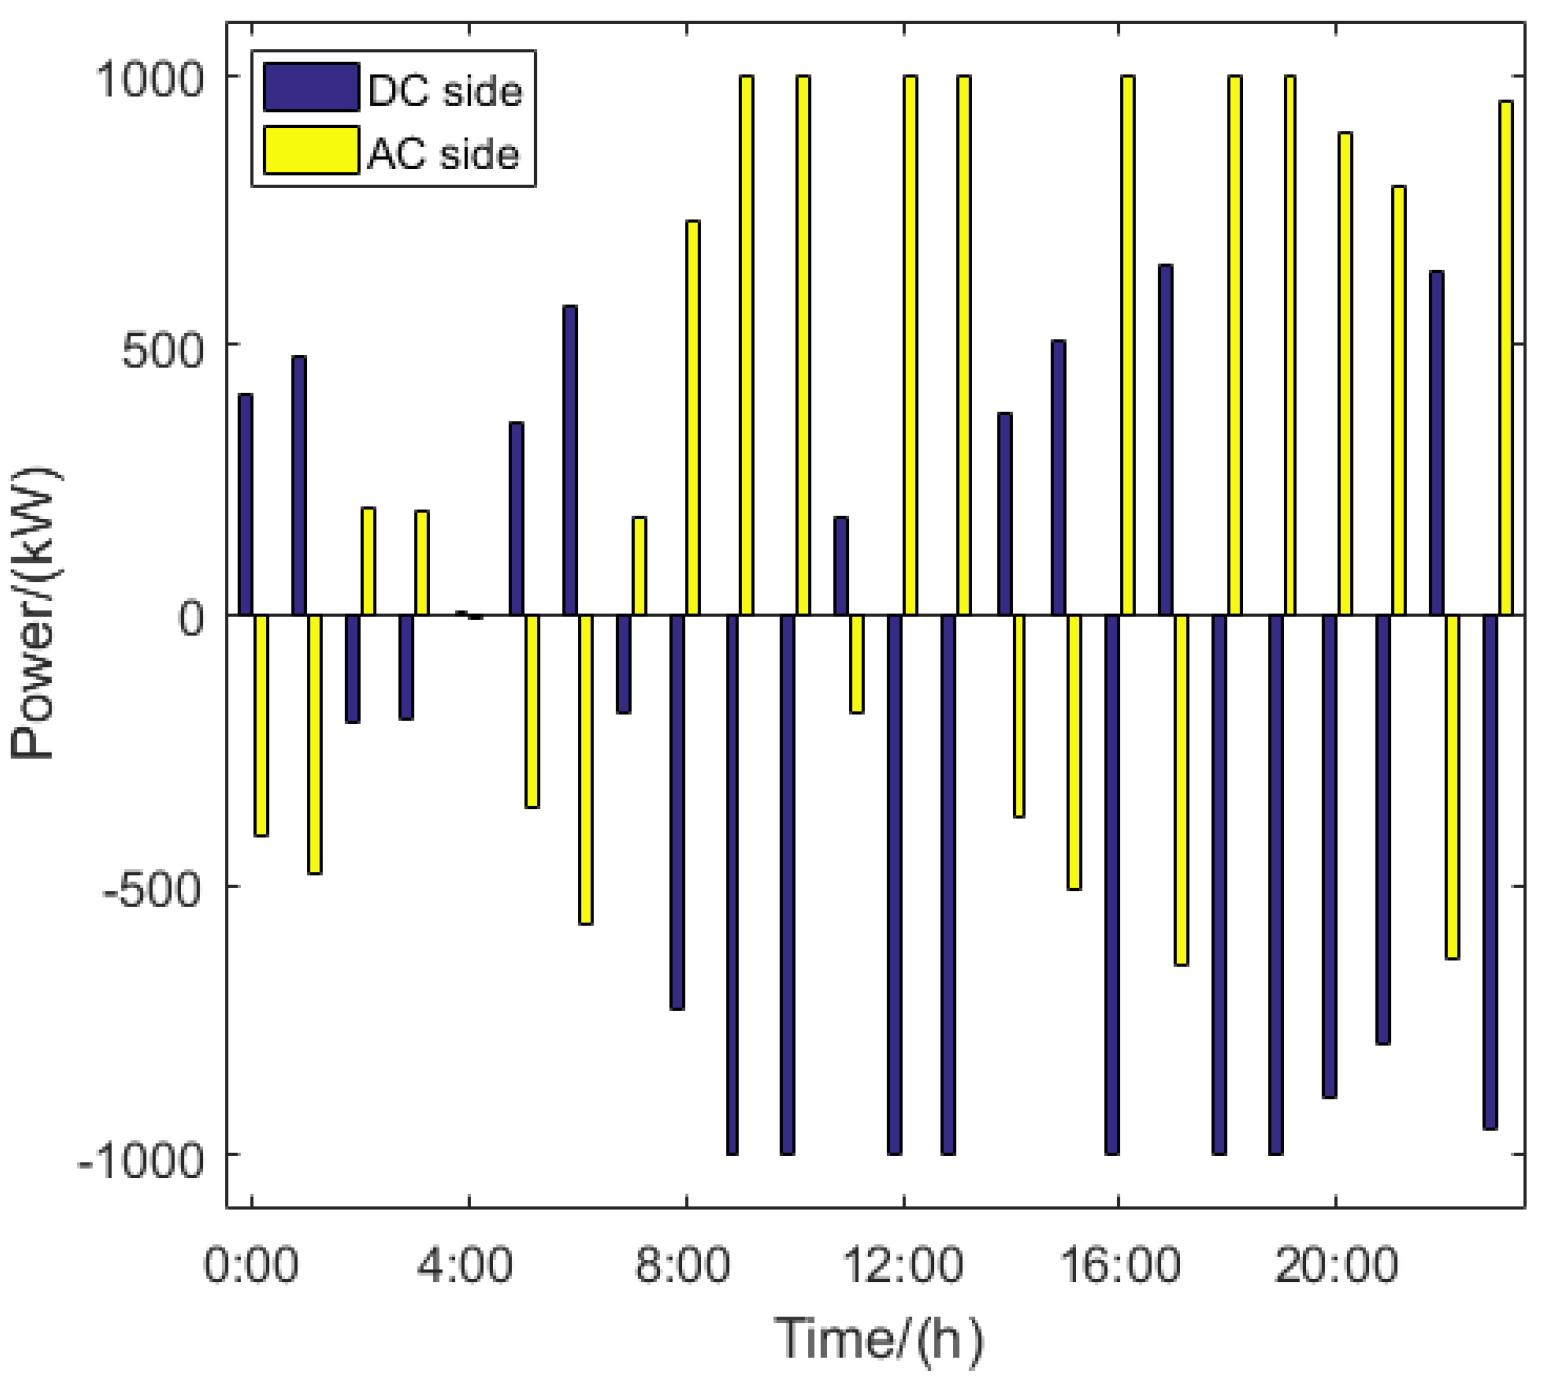
5.3. ILC Power Analysis
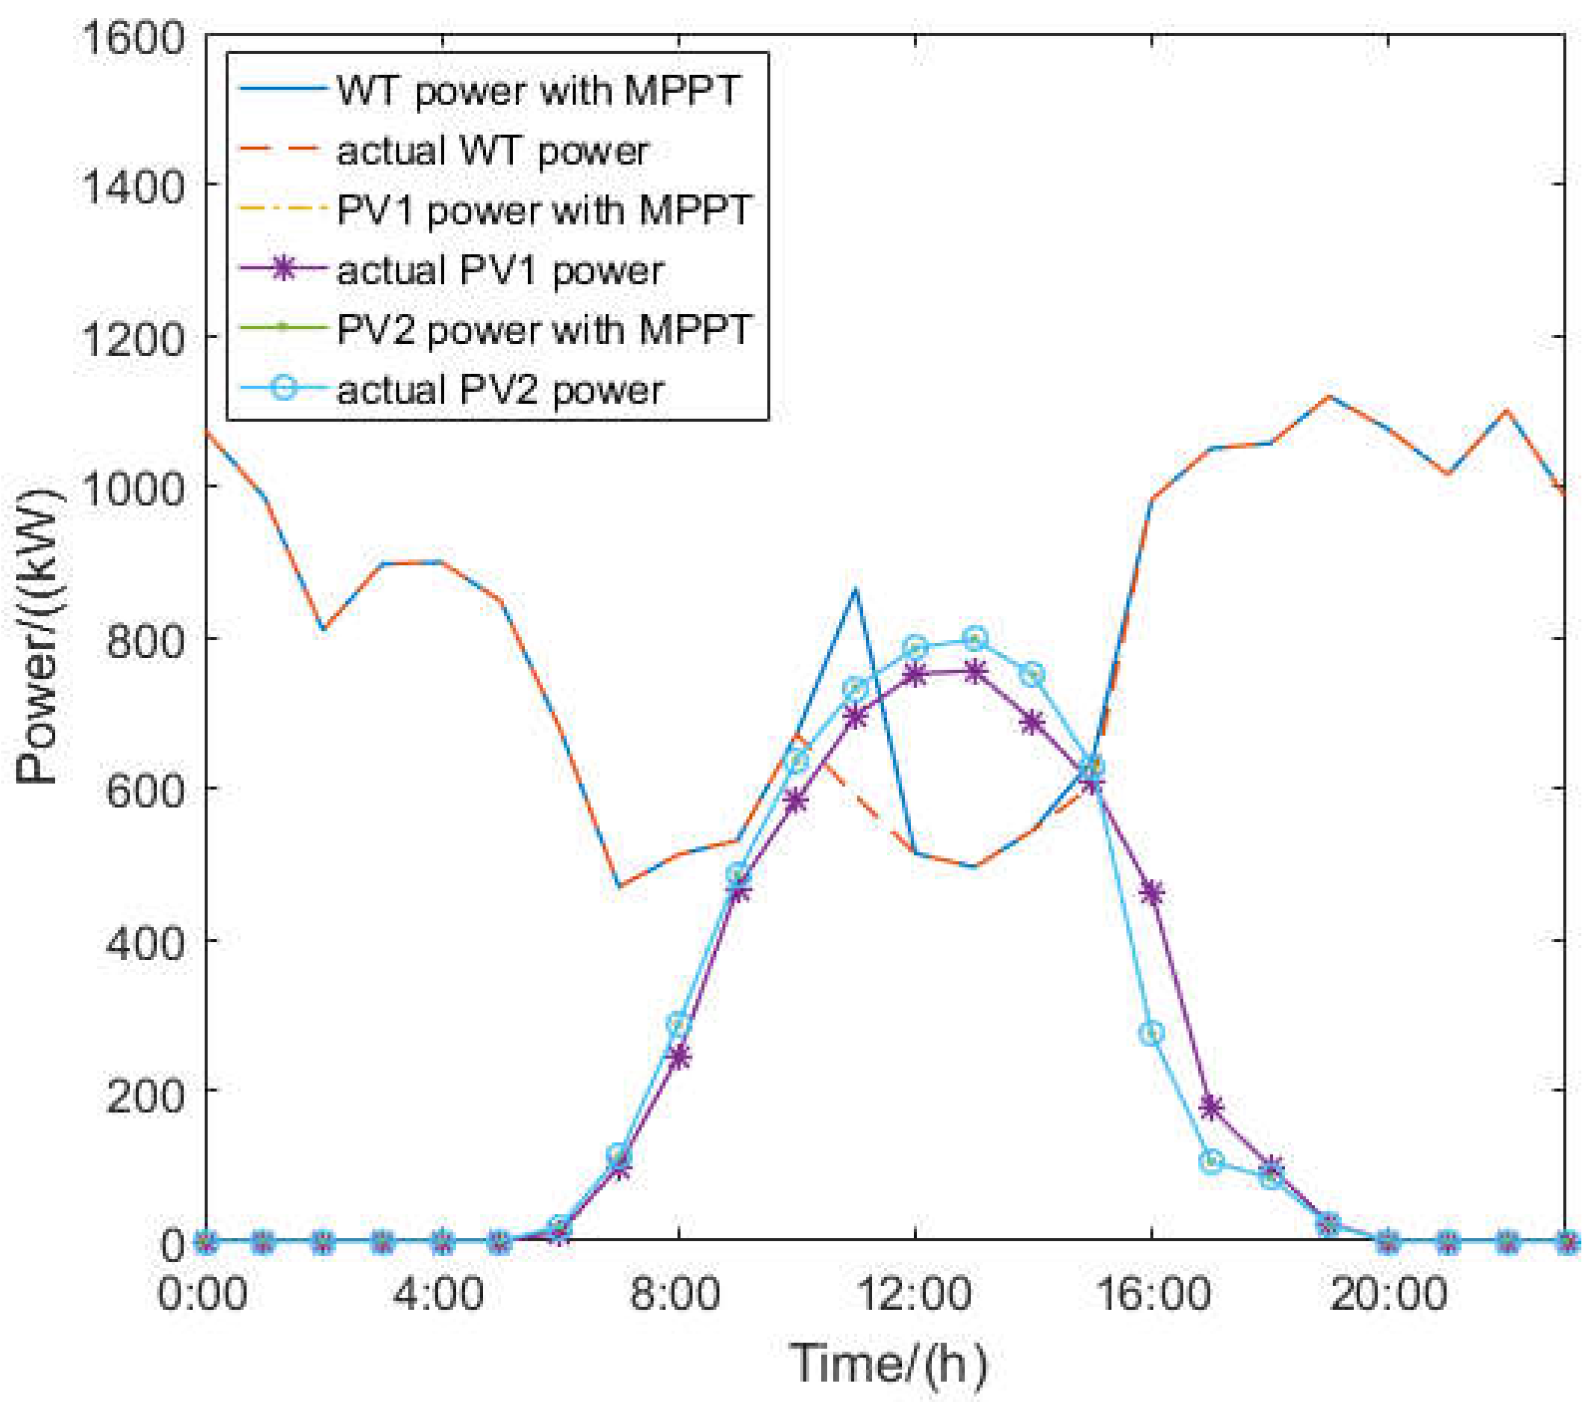
5.4. Rejected Power Analysis
6. Conclusions and Prospects
Author Contributions
Funding
Conflicts of Interest
Nomenclature
| the upper-level optimization objective | |
| the line loss of the entire network at time t | |
| the active power loss of ILC at time t | |
| the time-of-use price of UPG at time t | |
| the cost of the ILC loss | |
| line losses of AC and DC network respectively at time t | |
| active and reactive power of line at time t | |
| active power of line at time t | |
| line resistances of and | |
| rated voltages of AC and DC buses | |
| transmission power of ILC at time t | |
| effectiveness of ILC | |
| voltage of node s | |
| maximum and minimum allowable voltage of node s | |
| total operating time in a scheduling period of transferable load j | |
| rated power of transferable load | |
| actual power of transferable load at time t | |
| total load of DC and AC section at time t | |
| constant load of DC and AC section at time t | |
| transferable load of DC and AC section at time t | |
| total number of transferable loads in DC and AC section | |
| operating cost of PV, WT, CAES and FC | |
| , | penalty cost coefficients of PV and wind power curtailment |
| , | output power of PV and WT with maximum power point tracking (MPPT) |
| electricity transaction cost which is carried out through ILC on DC side | |
| maintenance cost coefficient of PV, WT, CAES and FC | |
| power generation cost coefficient of CAES and FC | |
| actual output power of PV, WT, CAES and FC | |
| power of ILC on DC side | |
| rate of pressure change for compression and generation conditions | |
| power of CAES for compression and generation conditions | |
| pressure of the gas storage chamber at time t and time t − 1 | |
| interval between two scheduling time | |
| minimum and maximum allowable discharge power of CAES | |
| minimum and maximum allowable charge power of CAES | |
| minimum and maximum allowable pressure of the gas storage chamber | |
| pressure of the gas storage chamber at time 0 and time T | |
| minimum and maximum allowable output power of FC | |
| minimum and maximum allowable transmission power of ILC | |
| output power of UPG and MT at time t | |
| power of ILC on AC side | |
| minimum and maximum allowable transmission power Of UPG | |
| minimum and maximum allowable output power of MT |
References
- Huang, S.; Wu, Q.; Liu, Z.; Nielsen, A.H. Review of congestion management methods for distribution networks with high penetration of distributed energy resources. In Proceedings of the 5th IEEE PES Innovative Smart Grid Technologies Europe, Istanbul, Turkey, 12–15 October 2014. [Google Scholar]
- Cipcigan, L.M.; Taylor, P.C. Investigation of the reverse power flow requirements of high penetrations of small-scale embedded generation. IET Renew. Power Gener. 2007, 1, 160–166. [Google Scholar] [CrossRef]
- Gabash, A.; Xie, D.; Li, P. Analysis of influence factors on rejected active power from active distribution networks. In Proceedings of the IEEE Power and Energy Student Summit, Ilmenau, Germany, 19–20 January 2012. [Google Scholar]
- Imani, M.H.; Zalzar, S.; Mosavi, A.; Shamshirband, S. Strategic behavior of retailers for risk reduction and profit increment via distributed generators and demand response programs. Energies 2018, 11, 1602. [Google Scholar] [CrossRef]
- Liu, X.; Wang, P.; Loh, P.C. A hybrid AC/DC microgrid and its coordination control. IEEE Trans. Smart Grid 2011, 2, 278–286. [Google Scholar]
- Kurohane, K.; Senjyu, T.; Uehara, A.; Yona, A.; Funabashi, T.; Kim, C.-H. A hybrid smart AC/DC power system. In Proceedings of the 5th IEEE Conference on Industrial Electronics and Applications, Taichung, Taiwan, 15–17 June 2010. [Google Scholar]
- Eghtedarpour, N.; Farjah, E. Power control and management in a hybrid AC/DC microgrid. IEEE Trans. Smart Grid 2014, 5, 1494–1505. [Google Scholar] [CrossRef]
- Wang, P.; Goel, L.; Liu, X.; Choo, F.H. Harmonizing AC and DC: A hybrid AC/DC future grid solution. IEEE Power Energy Mag. 2013, 11, 76–83. [Google Scholar] [CrossRef]
- Unamuno, E.; Barrena, J.A. Hybrid ac/dc microgrids—Part I: Review and classification of topologies. Renew. Sustain. Energy Rev. 2015, 52, 1251–1259. [Google Scholar] [CrossRef]
- Yang, Z.; Zhong, H.; Bose, A.; Xia, Q.; Kang, C. Optimal power flow in AC-DC grids with discrete control devices. IEEE Trans. Power Syst. 2018, 33, 1461–1472. [Google Scholar] [CrossRef]
- Cao, J.; Du, W.; Wang, H.F. An improved corrective security constrained OPF for meshed AC/DC grids with multi-terminal VSC-HVDC. IEEE Trans. Power Syst. 2016, 31, 485–495. [Google Scholar] [CrossRef]
- Baradar, M.; Hesamzadeh, M.R.; Ghandhari, M. Second-Order cone programming for optimal power flow in VSC-type AC-DC grids. IEEE Trans. Power Syst. 2013, 28, 4282–4291. [Google Scholar] [CrossRef]
- Malik, S.M.; Ai, X.; Sun, Y.; Chen, Z.; Zhou, S. Voltage and frequency control strategies of hybrid AC/DC microgrid: A review. IET Gener. Transm. Distrib. 2017, 11, 303–313. [Google Scholar] [CrossRef]
- Shanthi, P.; Govindarajan, U.; Parvathyshankar, D. Instantaneous power-based current control scheme for VAR compensation in hybrid AC/DC networks for smart grid applications. IET Power Electron. 2014, 7, 1216–1226. [Google Scholar] [CrossRef]
- Dong, L.; Ming, J.; Yu, T.; Fan, S.; Pu, T. Voltage division control in AC / DC hybrid distribution network based on model predictive control. In Proceedings of the 2016 IEEE PES Asia-Pacific Power and Energy Engineering Conference (APPEEC), Xi’an, China, 25–28 October 2016. [Google Scholar]
- Zhu, M.; Hang, L.; Li, G.; Jiang, X. Protected control method for power conversion interface under unbalanced operating conditions in AC/DC hybrid distributed grid. IEEE Trans. Energy Convers. 2016, 31, 57–68. [Google Scholar] [CrossRef]
- Nejabatkhah, F.; Li, Y. Overview of power management strategies of hybrid AC/DC microgrid. IEEE Trans. Power Electron. 2015, 30, 7072–7089. [Google Scholar] [CrossRef]
- Liu, S.; Ding, L.; Miao, Y. Research of coordinated control strategy for multi-UHVDC in AC/DC hybrid power grid. Energy Procedia 2011, 12, 443–449. [Google Scholar] [CrossRef]
- Hu, J.; Shan, Y.; Xu, Y.; Guerrero, J.M. A coordinated control of hybrid ac/dc microgrids with PV-wind-battery under variable generation and load conditions. Int. J. Electr. Power Energy Syst. 2019, 104, 583–592. [Google Scholar] [CrossRef]
- Li, Y.; Li, Y.; Li, G.; Zhao, D.; Chen, C. Two-stage multi-objective OPF for AC/DC grids with VSC-HVDC: Incorporating decisions analysis into optimization process. Energy 2018, 147, 286–296. [Google Scholar] [CrossRef]
- Ghadiri, A.; Haghifam, M.R.; Larimi, S.M.M. Comprehensive approach for hybrid AC/DC distribution network planning using genetic algorithm. IET Gener. Transm. Distrib. 2017, 11, 3892–3902. [Google Scholar] [CrossRef]
- Liang, H.; Lin, J.; Ba, L.; Li, H. Research on optimal dispatch method for AC/DC hybrid active distribution network. In Proceedings of the International Conference on Renewable Power Generation (RPG), Beijing, China, 17–18 October 2015. [Google Scholar]
- Indragandhi, V.; Logesh, R.; Subramaniyaswamy, V.; Vijayakumar, V.; Siarry, P.; Uden, L. Multi-objective optimization and energy management in renewable based AC/DC microgrid. Comput. Electr. Eng. 2018, 70, 179–198. [Google Scholar]
- Qi, C.; Wang, K.; Li, G.; Han, B.; Xu, S.; Wei, Z. Hierarchical and distributed optimal scheduling of AC/DC hybrid active distribution network. Proc. CSEE 2017, 37, 1909–1917. [Google Scholar]
- Eajal, A.A.; Shaaban, M.F.; Ponnambalam, K.; El-Saadany, E.F. Stochastic centralized dispatch scheme for AC/DC hybrid smart distribution systems. IEEE Trans. Sustain. Energy 2017, 7, 1046–1059. [Google Scholar] [CrossRef]
- Qiu, H.; Zhao, B.; Gu, W.; Bo, R. Bi-Level two-stage robust optimal scheduling for AC/DC hybrid multi-microgrids. IEEE Trans. Smart Grid 2018, 9, 5455–5466. [Google Scholar] [CrossRef]
- Qiu, H.; Gu, W.; Pan, J.; Xu, B.; Xu, Y.; Fan, M.; Wu, Z. Multi-interval-uncertainty constrained robust dispatch for AC/DC hybrid microgrids with dynamic energy storage degradation. Appl. Energy 2018, 228, 205–214. [Google Scholar] [CrossRef]
- Gabash, A.; Li, P. On variable reverse power flow-part I: Active-reactive optimal power flow with reactive power of wind stations. Energies 2016, 9, 121. [Google Scholar] [CrossRef]
- Li, Y.; Miao, S.; Luo, X.; Wang, J. Optimization model for the power system scheduling with wind generation and compressed air energy storage combination. In Proceedings of the 22nd International Conference on Automation and Computing (ICAC), Colchester, UK, 7–8 September 2016. [Google Scholar]
- Bayraktar, Z.; Komurcu, M.; Werner, D.H. Wind Driven Optimization (WDO): A novel nature-inspired optimization algorithm and its application to electromagnetics. In Proceedings of the 2011 IEEE Antennas and Propagation Society International Symposium, Toronto, ON, Canada, 11–17 July 2010. [Google Scholar]
- Bayraktar, Z.; Komurcu, M.; Bossard, J.A.; Werner, D.H. The wind driven optimization technique and its application in electromagnetics. IEEE Trans. Antennas Propag. 2013, 61, 2745–2757. [Google Scholar] [CrossRef]
- Lofberg, J. YALMIP: A toolbox for modeling and optimization in MATLAB. In Proceedings of the 2004 IEEE International Conference on Robotics and Automation, New Orleans, LA, USA, 2–4 September 2004. [Google Scholar]
- Kekatos, V.; Giannakis, G.B.; Wollenberg, B. Optimal placement of phasor measurement units via convex relaxation. IEEE Trans. Power Syst. 2012, 27, 1521–1530. [Google Scholar] [CrossRef]
- Korres, G.N.; Manousakis, N.M.; Xygkis, T.C.; Löfberg, J. Optimal phasor measurement unit placement for numerical observability in the presence of conventional measurements using semi-definite programming. IET Gener. Transm. Distrib. 2015, 9, 2427–2436. [Google Scholar] [CrossRef]
- Singh, D.; Misra, R.; Singh, D. Effect of load models in distributed generation planning. IEEE Trans. Power Syst. 2007, 22, 2204–2212. [Google Scholar] [CrossRef]


| Transferable Loads | Rated Power (Kw) | Planned Operation Time (h) | Planned Outage Time (h) |
|---|---|---|---|
| RL1 of AC section | 180 | 9–12, 15–18, 22–24 | 0–8, 13–17, 19–21 |
| RL2 of AC section | 200 | 11–14, 19–21 | 0–10, 15–18, 22–24 |
| RL3 of AC section | 160 | 0–18 | 19–24 |
| RL1 of DC section | 180 | 8–17 | 0–7, 18–24 |
| RL2 of DC section | 240 | 6–8, 11–13, 18–22 | 0–5, 9–10, 14–17, 23–24 |
| RL3 of DC section | 200 | 5–22 | 0–4, 23–24 |
| Item | Value |
|---|---|
| Rated discharge power (kW) | 1000 |
| Rated charge power (kW) | 700 |
| Initial pressure (bar) | 55 |
| Cavern operational pressure range (bar) | 46–66 |
| Operation coefficient for compression (bar/kW) | 0.0071 |
| Operation coefficient for generation (bar/kW) | 0.0033 |
| Power generation cost (CNY/kW) | 0.16 |
| Maintenance cost (CNY/kW) | 0.0013 |
| Time (h) | Price (CNY/kWh) |
|---|---|
| 0–7 | 0.3 |
| 7–12 | 0.6 |
| 12–14 | 1 |
| 14–18 | 0.6 |
| 18–22 | 1 |
| 22–24 | 0.3 |
© 2018 by the authors. Licensee MDPI, Basel, Switzerland. This article is an open access article distributed under the terms and conditions of the Creative Commons Attribution (CC BY) license (http://creativecommons.org/licenses/by/4.0/).
Share and Cite
Ye, C.; Miao, S.; Li, Y.; Li, C.; Li, L. Hierarchical Scheduling Scheme for AC/DC Hybrid Active Distribution Network Based on Multi-Stakeholders. Energies 2018, 11, 2830. https://doi.org/10.3390/en11102830
Ye C, Miao S, Li Y, Li C, Li L. Hierarchical Scheduling Scheme for AC/DC Hybrid Active Distribution Network Based on Multi-Stakeholders. Energies. 2018; 11(10):2830. https://doi.org/10.3390/en11102830
Chicago/Turabian StyleYe, Chang, Shihong Miao, Yaowang Li, Chao Li, and Lixing Li. 2018. "Hierarchical Scheduling Scheme for AC/DC Hybrid Active Distribution Network Based on Multi-Stakeholders" Energies 11, no. 10: 2830. https://doi.org/10.3390/en11102830
APA StyleYe, C., Miao, S., Li, Y., Li, C., & Li, L. (2018). Hierarchical Scheduling Scheme for AC/DC Hybrid Active Distribution Network Based on Multi-Stakeholders. Energies, 11(10), 2830. https://doi.org/10.3390/en11102830