1. Introduction
Geothermal energy resources are renewable and exist widely. If carefully managed, geothermal production can be sustained essentially and almost indefinitely [
1]. A lot of geothermal resources belong to the low-temperature category, they are being used in combined heat and power plant (CHP). For water with a temperature below 100 °C, binary (Organic Rankine Cycle) power plants are usually installed and used to generate electricity [
2,
3]. An example is the former USSR binary power plant, 680 KW using 81 °C water at Paratunka on the Kamchatka peninsula [
4]. Other methods of waste heat recovery (WHR) that can be applied at low temperature differences with relatively high efficiency, like Texergy cycle [
5], trigeneration cycle [
6], thermochemical recuperation [
7,
8,
9], cooling or heating [
10,
11].
Li et al. [
12] discussed possible factors which have led to the low growth rate of geothermal development. The main factors include high exploration risk, lower social acceptance, long payback and construction time and difficulty to assess resources. Li et al. [
12] also pointed out the development and utilization of thermoelectric generator (TEG) technology may be one of the possible solutions and a direction to speed up geothermal growth. Liu et al. [
13] built a power generator using TEG modules, which indicated that the cost of the TEG system developed was lower than those of photovoltaic (PV) and wind power systems in terms of equivalent energy generated.
From the beginning of the 1990s a renewal of interest in thermoelectric (TE) appeared, due to environmental concern with refrigerant gas and greenhouse effects, as well as the need to develop alternative energy sources [
14].
One of the big disadvantages of TEGs is the low efficiency from thermal to electric energy because of many factors affecting the output power of thermoelectric generators. In the last few decades, immense efforts have been made to study thermoelectric generator applications experimentally. Zheng et al. [
15] reviewed the thermoelectric technology, demonstrated its potential to improve energy efficiency and pointed to a possible direction of alleviating energy demand. Due to the advantages of no moving parts, long lifespan and quiet operation, attempts to use thermoelectric modules have been made in many areas, such as the automobile, aerospace, industry and domestic sectors. Demir and Dincer [
16] investigated a water-electric cogeneration system integrated with a TEG, the system has 21.8 MW of generating electricity capacity. Niu et al. [
17] developed a low-cost, simple configuration TEG unit with commercially available Bi
2Te
3 based thermoelectric modules for an anticipated maximum power generation of about 150–200 W level. Chen et al. [
18] researched the characteristics of a multi-element thermoelectric generator with the irreversibility of finite-rate heat transfer, Joule heat inside the thermoelectric device, and the heat leak through the thermoelectric couple leg. Crane and Jackson [
19] studied optimizing TE waste heat recovery by integrating efficient cross flow heat exchangers with thermoelectric modules for conversion of waste heat to electricity. Hsu et al. [
20] made efforts in simulating and testing the performance of Bi
2Te
3-based TEG modules, 12.41 W of maximum power output at an average temperature difference of 30 K for 24 TEG modules.
Rodríguez et al. [
21] developed a TEG model which takes into account the properties of the thermoelectric materials as a function of temperature, studied the behavior of the thermoelectric generator and made improvements to the previously published model. Bélanger and Gosselin [
22] presented a model and optimized the internal structure of a thermoelectric generator sandwiched in a cross flow heat exchanger. Ming et al. [
23] carried out a numerical simulation to verify the validity of the optimum segmented thermoelectric generator (STEG) model in the design boundary condition. The results indicated that unsteady heat flux not only affects the output of the model, but also deteriorates the work environment. Esarte [
24] developed a theoretical expression for the temperature through the TEG module and checked with the experimental results. The theoretical results meet well with the experimental values for low flow rates but not for high flow rates. Gou et al. [
25] studied the influence of heat transfer irreversibility on thermoelectric generation performance. Expanding the heat sink surface area and enhancing cold-side heat transfer capacity in a proper range can enhance performance of the TEG system. Casano and Piva [
26] reported an experimental investigation of the performance of a power generation device in which they used multiple Peltier modules in the Seebeck mode, and analyzed the thermoelectric generator based on the experimental data for the ‘open’ and ‘closed’ circuit voltage, electric power output and conversion efficiency as a function of temperature.
Chen et al. [
27] presented a three-dimensional (3D) numerical solution to the fluid-structure coupled problem by implementing a FLUENT compatible thermoelectric model. Yu and Zhao [
28] presented a detailed numerical model of thermoelectric generator with the parallel-plate heat exchanger, focused on analyzing the fluid temperature changes along the fluid passage and the temperature difference cross the thermoelectric modules (TE). Meng et al. [
29] established a complete numerical model of commercial thermoelectric generator with finned heat exchangers, considered the heat transfer irreversibilities between the device and its external reservoirs, analyzed the effects of external irreversibilities on the performance of the thermoelectric generators compared with the exo-reversible model. Many researches have investigated the numerical modeling of TEG systems. Gou et al. [
30] established a theoretical dynamic model of a thermoelectric generator for waste heat recovery and discussed the influence of the flow rates of hot and cold fluids, which indicated that enhancing heat dissipation on the cold side takes greater importance compared with enhancing heat transfer.
In this paper, we redesigned and modified our previous 1 KW (at a temperature difference of around 120 °C) TEG system. The output power of the system was improved significantly, about 34.6% greater; the instantaneous efficiency of the TEG system could reach about 6.5%. Laboratory experiments have been conducted to measure the output power at different conditions: different connection modes between TEG modules, different mechanical structures, different fluid flow direction, and different temperature differences between hot and cold sides. The TEG apparatus has been tested and the data will be presented.
3. Characteristics of Internal Resistance
The internal resistance of the thermoelectric module affects the current that goes through it, finally determining the output power. Therefore, it is crucial to study the internal resistance characteristics.
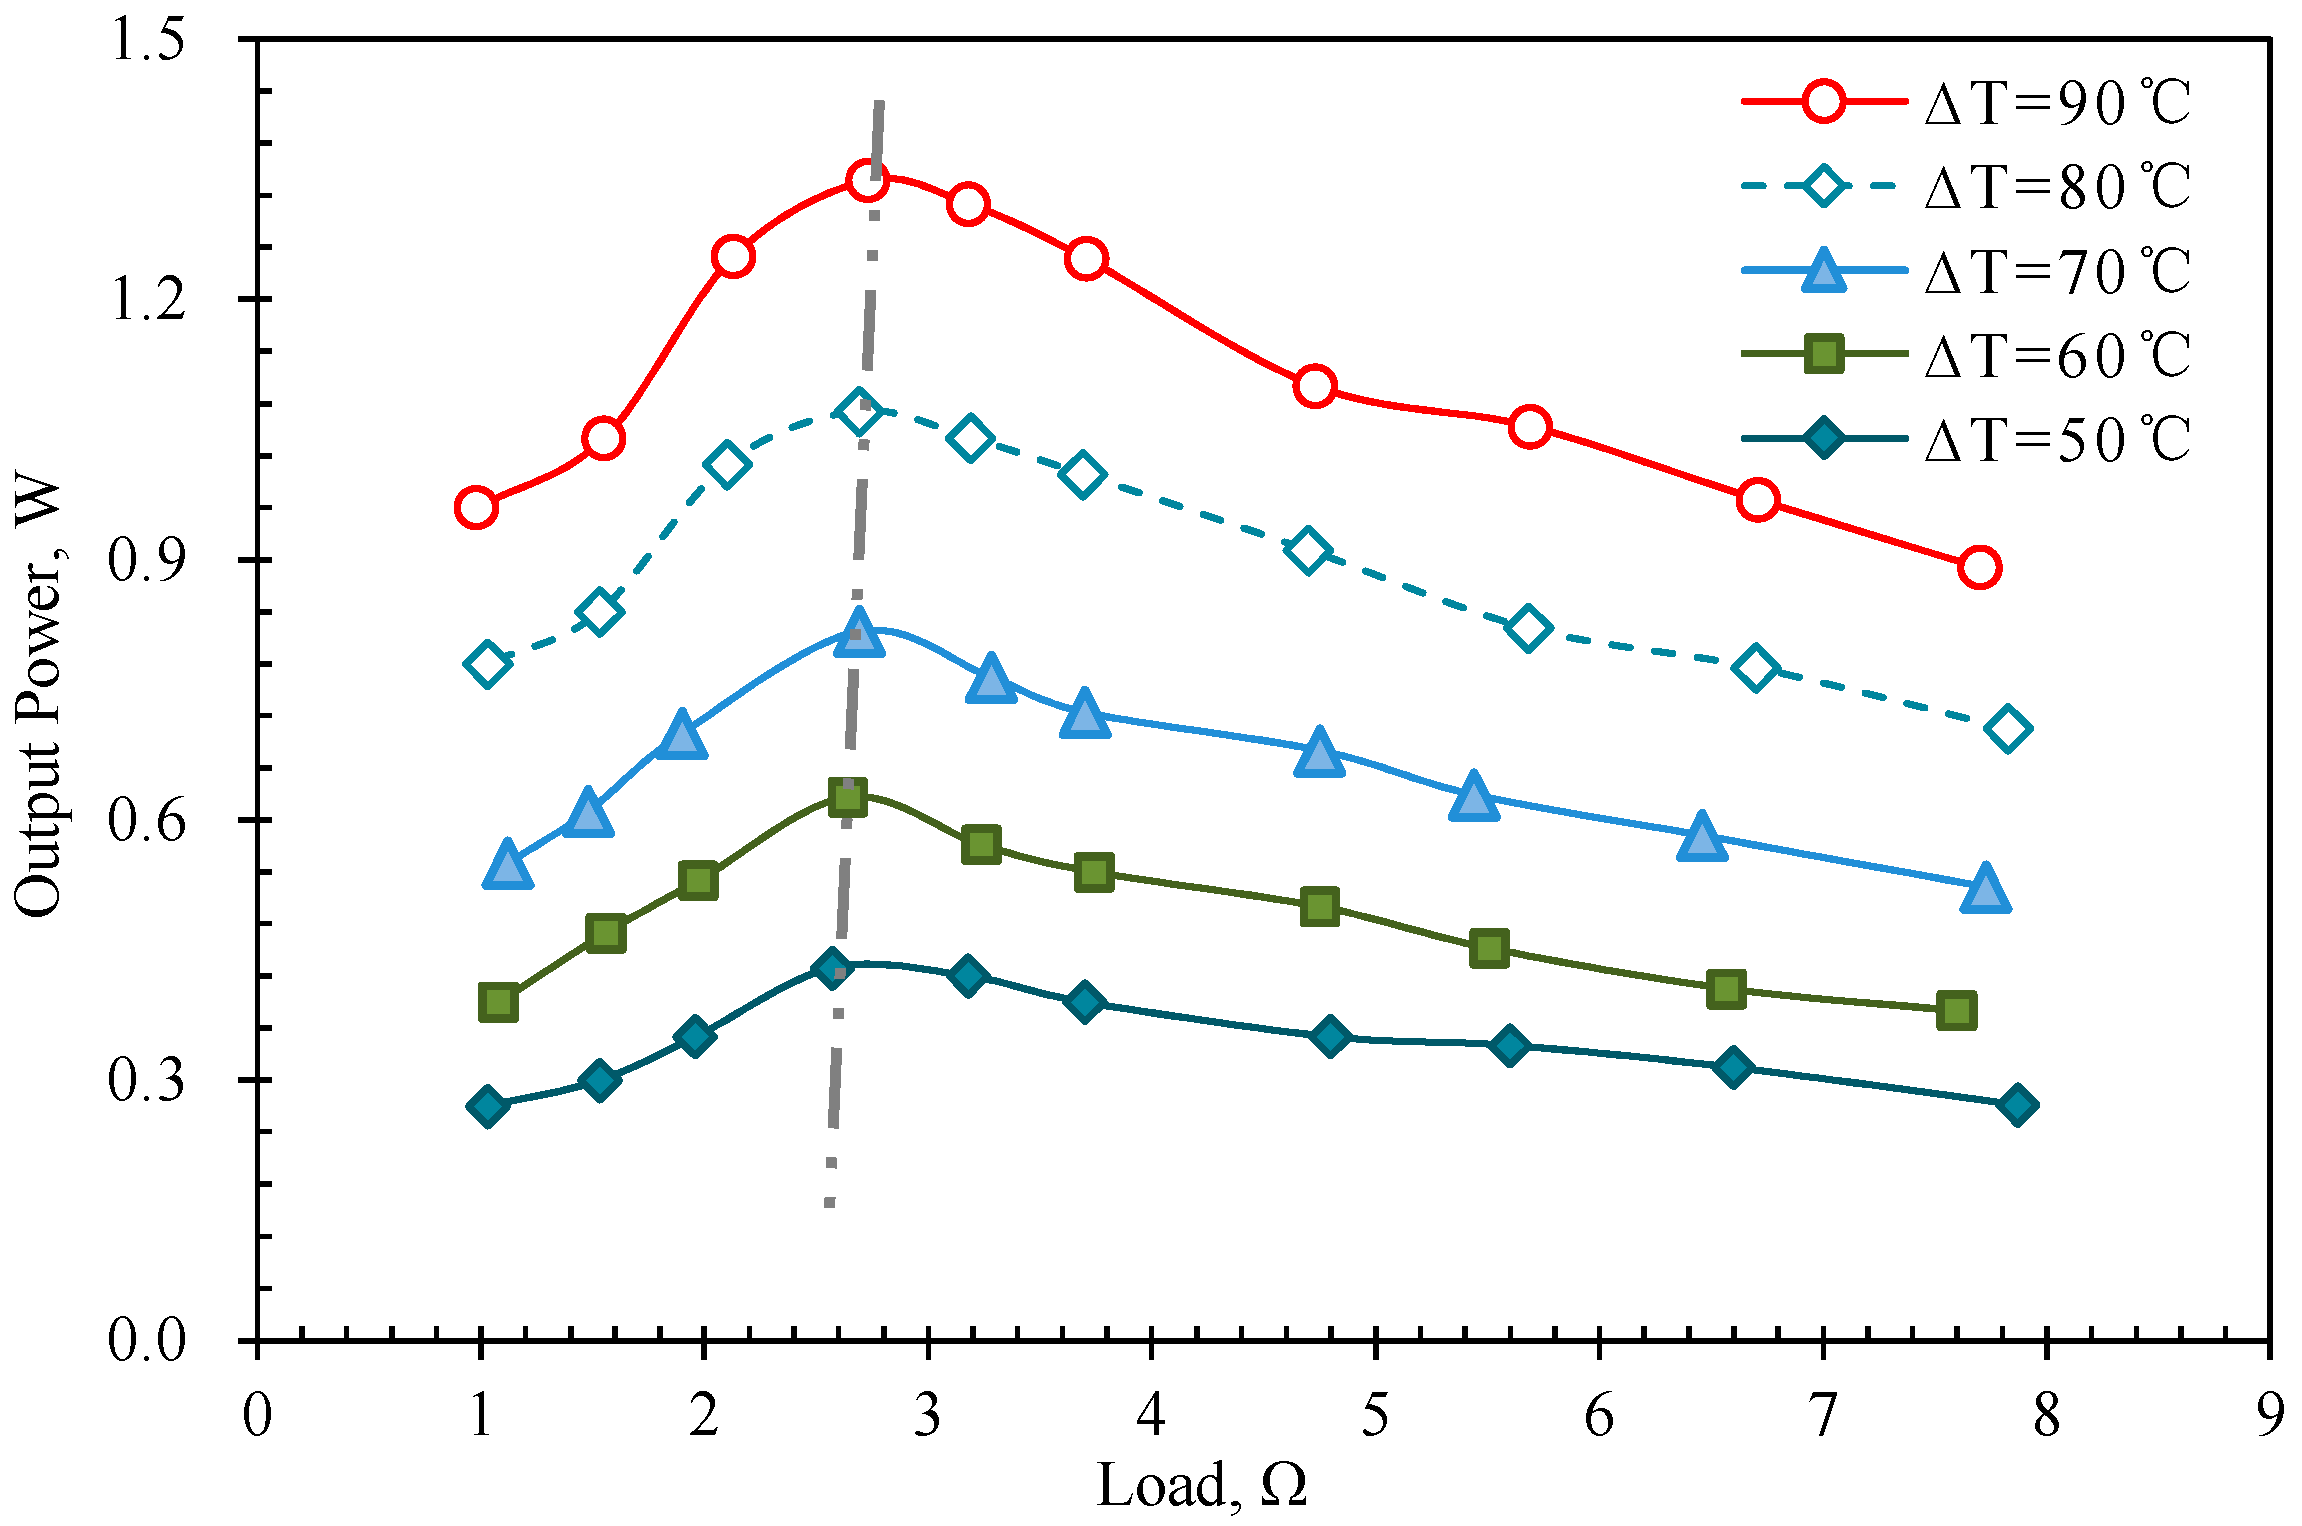
The
∆T of single thermoelectric modules was increased from 50 to 90 °C with an interval of 10 °C, the experimental results are shown in
Figure 2.
As shown in
Figure 2, a small-scale increase of output power appears at the initial development period. With the increase in load, the output power increases first then decreases gradually. The output power comes to the maximum when the load is equal to the internal resistance, these results conform to the Closed Circuit Ohm’s Law. The dash line describes the optimum resistance that has an increasing tendency at different
∆T, varying from 50 to 90 °C. It seems to be a phenomenon that increasing temperature difference leads to the internal resistance of thermoelectric module increasing due to the characteristics of thermoelectric materials in a specific temperature range [
33].
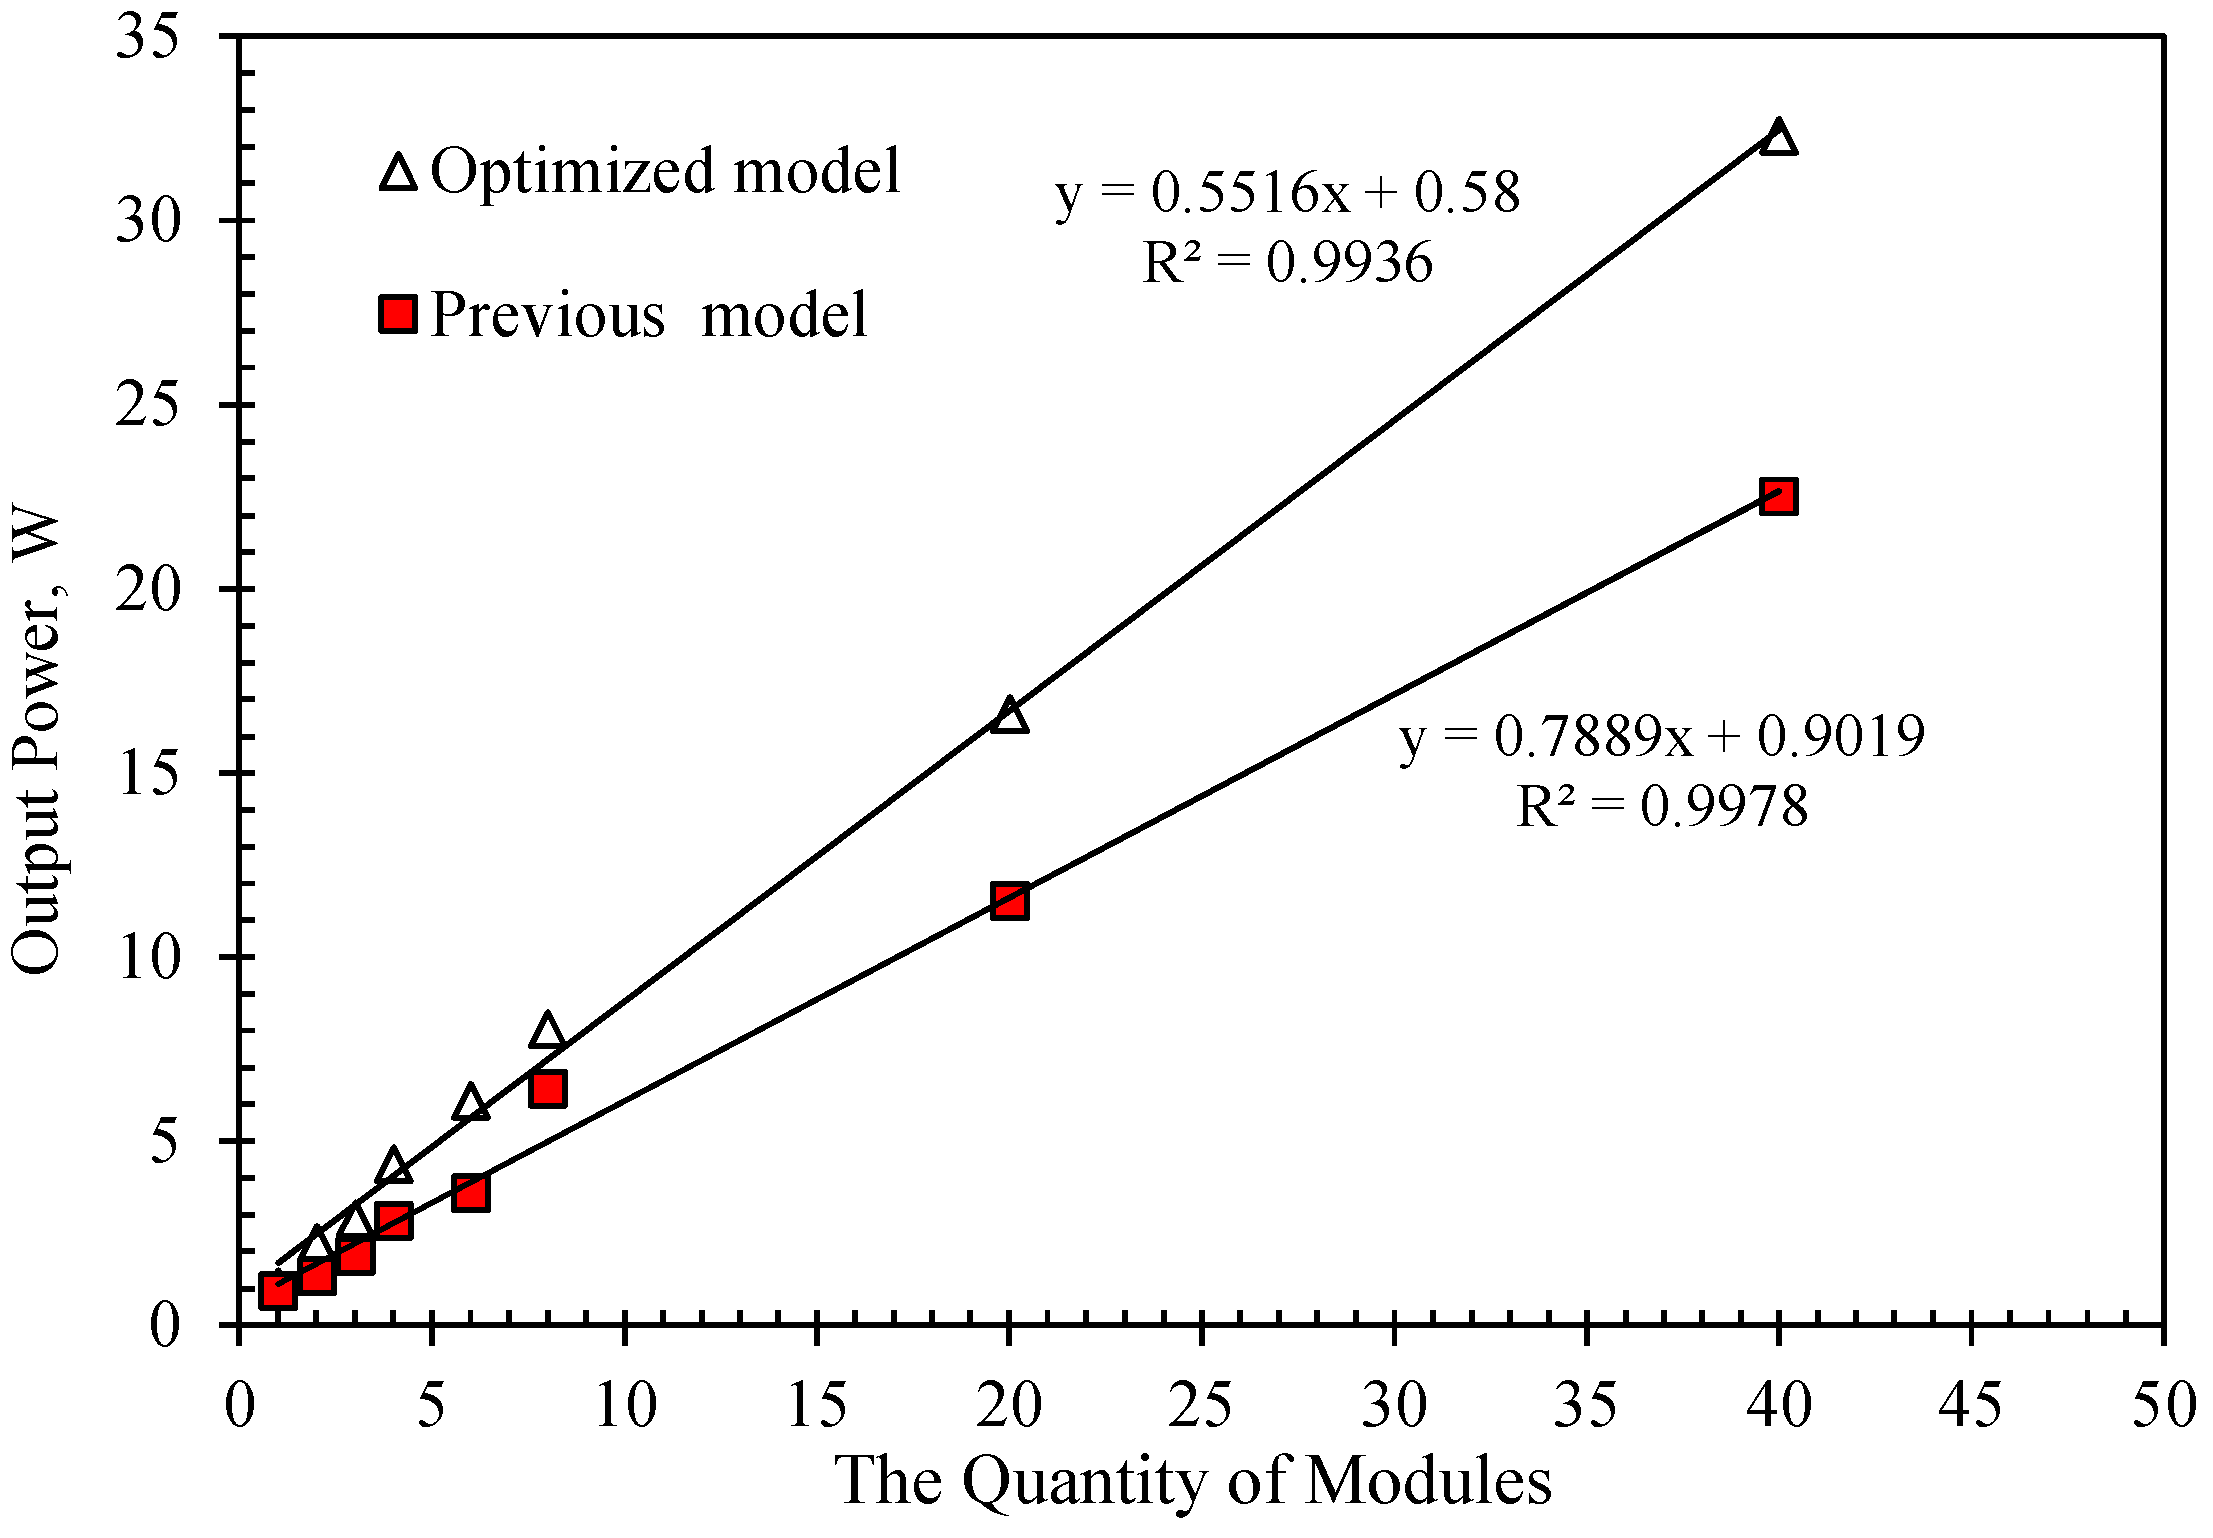
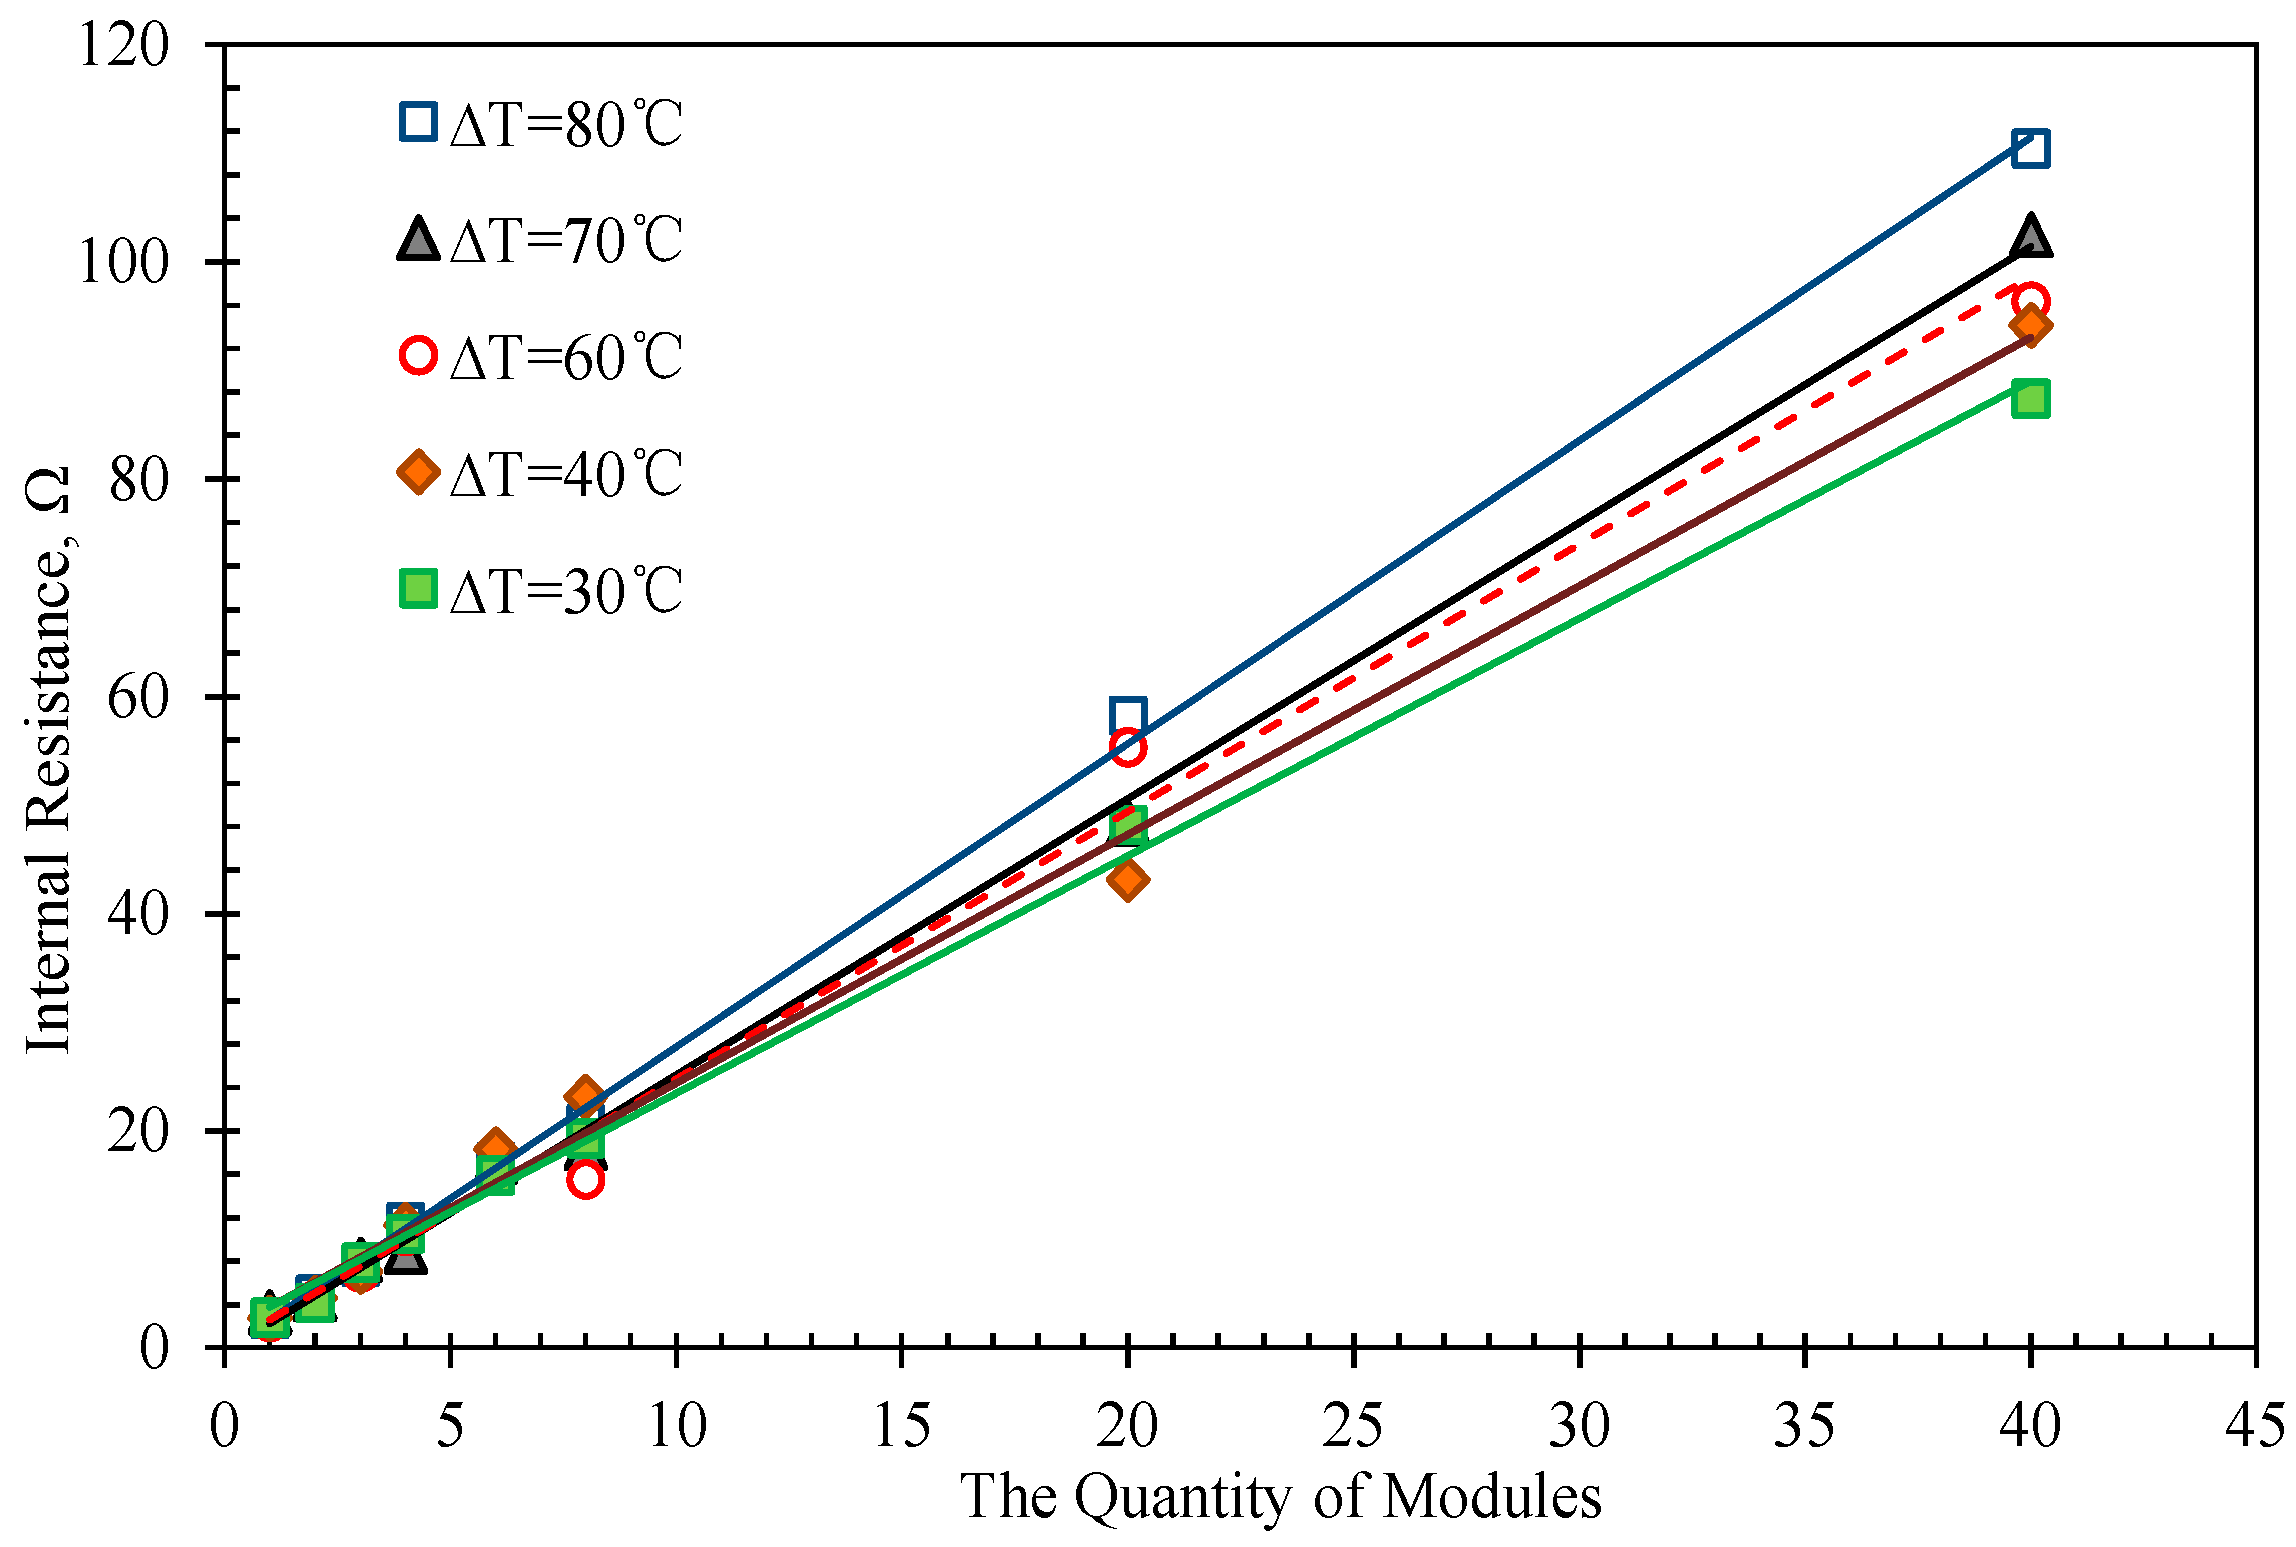
In addition, the resistances of multiple thermoelectric modules were tested at different
∆T, increasing from 20 to 80 °C, and then the studies on a number of thermoelectric modules in series were conducted. The experimental results are presented in
Figure 3 and
Figure 4.
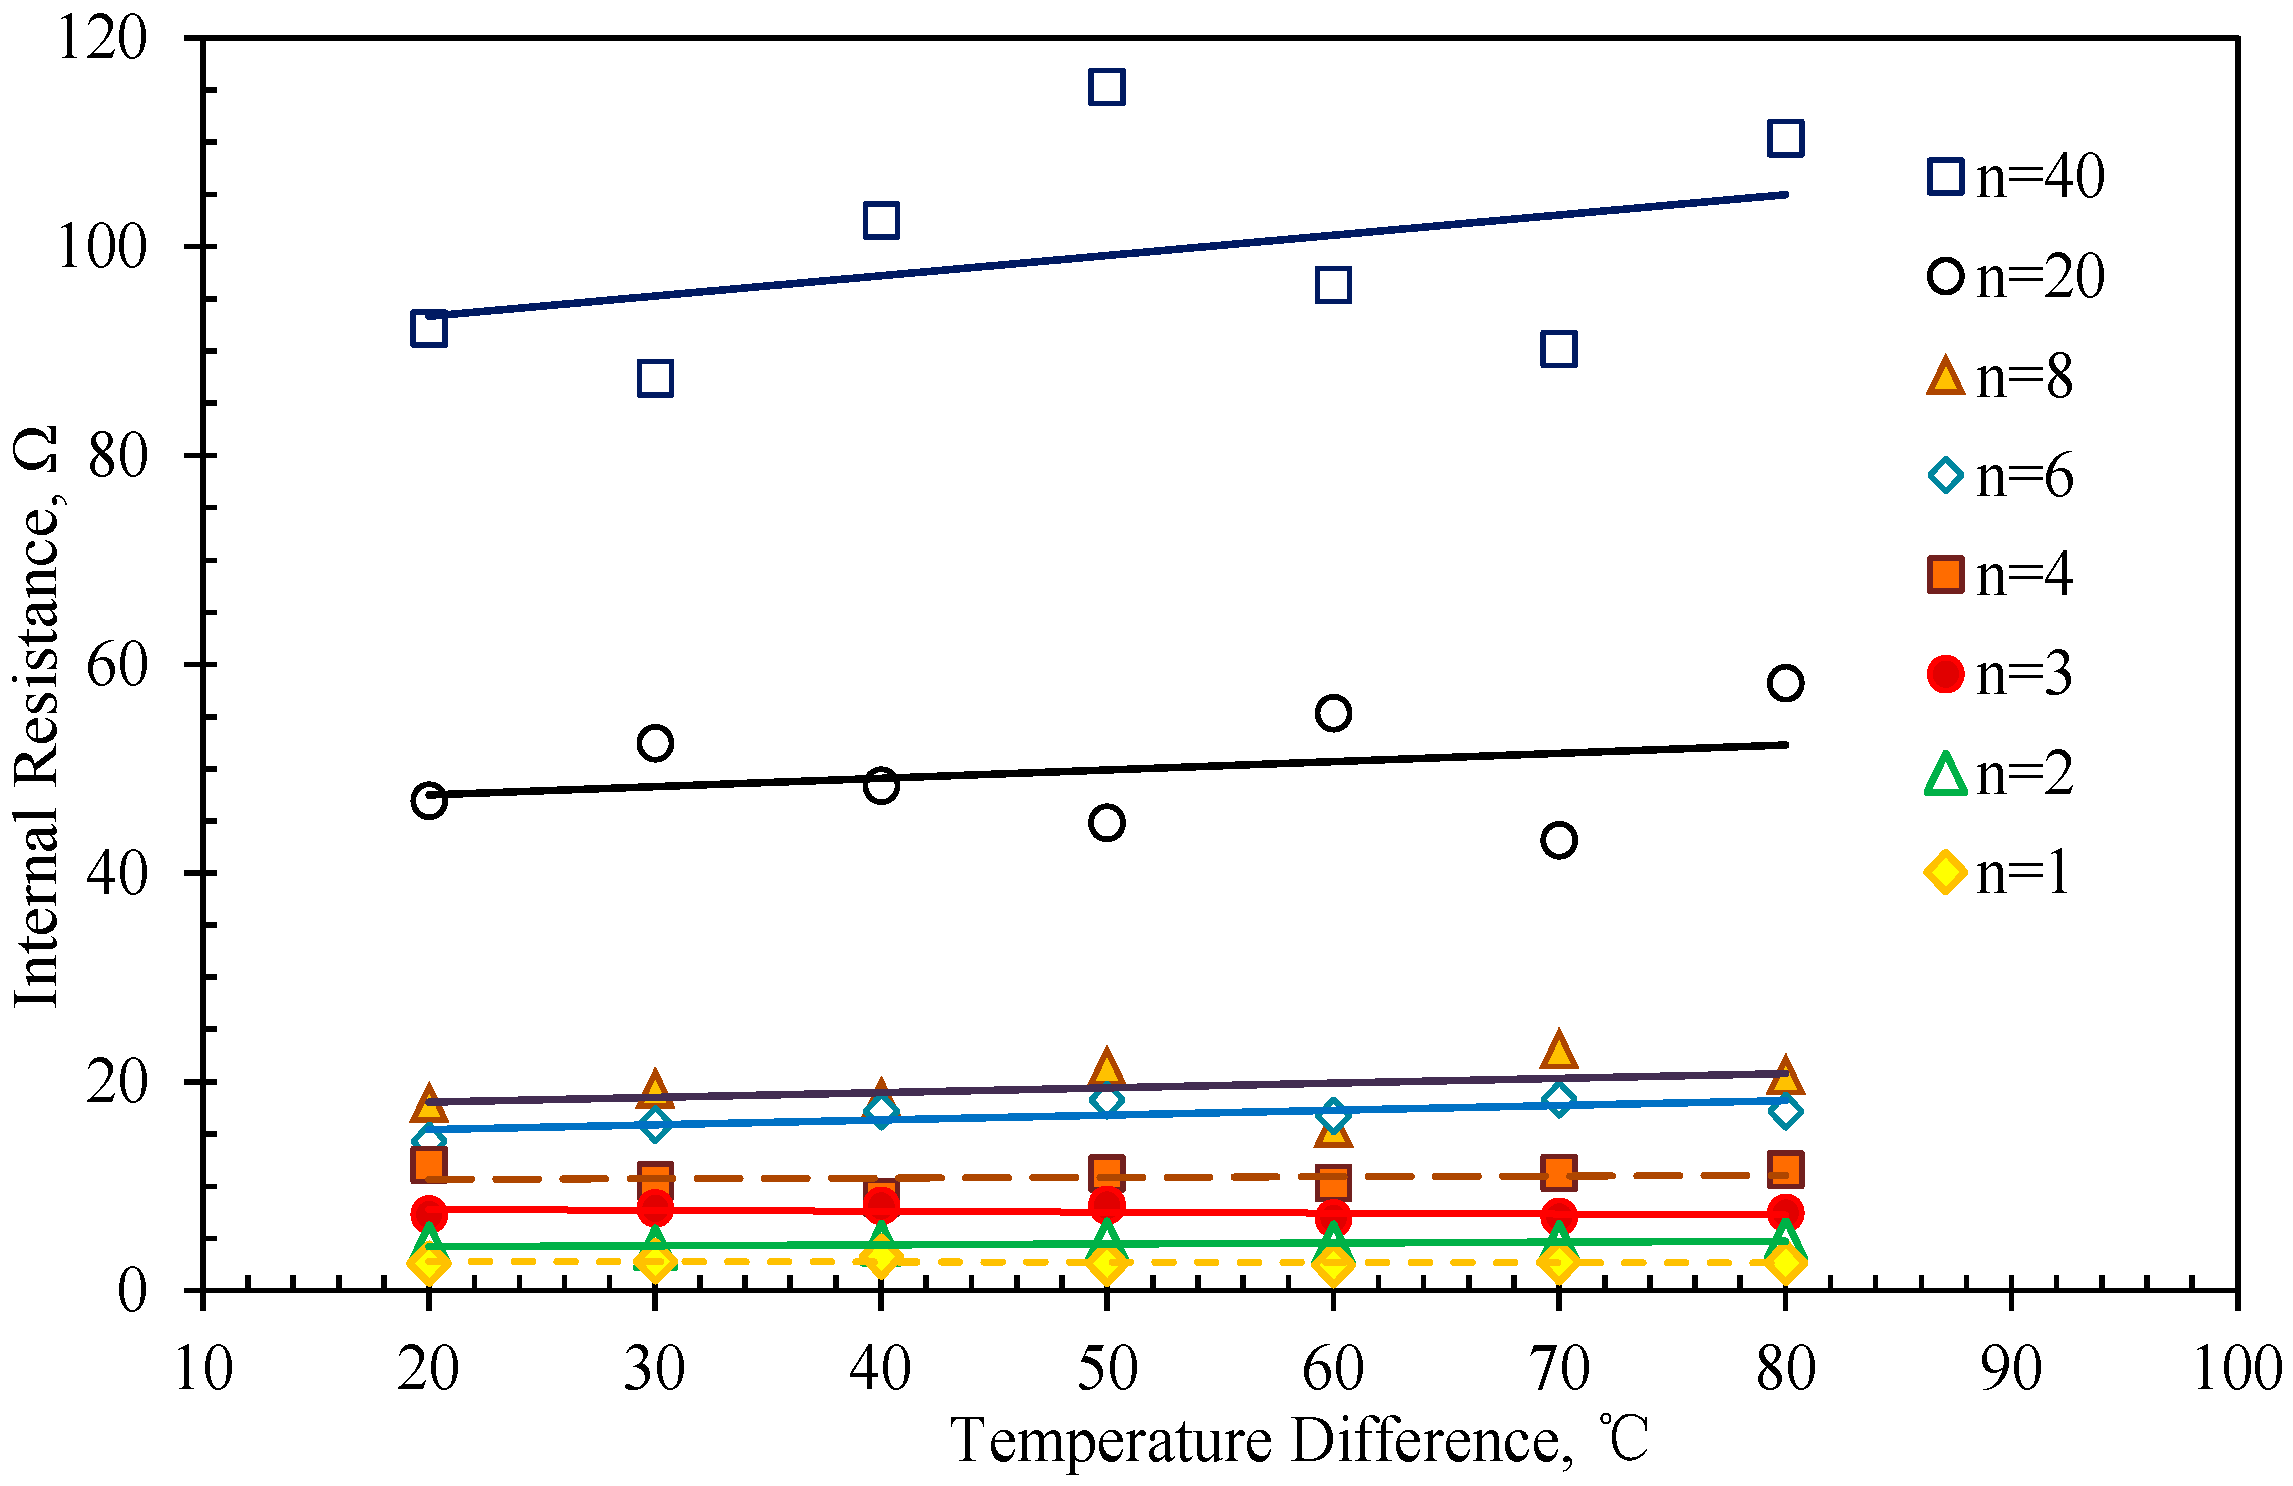
Figure 3 demonstrates a linear relationship between the total internal resistance and the quantity of modules when
∆T is constant.
Figure 4 reveals the fluctuation range of internal resistance for a different number of modules, when
∆T is increasing from 20 to 80 °C. Obviously, for 4 modules, the maximum fluctuation range of their internal resistance is about 5.6% (
RMin = 8.9 Ω at a
∆T of 40 °C;
RMax = 11.6 Ω at the
∆T of 80 °C); for 20 modules, it is around 10.6%, and for 40 modules, 15.3%. The results illustrate that the fluctuation range of total resistance for multiple modules increases as the number of modules increases. The resistivity of the thermoelectric material is changed in a specific temperature range [
33], and the increasing quantity of modules may amplify the internal resistance fluctuation. Therefore, stabilizing the internal resistance may be a key issue for thermoelectric power generation development.
4. Factors Affecting Output Power
Today, many studies regarding thermoelectricity are focused on material improvement. Less attention has been paid to the device and system optimization. The heat exchanger system is the most important part in optimized measurement and the TEG system, therefore, experimental study was focused on the structure, reinforcement, insulation measures, fluid flow direction, and flow rate of the heat exchanger, by providing a relevant experimental basis for the following study on the TEG module.
4.1. Effect of Heat Exchanger Structure
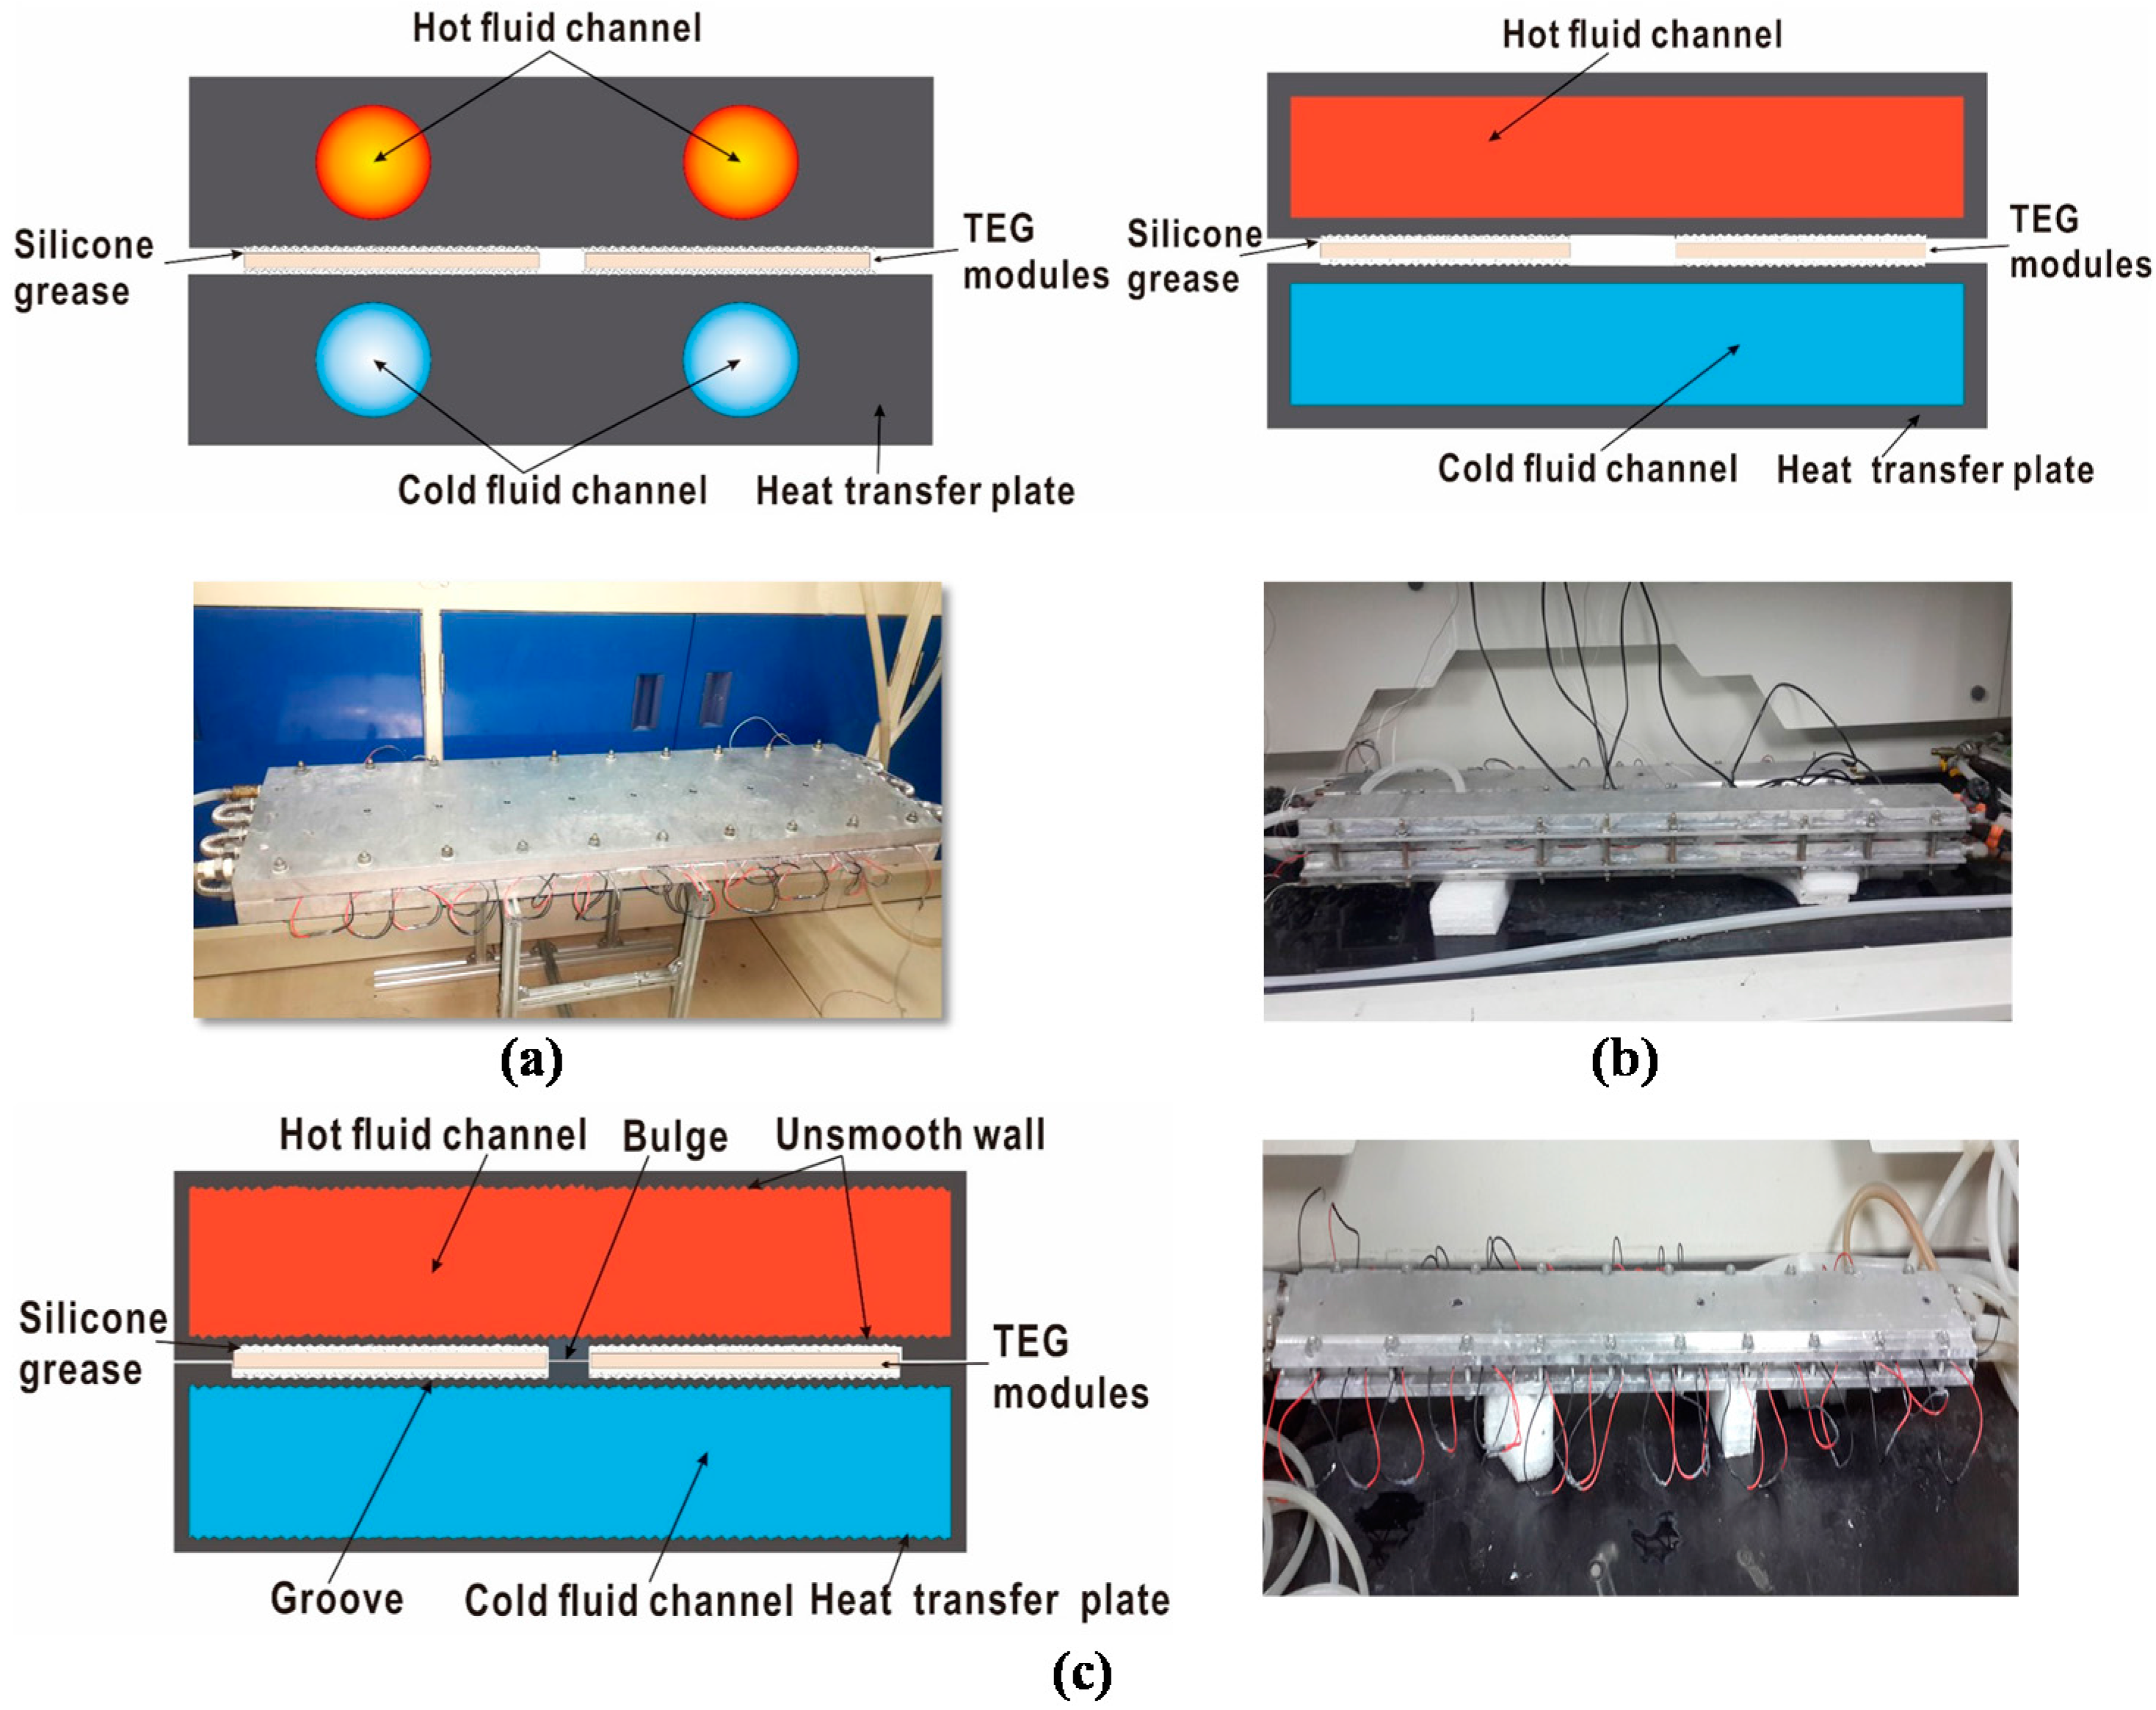
The heat exchanger surface has a direct relationship with the contact thermal resistance between heat exchanger and thermoelectric module. In addition, the fluid channel’s shape of the heat exchanger also affects the heat transfer efficiency. Therefore, three kinds of plate heat exchanger models with the same material but different structures were selected as the research object whose properties can be seen from the data in
Table 1. The schematic diagram and the structures of three models are shown in
Figure 5 and
Figure 6.
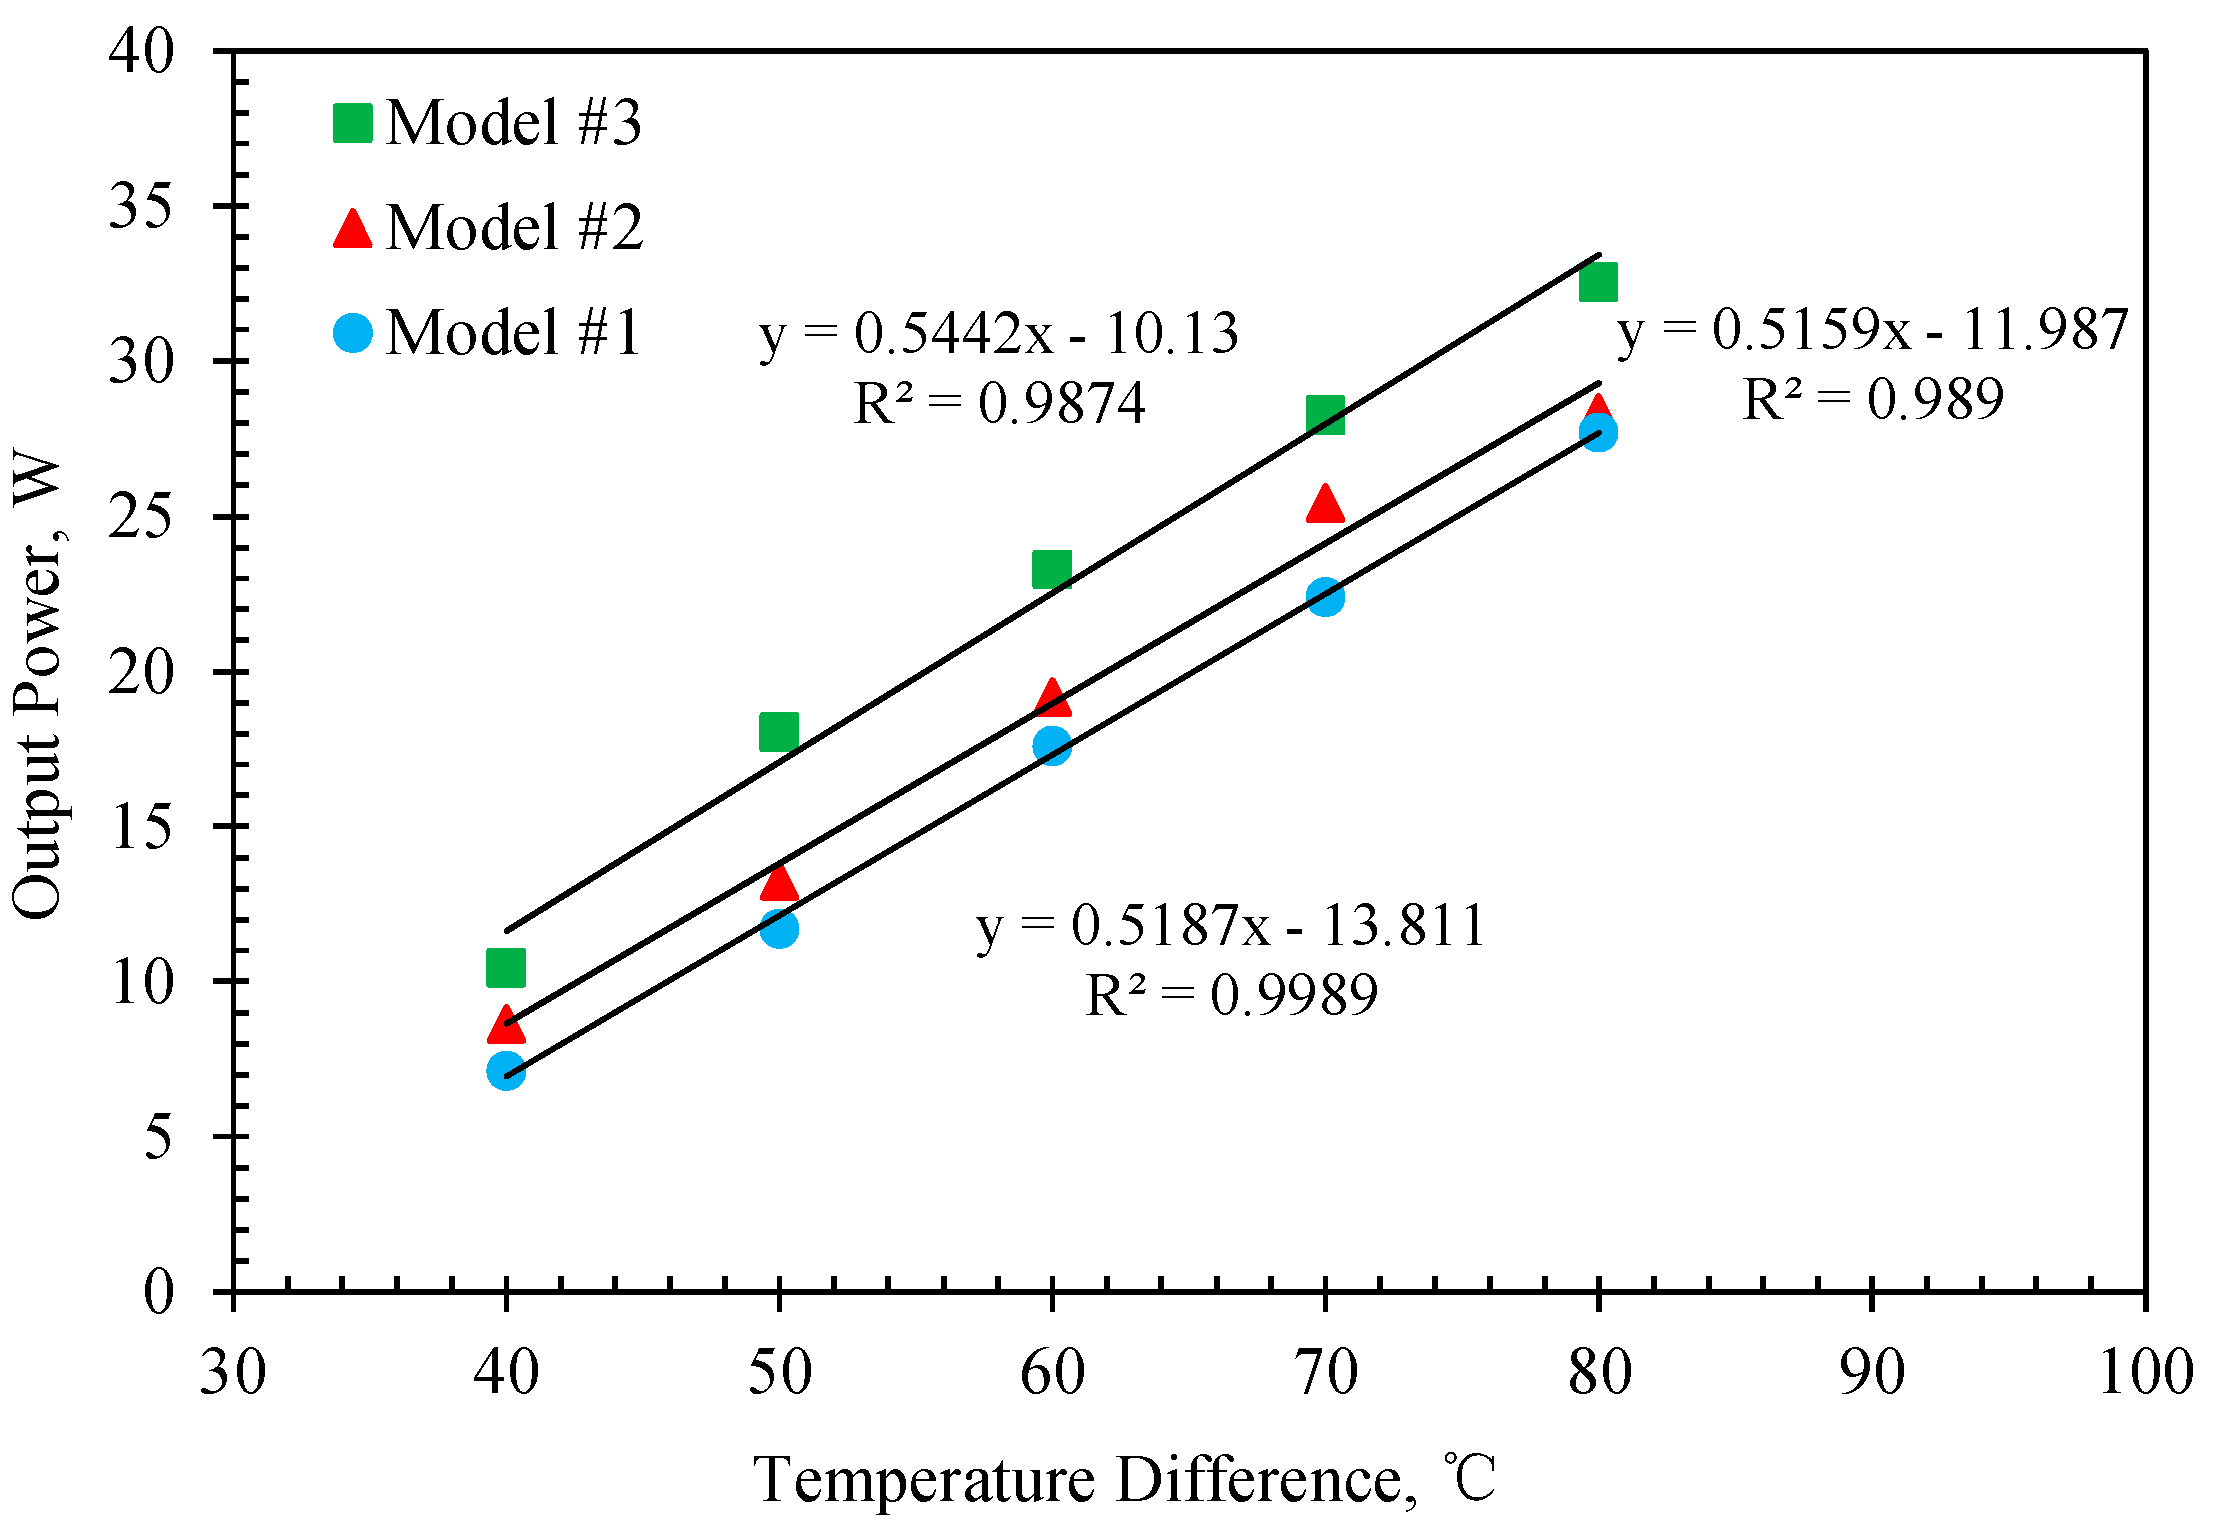
The output power of Models #1, #2 and #3 is tested at different
∆T from 40 to 80 °C, and the results are shown in
Figure 7.
Figure 7 indicates that the maximum output power of Models #1, #2 and #3 is 7.1, 8.6 and 10.45 W respectively for 40 thermoelectric modules at a
∆T of 40 °C. When the
∆T increases to 80 °C, the maximum output power of Models #1, #2 and #3 goes up to 27.7, 30.3, and 32.5 W respectively. These results suggest that the overall performance of Model #3 is more stable than that of Models #1 and #2. All the improvements of the heat exchanger are embodied in the structure design, and reflected in the level of power change of a heat exchanger model, which was composed of 40 thermoelectric modules only. The advantage of Model #3 will be enlarged greatly when a series of heat exchangers are assembled for a TEG system.
As shown in
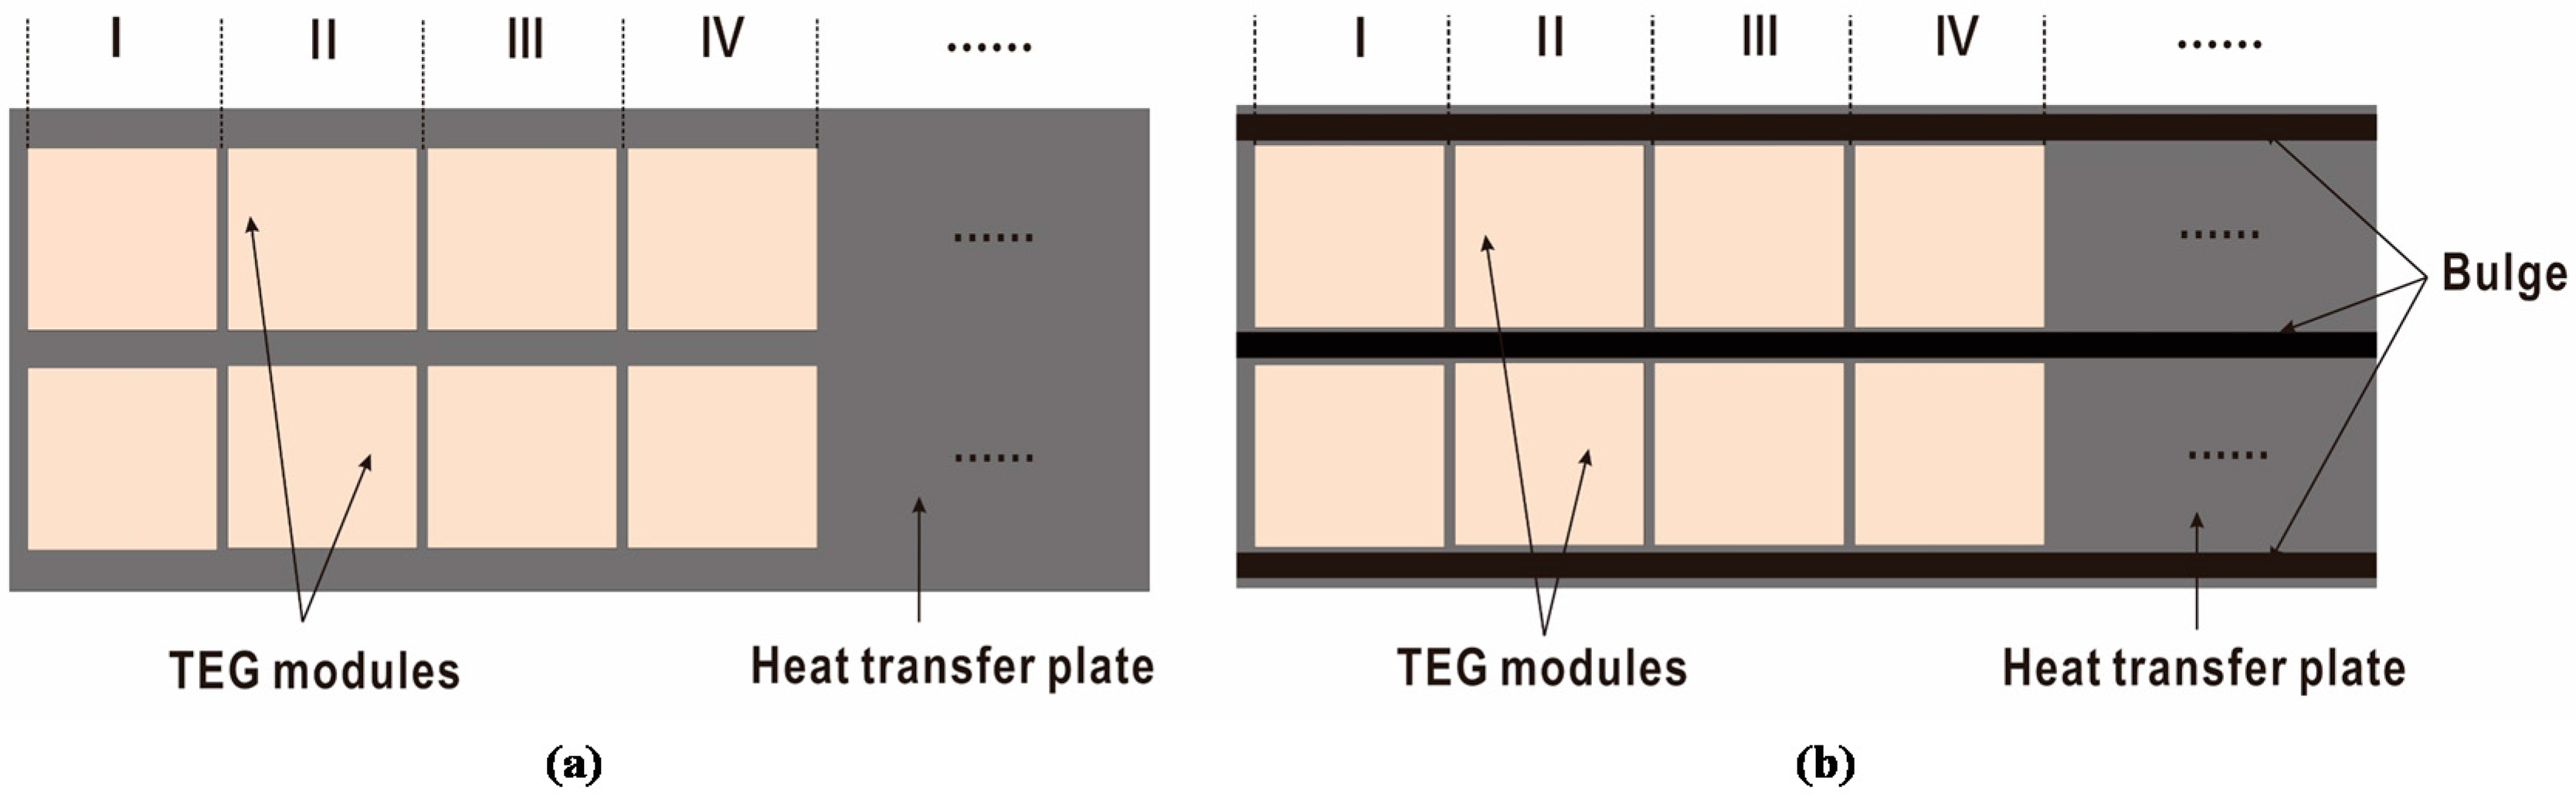
Figure 5a, the fluid channels of Model #1 are connected in series; the fluid flow direction was selected co-current (the heat fluid flow direction is the same as the cold fluid flow direction). The structure of Model #1 is relatively simple and the thicker wall limits the heat conduction, which reduces the thermoelectric conversion efficiency of the whole model. Thermoelectric modules on the surfaces of Models #1 and #2 are relatively loose, which can be seen from
Figure 6a.
According to
Figure 5b, the structure of Model #2 is comparatively reasonable, the larger volume of fluid channel cross-sectional area and the thinner wall thickness contribute to the heat conduction, which may improve the overall thermoelectric conversion efficiency to a certain extent. Nevertheless, the surface of the fluid channel is smooth, which may not help to increase heat transfer efficiency. Compared with Model #1, the problems of poor compactness between thermoelectric modules and heat exchanger in Model #2 are still not improved.
Based on Model #1 and Model #2, Model #3 employs embedded methods, and its structure diagram is shown in
Figure 5c. The thermoelectric modules were embedded in the bulge which was installed in the middle of the heat exchanger plate, as shown in
Figure 6b, and the space between the two bulges placed in two rows of the thermoelectric modules. The structure of Model #3 ensures the compactness between thermoelectric modules and heat exchanger when the pressure is applied to the heat exchanger, the thinner wall can increase heat conduction, the rough treatment inside the fluid channel makes the contact area of the fluid and the fluid channel increase greatly, all these measures contribute to the increasing conversion efficiency of TEG.
4.2. Effect of Heat Exchanger Reinforcement
The TEG system requires a high degree of compactness; besides conventional fixed methods which just reinforced pressure at either side of heat exchanger, the reinforcement measures also added pressure at the central part. This may improve the stress distribution uniformity and the compactness between thermoelectric modules and heat exchanger system. The value of
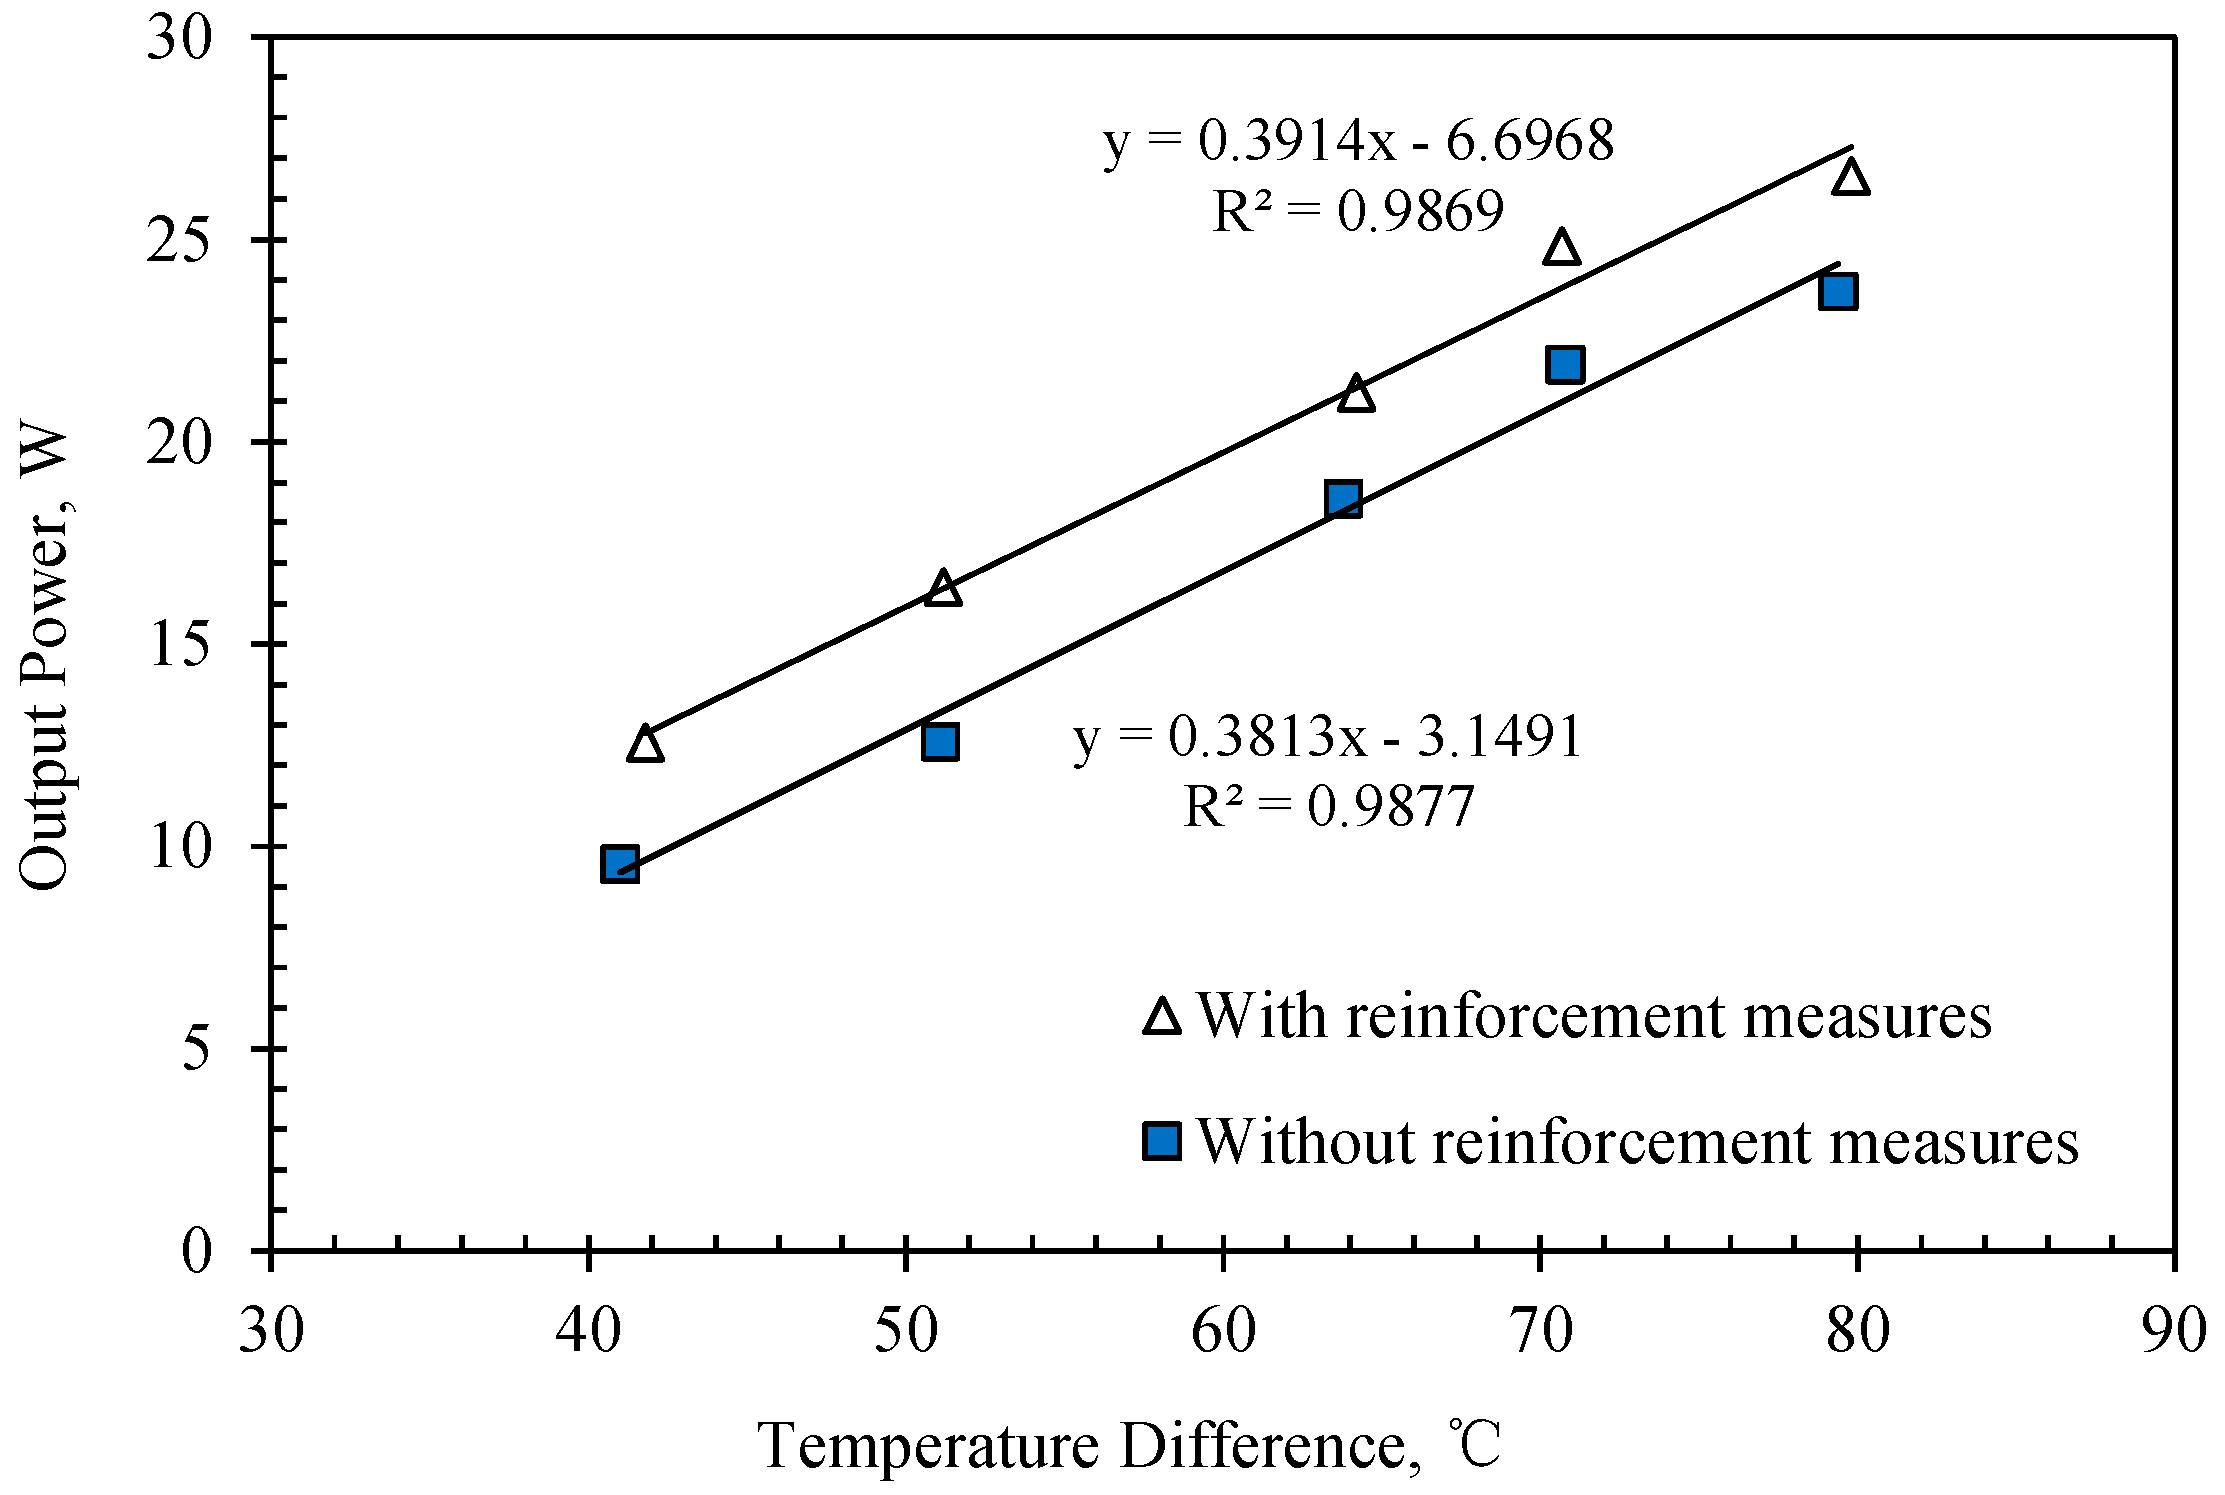
∆T was controlled and ranged from 40 to 80 °C, the results of the maximum output power before and after the application of reinforcement measures at the same
∆T for Model#1 is shown in
Figure 8.
Figure 8 indicates that the maximum output power is 12.5 W without reinforcement measures, and 16.4 W with reinforcement measures when the
∆T is about 50 °C. The maximum output power is 23.7 W without reinforcement measures, and 26.5 W with reinforcement measurements when
∆T is about 80 °C. According to the data above, the compactness between the thermoelectric modules in Model #1 was improved and the phenomenon of air gap was alleviated owing to the thermal resistance decreased after taking reinforcement measures. Therefore, the thermoelectric conversion efficiency and the output power of Model #1 were increased.
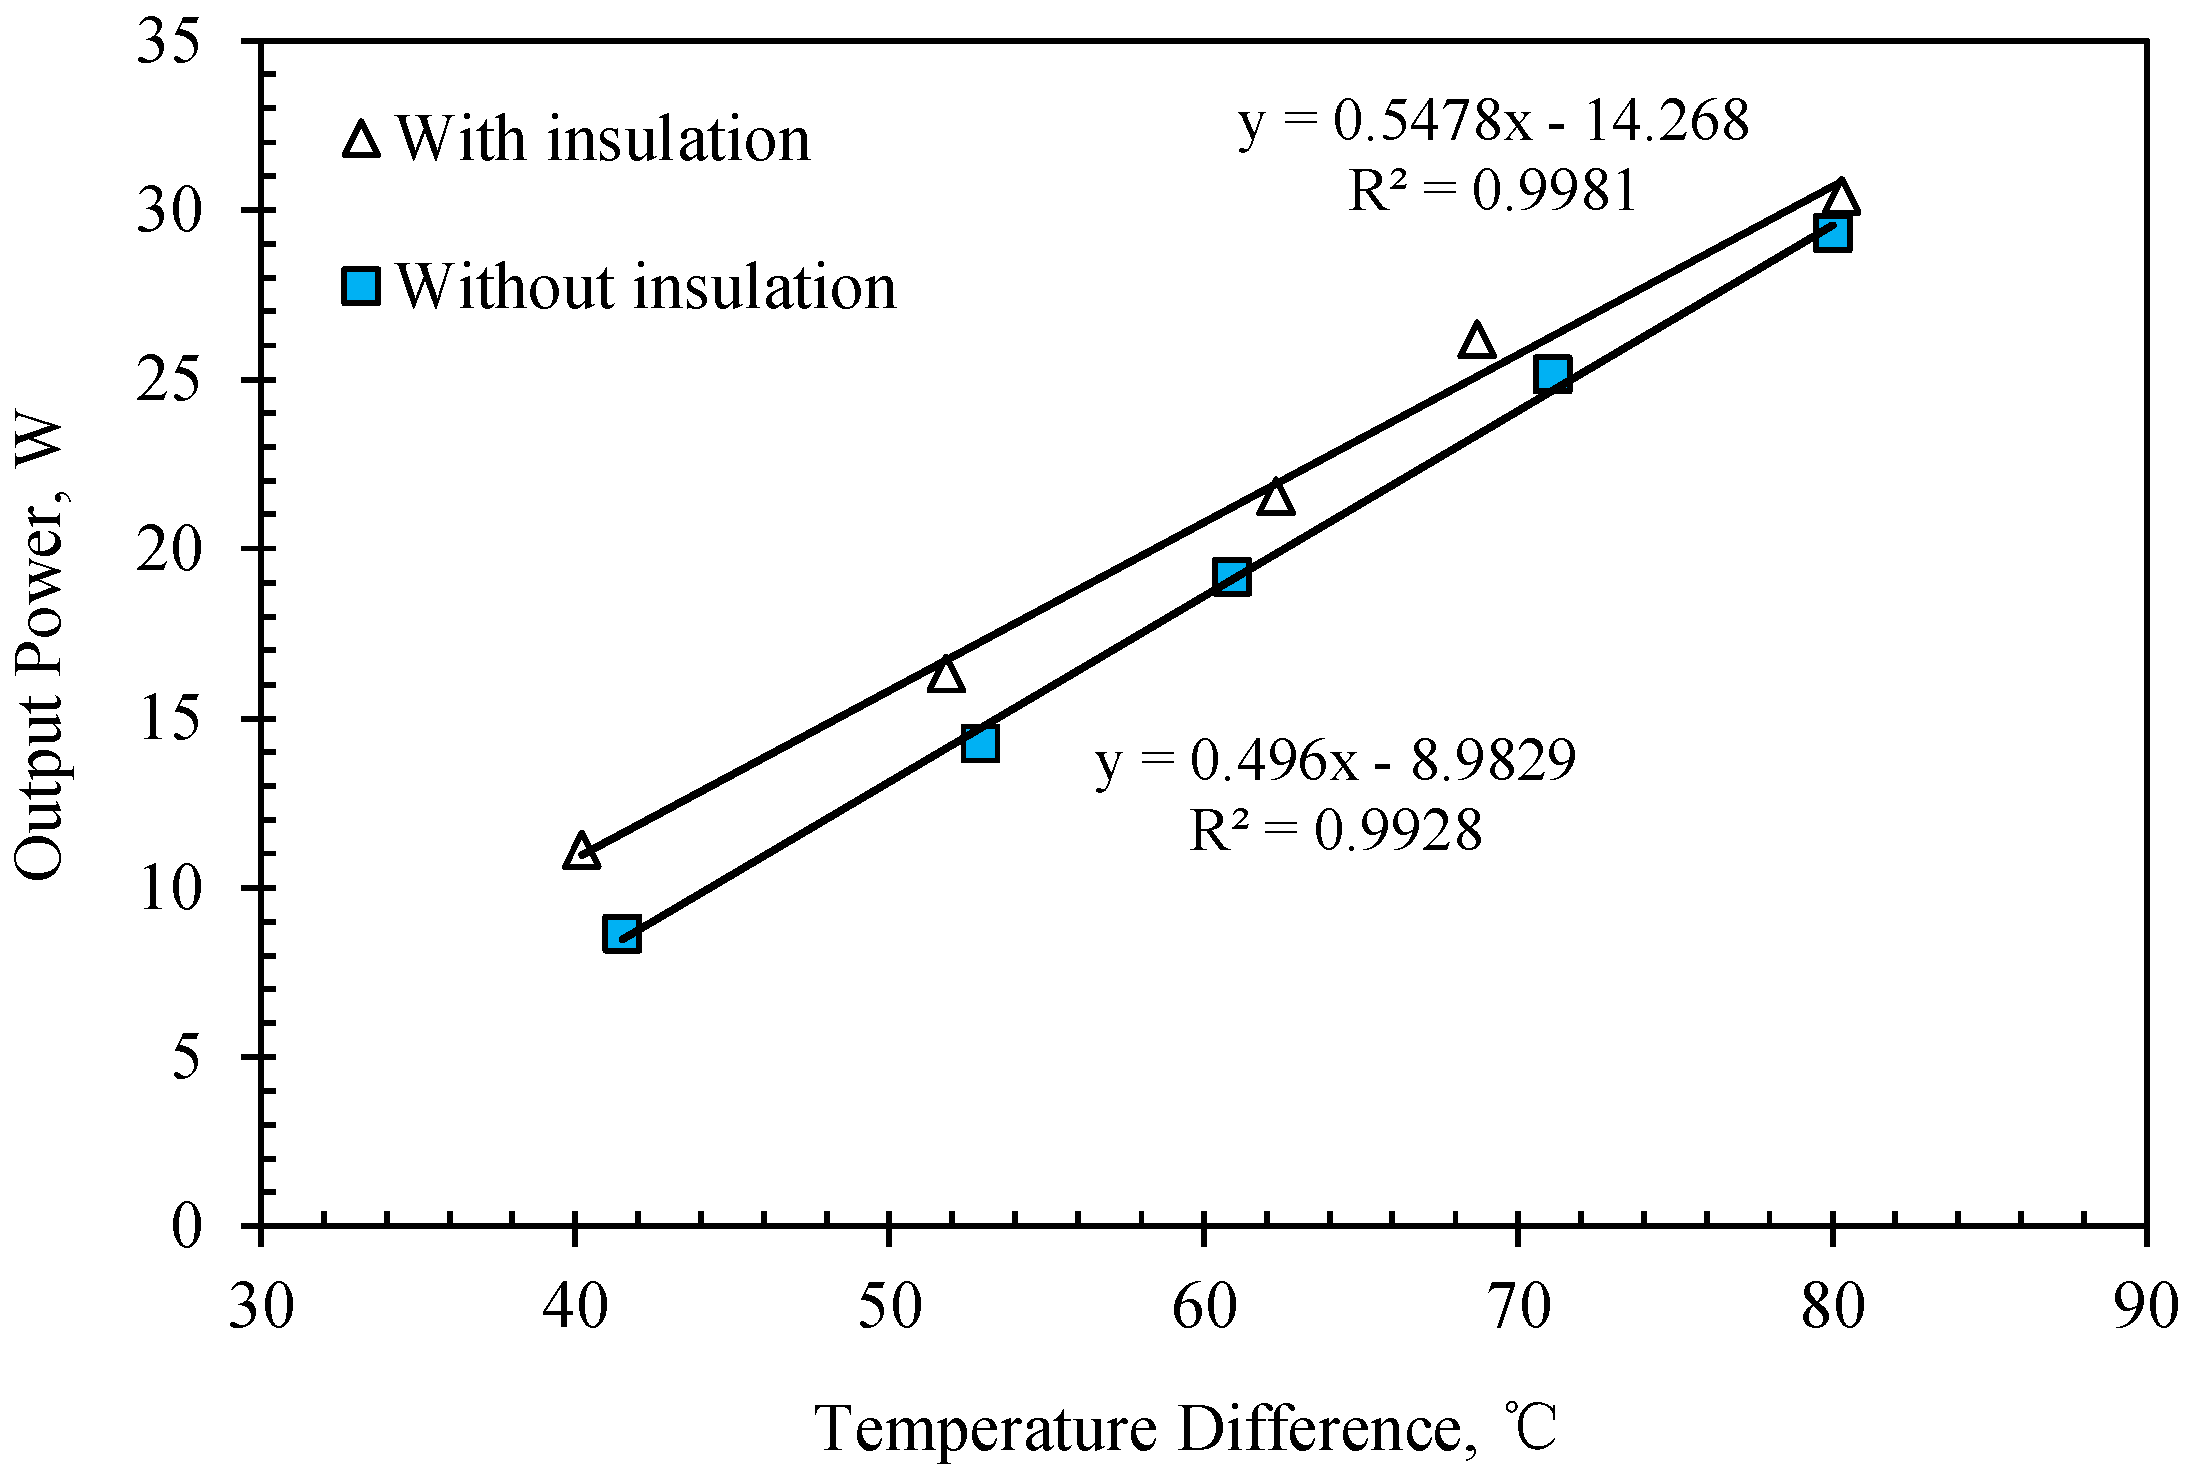
4.3. Effect of Heat Exchanger Insulation Measurements
A low temperature environment leads to a large amount of heat loss and a low heat energy utilization rate. Model #2, as shown in
Figure 5b, was selected as the carrier to study the influence of heat-insulation measurements on output power, the insulation material was filled in the space between the heat exchanger and the thermoelectric modules thoroughly, then tested the output power respectively with insulation material or not. Heat insulation measurements can improve the output power about 5% according to the data listed in
Figure 9.
4.4. Effect of Thermoelectric Module Connection Methods
Thermoelectric modules are connected in series or parallel. In practical applications, when the same number of thermoelectric modules are connected, the more the thermoelectric modules are in series, the higher voltage is generated in the closed circuit, which reduces the voltage loss.
Model #1 was chosen as carrier to study the effect of the connection method between the thermoelectric modules on the output power. In the experiments, the
∆T was maintained at 80 °C unchanged, the connection method was selected as
Table 2, and the output power was obtained. The results are demonstrated in
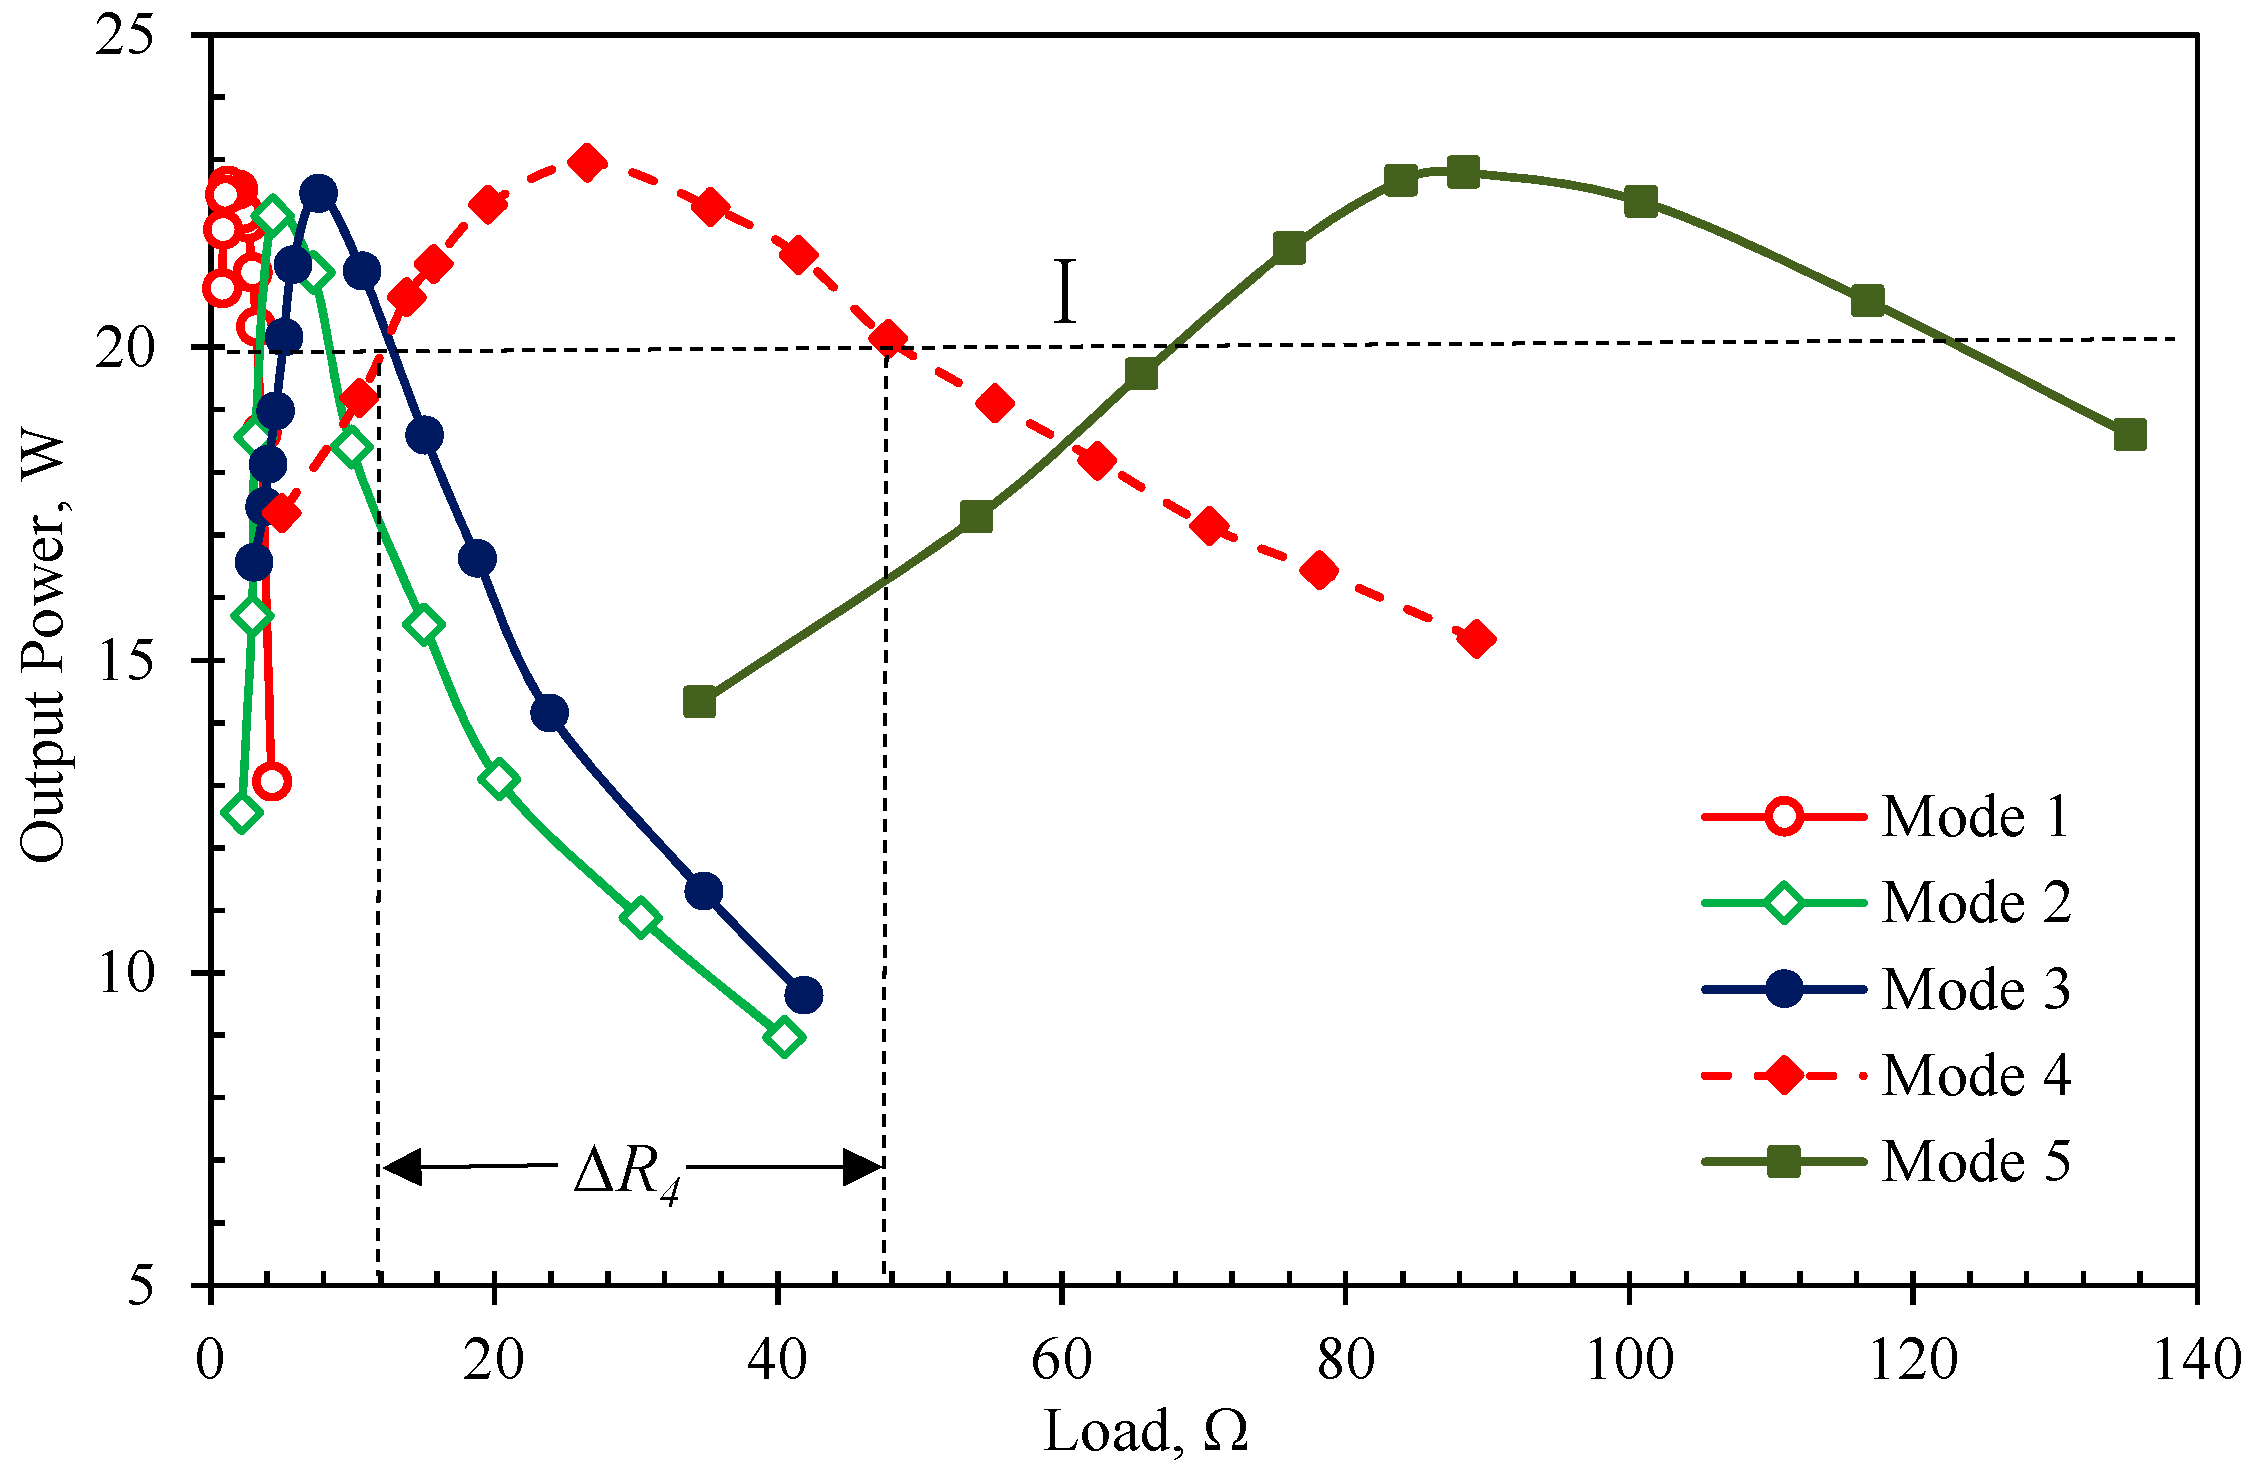
Figure 10.
The experimental data are briefly summarized as follows: the peak output power of Modes 1, 2, 3, 4 and 5 is 22.57, 22.1, 22.46, 22.95 and 22.79 W respectively, and the corresponding optimum resistances are 1.18, 4.38, 7.59, 26.56 and 88.29 Ω.
In order to study how the corresponding load changes when the peak output power is reduced about 10%, we intercept the corresponding load for the 20 W shown as straight line I (
Figure 10), and the results are listed in
Table 3.
It can be seen from
Table 3 that
ΔR1 is 3.06 Ω as 40 thermoelectric modules connected in Mode 1, while
ΔR5 is 50.8 Ω as 40 thermoelectric modules connected in Mode 5, and
∆Ri also rise with the increasing number of thermoelectric module in series. These experimental results indicated that the connection modes between the thermoelectric modules may not affect the peak power of TEG when the quantity is the same.
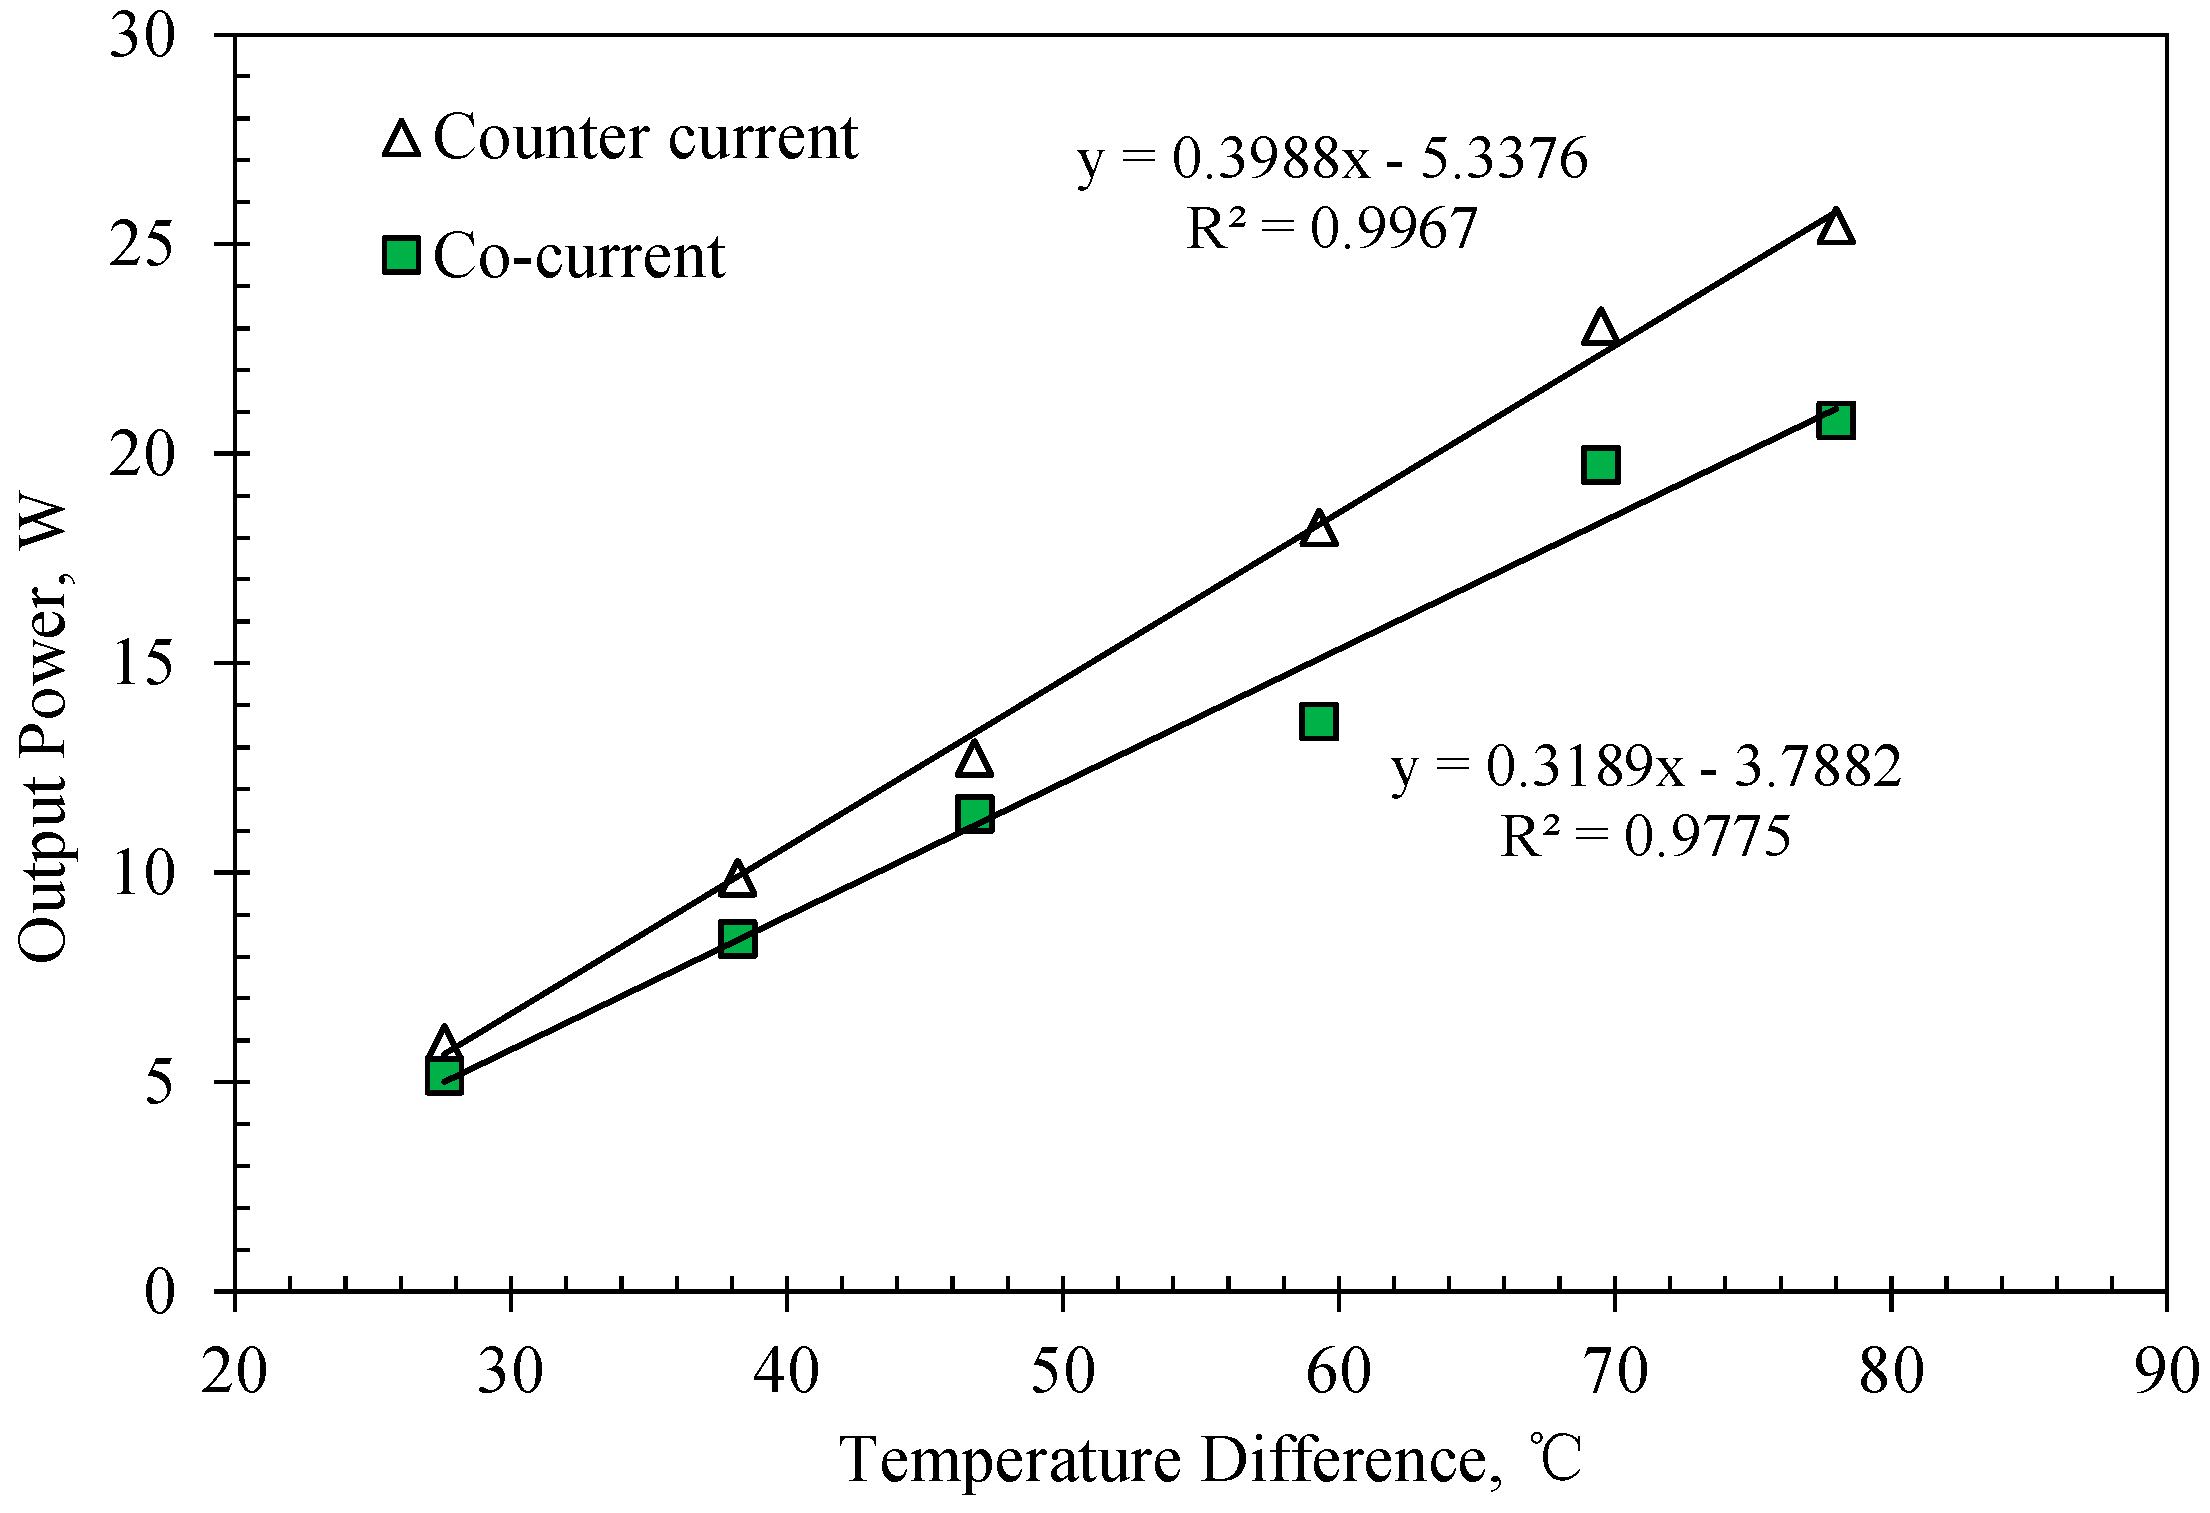
4.5. Effect of Fluid Flow Direction
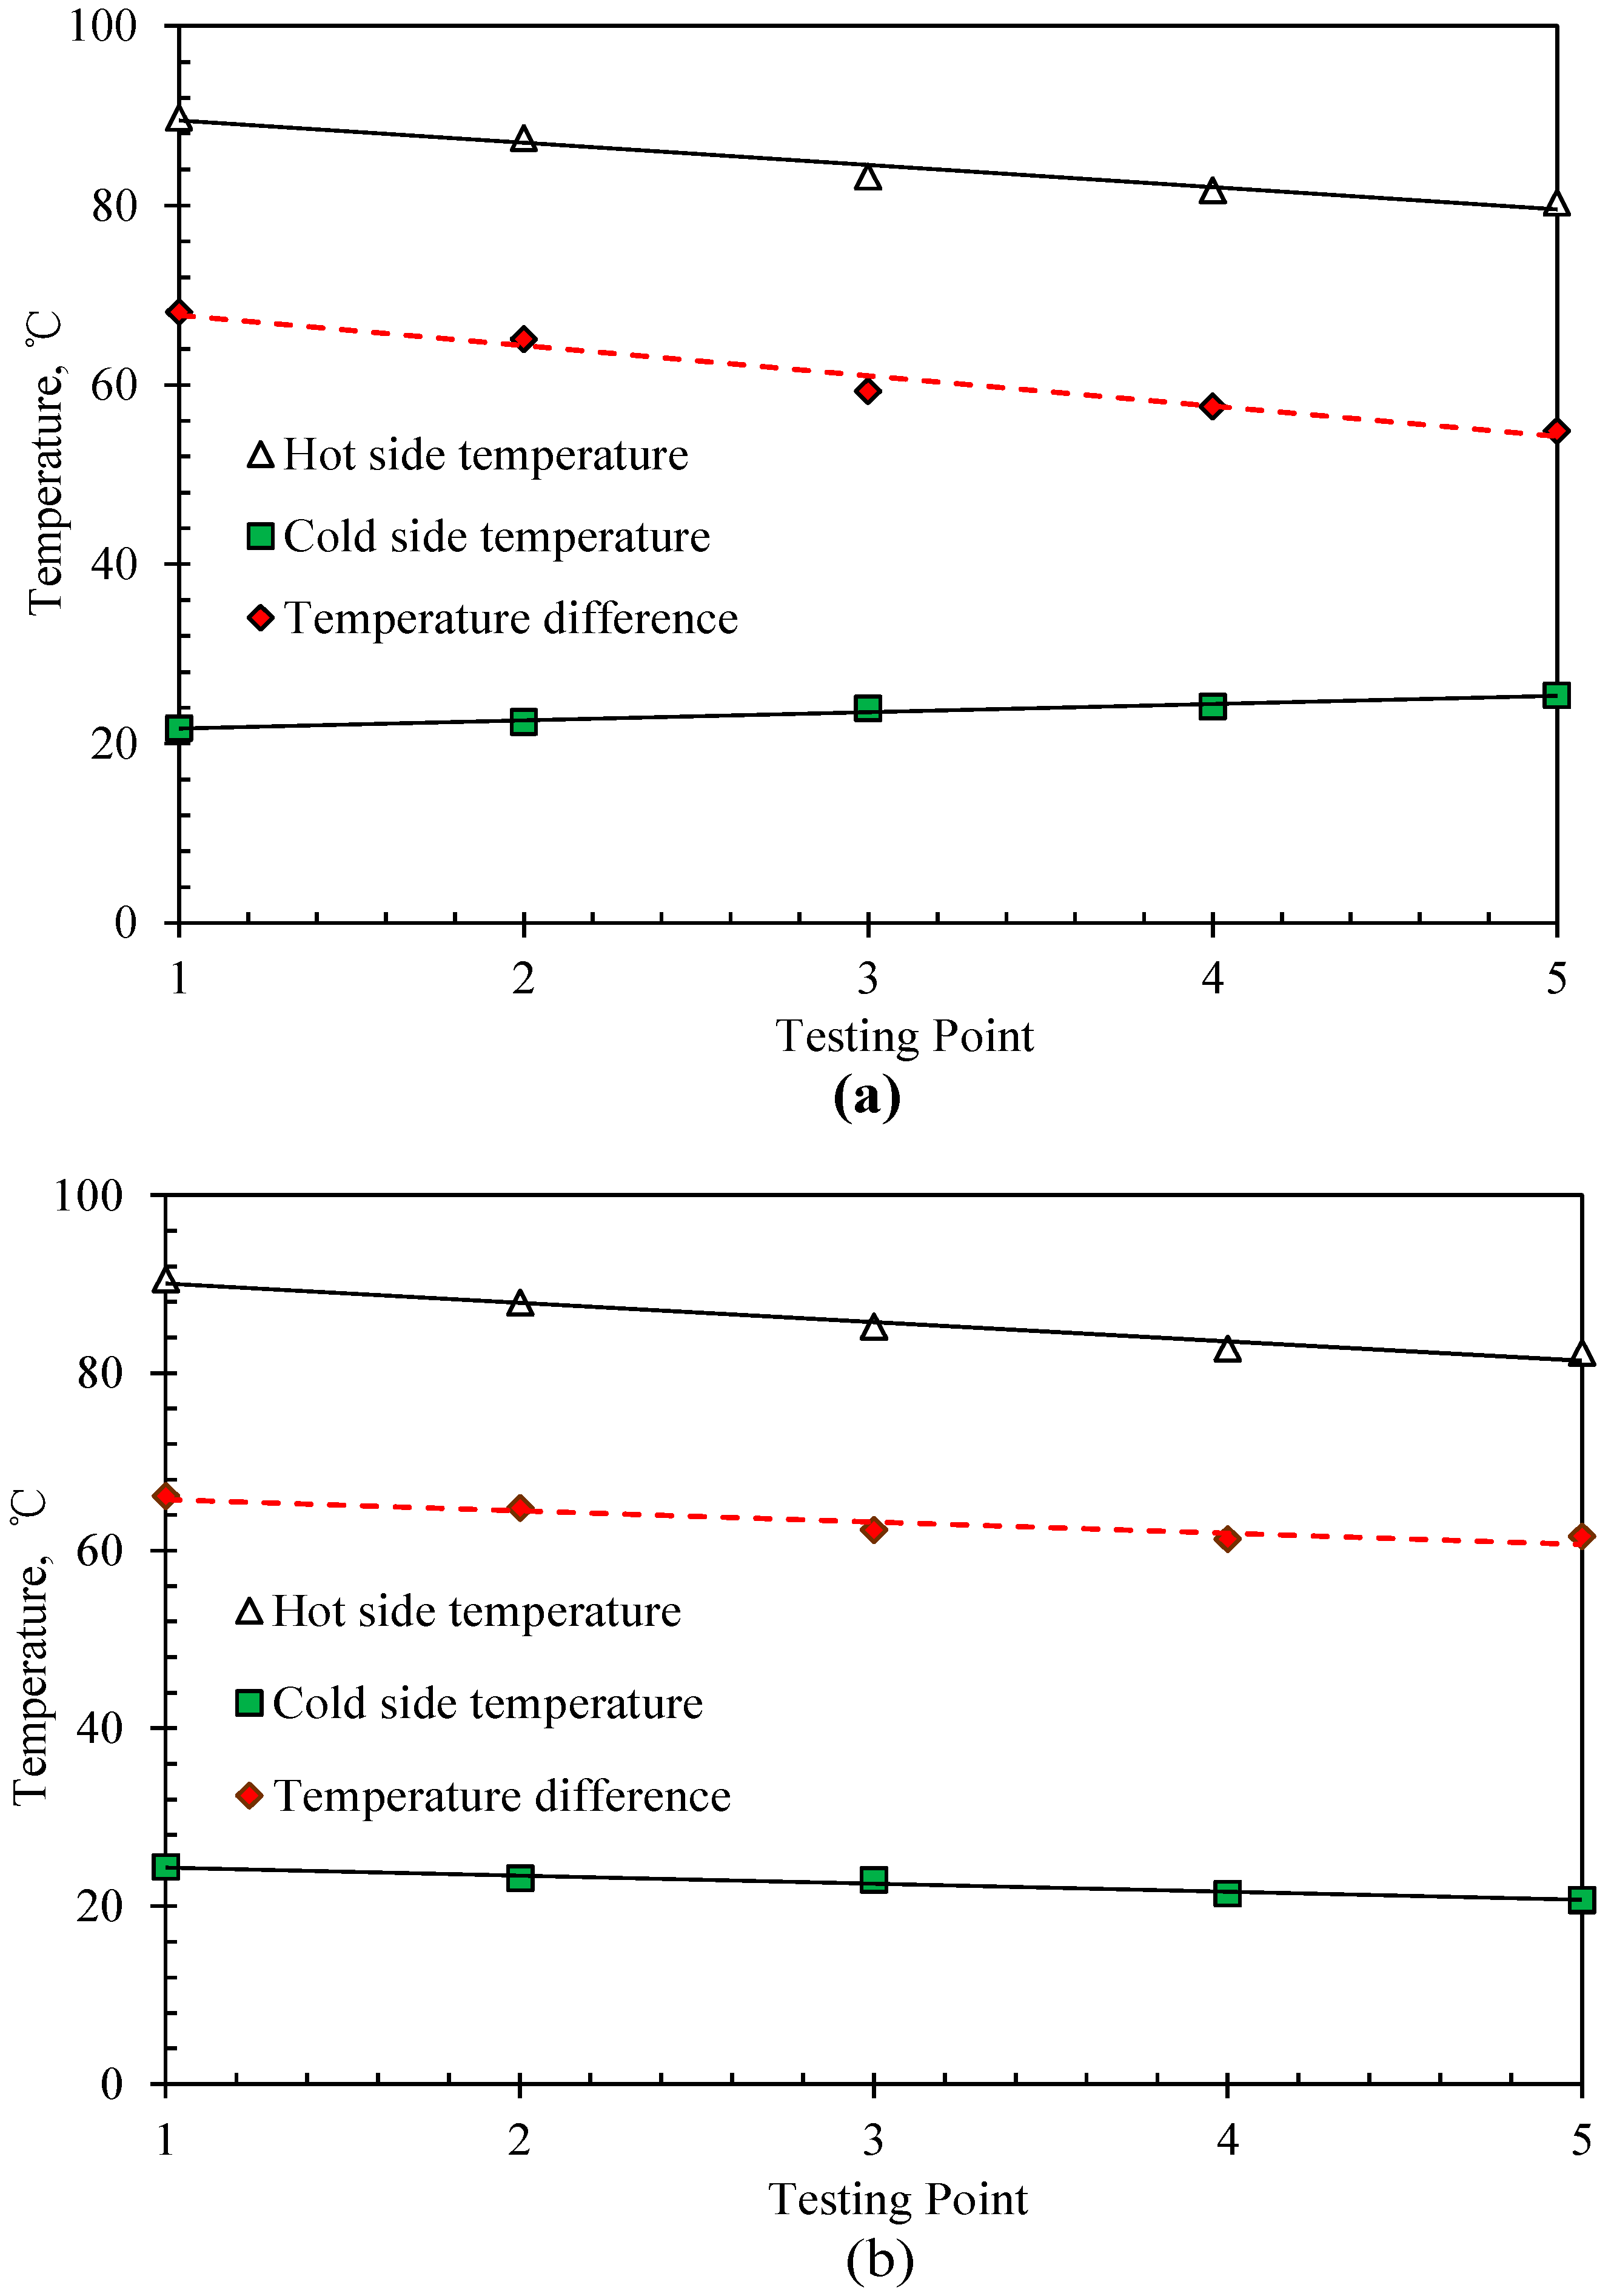
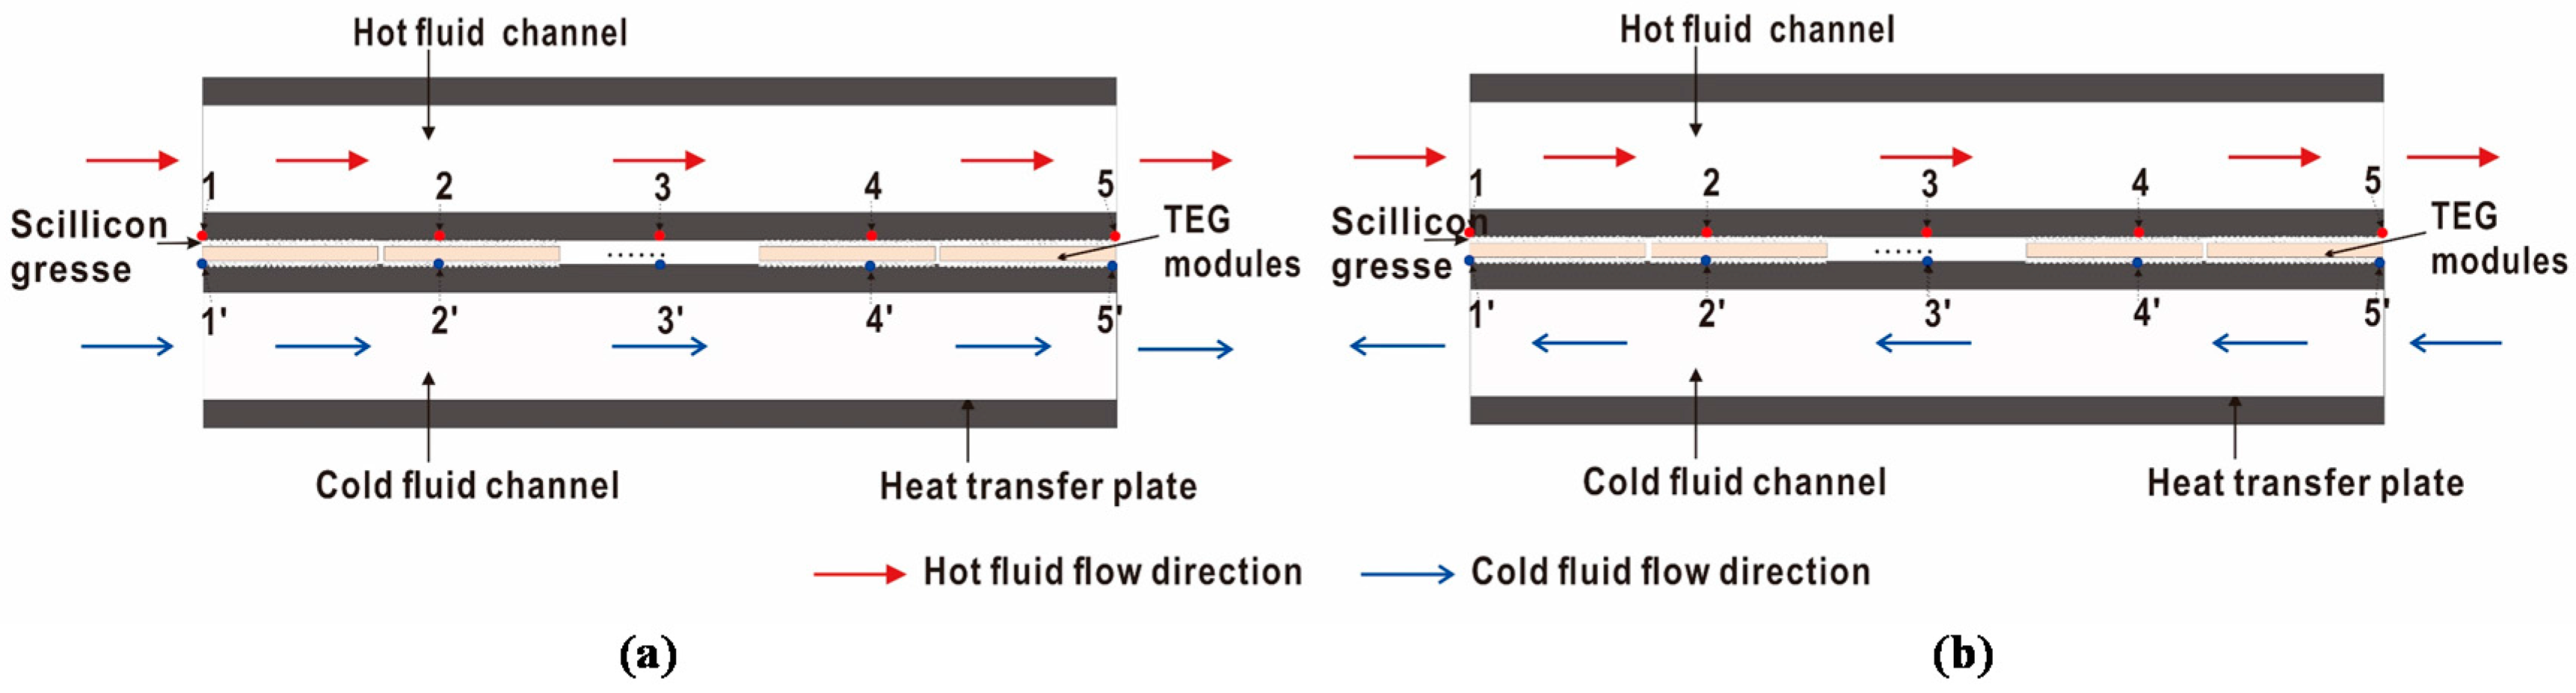
Figure 11a shows the case in which the heat fluid flow direction is the same as the cold fluid flow direction, that is, co-current, and the opposite is counter current (
Figure 11b). Owing to the thinner wall of Model #2 and relatively stable fluid flow in the cavity of the heat exchanger, Model #2 was chosen as the carrier to investigate the influence of fluid flow direction on the output power. In the experiments, we controlled the
∆T from around 40 to 80 °C, held the flow rates through the hot and cold sides of the heat exchanger constant, selected Mode 5 as the connection method between the thermoelectric modules, and then tested the output power of Model #2 at the different
∆T in the co-current and counter current. The experimental results are shown in
Figure 12.
Figure 12 demonstrates that the output power of the counter current is much higher than that of the co-current for the same TEG, when
∆T is the same. The thermal loss of the hot side and the thermal absorption of the cold side lead to this phenomenon when the TEG is working. For the hot side, the temperature at the inlet is higher than that at the outlet, while it is opposite for the cold side. Counter current may result in a closer temperature difference at the inlet and outlet, but co-current may enlarge this temperature difference (inlet temperature difference is greater than that at the outlet). The output voltage and current is different when the temperature difference of each module is not the same (as shown in
Figure 13), and it leads to more consumption of thermal energy and less output power. Under the same conditions, the output power based on counter current flow mode is greater than that in the co-current flow mode.
4.6. Effect of Flow Rate
After the wall of the fluid channel in Model #3 has been treated to be rougher, the velocity of the fluid passing through the fluid channel is affected. As the influence of the volumetric flow rate at the inlet of the heat exchanger on the output power is likely to be more distinct, Model #3 was chosen as the carrier to study the relationship between the flow rate of the inlet and the output power of TEG.
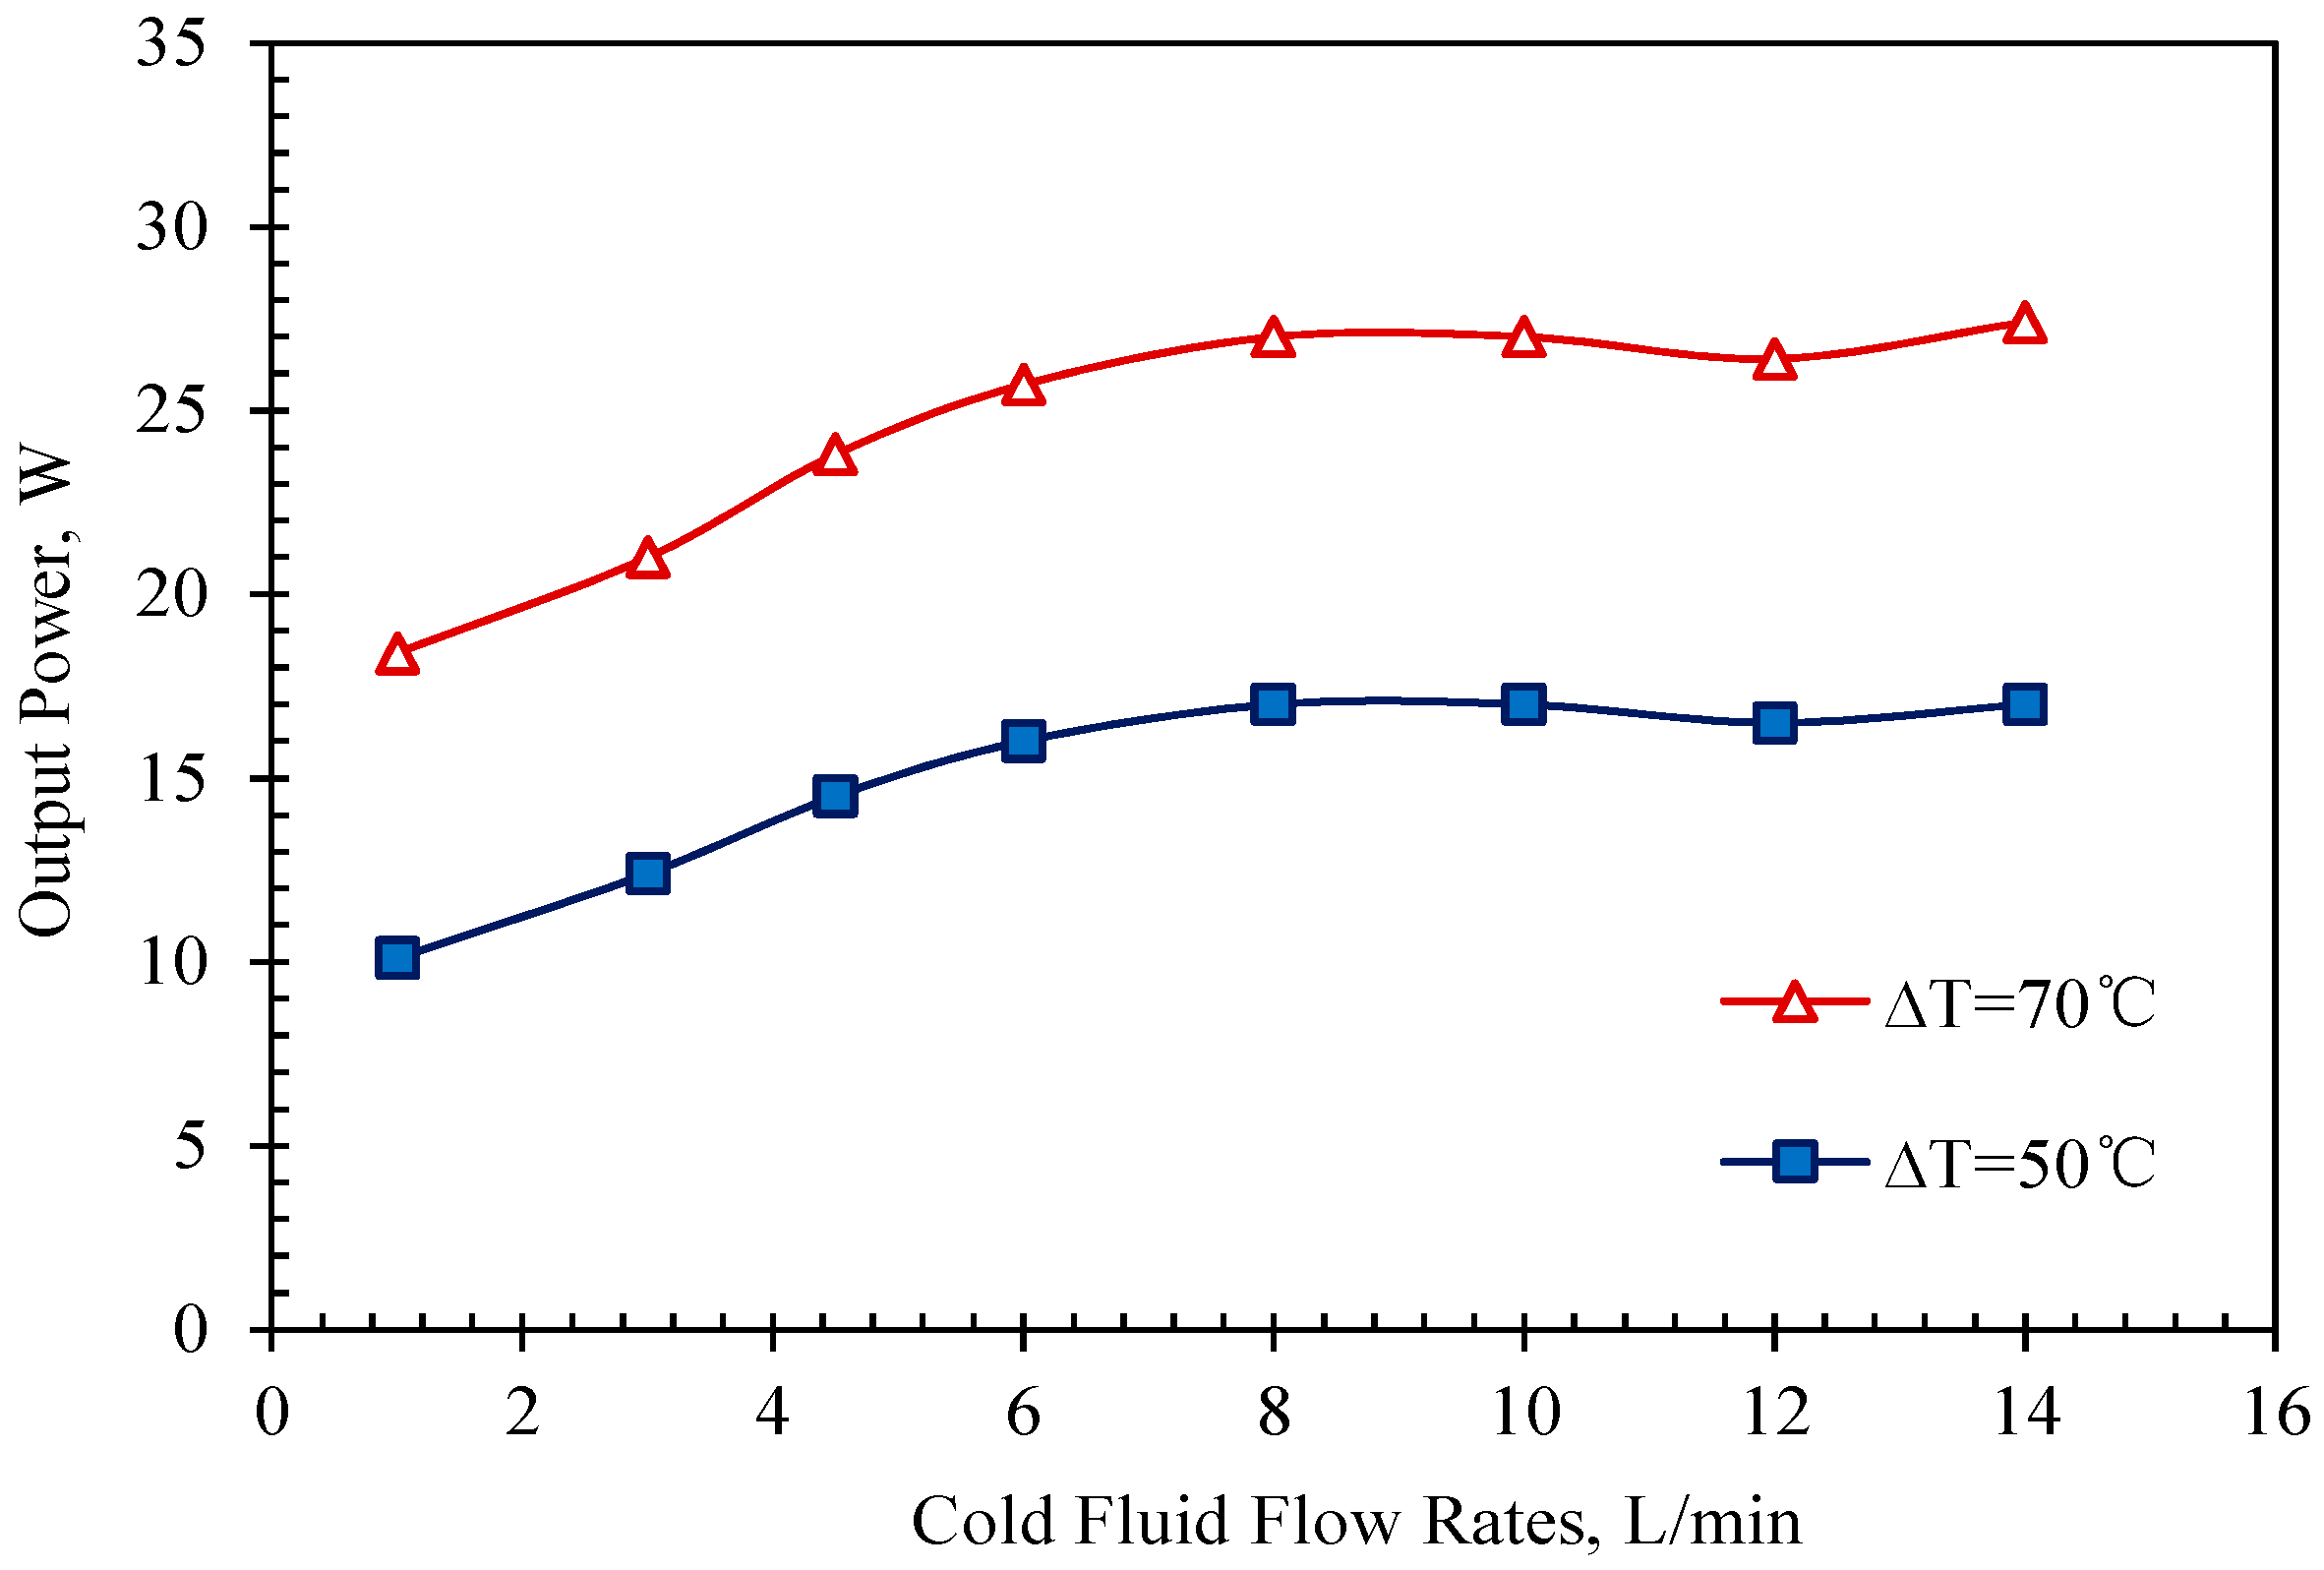
In the experiments,
∆T was maintained at a constant 50 °C, the fluid flow direction in the heat exchanger plate was counter current. On one hand, the hot side inlet flow-rate was controlled at 18 L/min unchanged, only adjusting the cold side inlet flow-rate from 1 L/min to 14 L/min, and testing the output power of Model #2 at each cold side flow-rate. Then
∆T was kept at around 70 °C, the above experiment was repeated, and the experimental results are shown in
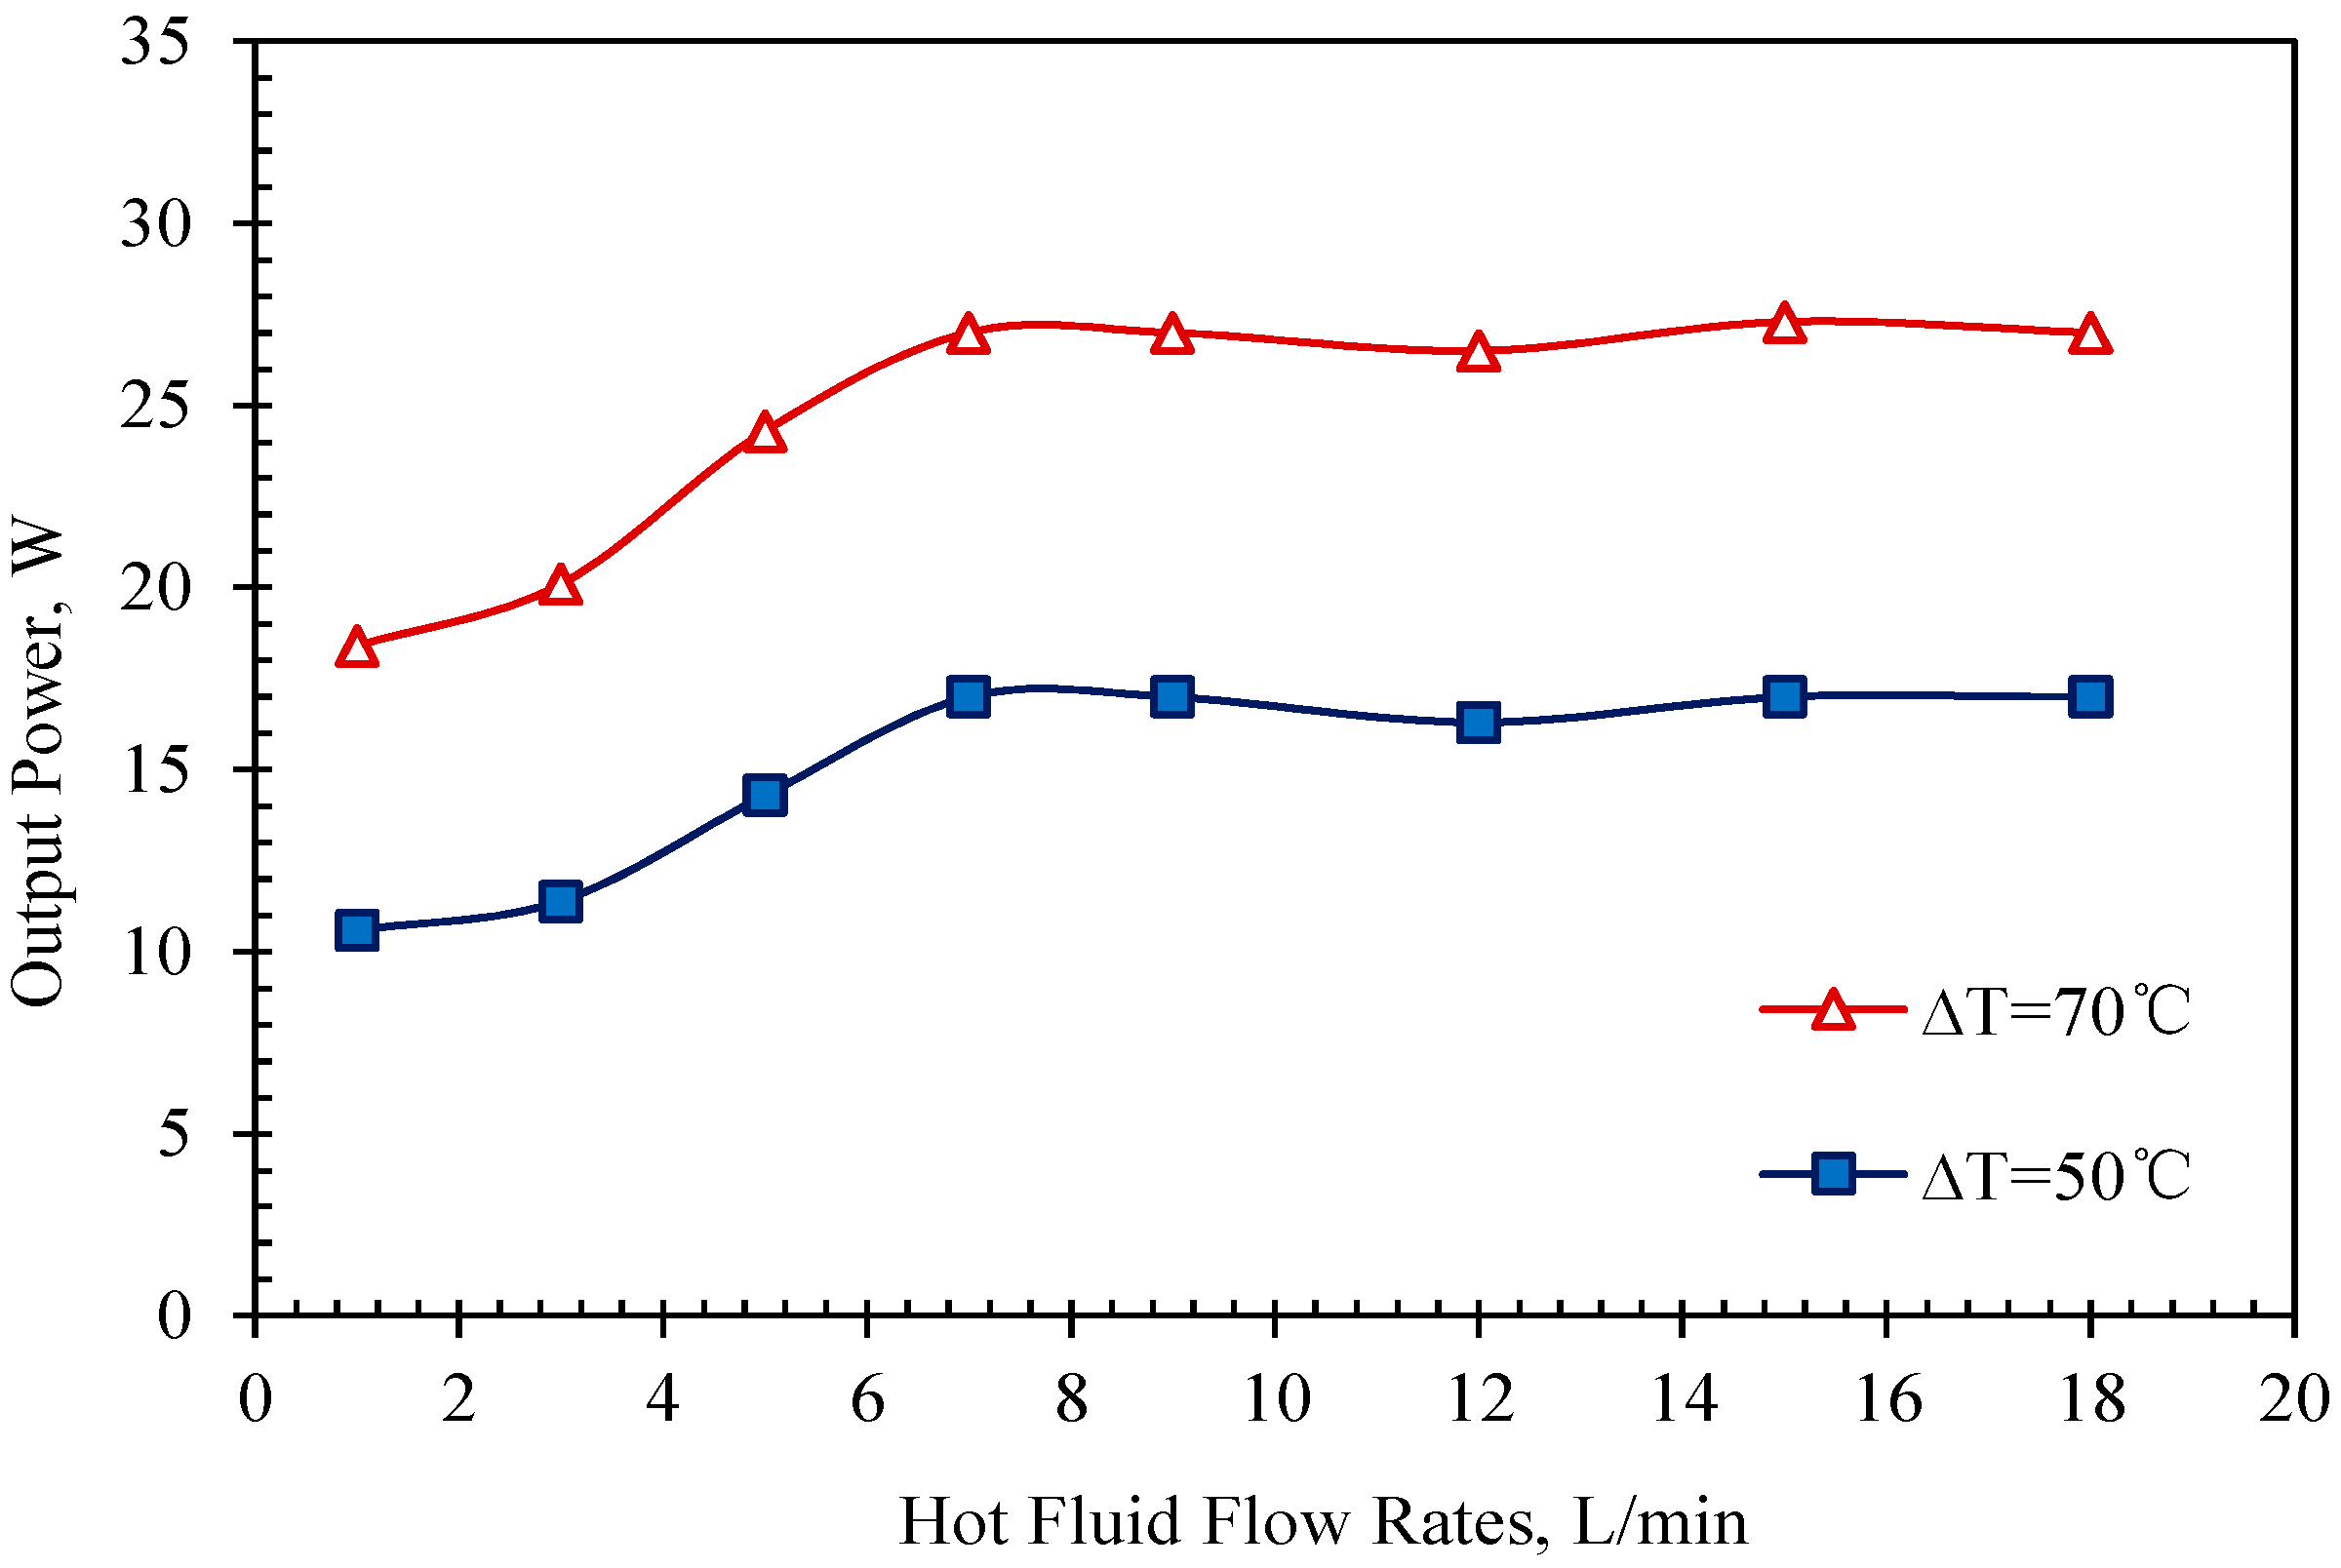
Figure 14. On the other hand, we still controlled the
∆T in Model #2 at 50 °C but held the cold side inlet flow-rate constant, changing the hot side inlet flow-rate from 1 L/min to 18 L/min, and tested the output power of Model #2 in each flow rate at the hot inlet. The above experiments were repeated while keeping
∆T stabilized at around 70 °C. The experimental results are shown in
Figure 15.
The inlet flow-rate of the hot side was constant, the output power increases first and then slowly becomes constant with the increase in the cold side inlet flow-rate. The hot inlet flow-rate is 18 L/min and the cold inlet flow-rate is 8 L/min, the maximum output power of Model #3 is 26.8 W under a
∆T of 70 °C (see
Figure 14).
According to
Figure 15, the output power also increases first and then tends to be stabilized with the increase of the hot side inlet flow-rate when the cold side inlet flow-rate is unchanged. When the
∆T is 70 °C, the cold side inlet flow is 11.7 L/min and the hot side inlet flow is 7 L/min, the output power of Model #3 is maximized around 27.1 W.
In summing up, when the inlet flow rate of the cold (hot) side of the heat exchanger is constant, with only the flow rate at the hot (cold) side increasing, the output power of the Model #3 tends to be stable. The rise in output power is due to the fact that the heat transfer is improved while the inlet flow was increasing, but if the inlet flow continues to increase, the heat transfer tends to be balanced and reached the maximum. In TEG devices, there may exist an optimal flow rate. Fluid flow rates exceeding the optimal value may not bring more power output, but increase the self-consumption.


