1. Introduction
Buildings account for approximately 40% of final energy consumption in the European Union (EU), making them a central focus of the EU’s energy efficiency policy. The Directive on the Energy Performance of Buildings [
1] is the main legal instrument for meeting targets for energy efficiency in buildings by 2020.
Article 9 of the Directive establishes as a specific objective that, by the end of 2020, all new buildings must have very low or nearly zero energy demands. The contribution of renewable energies must be significant. The EU provides guidelines [
2] that will help member states develop plans for increasing the number of nearly zero energy buildings.
Two essential attributes of air conditioning systems intended to provide occupants of a building with good air quality and thermal comfort are the supply of ventilation air and moisture control. Dedicated outdoor air systems (DOASs) are able to meet these requirements [
3]. DOASs can be designed to supply 100% of the outside air specified by the standard [
4] and to meet the latent load of the room with dry air. However, a DOAS supplying the ventilation air required by the standard may supply no more than a small fraction of the air delivered by an all-air system, for example, variable air volume (VAV). Therefore, it is rarely able to meet the space sensible load, thus requiring parallel sensible cooling equipment [
5].
Some parallel refrigeration equipment can neutralize the latent load (e.g., fancoils). Others should not do this in order to avoid condensation on cool surfaces (e.g., chilled ceilings). Even when terminal equipment can remove moisture, drainage pans can become an infection amplifier and negatively affect indoor air quality [
6].
Therefore, a DOAS should be assigned the task of removing the latent load of both outdoor air and occupied space. Parallel cooling equipment (i.e., a vapor compression system) provides only the sensible cooling required by the conditioned space. The possibility of using an evaporation temperature above the air dew temperature improves the efficiency of the cooling system.
The most common method of removing moisture in a DOAS is to cool the air below its dew point. An alternative method for removing moisture from the air is the use of solid desiccants. The most common application is via the rotating wheel, a cylindrical matrix impregnated with a solid desiccant [
7,
8].
Buildings that have thermostatically controlled refrigeration equipment may have difficulty controlling moisture. Excess humidity can become a problem in those hours when the sensible load is low but the latent load remains high. Henderson [
9] concludes that, unless the operating time exceeds 40% of every hour, the removal of moisture by conventional vapor compression equipment is negligible. A compressor does not run long enough to make condensed moisture actually drip off the coil and into the drain. It evaporates back into the air from the coil surface.
The process (ventilation) air leaving the desiccant wheel (DW) is dry but hot. Therefore, it is common that a DOAS includes a cooling coil. The position of the cooling coil relative to the DW determines the temperature required for regeneration of the desiccant [
10,
11]. In some cases, the opportunity to regenerate the desiccant at low temperatures means that the heat produced by the condensation process of the refrigeration equipment can be used for this purpose.
Therefore, it makes sense to equip a DOAS with a vapor compression refrigeration system along with a desiccant wheel. The process air is passed through the evaporator to compensate for the heating experienced on the desiccant wheel. The regeneration air is passed through the condenser.
Instead of an evaporator or cooling coil, an evaporative cooler may be employed to cool the process air passing through the desiccant wheel. However, the size of the system then becomes much larger than that of a conventional cooling system and its efficiency is reduced by the parasitic consumption of power required to overcome the pressure drops in its components [
12].
Systems that employ solar energy collectors to supply regeneration heat have also been studied [
13,
14,
15], but the cost of solar equipment is high. Transient System Simulation Tool (TRNSYS) was used in the design of the autonomous desiccant system of the Chamber of Trade and Commerce for Southwest Germany in Freiburg [
16]. The estimated primary energy savings were about 30% compared to a conventional compression chiller used as the reference system. The specific cost of the system was €3961 per kilowatt of installed cooling capacity.
The coupling of desiccant-based heating, ventilating and air conditioning (HVAC) systems with small scale natural gas-fired cogenerators has also proven to be possible since thermal energy required for desiccant regeneration can be conveniently recovered from the microcogenerator [
17].
A novel aspect of this work was the construction of a DOAS equipped with a customized (not off the shelf) vapor-compression refrigeration system and a desiccant wheel downstream of the cooling coil. The development of a model of the DOAS in the TRNSYS environment was also a novelty.
The objectives of this work were to
build a DOAS equipped with a DW and vapor compression refrigeration system;
develop a system model that allows its implementation in a building simulation tool (TRNSYS);
validate the model with experimental data.
2. Materials and Methods
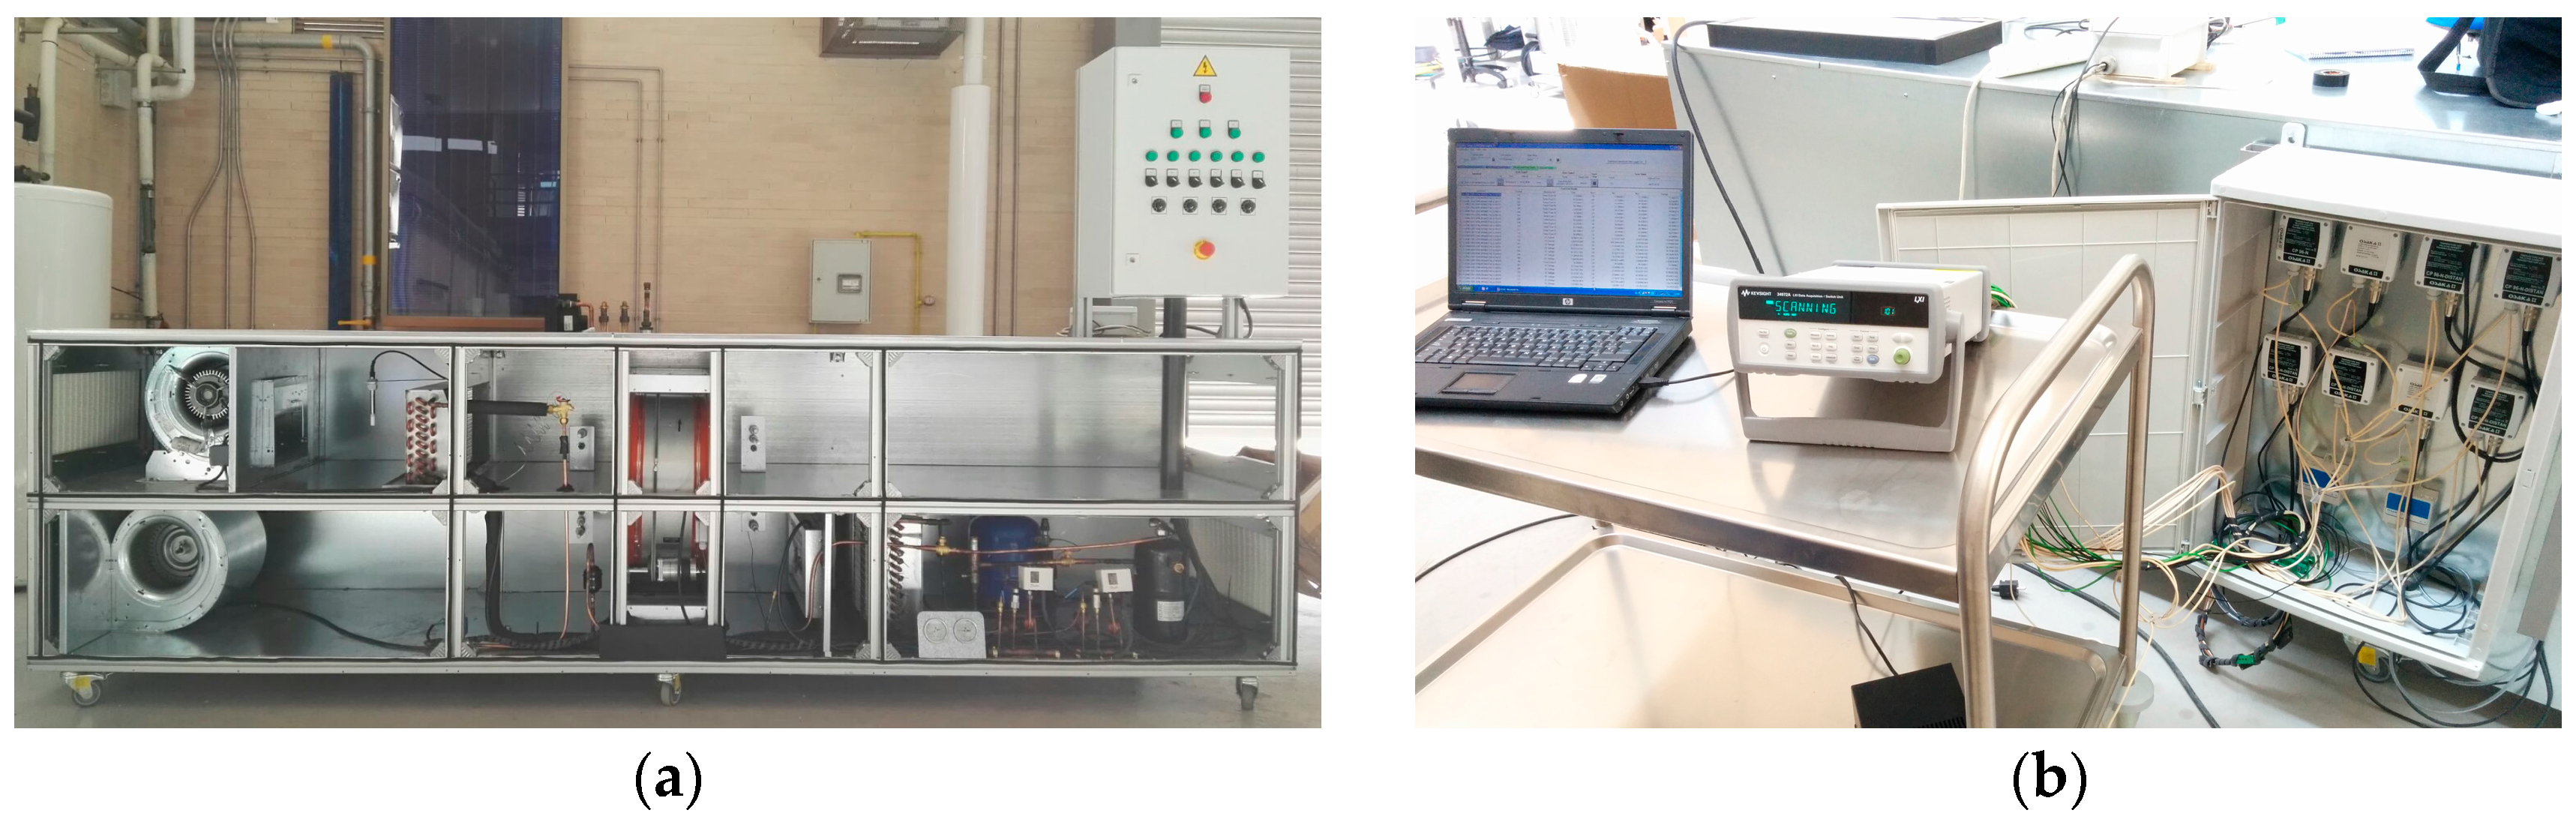
The DOAS that serves as the reference case for this study was constructed at Miguel Hernández University in Elche.
Figure 1a,b show a view of the DOAS and the data acquisition system, respectively.
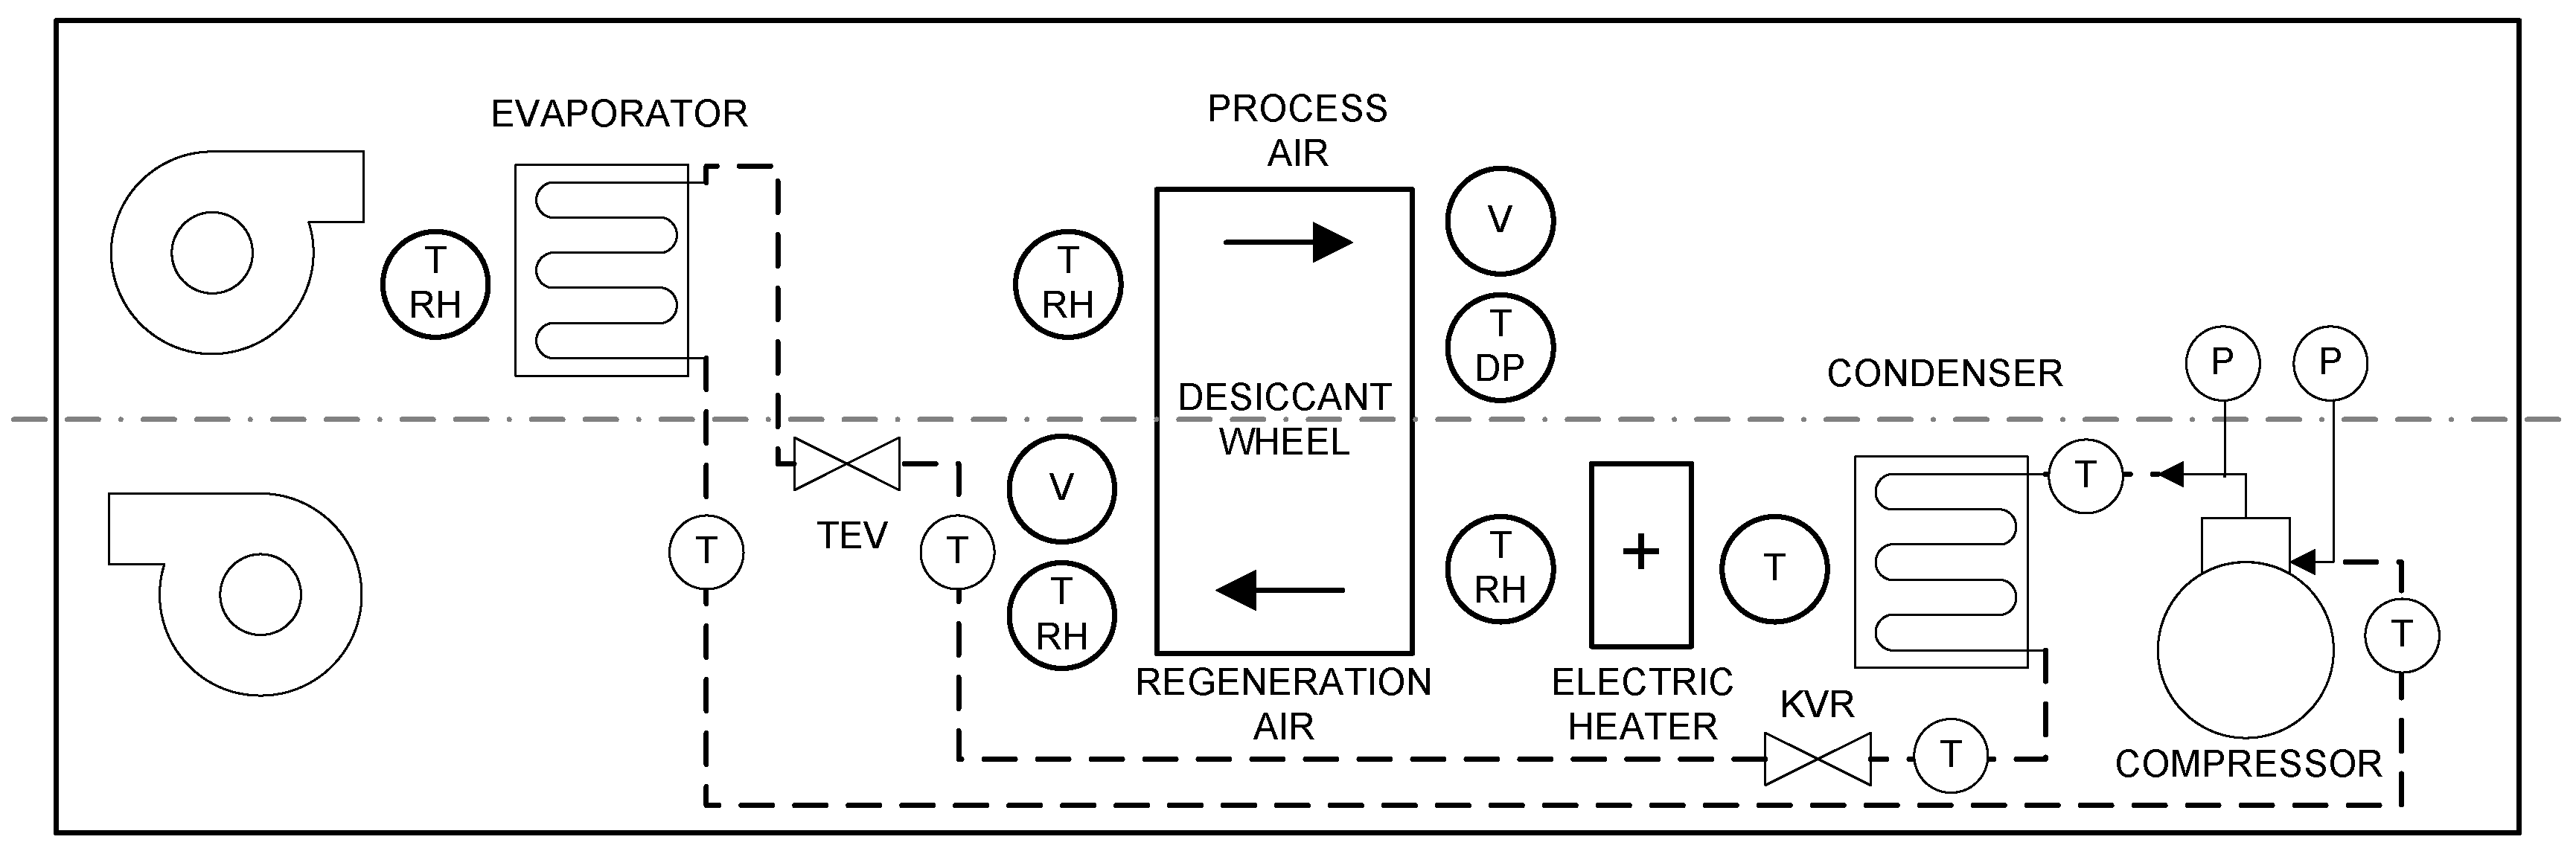
Figure 2 shows a schematic diagram of the plant.
The DOAS was designed according to two principles. The first is that most desiccants adsorb more water vapor as the relative humidity (RH) of the process air increases [
7]. While the RH of the outside air entering the unit varies widely during the period in which the building demands refrigeration, the RH of the air leaving a cooling coil normally exceeds 90% (i.e., it is close to saturation). The second is that most desiccants absorb more water vapor as the dry bulb temperature of the process air decreases. Again, while the temperature of the outdoor air at its entrance to the unit varies significantly during the cooling season, the coldest system temperature is located downstream of the cooling coil.
Therefore, the test facility at Miguel Hernández University was designed with the desiccant wheel downstream of the cooling coil, to take advantage of these operating principles of cooling coils and desiccants. The process air first passes through the direct expansion cooling coil, where it is cooled and dehumidified. Then, when the air passes through the desiccant wheel, the vapor pressure differential lowers its dew point while increasing its dry bulb temperature. The water vapor absorbed by the desiccant is transferred to the regeneration air as the wheel rotates into it.
A cassette including drive system and seals with a rotor of 550 mm diameter and 200 mm depth was chosen. Half of the silica gel rotor surface is used as regeneration section. This layout is often used when low temperature regeneration thermal energy is available.
The desiccant wheel has a constant rotation speed of 12 revolutions per hour. Ruivo et al. [
18] investigated the dependence of desiccant wheel performance on this parameter. However, the wheel rotation speed is usually fixed by the manufacturer to provide the designer with a simpler device [
19].
A temperature of 27.5 °C and humidity ratio of 16.2 g·kg
−1 were used as outdoor design conditions for the design of the test facility. Since the principal purpose of the DOAS is removing the latent load of both outdoor air and occupied space, the peak humidity ratio values must be used to size the equipment [
19]. The 16.2 g·kg
−1 humidity ratio is the amount of moisture that is likely to be exceeded for only 2.5% of the hours in a typical summer season according to the UNE 100001 standard [
20] (1% of the hours in a typical year). This typical year was generated using the METEONORM (v7) programme [
21]. Coincident dry bulb temperature (27.5 °C) is generally lower than peak values used for sizing cooling equipment. This is because the temperature is generally lower when the humidity is at its peak.
Indoor design conditions were set at 25 °C and 60% relative humidity. An occupation of 10 people and corresponding ventilation airflow rate of 0.125 m
3·s
−1 (Second (of Four) Indoor Air Quality Level (IDA2) [
4]) were considered. The latent load due to the ventilation air and occupancy amounted to 2.22 kW. The supply ventilation air humidity ratio necessary to meet that load was 10.3 g·kg
−1.
The manufacturer of the desiccant wheel included in the test facility provides a web-based application [
22] to calculate the performance of the rotor. In this application, the inlet temperature of the regeneration air to the wheel was varied until the humidity ratio of the process air at the rotor outlet reached 10.3 g·kg
−1.
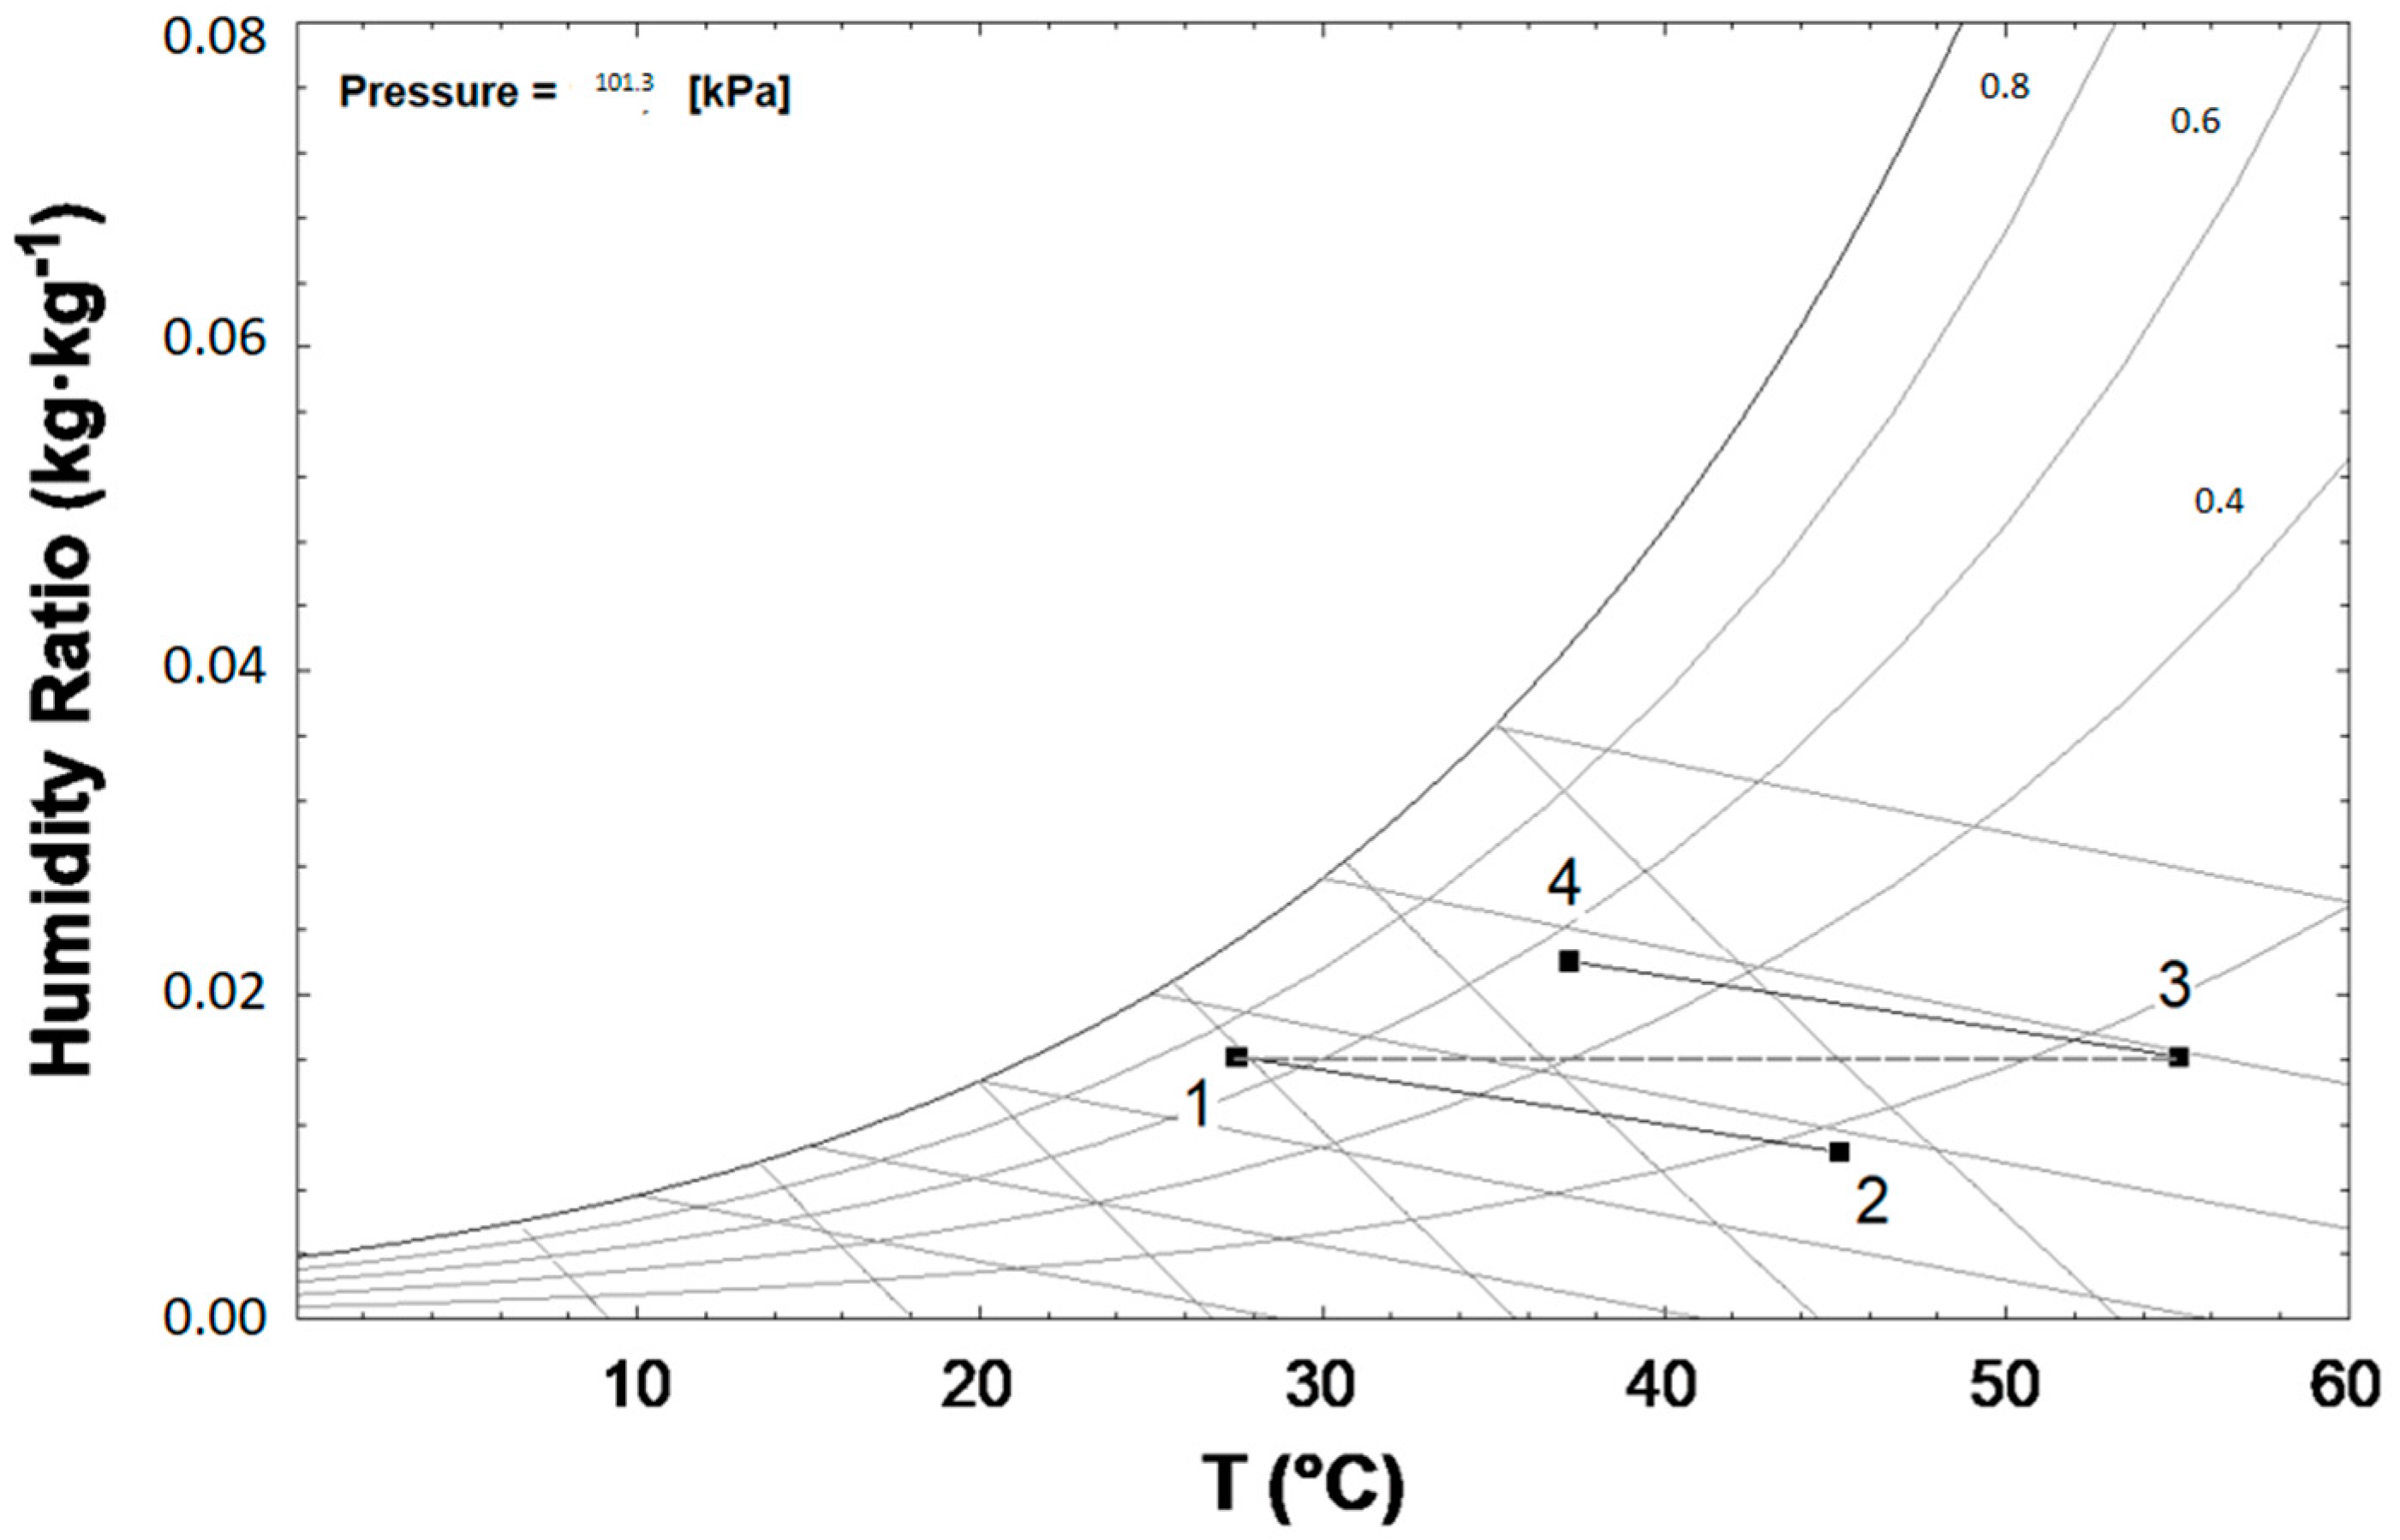
Table 1 shows the results provided by PROCALC (v3.0) (manufacturer web-based application). The required regeneration air temperature at the inlet of the desiccant wheel was 55 °C. From these results, the heat transfer rate at the condenser of the vapor compression refrigeration system can be calculated.
Figure 3 shows the processes relative to process and regeneration air on the psychrometric chart when considering only the processes in the desiccant wheel.
The refrigeration cycle is equipped with a condenser pressure regulator condensing pressure regulator (KVR) (
Figure 2). This regulator is used to maintain a constant and sufficiently high condensing pressure in systems using air-cooled condensers [
23].
The compressor (MTZ022, Danfoss, Madrid, Spain) is of the hermetic reciprocating type and is designed for medium and high evaporating temperature applications. The manufacturer specifies a maximum condensing temperature of 70 °C working with R134a when the return gas temperature (RGT) is 20 °C and the evaporating temperature is 10 °C [
24].
An electric resistance heater is located between the condenser and the desiccant wheel to increase the temperature of the regeneration airflow if necessary. The power of this heater can be adjusted continuously, to a maximum of 3 kW.
2.1. Data Acquisition System
A data acquisition system was set up to register the results of the experimental tests. The sensors were connected to a Keysight 34972A (Keysight Technologies, Málaga, Spain) data acquisition unit. Temperature, humidity, and velocity were registered for the process and regeneration airflows. Refrigerant pressures and temperatures were measured at the vapor compression refrigeration system. The positions of the sensors in the system are shown in
Figure 2, and their specifications are listed in
Table 2.
Since uniformity is an important consideration in the measurement of airflow rate, the velocity sensors are placed downstream of the desiccant wheel. The relatively high pressure drop that occurs in the rotor helps to even out the airflow distribution [
25].
Although humidity ratio is used to evaluate the performance of desiccant wheels, humidity sensors usually measure relative humidity or dew point temperature. Two measurements are required to calculate the humidity ratio using the dew point method: dew point temperature and ambient pressure. Three measurements are required to compute the humidity ratio using the relative humidity method: dry-bulb temperature, relative humidity, and ambient pressure. Therefore, the calculation of the humidity ratio from the measurements of relative humidity or dew point temperature presents different uncertainties [
26].
Uncertainty analysis for the experimental data and uncertainty propagation for system variables have been done following the method proposed in Taylor and Kuyatt [
27]. The experimental uncertainty for each measuring device was determined using the following expression:
where
uT is the combined or total standard uncertainty for the measuring device,
umeasure is the standard uncertainty caused by the instability of the measurement readings,
udata is the standard uncertainty for the 34972A data acquisition readout accuracy, and
uprobe is the standard uncertainty due to the accuracy of the probe, as specified in
Table 2.
In order to reduce the uncertainty caused by the instability of the measurement readings, each measurement point at every test is based on the average of 200 or more readings or samples. Previously, data was filtered for possible inconsistency and questionable samples were eliminated using Chauvenet's criterion. The standard uncertainty of the readings instability is then calculated by dividing the standard deviation of the 200 samples by the square-root of the number of samples. This calculation is referred to as type A evaluation of uncertainty.
Uncertainties due to readout accuracy and probe accuracy were calculated based on a type B evaluation of standard uncertainty, dividing the manufacturer's accuracy specifications by the square-root of three.
Finally, the calculation of the expanded uncertainty was obtained by multiplying the combined or total standard uncertainty by a coverage factor k = 2 corresponding to a confidence level of approximately 95%.
According to this uncertainty analysis,
Table 3 gives the uncertainties in the calculation of the process airflow humidity ratio for the design conditions (
Table 1). The results are expressed as a percent uncertainty, which is calculated by dividing the uncertainty in the calculated value by the calculated value. It can be seen that the uncertainty is lower when the humidity ratio is calculated from the dew point temperature.
Therefore, a dew point temperature sensor was used for the process air at the wheel outlet in the experimental setup. It has a 4–20 mA output and an accuracy of ±0.3 °C. The resulting uncertainty in the calculation of the humidity ratio is 1.98%, as shown in
Table 3.
2.2. Component Models
One of the objectives of this work was to generate a DOAS model in TRNSYS [
28] and to validate it with experimental data. TRNSYS is software used to simulate the behavior of thermal systems. It uses a modular approach based on component models to develop and solve simulations: the outputs of one component are sent to the inputs of another component (successive substitution). The standard TRNSYS library includes many of the components commonly found in building energy systems. New components can also be developed by the user and added to the program [
29]. The DOAS is mainly composed of two subsystems: the desiccant wheel and the vapor compression refrigeration system.
2.2.1. Desiccant Wheel Model
Different models of the desiccant wheel have been developed by many researchers over the years [
30,
31,
32]. In this work, the operation of the desiccant wheel is simulated using the Type 1716 (component of the TESS library), containing a model based on the equations for
F1 and
F2 potentials developed by Jurinak [
33]:
where temperature (
T) is expressed in K and humidity ratio (
ω) is expressed in kg kg
−1. The isopotential lines
F1 and
F2 are modified to consider the non-ideal behavior of the system by the use of two efficiencies proposed by Schultz [
34], defined as follows:
where
D is the current outlet state and
P and
R are the input conditions of the process and regeneration airflows, respectively (Points 1 and 3 in
Figure 3). The model in this work has been calibrated from experimental data. The values obtained for the efficiencies (0.157 and 0.965) are consistent with those employed by other authors [
35,
36].
2.2.2. Vapor Compression Refrigeration System Model
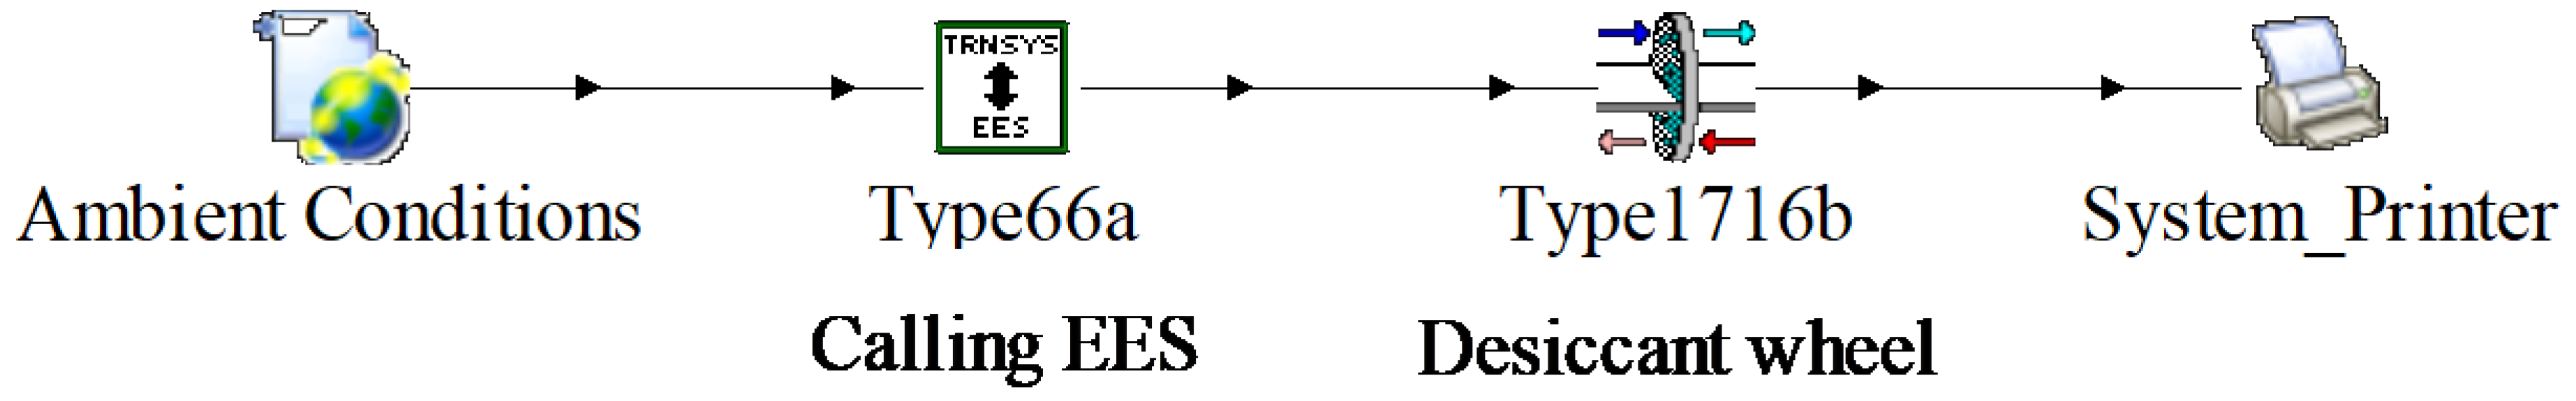
The vapor compression refrigeration system model was written to be solved by Engineering Equation Solver (EES) [
37]. Type 66 of TRNSYS makes use of Dynamic Data Exchange (DDE) commands to communicate with EES, pass information that EES needs to solve (parameters and inputs), and retrieve output information, which can be used as input to any other TRNSYS component.
A semi-empirical model has been developed to represent the operation of the compressor. The model is based on the concept of volumetric efficiency and assumes a polytropic compression process [
38]. The MTZ022 compressor has a displacement volume of 38.1 cm
3 rev
−1 and a rotational speed of 2900 rpm. The refrigerant flow rate can be determined by the following equation:
The volumetric efficiency can be expressed as
Therefore, two parameters have to be determined: the clearance volume ratio
C and the polytropic exponent
n. It is possible to calculate both
C and n simultaneously from the manufacturer data using the least squares method. However, the values that best fit the data usually have no physical sense [
38].
A constant value is then chosen for the polytropic exponent n equal to 1.07 [
39]. From this value, and the data supplied by the manufacturer, a value of 0.115 was calculated for C. According to the manufacturer, the MTZ compressors have a large free internal volume that protects against the risk of liquid stroke when liquid refrigerant enters the compressor [
24]. The power transferred to the refrigerant by the compressor can be calculated from
In the condenser analysis, the heat flow rate was calculated using the effectiveness-number of transfer units (NTU) method. Although the processes of desuperheating and subcooling take place, the approximation that the capacitance rate ratio is zero was considered correct since most of the heat is transferred during the condensation process. The effectiveness was calculated by the following expression:
The NTU was calculated as the ratio of the overall heat transfer conductance (UA) to the minimum capacitance rate (air). Once the effectiveness was known, the heat transfer was calculated by the following expression:
The evaporator was also analyzed as a heat exchanger with a capacitance rate ratio of zero and the effectiveness was determined using the relationships for sensible heat exchangers, with modified definition for the NTU [
40]. Since cooling and dehumidification take place on the air side, the operation of the evaporator was determined by assuming two different conditions for the coil: being completely wet and being completely dry. The maximum of the heat transfer rates corresponding to these two hypotheses was then selected as the actual one [
41].
The operational scheme of the system model built in TRNSYS is shown in
Figure 4.
3. Results
Laboratory tests have been conducted to validate the DOAS model and investigate its operation. The conditions of the air entering the process and regeneration sections are those in the laboratory.
Twenty-six tests were carried out under different climatic conditions and with different process and regeneration airflow rates. For the analysis of each test, the registered outdoor air conditions and the process and regeneration airflows were used as inputs to the refrigeration cycle model. This model provided the outlet conditions of the process and regeneration airflows, which in turn were inputs to the desiccant wheel model. Finally, the wheel model provided the conditions of the process air that was supplied to the conditioned space.
Table 4,
Table 5 and
Table 6 show the results of 13 tests.
Table 4 includes the input data to the refrigeration cycle model in its first four columns (outdoor air conditions and process and regeneration airflows). It also includes the registered and simulated values of the refrigeration cycle pressures in its last four columns.
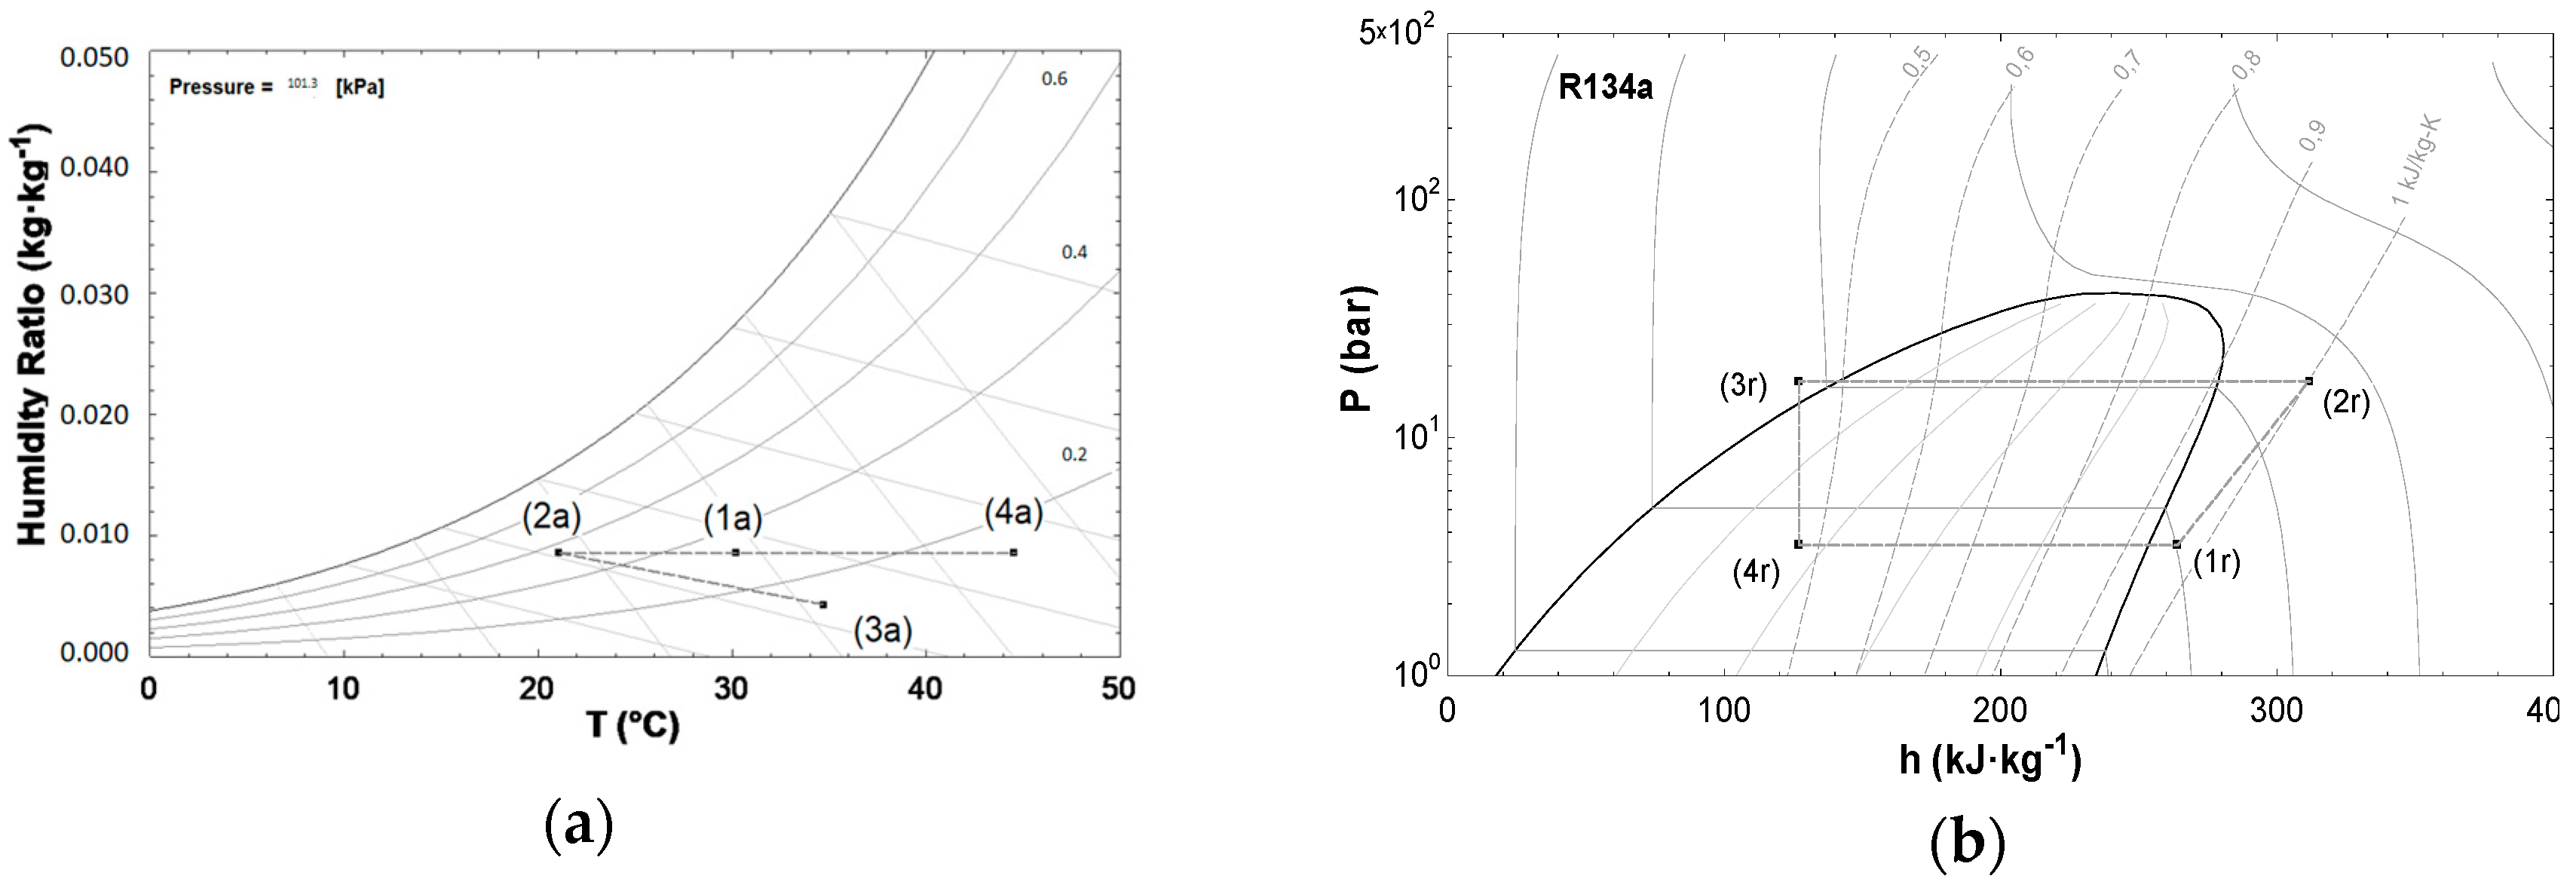
Table 5 shows the experimental and simulated temperatures of the process and regeneration airflows that are inputs to the wheel (Points 2a and 4a of
Figure 5a). It also contains the conditions of the process air after passing through the desiccant wheel (Point 3a of
Figure 5a).
Table 6 shows the registered and simulated values of the refrigeration cycle temperatures (Points 1r, 2r, 3r, and 4r of
Figure 5b).
Figure 5a shows the evolution of the process air properties on the psychrometric chart corresponding to Test Number (2). It can be observed that a sensible cooling process takes place from the outdoor conditions (30.2 °C, 32.3%) to the cooling coil outlet (21 °C, 57%). The humidity ratio decreases in the desiccant wheel from 8.63 g·kg
−1 of outdoor air to 4.25 g·kg
−1.
Figure 5b shows the refrigeration cycle corresponding to the same test in a p–h diagram. The condensing temperature of 57.4 °C increases the regeneration airflow temperature to 44.5 °C. When operating at high condensing temperatures, the compressor discharge temperature (87.4 °C) becomes a critical parameter associated with a lubricant service life. The evaporating temperature is 5.5 °C, with a superheat of 11 °C.
The results of the tests were used to validate the DOAS model developed in TRNSYS. The RMSE was utilized for the comparison of experimental and simulated values. It is calculated by the following equation:
where
N is the number of measurements of each variable,
xj,m is the measured value, and
xj,sim is the simulated value.
Table 7 shows the calculated RMSE values for the process and regeneration air properties (Points 2a, 3a, and 4a) of
Figure 5a.
Table 8 shows the RMSE values for the refrigeration cycle pressures and temperatures shown in
Figure 5b.
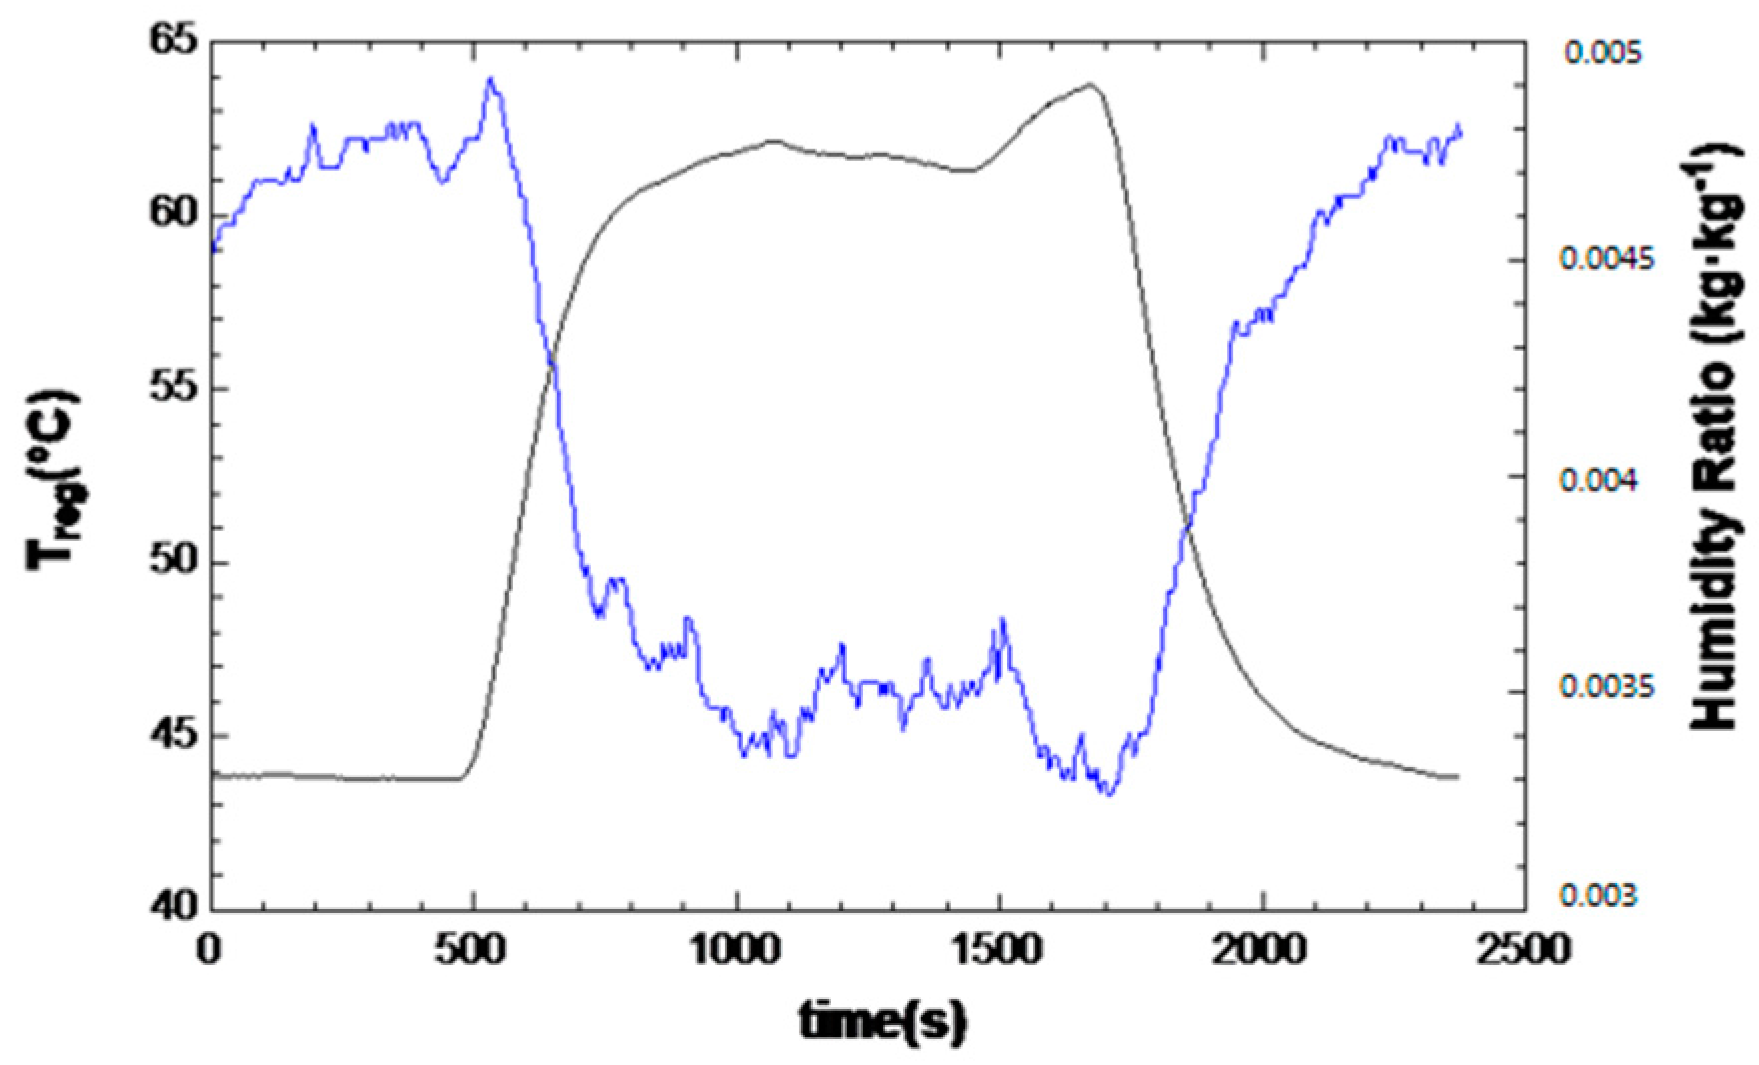
Figure 6 shows data from another test in which the regeneration air temperature was modified to observe its effect on the process air humidity ratio at the desiccant wheel outlet. When the regeneration air was only heated by the condenser of the vapor compression refrigeration cycle, a temperature of about 44 °C was obtained, bringing the process air humidity ratio at the outlet of the wheel to 4.5 g·kg
−1. Then, when the test facility electric heater increased the regeneration air temperature to 60 °C, the humidity ratio dropped to 3.5 g·kg
−1.
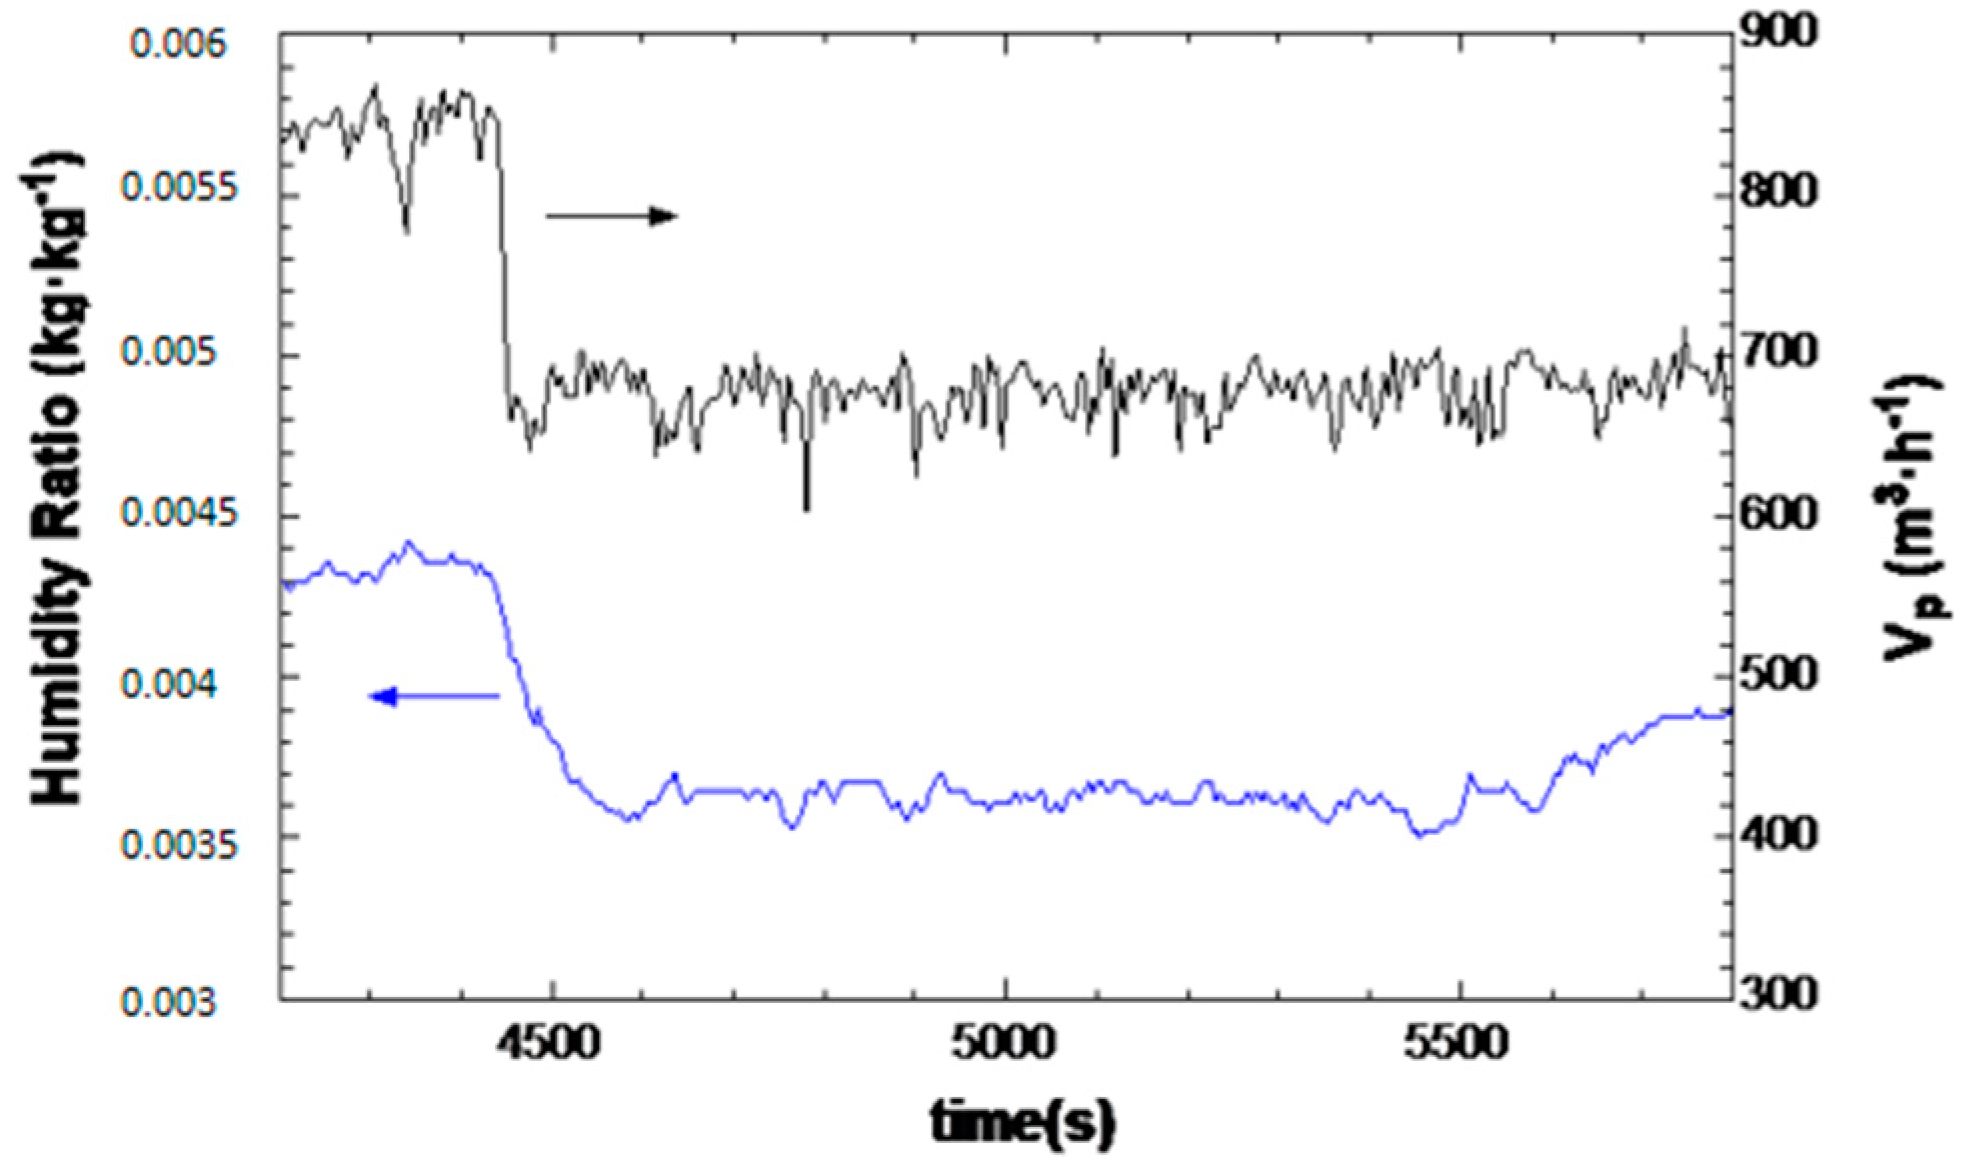
Figure 7 shows that, if the process airflow is reduced, its humidity ratio at the wheel outlet will also be lower (3.5 g kg
−1). The slower the ventilation air moves through the desiccant wheel, the drier it will come out.
4. Discussion
In the tests carried out, the outdoor temperature (laboratory temperature) ranged from 29.8 °C to 31.4 °C and the humidity ratio from 8.7 g·kg−1 to 11.8 g·kg−1. It was observed that, if the regeneration airflow was less than about 700 m3·h−1, the high pressure safety switch was required to shut down the compressor because the discharge pressure exceeded 20 bar.
The process air temperature at the desiccant wheel outlet (Point 3a of
Figure 5a) ranged from 32.6 °C to 36.1 °C. For the system proposed in this paper, this extra heat (regarding outdoor temperatures between 29.8 °C and 31.4 °C) must be removed in the conditioned space by the parallel sensible cooling equipment. This strategy makes use of the fact that moisture loads are at their peak when the sensible loads on the building are relatively low [
19].
Alternatively, an air to air heat exchanger could be mounted downstream of the desiccant wheel to cool the process air. On the other side of the heat exchanger, building exhaust air would carry the excess heat out of the building. The exhaust air could also be evaporatively cooled before entering the heat exchanger to provide a greater cooling effect for the process air.
Let us consider a conditioned space with 10 people, each releasing 60 W latent heat. Indoor design conditions are set to 25 °C and 60% relative humidity (11.9 g·kg
−1), and the corresponding ventilation airflow rate is 450 m
3·h
−1 [
4]. The supply ventilation air humidity ratio necessary to meet the internal latent load (600 W) is 10.3 g·kg
−1. If indoor design conditions are set to 25 °C and 50% relative humidity (9.88 g·kg
−1), then ventilation air should be supplied at 8.29 g·kg
−1 humidity ratio to meet the internal latent load.
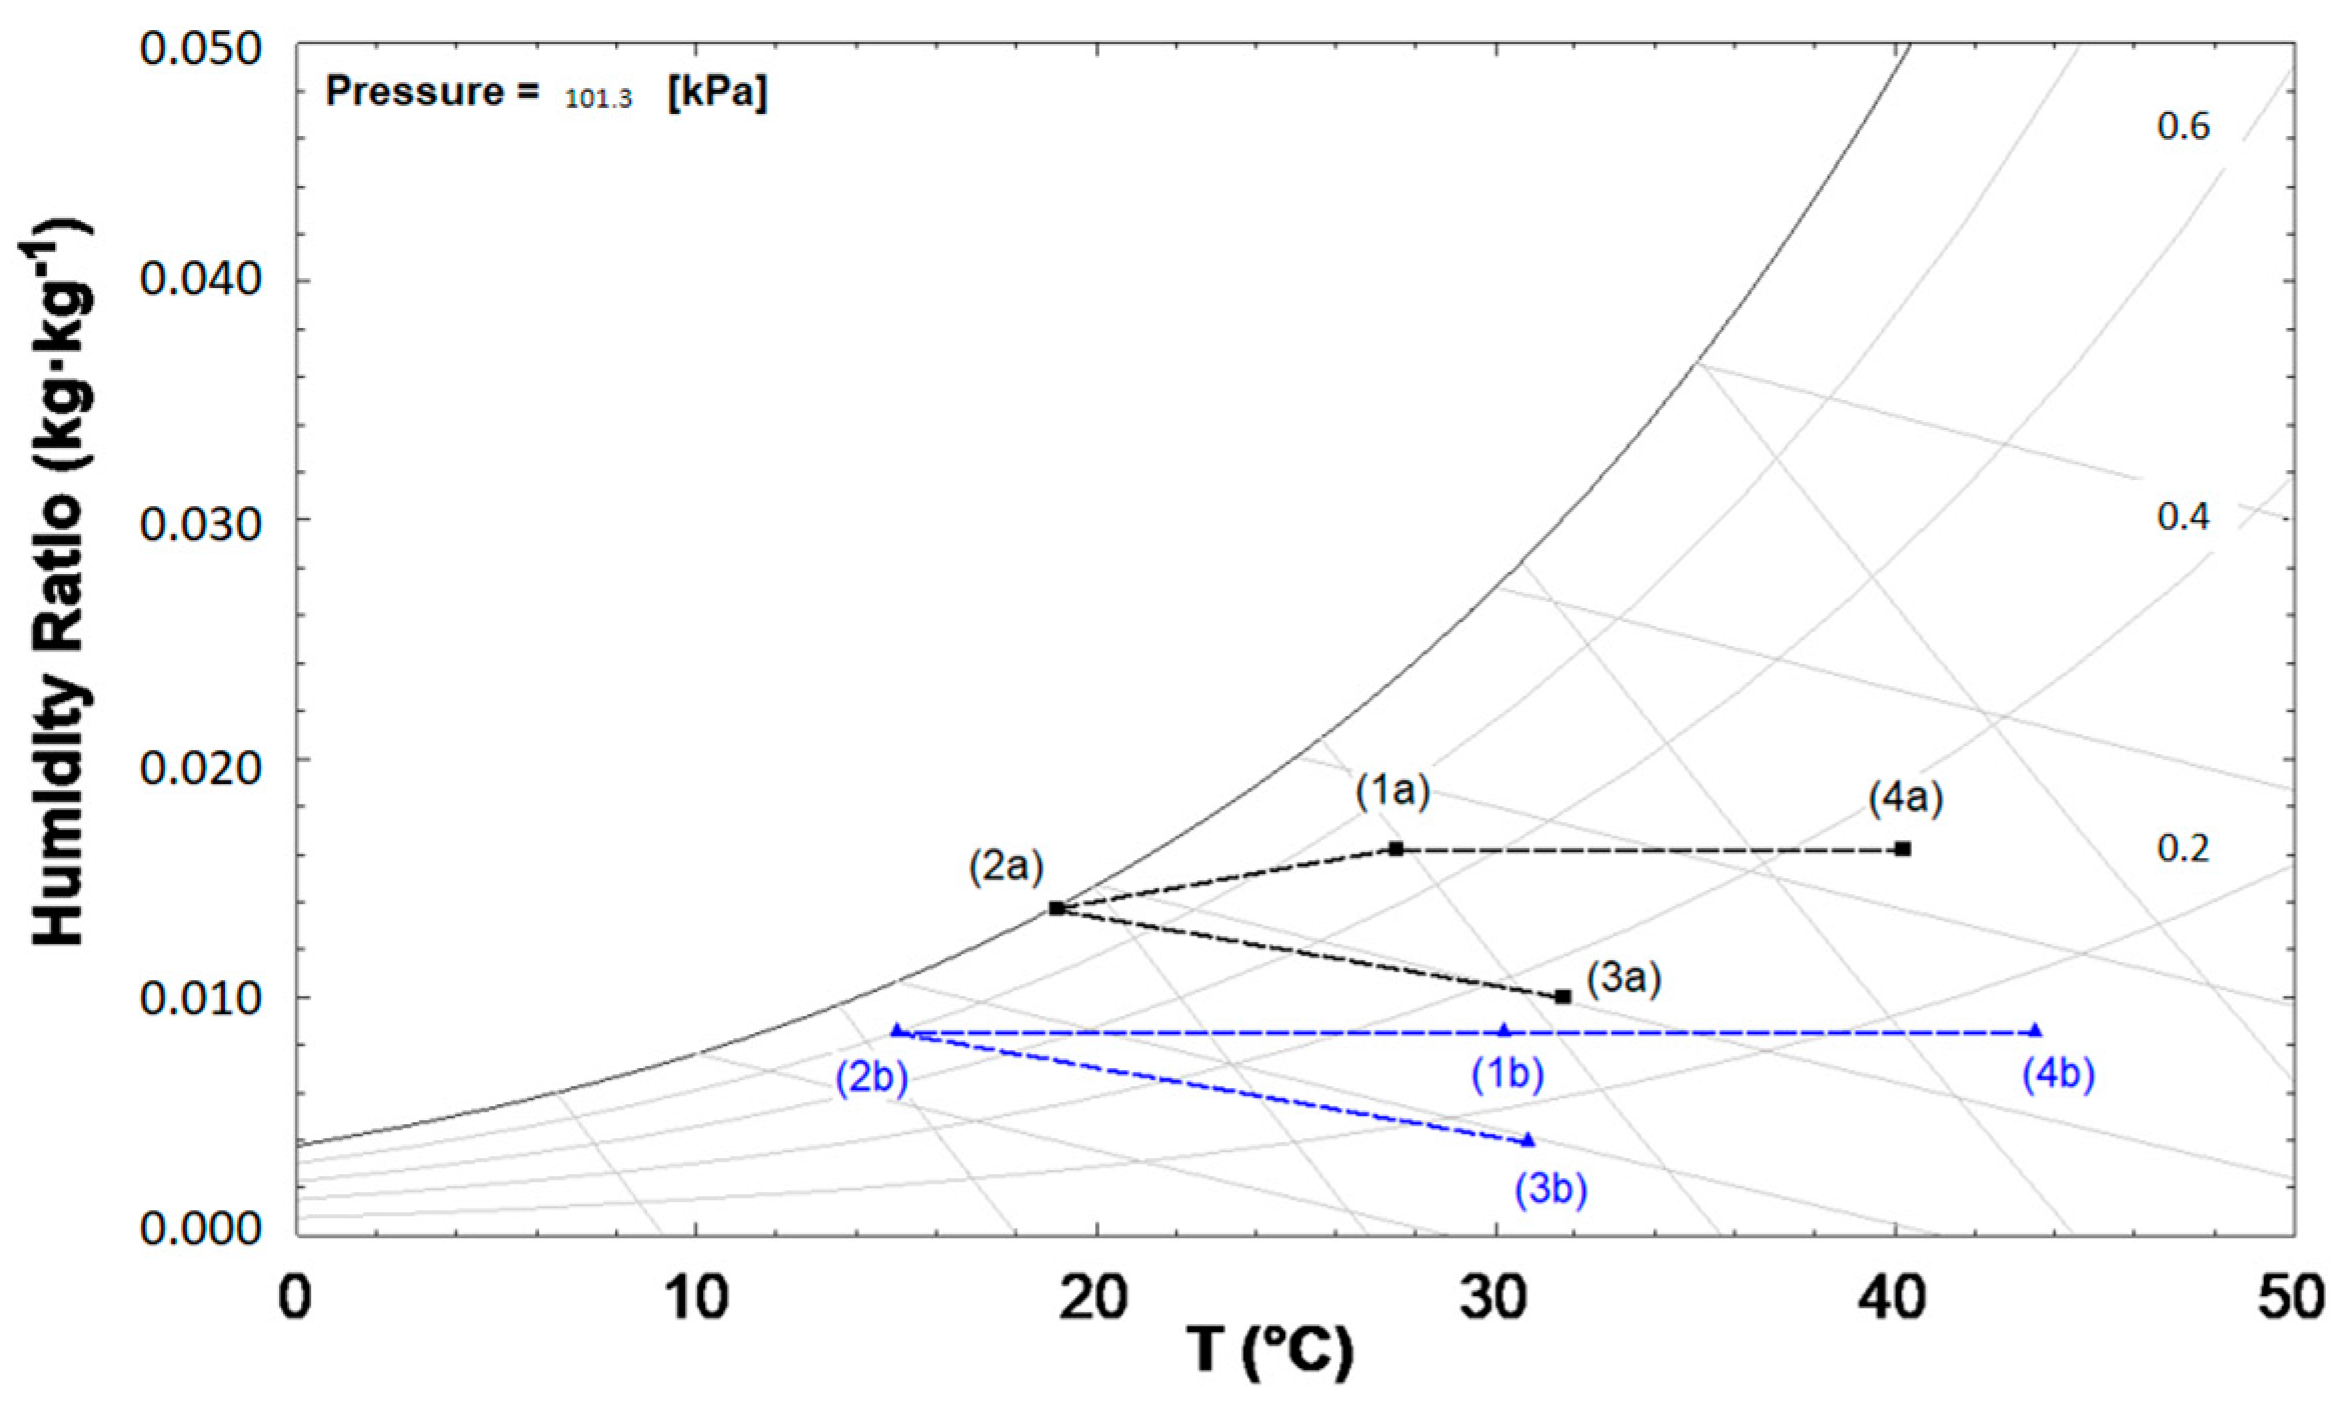
Table 9 shows two cases corresponding to different outdoor conditions. Case (a) corresponds to outdoor design conditions and Case (b) to Test Number (2) of
Table 4. Regeneration airflow was set to 700 m
3·h
−1. The developed model was used to calculate the supply temperature and humidity ratio of the process air (point 3a of
Figure 5a). The obtained results are also shown in
Figure 8.
The results obtained show how the DOAS could keep an indoor humidity ratio of 11.9 g·kg−1 (25 °C, 60%) for outdoor conditions of Case (a), since the humidity ratio at the desiccant wheel outlet (10.0 g·kg−1) is lower than the required 10.3 g·kg−1. However, it could not keep an indoor humidity ratio of 9.88 g·kg−1 (25 °C, 50%) since the required supply humidity ratio is 8.29 g·kg−1. These indoor conditions would be possible for Case (b) since DOAS can supply ventilation air at a 4.03 g·kg−1 humidity ratio. In fact, the humidity ratio of outdoor air (8.63 g·kg−1) is quite close to the required supply humidity ratio (8.29 g·kg−1).
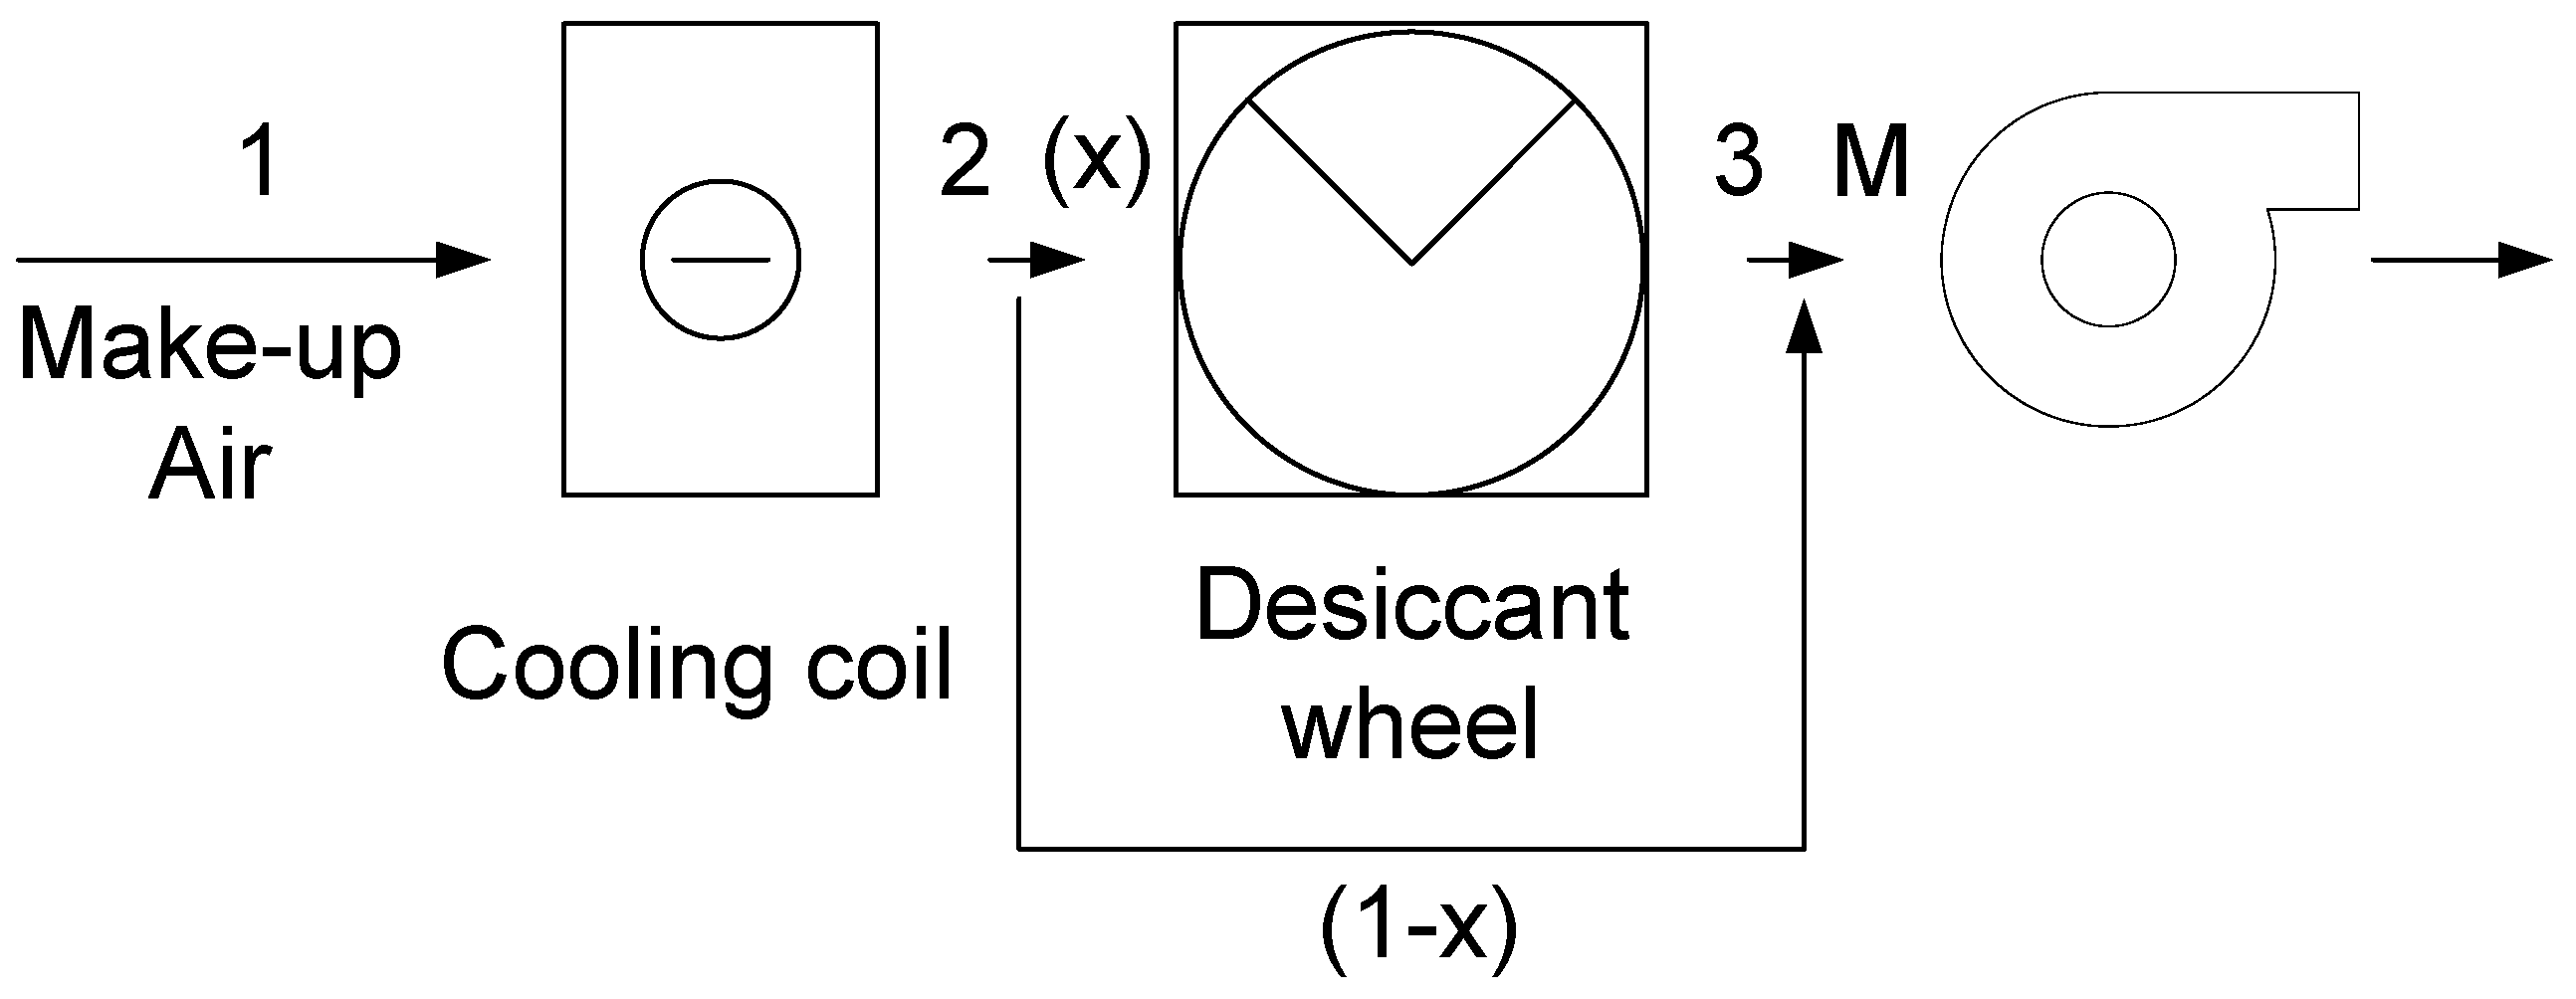
Figure 9 shows one method of controlling humidity. It requires a bypass air duct and variable-position dampers. When humidity in the conditioned space rises above the set point, the bypass damper closes and the desiccant wheel damper opens, forcing more air through the desiccant wheel. When the humidity control level is satisfied, the bypass damper opens so the building is not over-dried [
19].
This would be the mixing (M) of the fraction (1 − x) of process air at State 2 of
Figure 9 (cooling coil outlet) with the stream of air (x) that passes through the desiccant wheel and leaves it at State 3 of
Figure 9.
5. Conclusions
The test facility designed at Miguel Hernández University uses the condenser heat from a vapor compression refrigeration system to reactivate an active desiccant wheel. Ventilation air is precooled by the refrigeration system, and the air is then dried and reheated by the desiccant wheel. This design uses both technologies at favorable points of operation. Vapor compression refrigerators are more efficient at higher inlet temperatures, and desiccants gain advantages at cooler and more saturated conditions.
It is worth noting that, during the tests, no dehumidification took place at the cooling coil of the vapor compression refrigeration system. The dimensions of this component conditioned this result. The greater the conductance (UA) of the heat exchanger, the lower the temperature difference between evaporating refrigerant and outdoor air. However, the model indicates that dehumidification can take place at the cooling coil under certain outdoor conditions, like Case (a) of
Table 9 and
Figure 9.
The RMSE was used for model validation by comparing the registered air and refrigerant properties with the corresponding calculated values. The calculated RMSE for DW and compression refrigeration system variables are consistent with those obtained by other authors [
30].
Tests were also used to investigate the effect of regeneration air temperature and process airflow rate on process air humidity ratio at the outlet of the desiccant wheel. It was found that, when regeneration air temperature increases, humidity ratio drops. This result is consistent with the technical literature. The test facility at the Miguel Hernández University uses a low temperature regeneration source (about 45 °C).
It was also found that, when the process airflow through the desiccant wheel is reduced, the process air humidity ratio also decreases. It can be concluded that, when the designer of a DOAS considers using a low temperature energy source, the unit has to be larger than one, which uses a higher regeneration temperature to produce the same outlet humidity ratio in the process air. In that case, the lower process air velocity (larger section) achieves the same effect as the high regeneration temperature.
In the near future, it is intended to add new components to the experimental setup that allow for a wider range of temperature and humidity ratio at the inlet of the DOAS.


