Article

Virtual Synchronous Generator Based Auxiliary Damping Control Design for the Power System with Renewable Generation

1
School of Electrical Engineering, Southeast University, Nanjing 210096, China
2
State Key Laboratory of Operation and Control of Renewable Energy & Storage Systems, China Electric Power Research Institute, Nanjing 210003, China
3
Qinghai Province Key Laboratory of Photovoltaic Grid Connected Power Generation Technology, State Grid Qinghai Electric Power Research Institute, Xining 810008, China
*
Author to whom correspondence should be addressed.
Energies 2017, 10(8), 1146; https://doi.org/10.3390/en10081146
Submission received: 27 June 2017 / Revised: 29 July 2017 / Accepted: 31 July 2017 / Published: 4 August 2017

Abstract

:
Aiming for large-scale renewable energy sources (RES) integrated to power systems with power electronic devices, the technology of virtual synchronous generator (VSG) has been developed and studied in recent years. It is necessary to analyze the damping characteristics of the power system with RES generation based on VSG and develop its corresponding damping controller to suppress the possible low frequency oscillation. Firstly, the mathematical model of VSG in a per unit (p.u) system is presented. Based on the single-machine infinite bus system integrated with an RES power plant, the influence of VSG on the damping characteristics of the power system is studied qualitatively by damping torque analysis. Furthermore, the small-signal model of the considered system is established and the damping ratio of the system is studied quantitatively by eigenvalue analysis, which concluded that adjusting the key control parameters has limited impacts on the damping ratio of the system. Consequently, referring to the configuration of traditional power system stabilizer (PSS), an auxiliary damping controller (ADC) for VSG is designed to suppress the low frequency oscillation of the power system. Finally, simulations were performed to verify the validity of theoretical analysis and the effectiveness of designed ADC.

1. Introduction

The power system may experience sustained low frequency oscillation in the transmission lines after being disturbed due to the lack of damping [1,2]. Low frequency oscillation may cause the overcurrent of tie line, malfunction of the relay protection devices or even out-of-step oscillation, which affects the secure and stable operation of the power system seriously. Nowadays, with the development of prediction, operation and control technologies, the penetration level of RES, such as photovoltaic and wind power, is gradually increasing, which means many synchronous generators are being replaced by power electronic devices. Due to the randomness and intermittency of the output power of RES generation, as well as the difference in grid-connected characteristics between power electronic devices and synchronous generators, large-scale RES generation will reduce the equivalent inertia and damping of the power system, and have negative impacts on the power system stability [3,4,5,6,7]. Therefore, it is of great theoretical and practical value to analyze the influence of RES generation on the damping characteristics of the system and propose the corresponding solutions.
The virtual synchronous generator (VSG), which represents the voltage source converter operated in a similar way as the synchronous generator [8,9], is regarded as a promising method of friendly integration of RES generation. This strategy has been widely used in the field of micro-grid inverter [10,11], wind and photovoltaic power generation [12,13], low frequency AC transmission (LFAC) [14] as well as high voltage direct current (HVDC) [15,16], and achieves a good control effect. However, the impacts of the RES generation controlled by VSG on the damping characteristics of the power system have not been studied in depth. Most of the research simply assumes that VSG emulates the characteristics of the synchronous generator. Thus, it can increase the equivalent damping of the system. However, few of them conduct the in-depth analysis of this problem, prove its validity, explain its mechanism and reveal its rules.
In recent years, there are several research results of damping control strategies or power system stabilizers applied to RES generation [17,18,19,20,21]. However, these strategies can not be applied to VSG directly, due to the difference between VSG and traditional control strategies. Some research about the oscillation damping by VSG are presented in [22,23,24,25,26,27,28], and one of the main methods of suppressing oscillation by VSG is to dynamically adjust the control parameters during the transient process in existing research [22,23,24,25]. A self-tuning virtual synchronous machine (VSM) is proposed in [22]. By using optimization algorithms, the optimal parameters of virtual inertia and damping coefficient is obtained through online calculations to minimize the frequency deviations. In [23], a new control equation of VSG and a damping control approach based on linear control theory is proposed to solve the output power oscillation of VSG. The self-adaptive parameter control is also used in VSG to realize the power system stabilization [24,25]. However, the above research lacks the detailed theoretical analysis of the influence of the VSG on the damping characteristics of the system. The dynamic adjustments of the control parameters are mainly based on the experience or the optimization algorithms. Furthermore, the virtual inertia and damping coefficients are directly related to the time constant of the active power loop and the stability of the control system [29], so the adjustable range of these parameters is limited.
In this paper, the damping characteristics of the single-machine infinite bus system integrated with renewable generation controlled by VSG are analyzed and an auxiliary damping controller (ADC) suitable for VSG is proposed to suppress the oscillations of the synchronous generator. The main contributions of this paper include the following: (1) based on the derived mathematical model of the single-machine infinite bus system with an RES power plant controlled by VSG, the features and conditions that VSG can provide positive damping torque to the power system are studied by damping torque analysis, and the influence of the control parameters of VSG on the system damping characteristics is analyzed qualitatively; (2) the influence rules of the key parameters of VSG on the system damping characteristics are analyzed quantitatively based on the eigenvalue method; (3) a simple ADC is designed for VSG, which can provide positive damping and suppress the oscillation of the power system effectively.
The rest of the paper is organized as follows. Section 2 proposes the mathematical model of VSG and analyzes its impacts on the system damping characteristics. Section 3 establishes the differential-algebraic equation of the research object and makes the eigenvalue analysis for different sets of control parameters. In Section 4, the novel ADC and the process of parameter design are presented. Simulations are performed in Section 5 to verify the validity of theoretical analysis and the effectiveness of ADC. Finally, Section 6 concludes this paper.

2. Modeling and Analysis of VSG

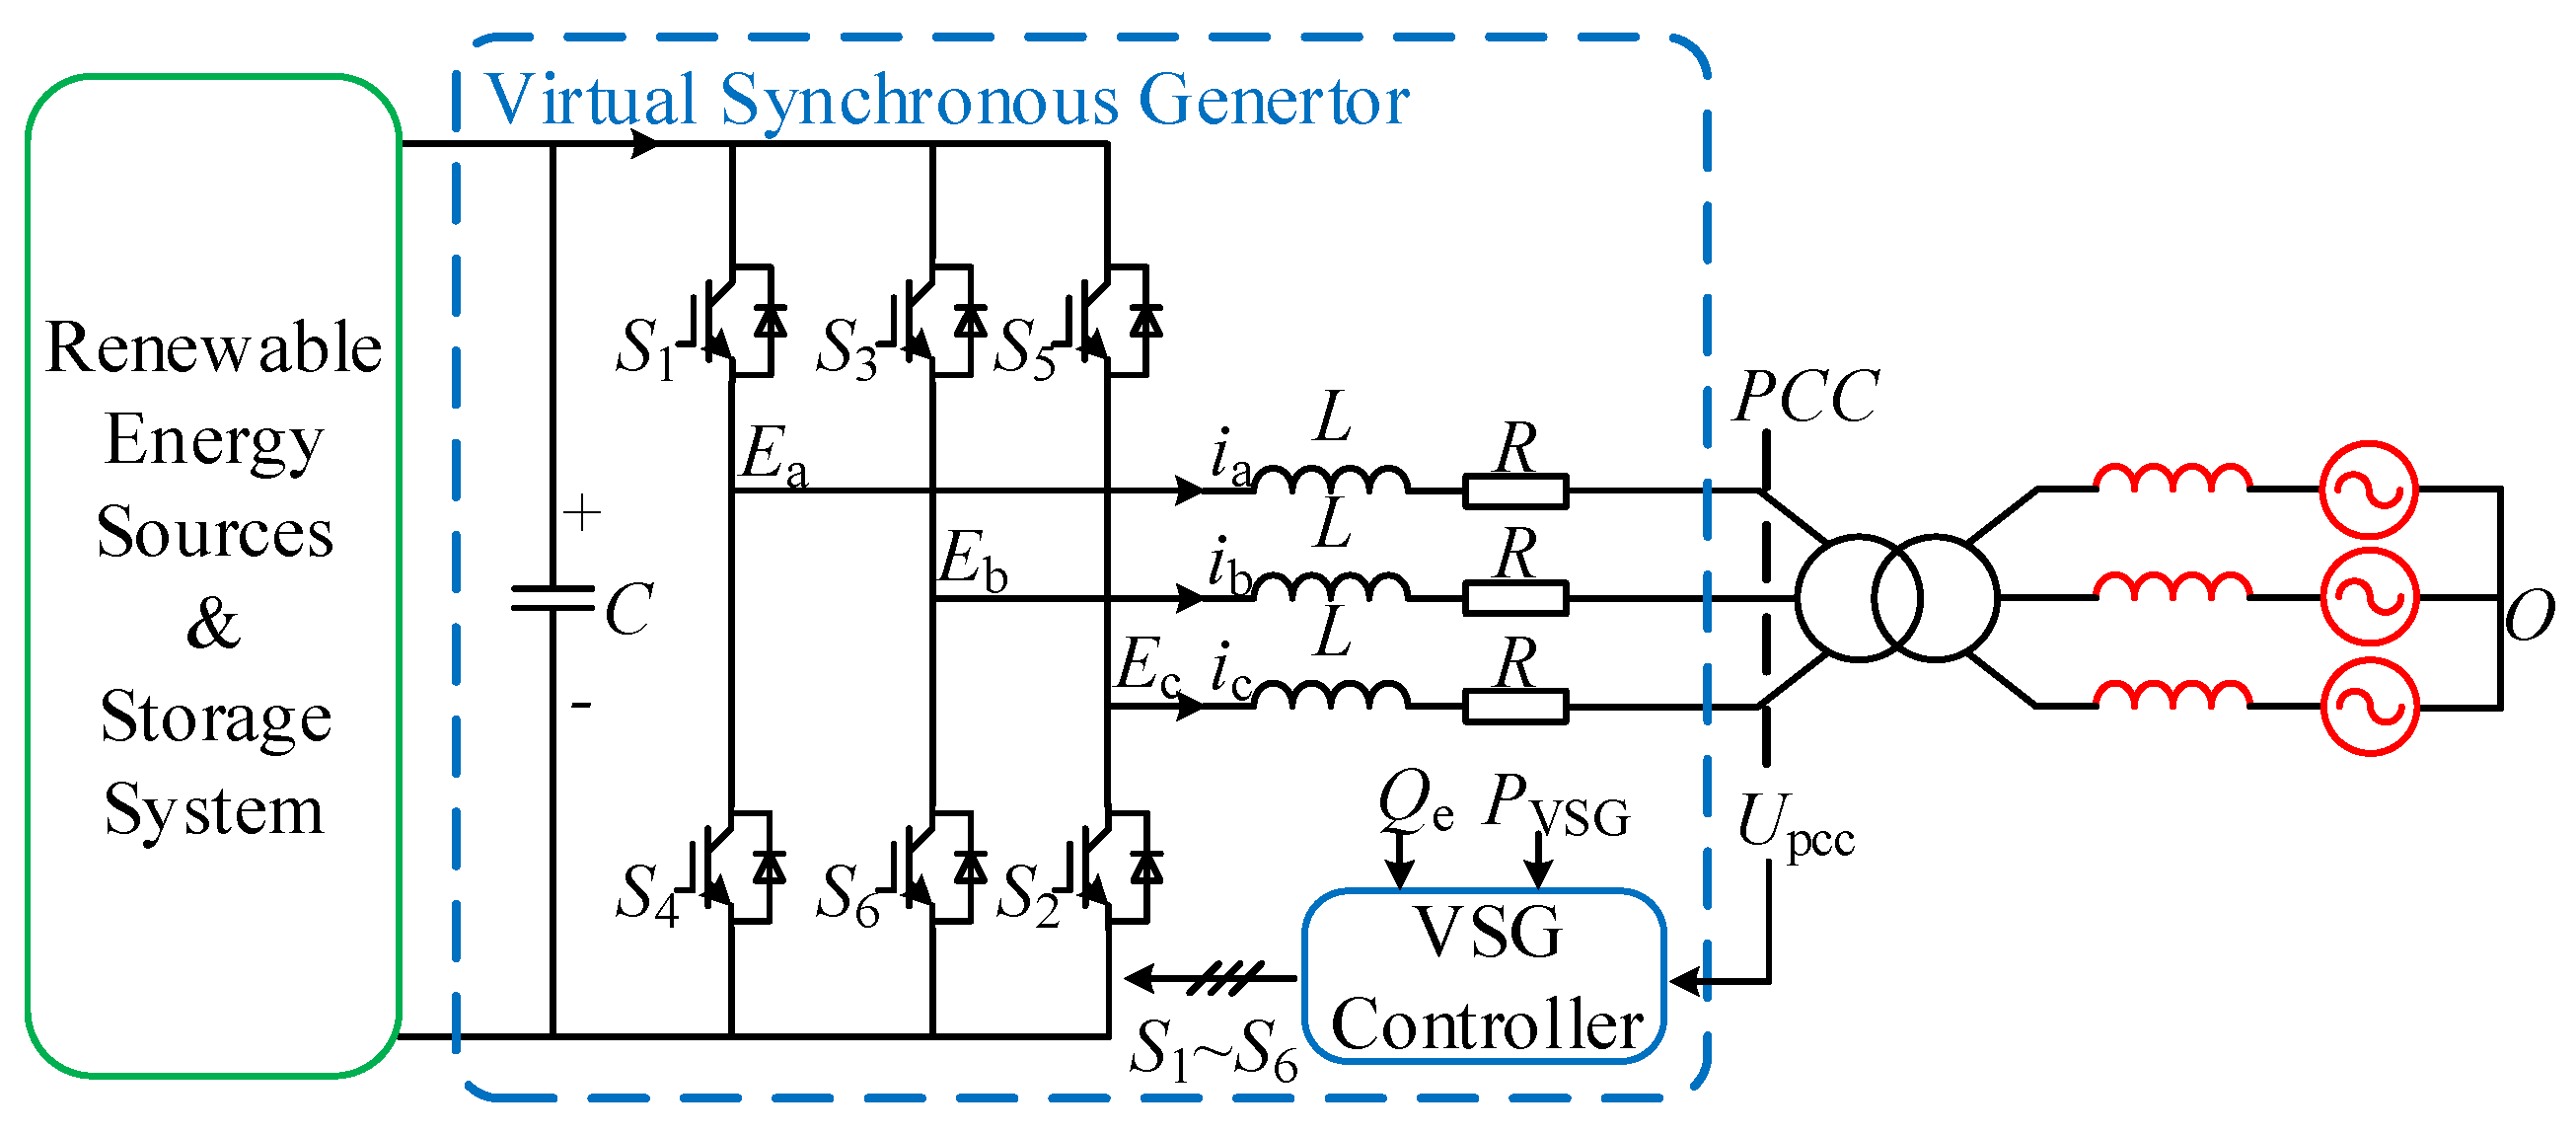
2.1. Mathematical Model of VSG

The typical structure of the VSG applied to the renewable generation is shown in Figure 1, which consists of a power source composed of RES and a storage system, converter, filter circuit, step-up transformer and grid. If the power provided by the RES and storage system is regarded as the input torque of the prime mover, the converter is regarded as the electromechanical energy conversion process between the stator and rotor. Then, the fundamental component of midpoint voltage can represent the electromotive force of the imaginary synchronous generator, and the inductances and resistances of the filter circuit can represent the impedances of the stator windings. Therefore, the circuit on the left of the step-up transformer can be regarded as a synchronous generator.
The control diagram of VSG is shown in Figure 2, where the active power loop emulates the inertial, damping and primary frequency regulation of synchronous generator to calculate the reference frequency and phase of the modulation wave, while the reactive power loop emulates the voltage regulation to calculate the amplitude of the modulation wave.
According to the control diagram shown in Figure 2, the mathematical model of VSG in a per unit (p.u) system can be expressed as (1). The detailed derivation is demonstrated in Appendix A:
d δ VSG d t = ω VSG * 1 ω 0 T J VSG d ω VSG * d t = P ref * P VSG * D p * ω VSG * 1 T K d E * d t = Q ref * Q e * D q * U pcc * 1 P VSG * = E * U pcc * X s * sin δ VSG Q e * = E * U pcc * cos δ VSG E * X s * ,
where δ VSG is the phase difference between the internal potential and voltage of the point of common coupling (PCC); ω VSG is the virtual angular speed and ω 0 is the rated angular speed; P ref is the reference of active power; P VSG is the output active power; E is the root-mean-square (rms) value of internal potential; U pcc is the rms value of phase voltage of PCC; Q ref is the reference of reactive power; Q e is the output reactive power; X s is the impedance of filter reactor; T J VSG = ( J ω 0 2 ) / S B is the inertia time constant of VSG; J is the virtual inertia damping coefficient and S B is the base power of the system; D p * = ( D p ω 0 2 ) / S B is the p.u value of virtual damping coefficient D p ; T K = ( 2 U B K ) / S B is the time constant of reactive power loop of VSG; K is the integral coefficient and U B is the nominal rms value of phase voltage; D q * = ( 2 U B D q ) / S B is the p.u value of voltage droop coefficient D q . All the variables superscripted with * denote the p.u value of corresponding one.

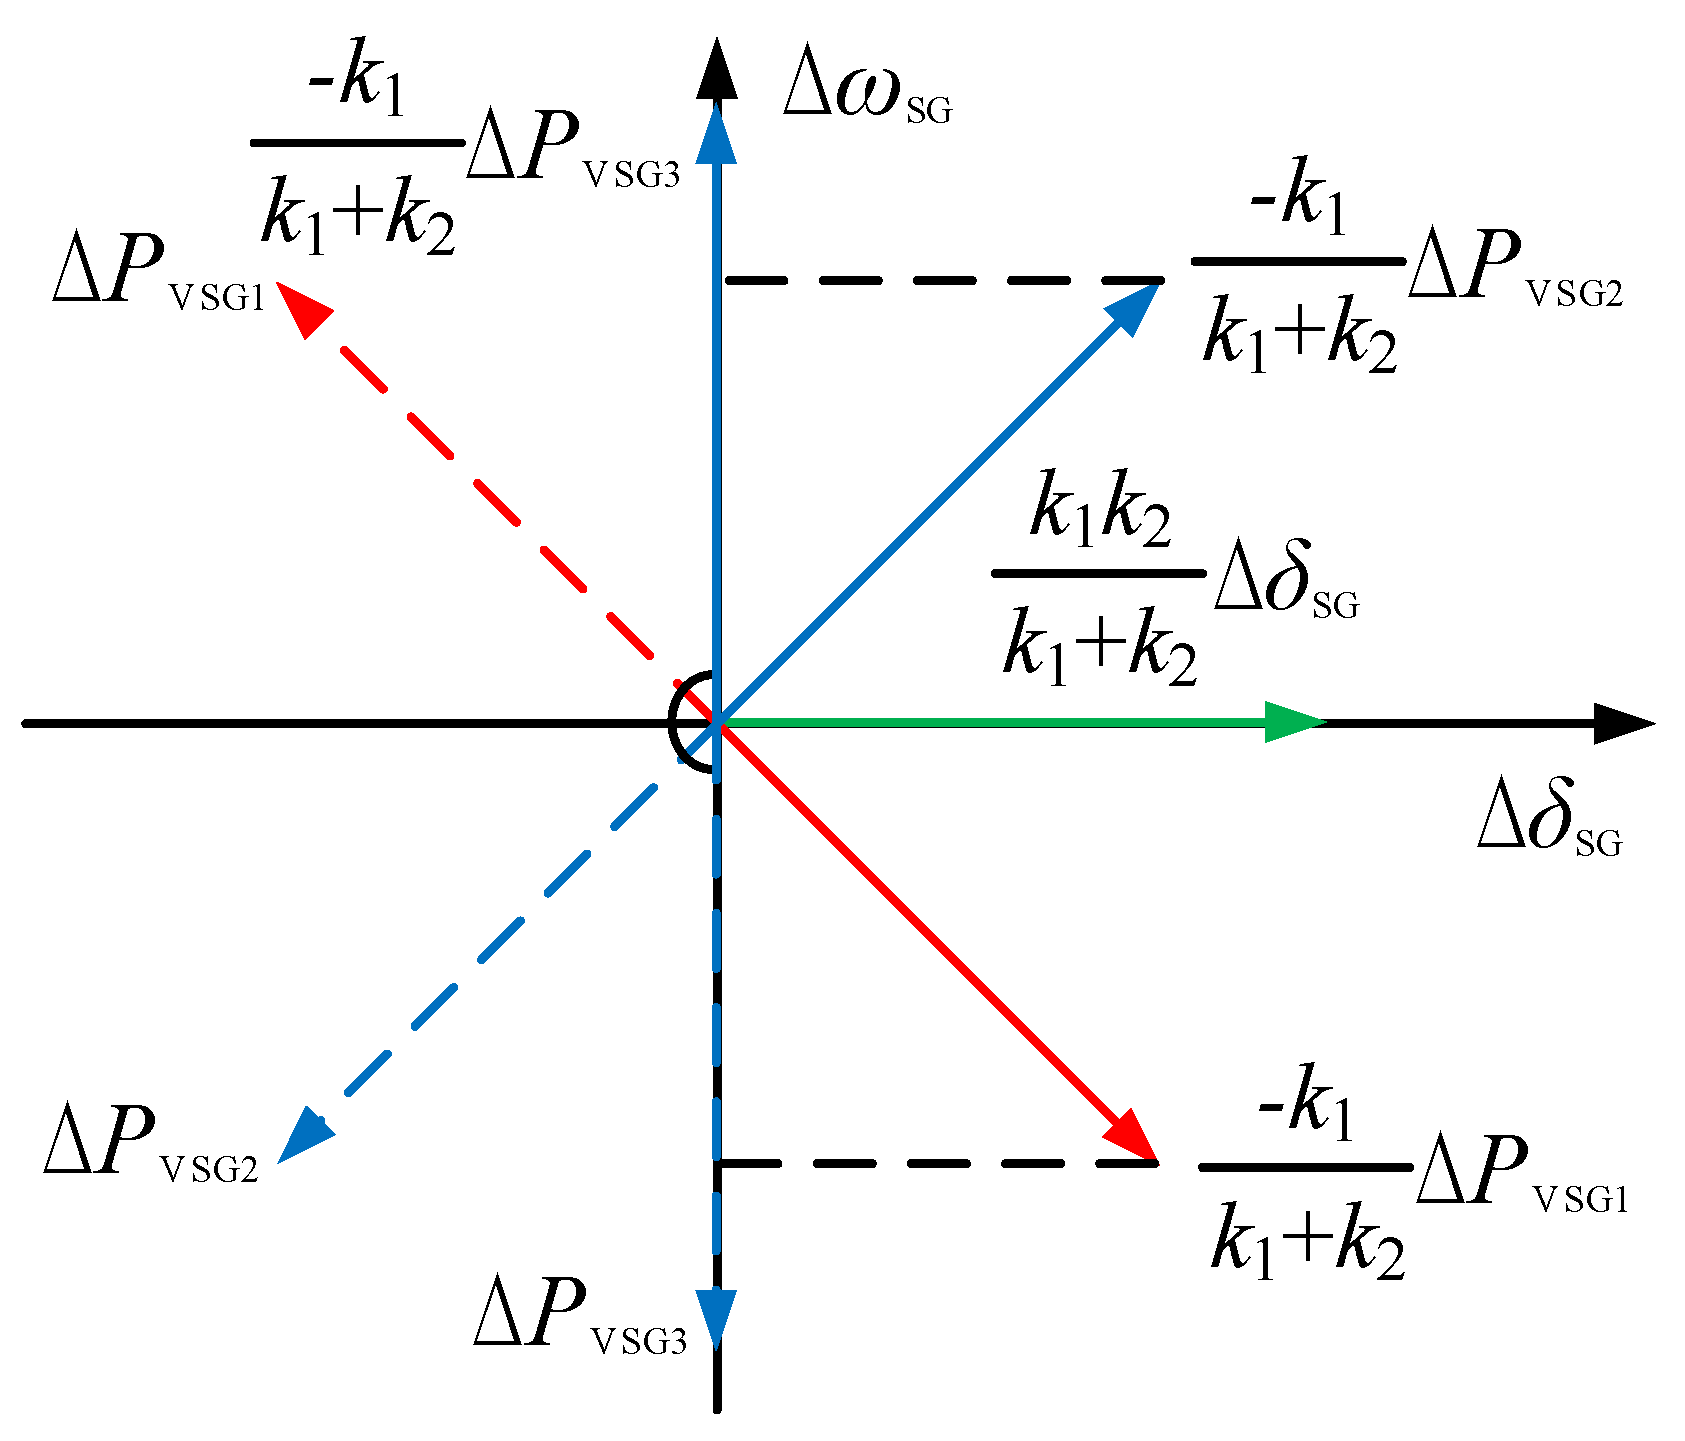
2.2. Damping Characteristics Analysis

A single-machine infinite bus system with an RES power plant, as shown in Figure 3, is considered to analyze the influence of VSG on the damping characteristics.
In Figure 3, the infinite bus is served as the swing node and the phase angle is set to 0. When the resistances of the transmission lines are neglected, the loop current equation can be expressed as:
U p δ p U 0 x Σ 2 = E SG δ SG U p δ p x Σ 1 + U pcc δ pcc U p δ p x Σ 3
where U 0 , U p δ p and U pcc δ pcc denote the voltage vector of infinite bus, grid connection point of the RES power plant (bus 3) and PCC (bus 2) respectively; E SG δ SG denotes the vector of generator inner potential; x Σ 1 , x Σ 2 and x Σ 3 are the sum of the reactances of the transmission lines.
According to Equation (2), the voltage vector of bus 3 can be expressed as:
U p δ p = ( a 1 U + a 2 E SG cos δ SG + a 3 U pcc cos δ pcc ) + j ( a 2 E SG sin δ SG + a 3 U pcc sin δ pcc ) ,
where a 1 , a 2 and a 3 can be calculated as:
a 1 = x Σ 1 x Σ 3 x Σ 1 x Σ 3 ( x Σ 1 x Σ 2 + x Σ 1 x Σ 3 + x Σ 2 x Σ 3 ) ( x Σ 1 x Σ 2 + x Σ 1 x Σ 3 + x Σ 2 x Σ 3 ) , a 2 = x Σ 2 x Σ 3 x Σ 2 x Σ 3 ( x Σ 1 x Σ 2 + x Σ 1 x Σ 3 + x Σ 2 x Σ 3 ) ( x Σ 1 x Σ 2 + x Σ 1 x Σ 3 + x Σ 2 x Σ 3 ) , a 3 = x Σ 1 x Σ 2 x Σ 1 x Σ 2 ( x Σ 1 x Σ 2 + x Σ 1 x Σ 3 + x Σ 2 x Σ 3 ) ( x Σ 1 x Σ 2 + x Σ 1 x Σ 3 + x Σ 2 x Σ 3 ) .
According to Equation (3), the phase angle of the bus 3 can be written as
δ p = arctan a 2 E SG sin δ SG + a 3 U pcc sin δ pcc a 1 U + a 2 E SG cos δ SG + a 3 U pcc cos δ pcc .
Differentiating δ p , one can get
ω p = δ ˙ p = b 1 ω + b 2 ω SG + b 3 ω pcc b 1 + b 2 + b 3 ,
where ω p , ω , ω SG and ω pcc denote the angular frequency of bus 3, infinite bus , bus 1 and bus 2, respectively; b 1 , b 2 and b 3 can be calculated as:
b 1 = a 1 2 U 2 + a 1 a 2 E SG U cos δ SG + a 1 a 3 U U pcc cos δ pcc , b 2 = a 2 2 E SG 2 + a 1 a 2 E SG U cos δ SG + a 2 a 3 E SG U pcc cos ( δ SG δ pcc ) , b 3 = a 3 2 U pcc 2 + a 1 a 3 U U pcc cos δ pcc + a 2 a 3 E SG U pcc cos ( δ SG δ pcc ) .
Considering the control diagram of VSG, the frequency of bus 2 is mainly decided by the virtual angular frequency ω VSG calculated in the active power loop. Furthermore, VSG synchronizes with grid after being connected to the grid, small deviation of frequency only exists in the transient state. Therefore, one can obtain ω VSG = ω pcc ω p approximately; then, Equation (6) can be rewritten as
ω pcc = ω p = b 1 ω + b 2 ω SG b 1 + b 2 .
Equation (8) is used to derive the small-signal model as
Δ ω p = Δ ω pcc = c 1 Δ δ SG + c 2 Δ δ pcc + c 3 Δ ω + c 4 Δ ω SG + c 5 Δ U + c 6 Δ E SG + c 7 Δ U pcc ,
where the expressions of c 1 , c 2 , c 3 , c 4 , c 5 , c 6 and c 7 are shown in Equation (10). The variables subscripted with 0 denote the steady value of the corresponding ones:
c 1 = m a 2 a 3 E SG 0 U pcc 0 sin ( δ SG 0 δ pcc 0 ) b 10 a 1 a 2 E SG 0 U 0 sin δ SG 0 ( b 20 b 10 ) , c 2 = m a 1 a 3 U 0 U pcc 0 sin δ pcc 0 b 20 a 2 a 3 E SG 0 U pcc 0 sin ( δ SG 0 δ pcc 0 ) b 10 , c 3 = b 10 / ( b 10 + b 20 ) , c 4 = b 20 / ( b 10 + b 20 ) , c 5 = m 2 a 1 2 U 0 b 20 + a 1 a 2 E SG 0 cos δ SG 0 ( b 20 b 10 ) + a 1 a 3 U pcc 0 cos δ pcc 0 b 20 , c 6 = m 2 a 2 2 E SG 0 b 10 a 1 a 2 U 0 cos δ SG 0 ( b 10 b 20 ) a 2 a 3 U pcc 0 cos ( δ SG 0 δ pcc 0 ) b 10 , c 7 = m a 1 a 3 U 0 cos δ pcc 0 b 20 a 2 a 3 E SG 0 cos ( δ SG 0 δ pcc 0 ) b 10 , m = ( ω 0 ω SG 0 ) / ( b 10 + b 20 ) 2 .
The frequency of each bus is equal in the steady state, so ω 0 = ω SG 0 and m is equal to 0. Thus, c 1 , c 2 and c 5 , c 6 , c 7 are also equal to 0. Since the frequency of infinite bus is not changed, Δ ω = 0 , Equation (9) can be simplified as
Δ ω VSG = Δ ω pcc = c 4 Δ ω SG .
When the power loss on the transmission lines is neglected, the active power transmission equation of the grid shown in Figure 3 can be expressed as Equation (12):
E SG U p x Σ 1 sin ( δ SG δ p ) + P VSG = U U p x Σ 2 sin ( δ p ) .
Assuming the inner potential of generator E SG is constant, the small-signal model of Equation (12) is shown as follows:
E SG 0 U p 0 x Σ 1 cos ( δ SG 0 δ p 0 ) ( Δ δ SG Δ δ p ) + E SG 0 x Σ 1 sin ( δ SG 0 δ p 0 ) Δ U p + Δ P VSG = U 0 U p 0 x Σ 2 cos ( δ p 0 ) Δ δ p + U 0 x Σ 2 sin ( δ p 0 ) Δ U p .
According to Equation (13), the small disturbance of the phase angle of bus 3 can be written as
Δ δ p = k 1 Δ δ SG k 1 + k 2 + Δ P VSG k 1 + k 2 + ( k 3 k 4 ) Δ U p k 1 + k 2 ,
where k 1 , k 2 , k 3 and k 4 are
k 1 = E SG 0 U p 0 x Σ 1 cos ( δ SG 0 δ p 0 ) , k 2 = U 0 U p 0 x Σ 2 cos ( δ p 0 ) , k 3 = E SG 0 x Σ 1 sin ( δ SG 0 δ p 0 ) , k 4 = U 0 x Σ 2 sin ( δ p 0 ) .
The output active power of the synchronous generator is calculated as
Δ P e = k 1 ( Δ δ SG Δ δ p ) + k 3 Δ U p = k 1 k 2 k 1 + k 2 Δ δ SG k 1 k 1 + k 2 Δ P VSG + k 2 k 3 + k 1 k 4 k 1 + k 2 Δ U p .
It can be found in Equation (16) that the electromagnetic power of the synchronous generator consists of three parts. Since the active power is mainly related to the frequency and phase in the power system, the variation of voltage caused by the variation of the active power can be neglected in the third part of Equation(16). According to the damping torque analysis, the impacts of the electromagnetic power of the generator Δ P e on the system can be explained in the Δ ω SG Δ δ SG plane, which is shown in Figure 4. The first part is proportional to the variation of rotor angle Δ δ SG , so it is aligned with the horizontal axis, which can be regarded as synchronizing torque. The second part is proportional to the variation of output active power of VSG, whose impacts on the system may have the following four cases or their combinations: (1) positive damping torque; (2) negative damping torque; (3) positive synchronizing torque; and (4) negative synchronizing torque. How the variation of output active power from VSG affects the system mainly depends on the phase relationship between Δ P VSG and Δ ω SG . When Δ P VSG is 90 ° 90 ° ahead of Δ ω SG , it is located in the first quadrant or second quadrant. Due to the existence of the minus sign, the second part of Equation (16) is located in the third or fourth quadrant. The component of the second part of Equation (16) on the negative vertical axis can be regarded as the negative damping torque. However, when Δ P VSG is 90 ° 270 ° ahead of Δ ω SG , it is located in the third quadrant or fourth quadrant, and the second part of Equation (16) is located in the first or second quadrant consequently, whose component on the positive vertical axis can be regarded as the positive damping torque. Furthermore, the positive damping is the strongest when the leading angle is 180 ° .
Substituting the mathematical model of active power loop in Equation (1) and Equation(11) into Equation(13), the small disturbance of the phase angle of bus 3 can be rewritten more specifically as:
Δ δ p = k 1 k 1 + k 2 Δ δ SG T J VSG c 4 k 1 + k 2 ( s 2 Δ δ SG ) D p * c 4 k 1 + k 2 ( s Δ δ SG ) + ( k 3 k 4 ) Δ U p k 1 + k 2 ,
where s denotes the differential operator.
Then, the output active power of synchronous generator can also be calculated as Equation (18). Similarly, the variation of voltage caused by the variation of the active power is neglected:
Δ P e = k 1 k 2 k 1 + k 2 Δ δ SG + T J VSG c 4 k 1 + k 2 ( s 2 Δ δ SG ) + D p * c 4 k 1 + k 2 ( s Δ δ SG ) .
Adopting the classical second-order model of synchronous generator, the small signal model of the rotor motion equation is shown as follows:
T J ( s 2 Δ δ SG ) + D ( s Δ δ SG ) + Δ P e = 0 ,
where T J is the inertia time constant; D is the damping coefficient; and P e is the electromagnetic power.
Substituting Equation (18) into Equation (19), we have
T J + d 1 s 2 Δ δ SG + D + d 2 s Δ δ SG + d 3 Δ δ SG = 0 ,
where d 1 = T J VSG c 4 k 1 k 1 + k 2 , d 2 = D p * c 4 k 1 k 1 + k 2 and d 3 = k 1 k 2 k 1 + k 2 .
It can be observed that the equivalent inertia time constant of the synchronous generator is increased from T J to ( T J + d 1 ) , and the equivalent damping coefficient is increased from D to ( D + d 2 ) , which indicates that an RES power plant controlled by VSG can truly increase the equivalent damping of the power system. According to Equation (20), the damping ratio can be calculated as
ξ = D + d 2 2 ( T J + d 1 ) d 3 ,
where d 1 and d 2 are closely related to T J VSG and D p * . Therefore, the selection of control parameters of VSG has impacts on the damping ratio of the system. With the increase of the D p * , d 2 increase and the damping ratio increase consequently, while d 1 increases with the increase of T J VSG , which means the damping ratio is decreasing.

3. System Modeling and Small-Signal Analysis

The qualitative analyses are made qualitatively with some simplification in last section. To study this problem in more detail, the small-signal stability analysis model of the system shown in Figure 3 is built and the eigenvalue analysis method is used to do some analysis quantitatively in this section.

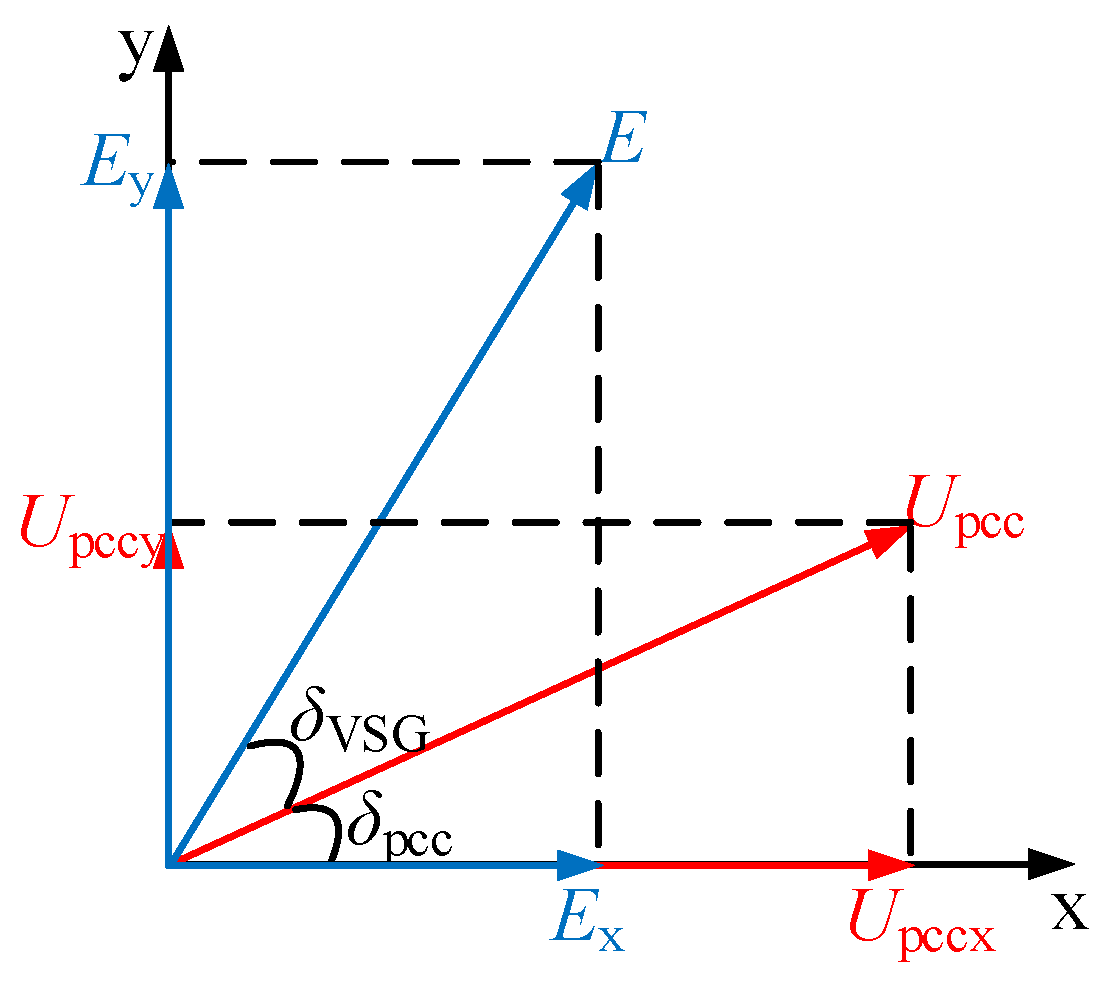
3.1. Modeling of RES Power Plant Controlled by VSG

The mathematical model of VSG can be derived as Equation (1) from the control diagram shown in Figure 2. When the time delay of pulse-width modulation (PWM) is neglected, the midpoint voltage of the inverter is approximately equal to the modulation wave. Therefore, the rms value of midpoint voltage is E, which is determined by the reactive power loop of VSG. The phase relationship between midpoint voltage and the voltage of PCC is shown in Figure 5, where the phase difference is δ VSG . The interface equations between VSG and power system is derived as Equation (22) according to Figure 3 and Figure 5:
I px + j I py = E x + j E y U pccx + j U pccy j X s , E x = E cos δ VSG + δ pcc , E y = E sin δ VSG + δ pcc , δ pcc = arctan ( U pccy / U pccx ) ,
where I p is the injected grid current of VSG; and δ pcc is the leading angle of bus 2 relative to infinite bus. All the variables subscripted with x or y denote the components of corresponding physical quantity in the x y frame.

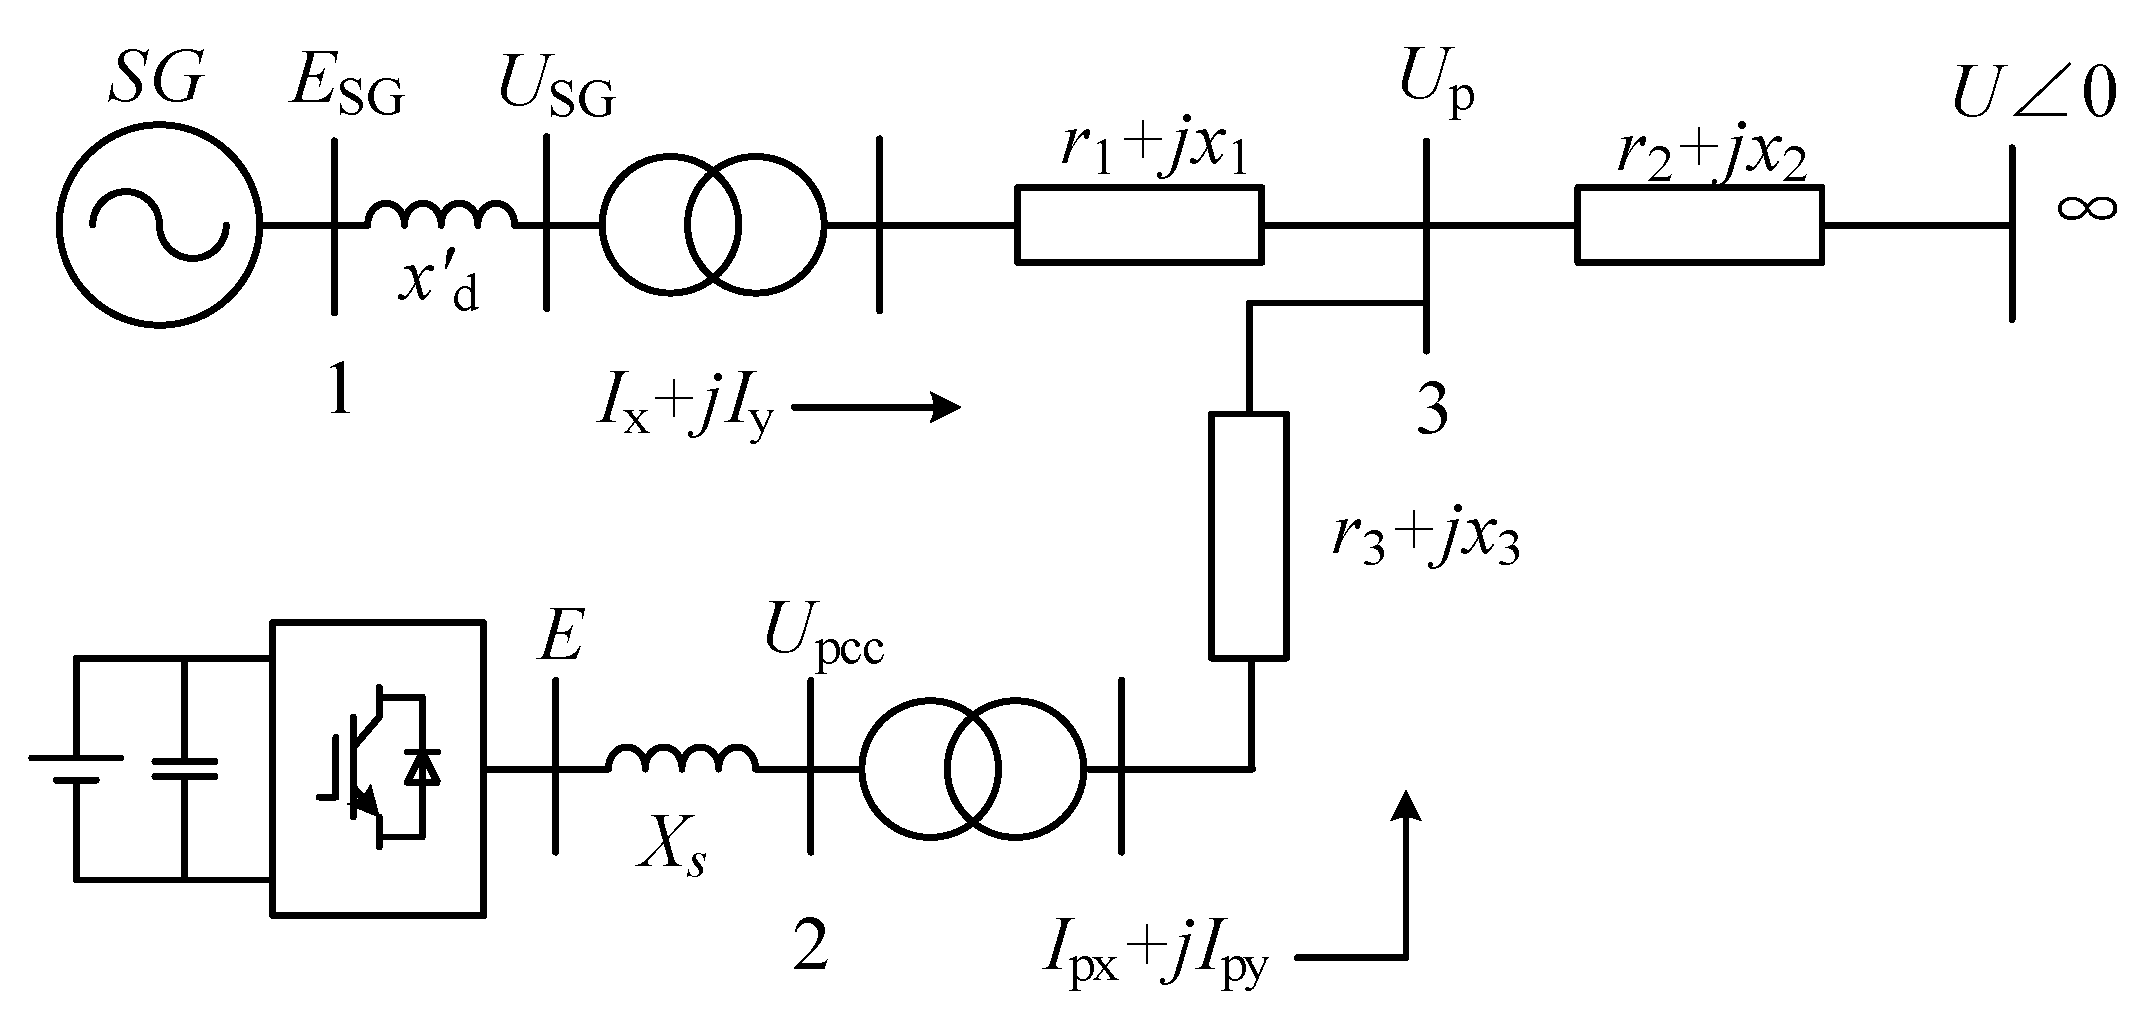
3.2. Modeling of Synchronous Generator

In order to take into account the dynamics of the excitation system and the salient pole effect of the generator, third-order utility models of synchronous generators and first-order excitation systems are adopted to make the small-signal stability analysis. The mathematical model is shown as
d δ SG d t = ω SG 1 ω 0 T J d ω SG d t = P m P e D ω SG 1 , T d 0 d E q d t = E f E q x d x d I d , T a d E f d t = U SG _ ref U SG K a E f , P e = E q I q x d x q I d I q , U SGd = x q I q r a I d , U SGq = E q x d I d r a I q ,
where δ SG is the power angle; ω SG is the angular speed; ω 0 is the rated angular speed; T J is the inertia time constant; P m is the mechanical power of prime mover; P e is the electromagnetic power; D is the constant damping coefficient; T d 0 is the direct-axis transient open-circuit time constant; E q is quadrature-axis transient electromotive force; E f is excitation electromotive force; x d and x d are the direct-axis synchronous reactance and transient reactance; x q is the quadrature-axis synchronous reactance; I d and I q are the direct-axis current and quadrature-axis current; U SGd and U SGq are the direct-axis terminal voltage and quadrature-axis terminal voltage. r a is the stator resistance; T a and K a are the time constant and gain of automatic voltage regulator (AVR); U SG _ ref and U SG are the reference and actual value of terminal voltage.
The coordinates transform relationship between d q synchronous rotating frame and x y stationary frame is expressed in Equation (24), where f denotes electrical variables in the synchronous generator, which can be current, voltage or magnetic linkage, etc.:
f x = f d sin δ SG + f q cos δ SG , f y = f d cos δ SG + f q sin δ SG .

3.3. Modeling of Transmission Lines

According to the topology shown in Figure 3, the following constraint equations can be obtained:
I x + j I y = U SGx + j U SGy U px + j U py r 1 + j x 1 , I px + j I py = U pccx + j U pccy U px + j U py r 3 + j x 3 , U px + j U py U r 2 + j x 2 = U SGx + j U SGy U px + j U py r 1 + j x 1 + U pccx + j U pccy U px + j U py r 3 + j x 3 ,
where I is the injected grid current of the synchronous generator; U SG is the terminal voltage of generator; r 1 + j x 1 , r 2 + j x 2 and r 3 + j x 3 are the impedance of the transmission lines. All the variables subscripted with x or y denote the components of corresponding physical quantity in the x y frame.
The mathematical model of each part shown in Figure 3 is proposed above. Without being otherwise specified, all of the variables are per unit value. The mathematical model of the whole system can be expressed in the form of differential-algebraic equations as follows:
x ˙ = f ( x , y ) , 0 = g ( x , y ) ,
where x = ( δ SG , ω SG , E q , E f , δ VSG , ω VSG , E ) are the state variables; y = ( I d , I q , U SGd , U SGq , I px , I py , U pccx , U pccy , U px , U py ) are the algebraic variables. Based on the modeling method of the small-signal stability analysis, linearize the differential-algebraic equations at steady-state operating point and eliminate the algebraic variables. Then, the linear state equation of the whole system is derived as Equation (27). The damping ratio and transient process of the system can be analyzed by calculating the eigenvalues:
Δ x ˙ = f x f y ( g y ) 1 g x Δ x = A Δ x .

3.4. Eigenvalue Analysis

In this section, the eigenvalues of the system are quantitatively analyzed with specific parameters to discuss the influence of control parameters of VSG on the damping characteristics. Electrical parameters of the synchronous generator and RES power plants are listed in Table 1 and Table 2. The voltage rating of the transmission lines is 220 kV, and their equivalent impedances are all chosen as (7.875 + 40.5i) Ω . The RES power plant uses 10 kV collecting power lines, which connect to the grid through a set-up transformer. The base power of the system is 100 MW, and the base frequency is 50 Hz. Virtual damping coefficient D p is chosen as 10,000 (thus, D p * = 9.8696 ), while voltage droop coefficient D q is chosen as 24,500 ( D q * = 2.0 ). It means that the torque (active power) changes by 100% of nominal power when frequency change 1 Hz, and the reactive power change by 100% of nominal power when grid voltage change is 10% of nominal voltage. Virtual inertia coefficient J and integral coefficient K are chosen as 100 and 550 in accordance with the time constant of active power and reactive power loop [9,29]. Thus, T J VSG and T K can be calculated as 0.1 and 0.045, respectively.
Firstly, the influence of virtual damping coefficient D p * on the damping characteristic is analyzed. The root locus plot is shown in Figure 6a as D p * increases from 0 to infinity. Although several eigenvalues exist for the total system, only the dominant one associated with oscillation is shown. In addition, only the upper half of the s-plane is shown, as the lower half is a mirror image of the upper half. It is shown in Figure 6a that the eigenvalue moves gradually to the left with the increase of D p * , which means that the damping ratio of the system is increasing. This influence law of D p * is consistent with theoretical analysis made in Section 2.2. The intuitive explanation of this phenomenon is that D p * can affect the output active power of VSG, and the change direction of output active power is opposite to that of rotor angle. Specifically, when there is surplus active power and the rotor accelerates more than the synchronous speed, the increase of power system frequency will reduce the output active power of VSG, which alleviates the power oscillation to some extent. Figure 6b shows the trend of the damping ratio with the increase of D p * . As the change of the real part of the eigenvalue is significant at the initial stage, the damping ratio of the system increases very quickly. After D p * reaches a certain value (about 100), the real part of eigenvalue changes slightly and gets close to the adjacent zero. Obviously, the damping ratio is maximized (about 0.01439) when D p * is infinite, which is also the damping ratio corresponding to the zero point.
Root locus plot and the trend of damping ratio for different sets of inertia time constant T J VSG are shown in Figure 7a,b. As observed, the trend of the damping ratio is non-monotonic. The real part of the eigenvalue first increases and the system damping ratio decreases. When T J VSG increases to about 1.5, continuing to increase T J VSG will enhance the damping ratio. Finally, the eigenvalue will reach the adjacent zero, where the damping ratio is the largest, about 0.01439. Compared with the analysis of Equation (21), it can be found that the theoretical analysis is only consistent with the result of the eigenvalue calculation before T J VSG reaches the inflection point. Because the theoretical analysis uses the simplified second-order model of the synchronous generator, and many influencing factors are neglected and linearized, the damping ratio enhances with the increase of T J VSG after the inflection point is not reflected in the theoretical analysis.
Figure 8 and Figure 9 show the influence of the voltage droop coefficient D q * and the time constant of reactive power loop T K on the damping characteristics of the system respectively. It is shown in Figure 8a that the real part of the eigenvalue is decreased with the increase of D q * on a large scale. Only when the eigenvalue is close to the zero point, the real part of eigenvalue increases slightly, which has fewer impacts on the damping ratio. Thus, the trend of the damping ratio with the change of D q * shown in Figure 8b is almost monotonic. Finally, the influence of T K on the damping ratio of the system is analyzed. Similar to T J VSG , the trend of damping ratio with the change of T K is also non-monotonic. As can be seen from Figure 9, increasing T K causes the eigenvalues to move to the left, which will enhance the damping ratio. After T K reaches the inflection point (about 0.045), the eigenvalue moves slowly to the zero and the damping ratio decreases from the maximum (about 0.01428) to the minimum (about 0.0138).
In summary, integrating an RES power plant controlled by VSG into a power system has some impacts on the damping characteristics. Adjusting the control parameters of VSG can regulate the system damping ratio. However, the effect of each parameter on the damping ratio is limited and slight. Among them, the greatest impact on the damping ratio is only 0.0018, which has a neglectable impact on actual system operation.

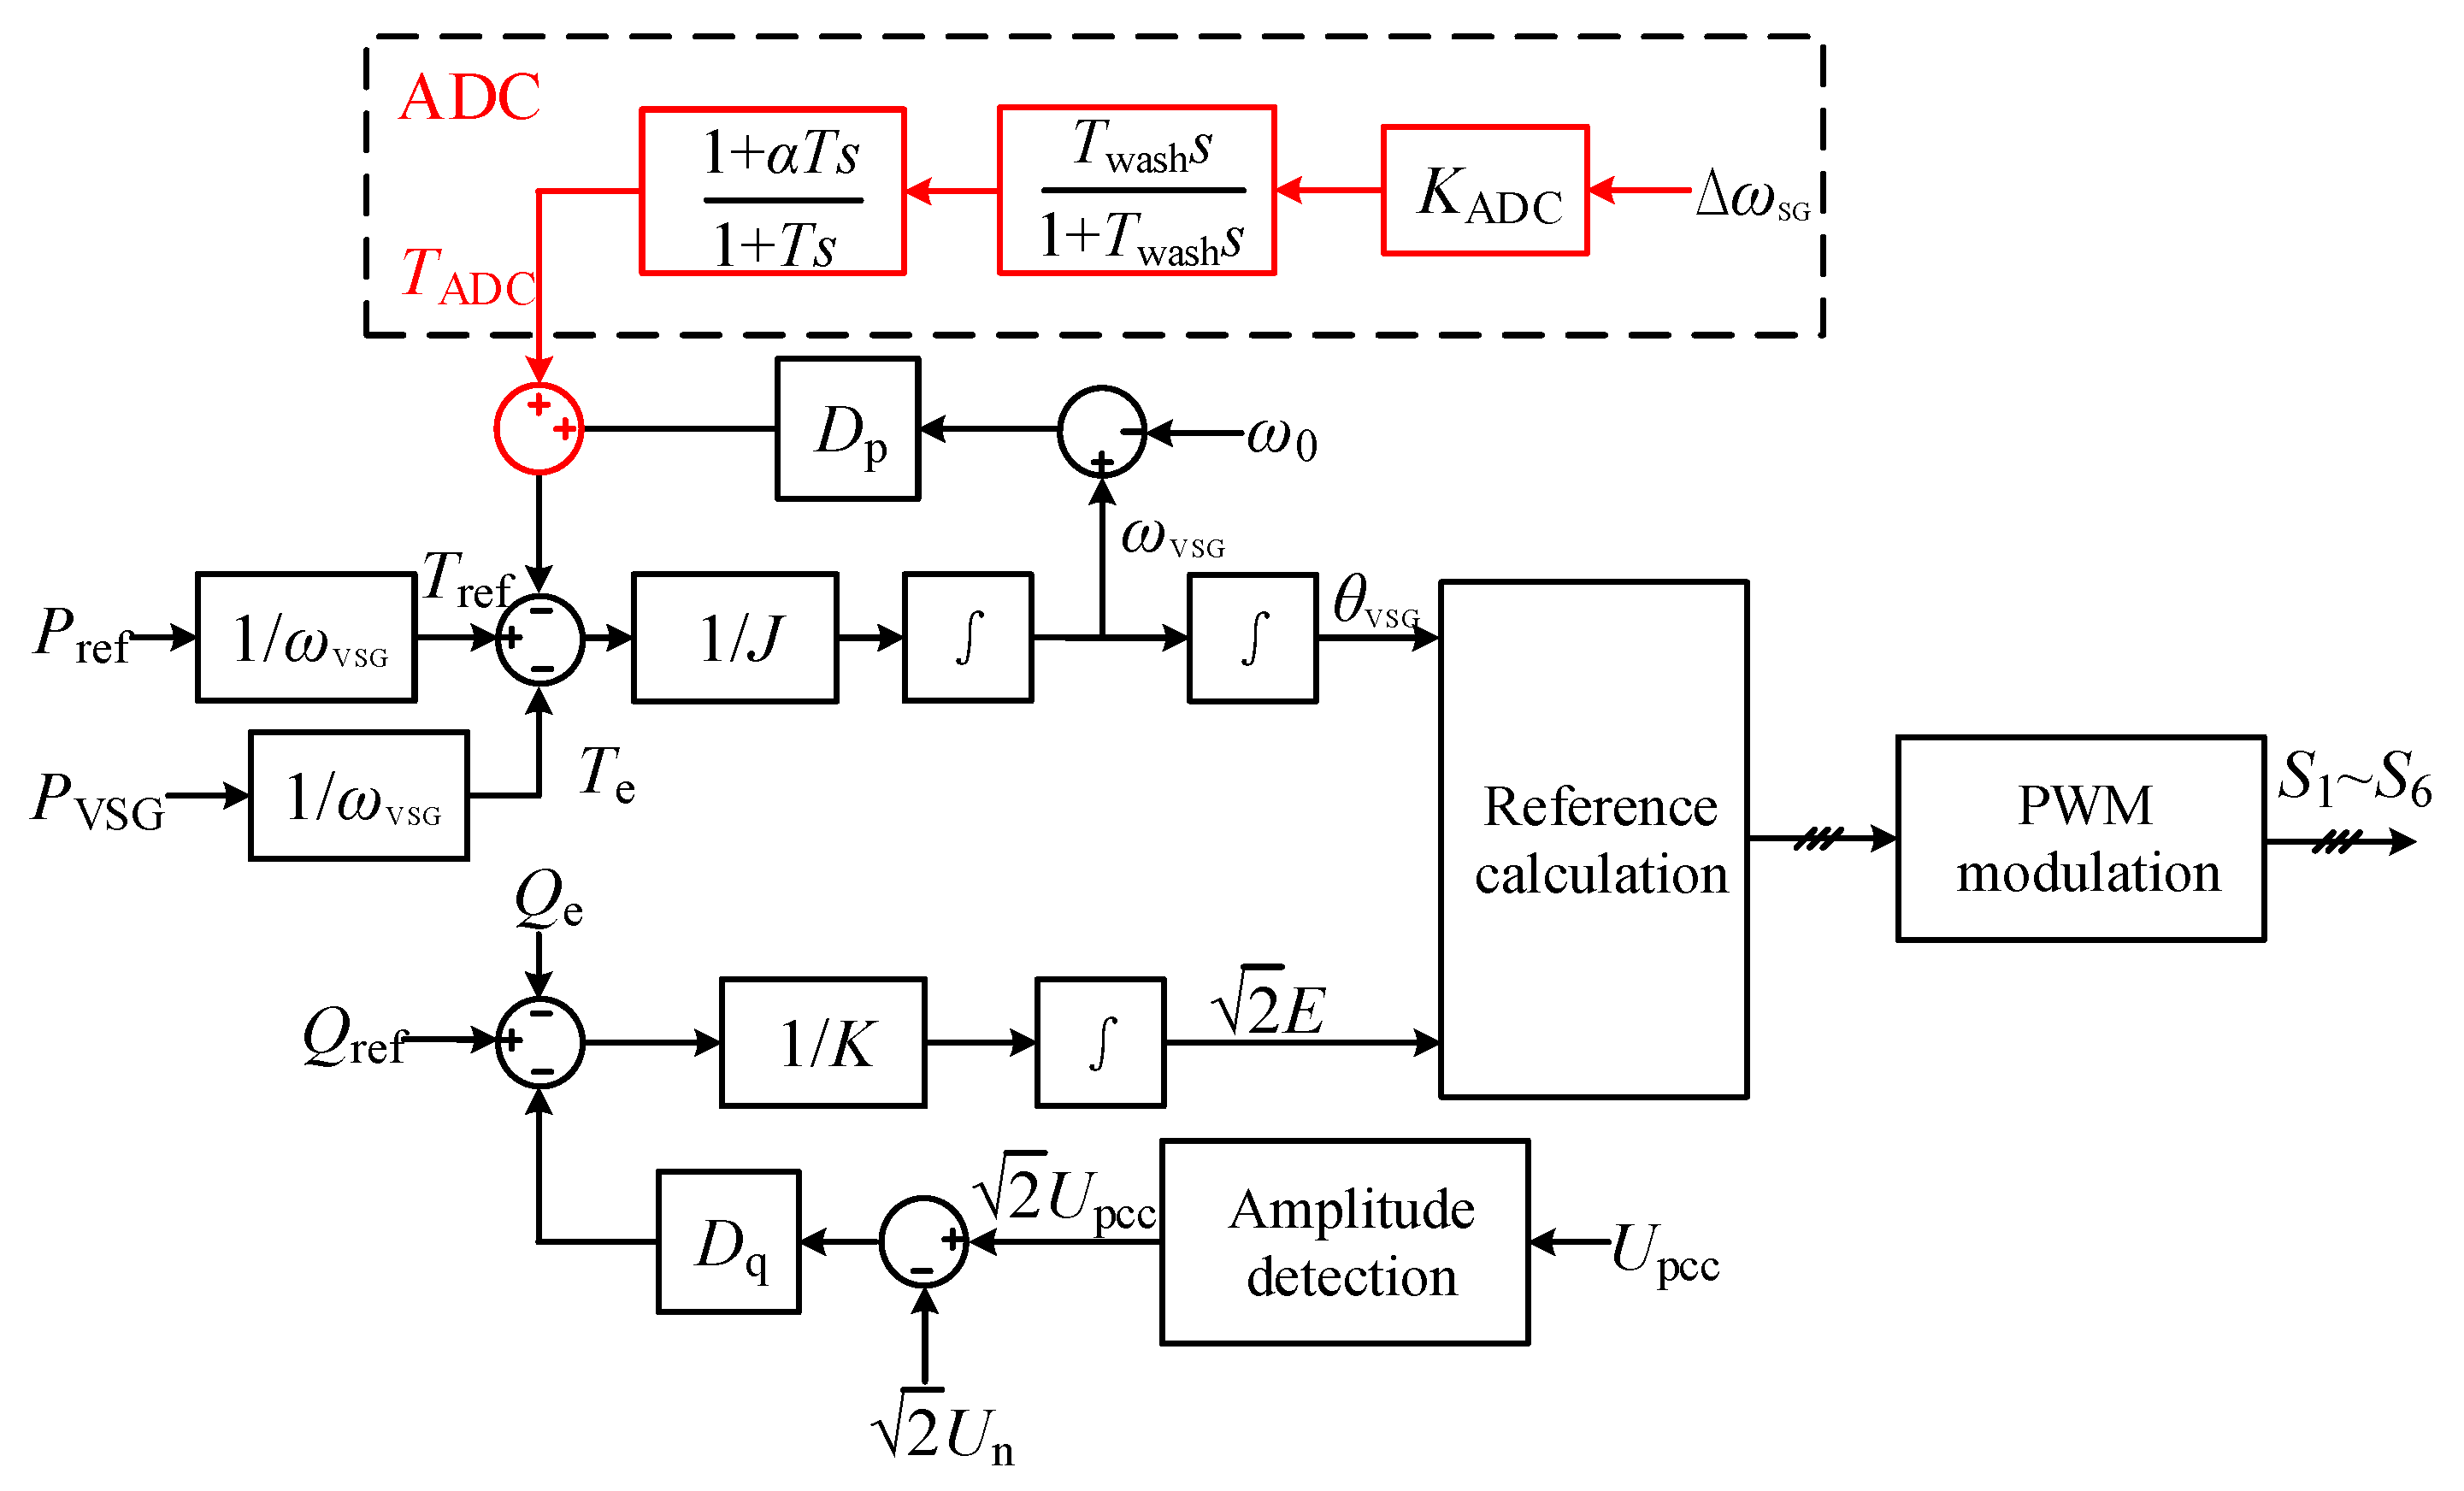
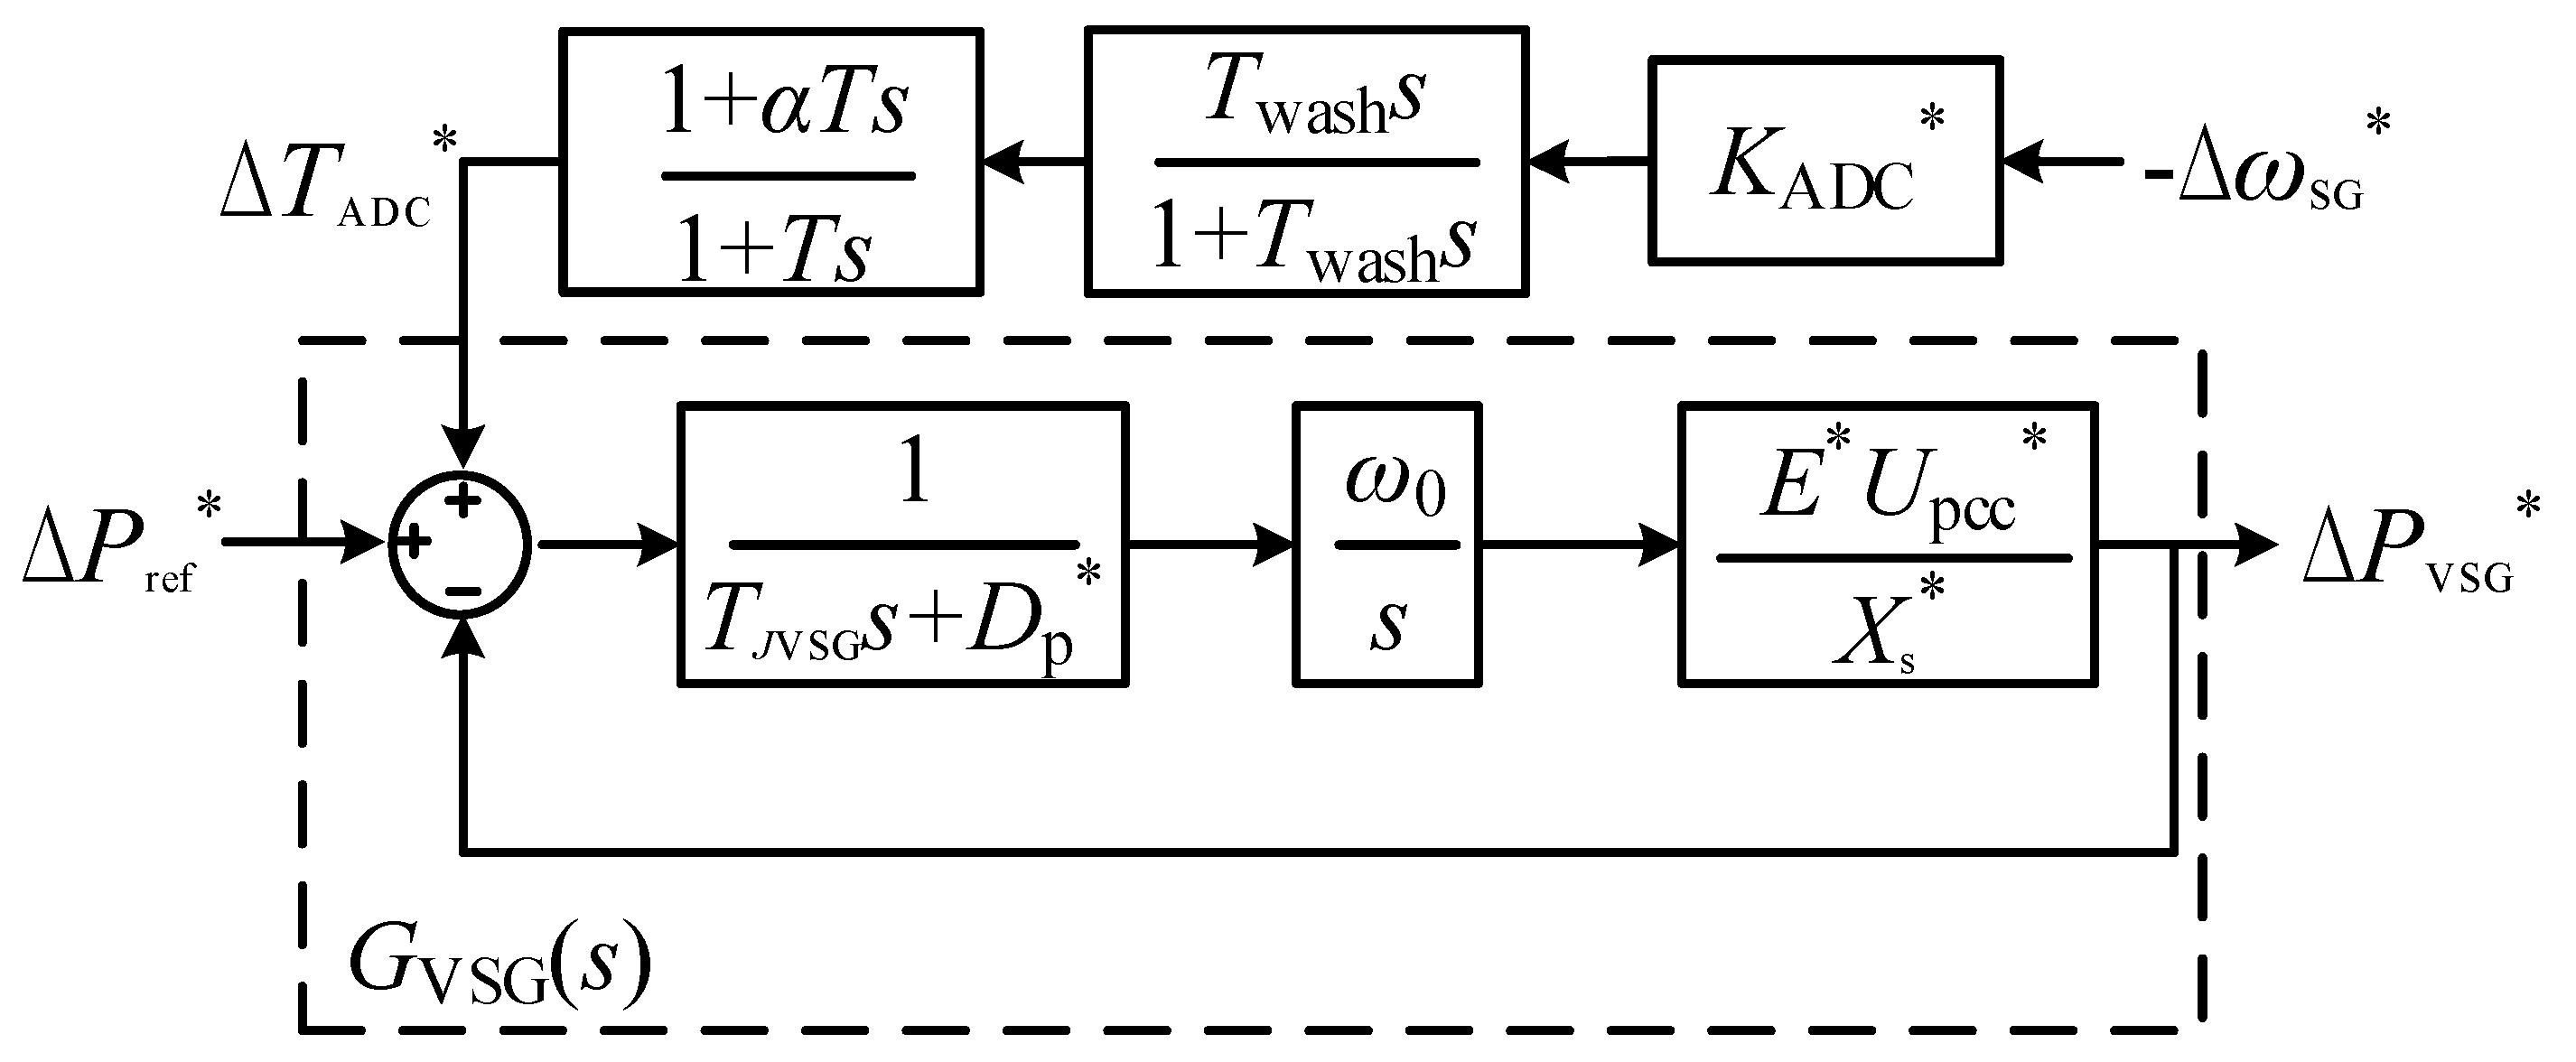
4. Auxiliary Damping Controller for VSG

The control parameters of VSG have slight impacts on the system damping ratio. Furthermore, each control parameter should be designed in accordance with the grid code, converter capacity and stability of the control system etc, which is usually no longer changed under normal operation (or only changed within a limited range). Therefore, it is difficult for VSG itself to provide additional damping to the power system. In order to further improve the ability of oscillation damping of VSG, it is necessary to design the auxiliary damping controller (ADC).
Inspired by the theoretical analysis that the output active power of VSG can provide positive damping torque in Section 2.2, if the speed signal of the synchronous generator (or other signals associated with the speed) can be added in the active power loop of VSG and the output active power of VSG is reversed from the speed signal, then VSG can provide positive damping torque for the system.
Figure 10 shows the control diagram of VSG with the ADC. The configuration of ADC is very similar to traditional PSS, which consists of three main parts. Among them, the controller gain K ADC can adjust the amplitude of additional damping; washout component filters the DC signal and ensures no side effects of the ADC on VSG when the system works steadily; lead/lag components compensate the phase difference caused by control, measurement, etc. and ensure that the output active power of VSG can provide a positive damping torque to the grid. The input signal of ADC is chosen as the variation of generator speed, which can also be chosen as the variation of electromagnetic power or some signals associated with the speed. Generally, the synchronous generator may not work in parallel with an RES power plant, so the implementation of ADC needs the deployment of a wide area measurement system (WAMS) [3]. The input signals of ADC are measured by the sensors and phasor measurement units (PMUs) located at the synchronous generators. Then, the signals are sent to the damping controller through dedicated communication links. The ADC calculates and discretizes modulation signals to actuate the VSG. For a more complex system, a data concentrator may need to collect the signals from the sensors and distribute these to the actuators [30,31]. Time delay varying from a few milliseconds to several hundreds of milliseconds exists during real application mainly due to communication and measurement [3,31]. The performance of ADC and the stability of the control system may be affected because of the time delay. Therefore, the algorithm of time delay compensation has to be considered in practical applications [31,32,33].
As the configuration and purpose of the ADC are basically consistent with the PSS, the parameters design can also refer to the existing experience of PSS. The phase compensation method is used in this paper to determine the parameters of ADC. Because the active power loop and the reactive power loop are approximately decoupled [29], and the output signal of ADC only affects the active power loop, it is feasible to only analyze the active power loop. The mathematical model of the active power loop contained with ADC can be expressed as
T J VSG d ω VSG * d t = P ref * P VSG * D p * ω VSG * 1 K ADC * G ADC ( s ) ω SG * 1 ,
where K ADC * = ( K ADC ω 0 2 ) / S B is the p.u value of gain; G ADC ( s ) is the transfer function of washout and lead/lag component; ω SG * is the p.u value of generator speed. The definition of other variables is the same as above.
According to the small-signal model of Equation (28), the transfer function of the active power loop contained with ADC is shown in Figure 11. As the theoretical analysis made in Section 2.2, the positive damping torque provided by VSG is the strongest when the phase difference between Δ P VSG and Δ ω SG is 180 ° , which means the lead/lag components need to compensate for the phase delay of the active power loop of VSG.
There is only one dominant electromechanical oscillation mode in the system shown in Figure 3. The damped natural oscillation frequency of this mode can be calculated approximately by the second-order rotor motion equation as
ω d = 4 T J K D 2 2 T J ,
where K = P e / δ E SG 0 U cos δ SG 0 / x Σ , E SG 0 U cos δ SG 0 can be obtained from the steady-state values of power flow calculation, or be approximated as E SG 0 U cos δ SG 0 1 ; x Σ = x Σ 1 + x Σ 2 + x d is the sum of impedances from the generator to the infinite bus. T J is the inertia time constant; D is the damping coefficient. Substituting relevant parameters and let E SG 0 U cos δ SG 0 1 , the damped natural oscillation frequency can be obtained as ω d = 3 π , which basically corresponds to the eigenvalue analysis in Section 3.4.
The transfer function of the active power loop is:
G VSG ( s ) = Δ P VSG * Δ T ADC * = ω 0 E * U pcc * T J VSG X s * s 2 + D p * X s * s + ω 0 E * U pcc * = 100 π 0.217 s 2 + 21.7 s + 100 π .
The frequency characteristic of Equation (30) at the damped natural oscillation frequency is
G VSG ( j ω d ) = 0.875376 34.75 ° .
In order to filter the DC signals and pass through all the signals with damped natural oscillation frequency, the time constant of the washout component should satisfy the requirements of ω d T wash 1 . Normally, T wash can be selected from 3 to 10, while we chose T wash = 5 here. The frequency characteristic of the washout component at the damped natural oscillation frequency can be written as
G wash ( j ω d ) = 5 s 1 + 5 s s = j ω d = 0.99977 1.216 ° .
When the sum of phase angles of lead/lag component and washout component is equal to the phase delay caused by the active power loop of VSG, the output active power Δ P VSG can provide maximum damping torque to the system. Therefore, the lead/lag component is designed as a lead component and the lead angle is chosen as 33.5 ° . Because the maximum angle correction of one lead component is 30∼ 40 ° , only one lead component is chosen here. The time constant of lead component is chosen as 0.05, which should be selected from 0.05 to 0.1 typically. Then, according to Equation (33), the variables α of lead component can be calculated as α = 3.49 :
φ c ( ω ) = arctan α T ω arctan T ω = arctan ( α 1 ) T ω 1 + α T 2 ω 2 .
Finally, the gain of ADC is designed in accordance with the desired damping ratio of the system, which can be expressed as
K ADC * = 2 ξ T J ω d T wash s 1 + T wash s 1 + α T s 1 + T s G VSG ( s ) k 1 k 1 + k 2 ,
where ξ is the desired damping ratio. Normally, it satisfies ξ > ( 0.1 0.3 ) . The first three items in the denominator are the amplitude of washout component, lead component and transfer function of active power loop at damped natural frequency, respectively; the last item in the denominator is the proportional relationship between the output active power and the damping torque shown in Equation (16). According to Equation (34), when the ξ is equal to 0.1, the gain K ADC * can be calculated as 18.29.
At this point, the parameters of the ADC are all designed. In order to verify the effectiveness of the controller and parameter design, eigenvalue analysis of the system integrated with ADC is made under the same circumstances and parameter settings. As shown in Figure 12, the initial dominant poles is (−0.118 ± 8.262i) and the damping ratio is 0.01428 without ADC. After adopting the ADC and the K ADC * is chosen as 18.29, the dominant poles move to (−0.258 ± 8.147i), where the damping ratio increases to 0.03164. It can be found that the actual damping ratio is not consistent with the desired one ( ξ = 0.1), which is the inherent drawback of the phase compensation method to design the gain. Due to the simplicity and approximation in the process of design, the designed system may not meet the requirements completely and accurately. However, this method can be used to provide a reasonable initial value for the parameters. Then, parameter modification can be accomplished according to the results of eigenvalue analysis, time-domain simulation or field test [2]. Continuing to increase the gain to 100, the dominant poles move further to the left to (−0.761 ± 7.556i), and the damping ratio increases to 0.1.

5. Simulation Results

The single-machine infinite bus system integrated with the RES power plant shown in Figure 3 is modeled in Matlab/Simulink (R2013a, The MathWorks, Inc. Natick, MA, USA) to verify the validity of the theoretical analysis and the proposed ADC. The key parameters are the same as that used in the eigenvalue analysis, which are listed in Table 1 and Table 2. The system initially operates in a steady state. A three-phase ground fault occurs at bus 3 when t = 1 s. After the fault lasts for 0.1 s, the system is back to normal again after a transient process.

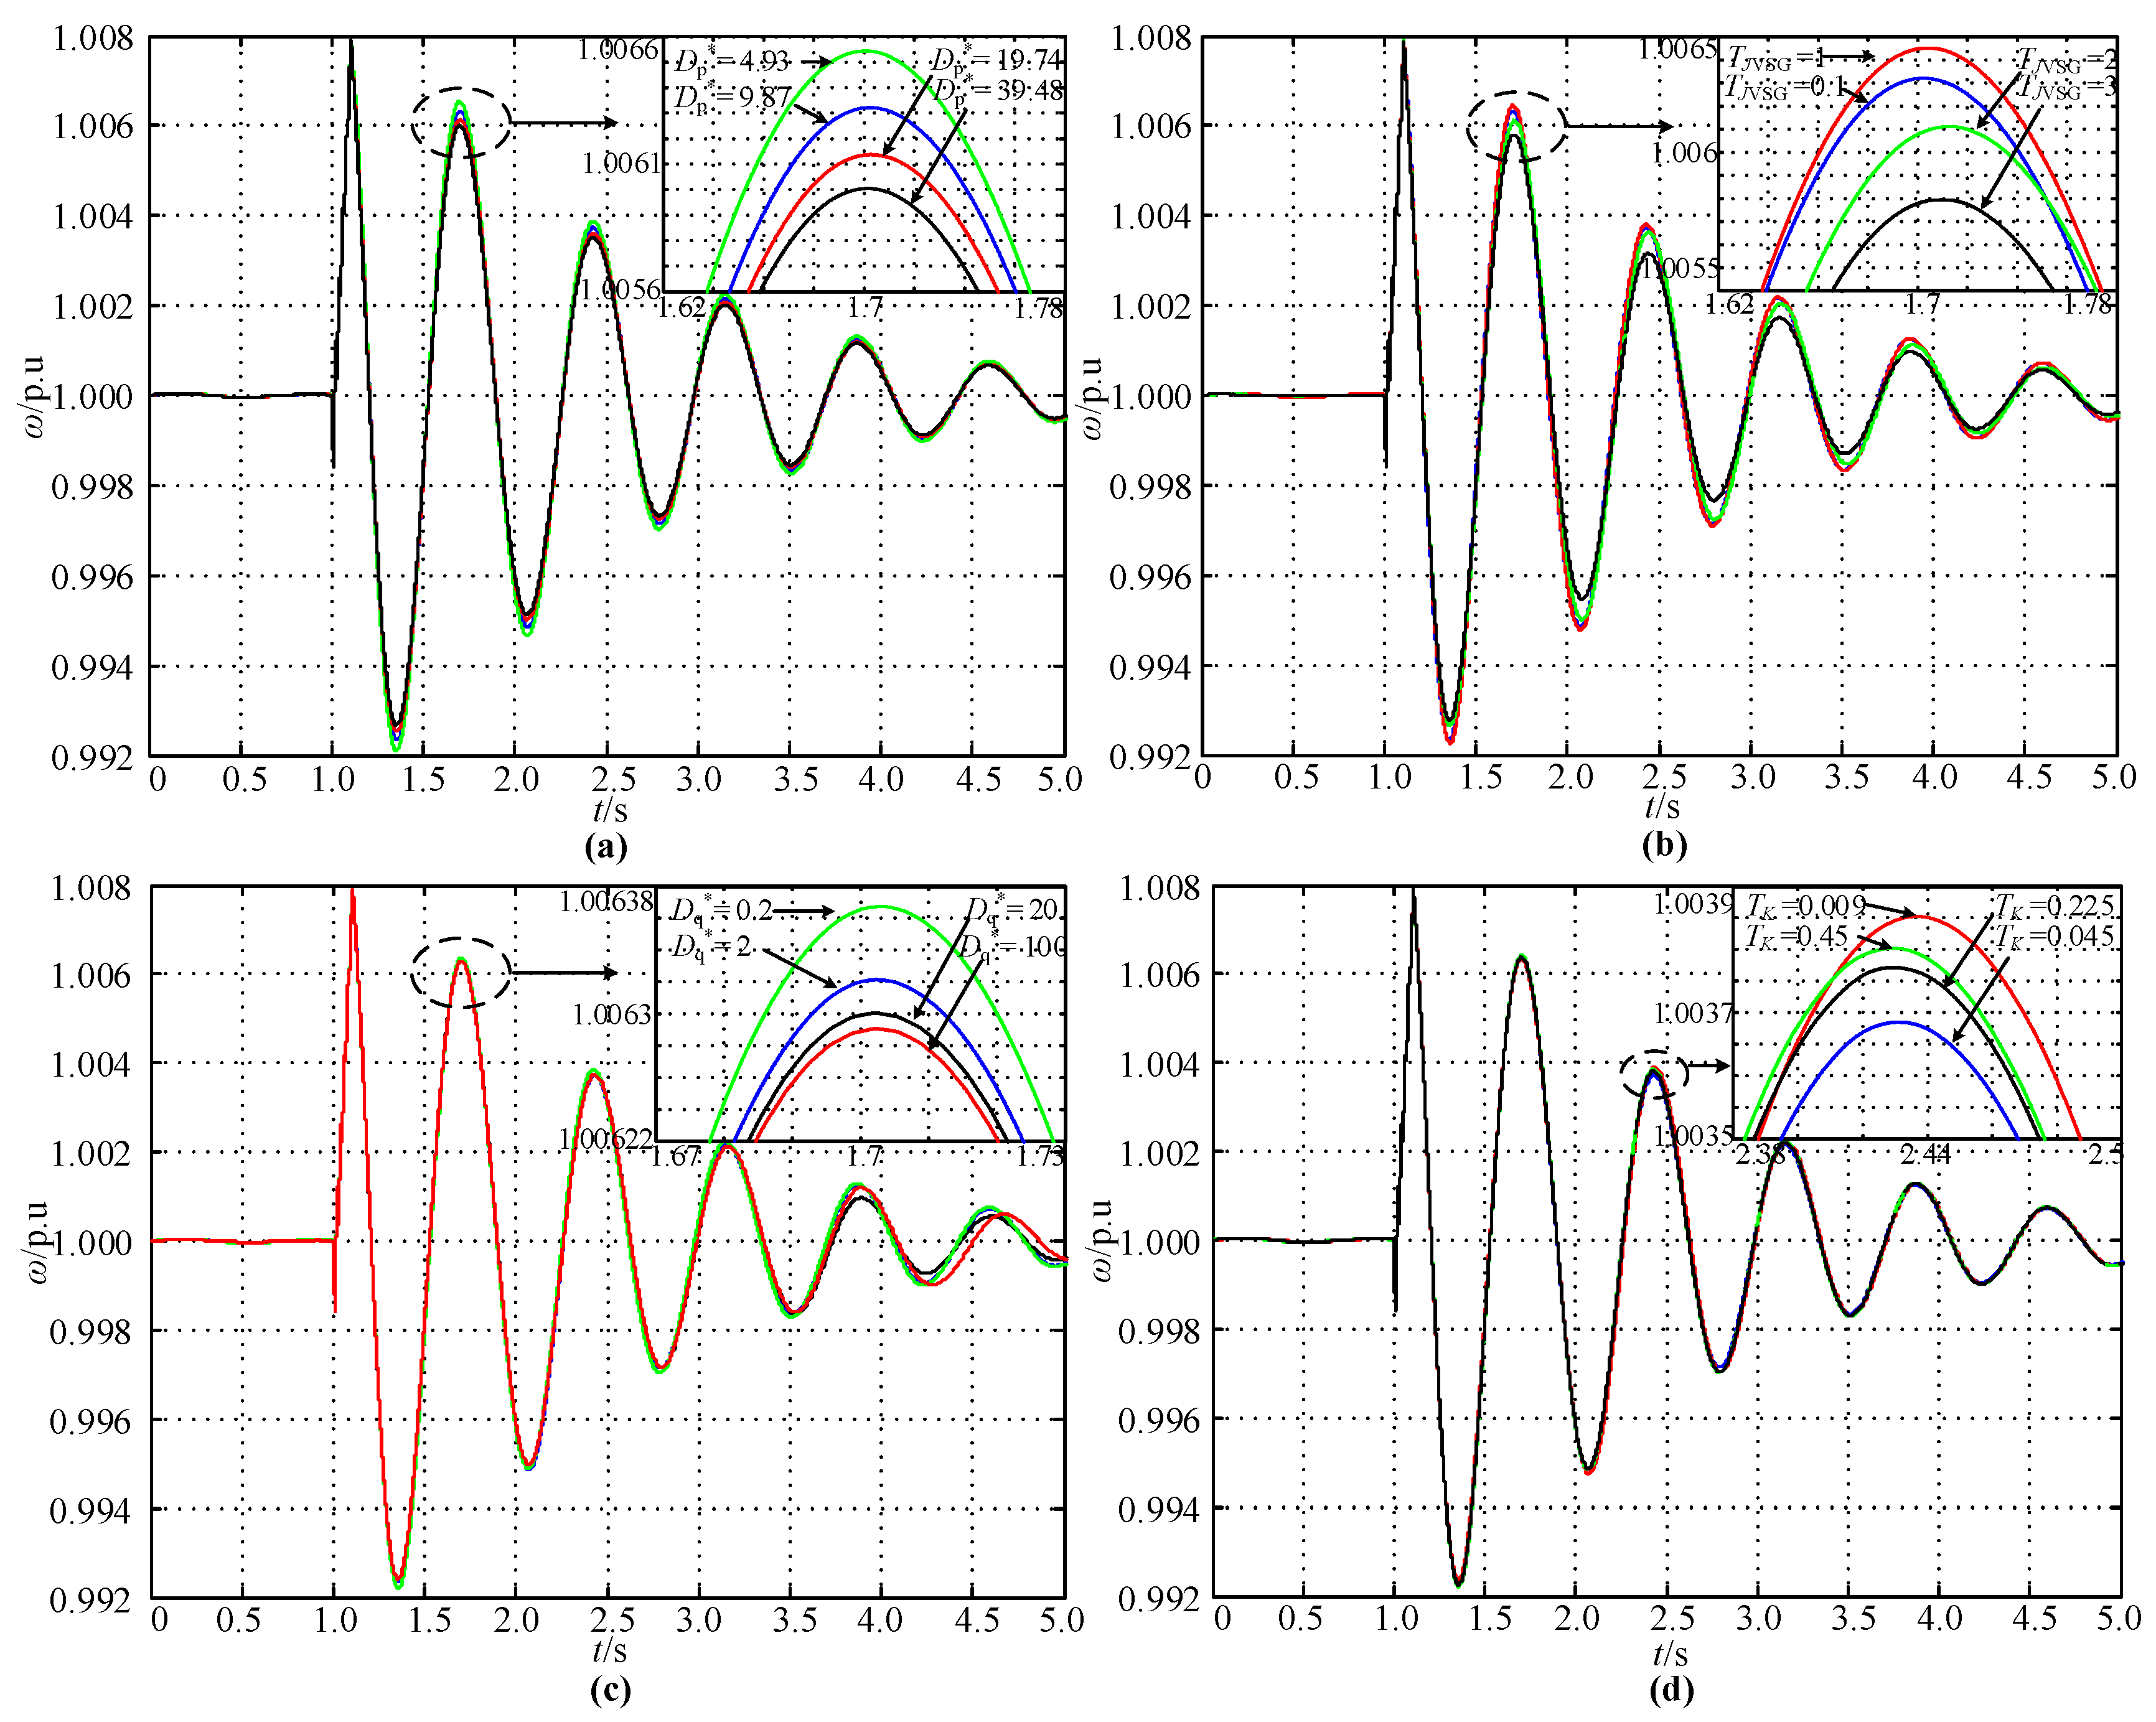
5.1. Dynamic Response for Different Sets of Control Parameters

Firstly, the influence of control parameters of VSG on the damping characteristics, which is analyzed in Section 3.4, is analyzed and verified. The dynamic response of generator speed is shown in Figure 13a. Due to the lack of damping, the synchronous generator has experienced an obvious oscillation process after the ground fault. To improve the system damping, increasing the virtual damping coefficient D p * to 19.74 and 39.48, respectively (other parameters remain unchanged), the other two sets of oscillation curves can be obtained. As observed, the amplitude of the rotor oscillation is reduced and the system damping ratio is improved after the increase of D p * . Similarly, the decrease of D p * will weaken the system damping.
Figure 13b depicts the oscillation curves of generator speed for different sets of inertia time constant T J VSG . Considering that the influence of T J VSG on the system damping ratio is non-monotonic, the parameters are chosen on both sides of the inflection point. The amplitude of oscillation is increased when T J VSG is set to 1. However, when T J VSG is greater than the inflection point, continuing to increase T J VSG can enhance the damping ratio.
The influence rules of voltage droop coefficient D q * and time constant of reactive power loop T K are verified in Figure 13c,d. The simulation results under different sets of parameters can all correspond to the theoretical analysis. However, by observing all of the simulation results, it can be found out that adjusting the parameters of VSG truly has slight impacts on the damping ratio. It may be not practical to provide additional damping torque to the power system only depending on the VSG.

5.2. Dynamic Response with Proposed ADC

Based on the controller proposed in Section 4, some simulations are also performed to verify its effectiveness. The parameters of ADC are selected in accordance with the results of parameter design, and other parameters and circumstances remain unchanged. The dynamic response of generator speed before and after integration with the ADC is shown in Figure 14. It can be observed that the amplitude of oscillation is reduced and the transient period is shortened significantly. The greater the gain of K ADC * is, the stronger the damping torque that can be provided by the ADC. However, it should be noted that excessive gain will deteriorate the dynamic response and even cause the control system to be unstable, and the stability boundary of the parameters of ADC for different systems can be obtained by the root locus or time domain simulation. The relationship between output active power of VSG and generator speed is shown in Figure 15. The phase of these two signals is approximately opposite from each other, which means that Δ P VSG can provide a positive damping torque to the system and contribute to the suppression of rotor oscillation.

6. Conclusions

Large-scale renewable energy sources integrated by power electronic devices have impacts on the damping characteristics and threaten the stable operation of the power system. In this paper, the influence of an RES power plant controlled by VSG strategy on the damping characteristics is studied by theoretical analysis and eigenvalue calculation. Based on the results of theoretical analysis and the structure of traditional PSS, an auxiliary damping controller is proposed to provide a positive damping torque to the system. There are three main conclusions that can be drawn:
(1)
Due to the existence of a virtual damping coefficient, the integration of VSG can improve the equivalent damping of the power system. In addition, when the variation of output active power of VSG is 90∼ 270 ° ahead of the variation of generator speed, VSG can provide a positive damping torque to the synchronous generator.
(2)
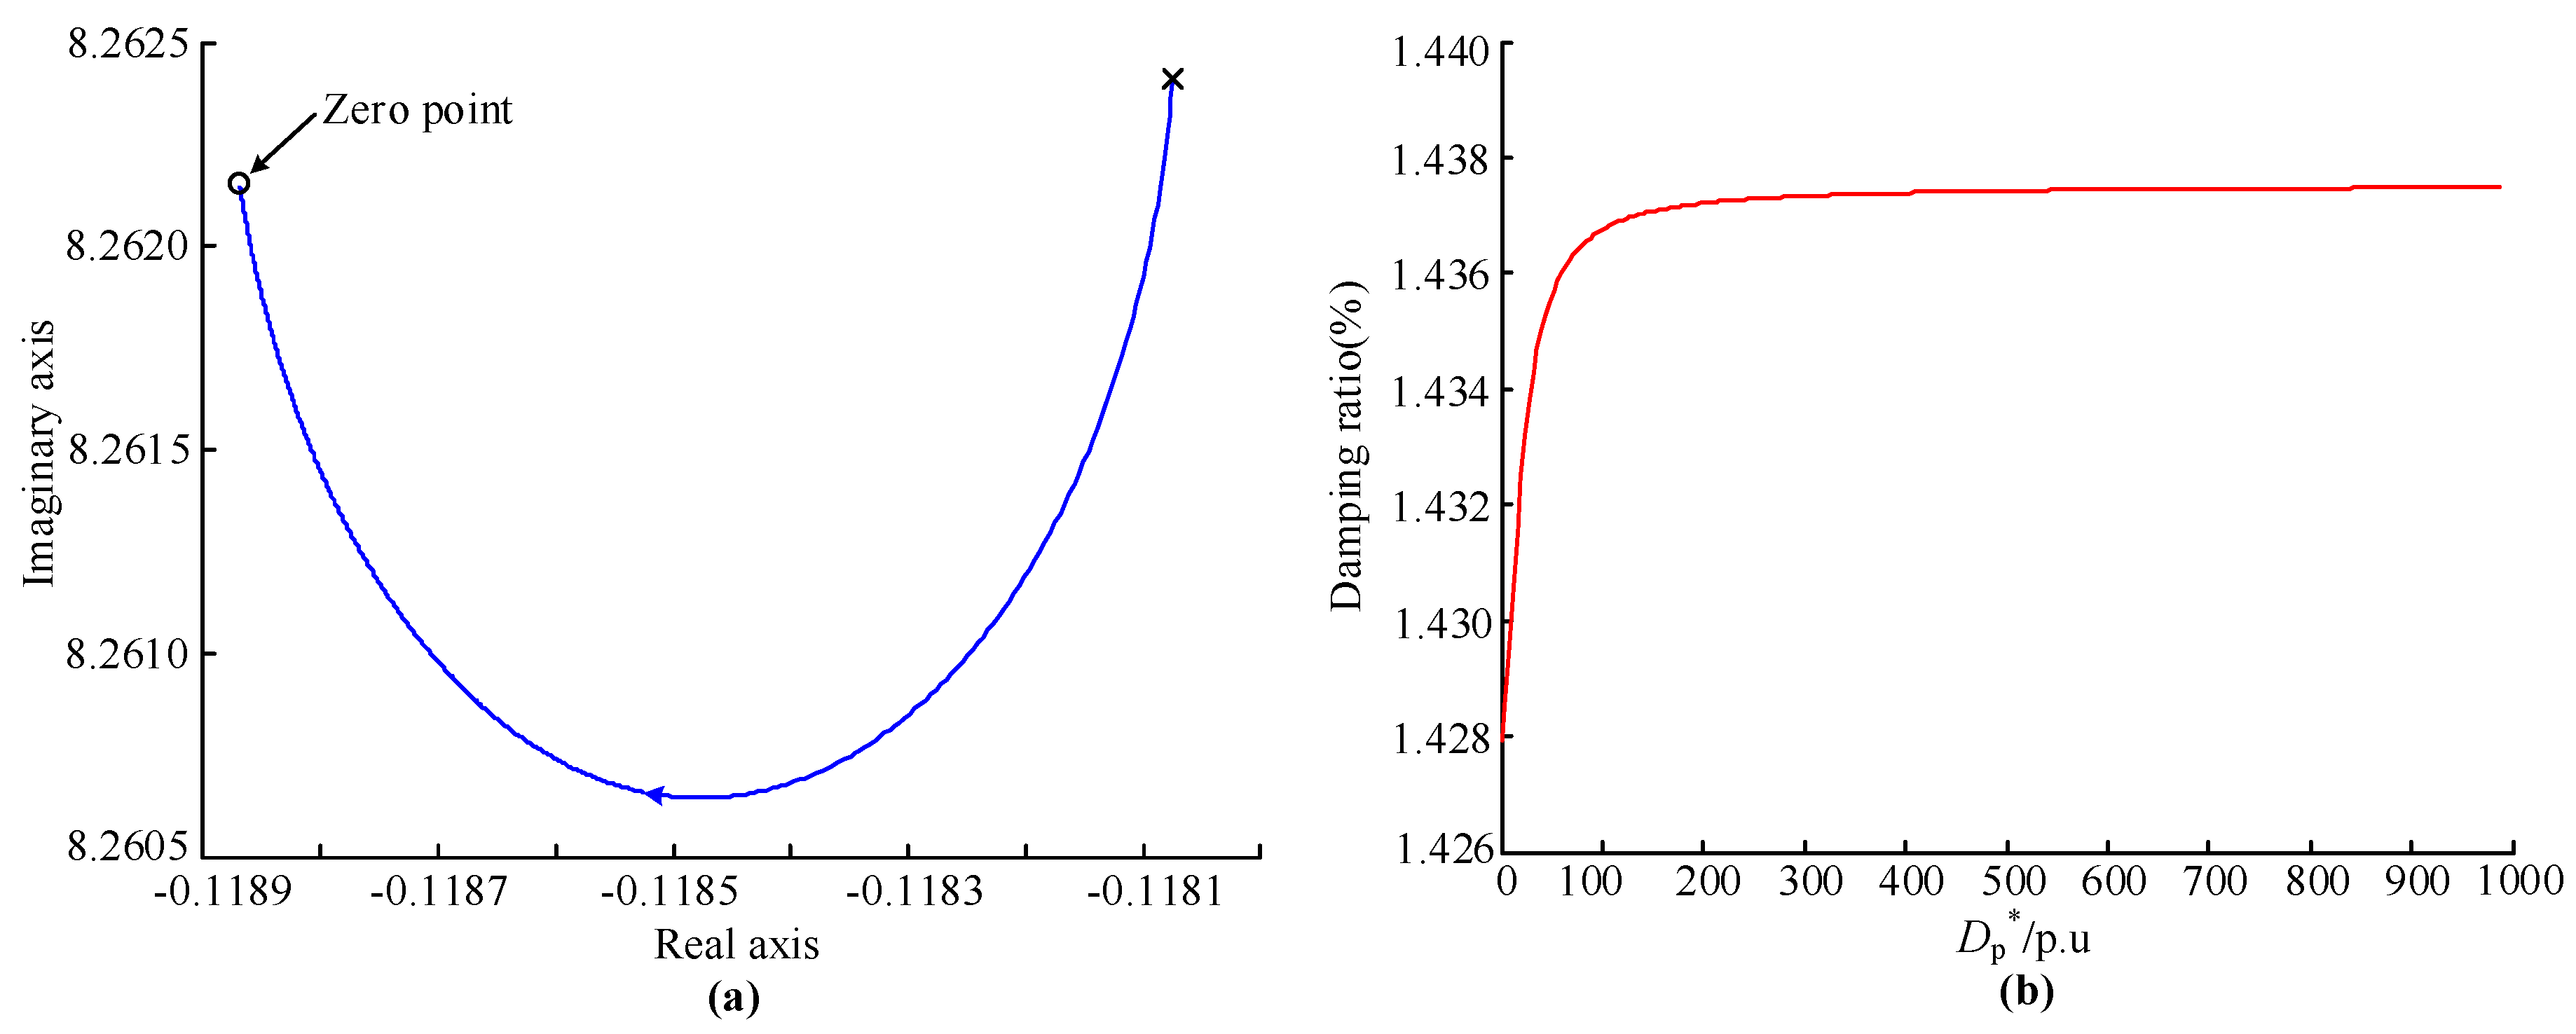
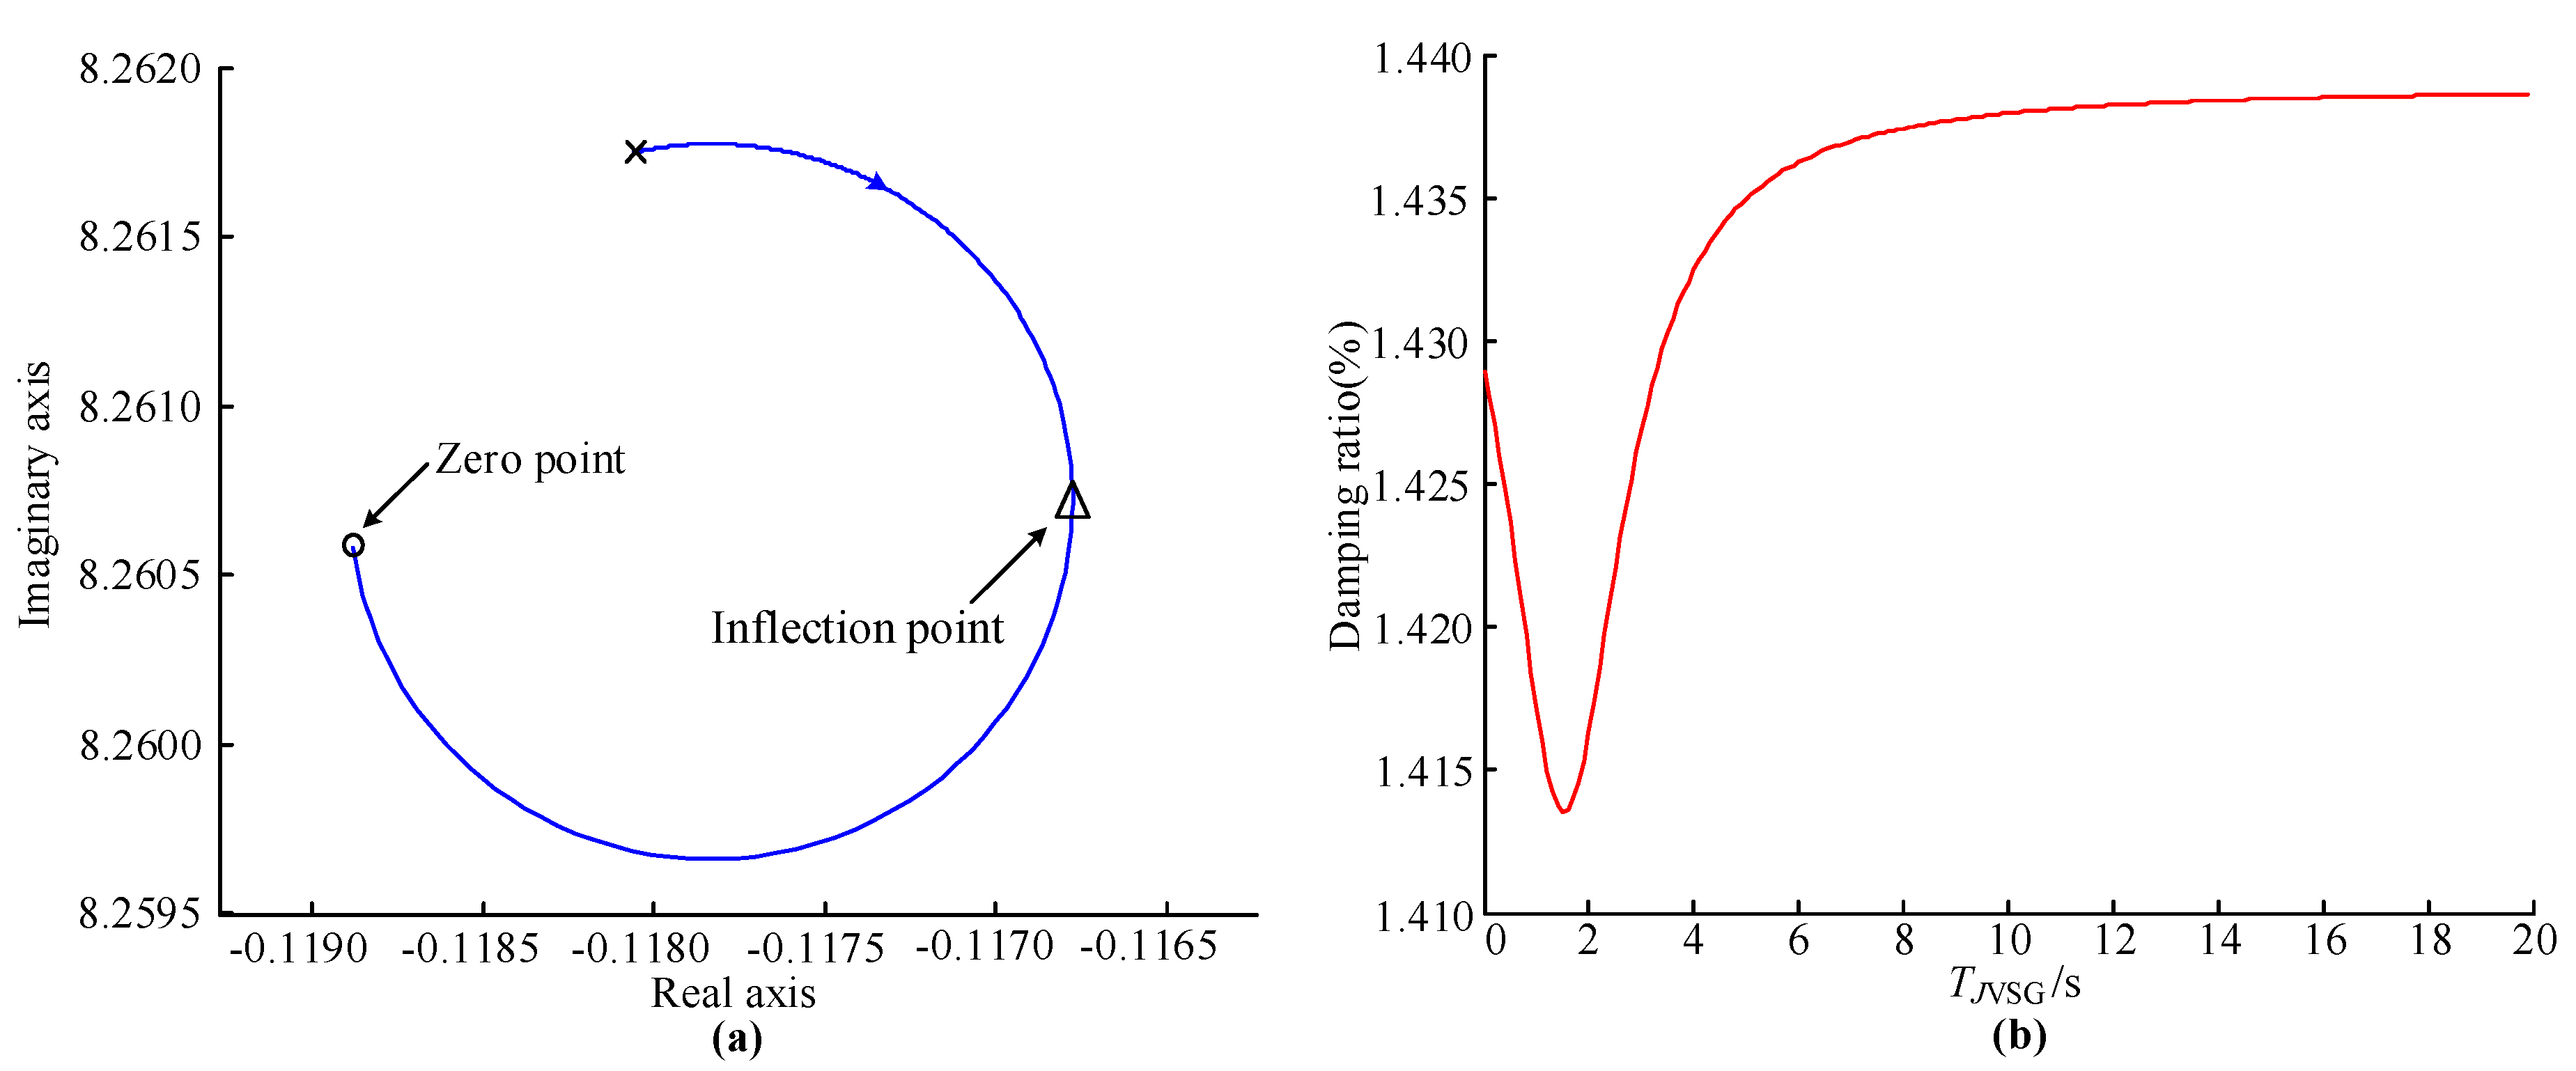
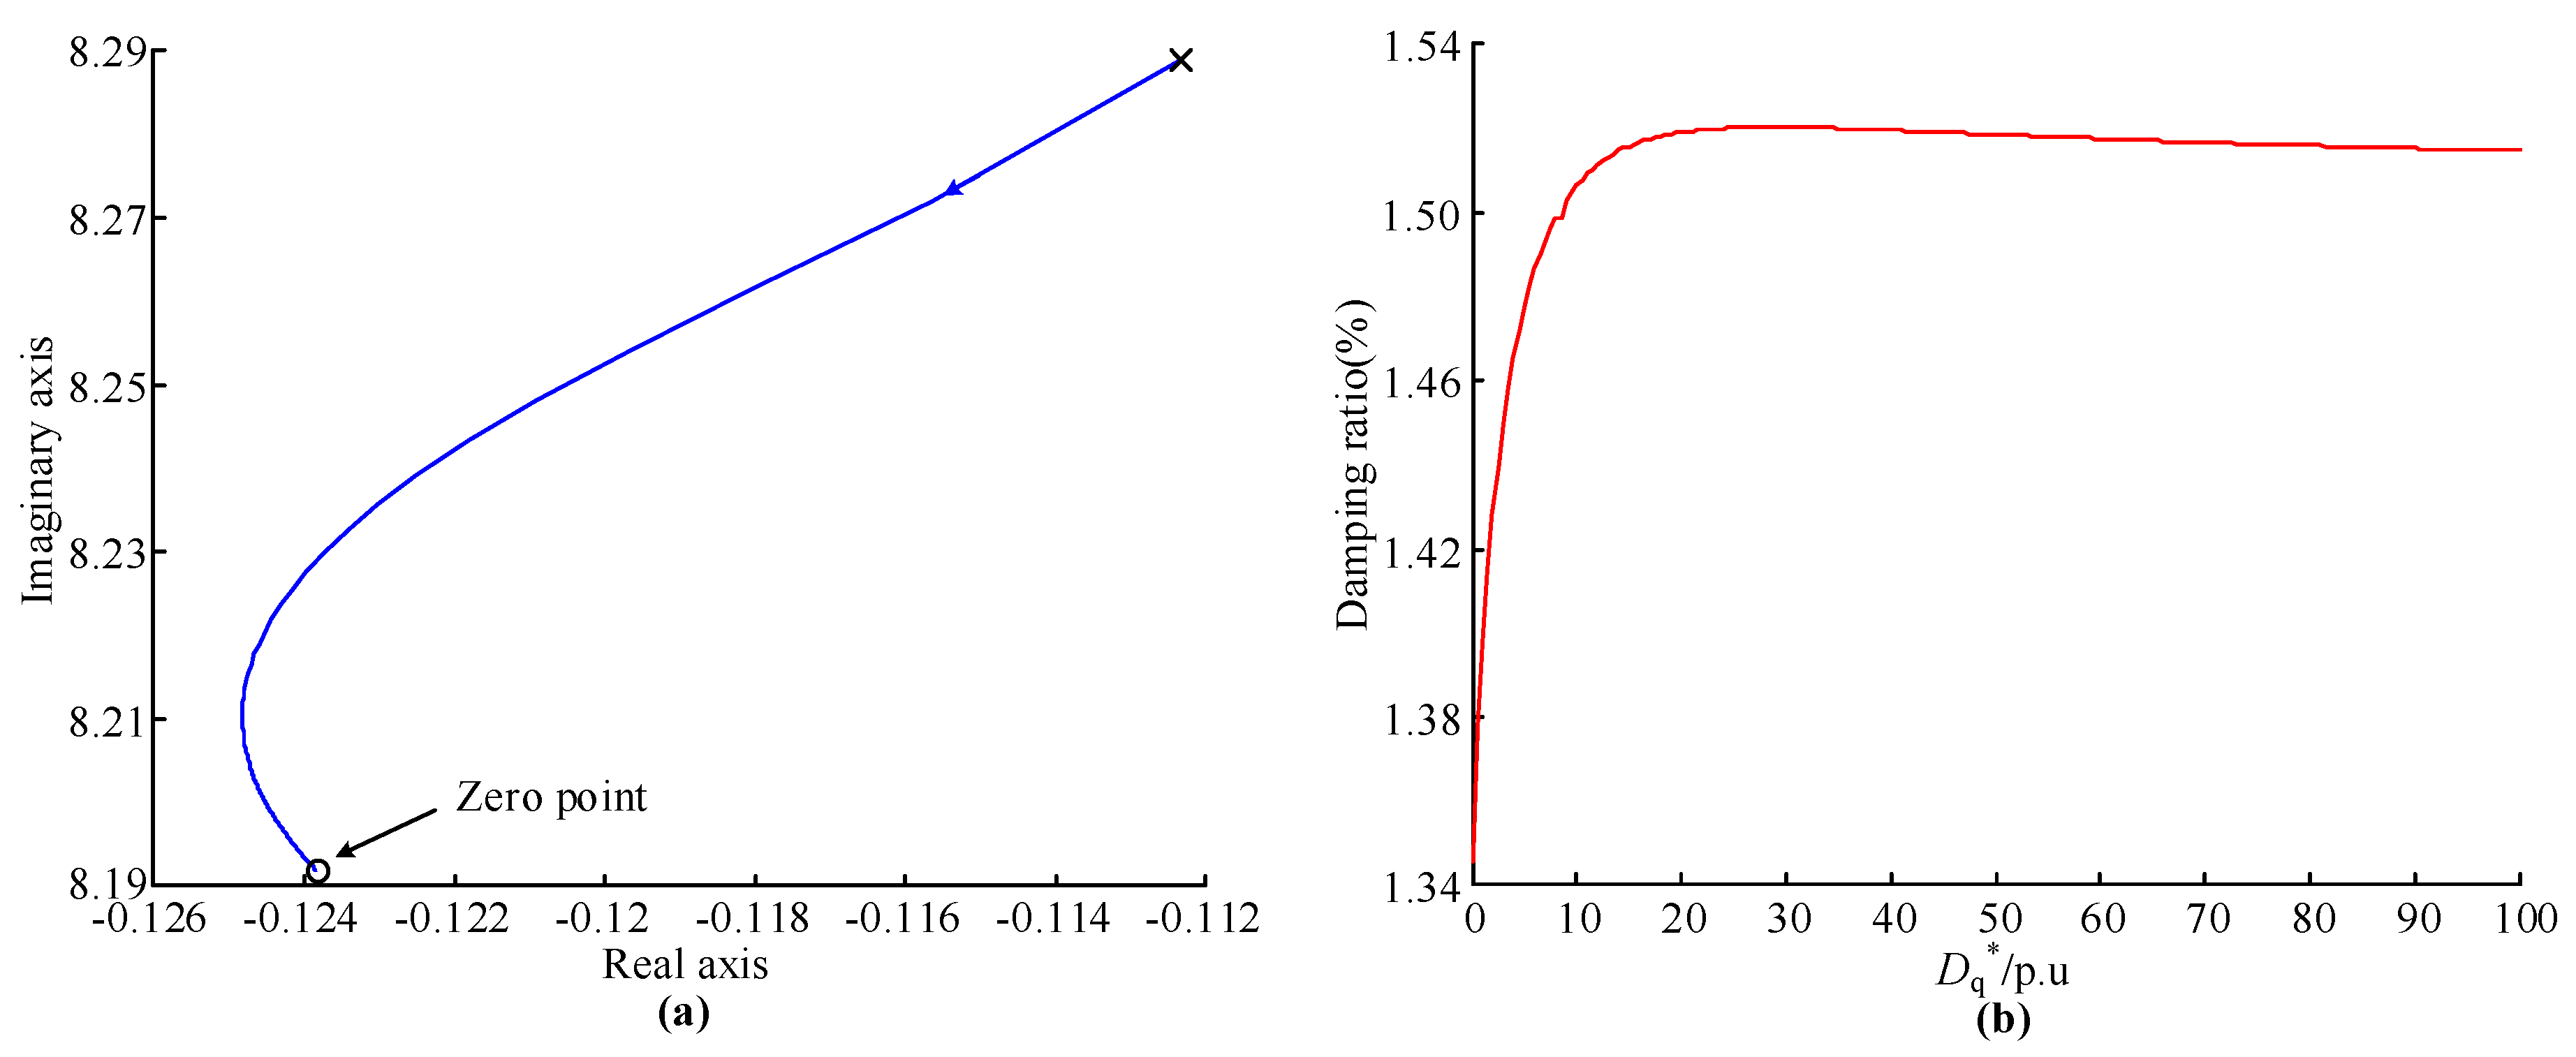
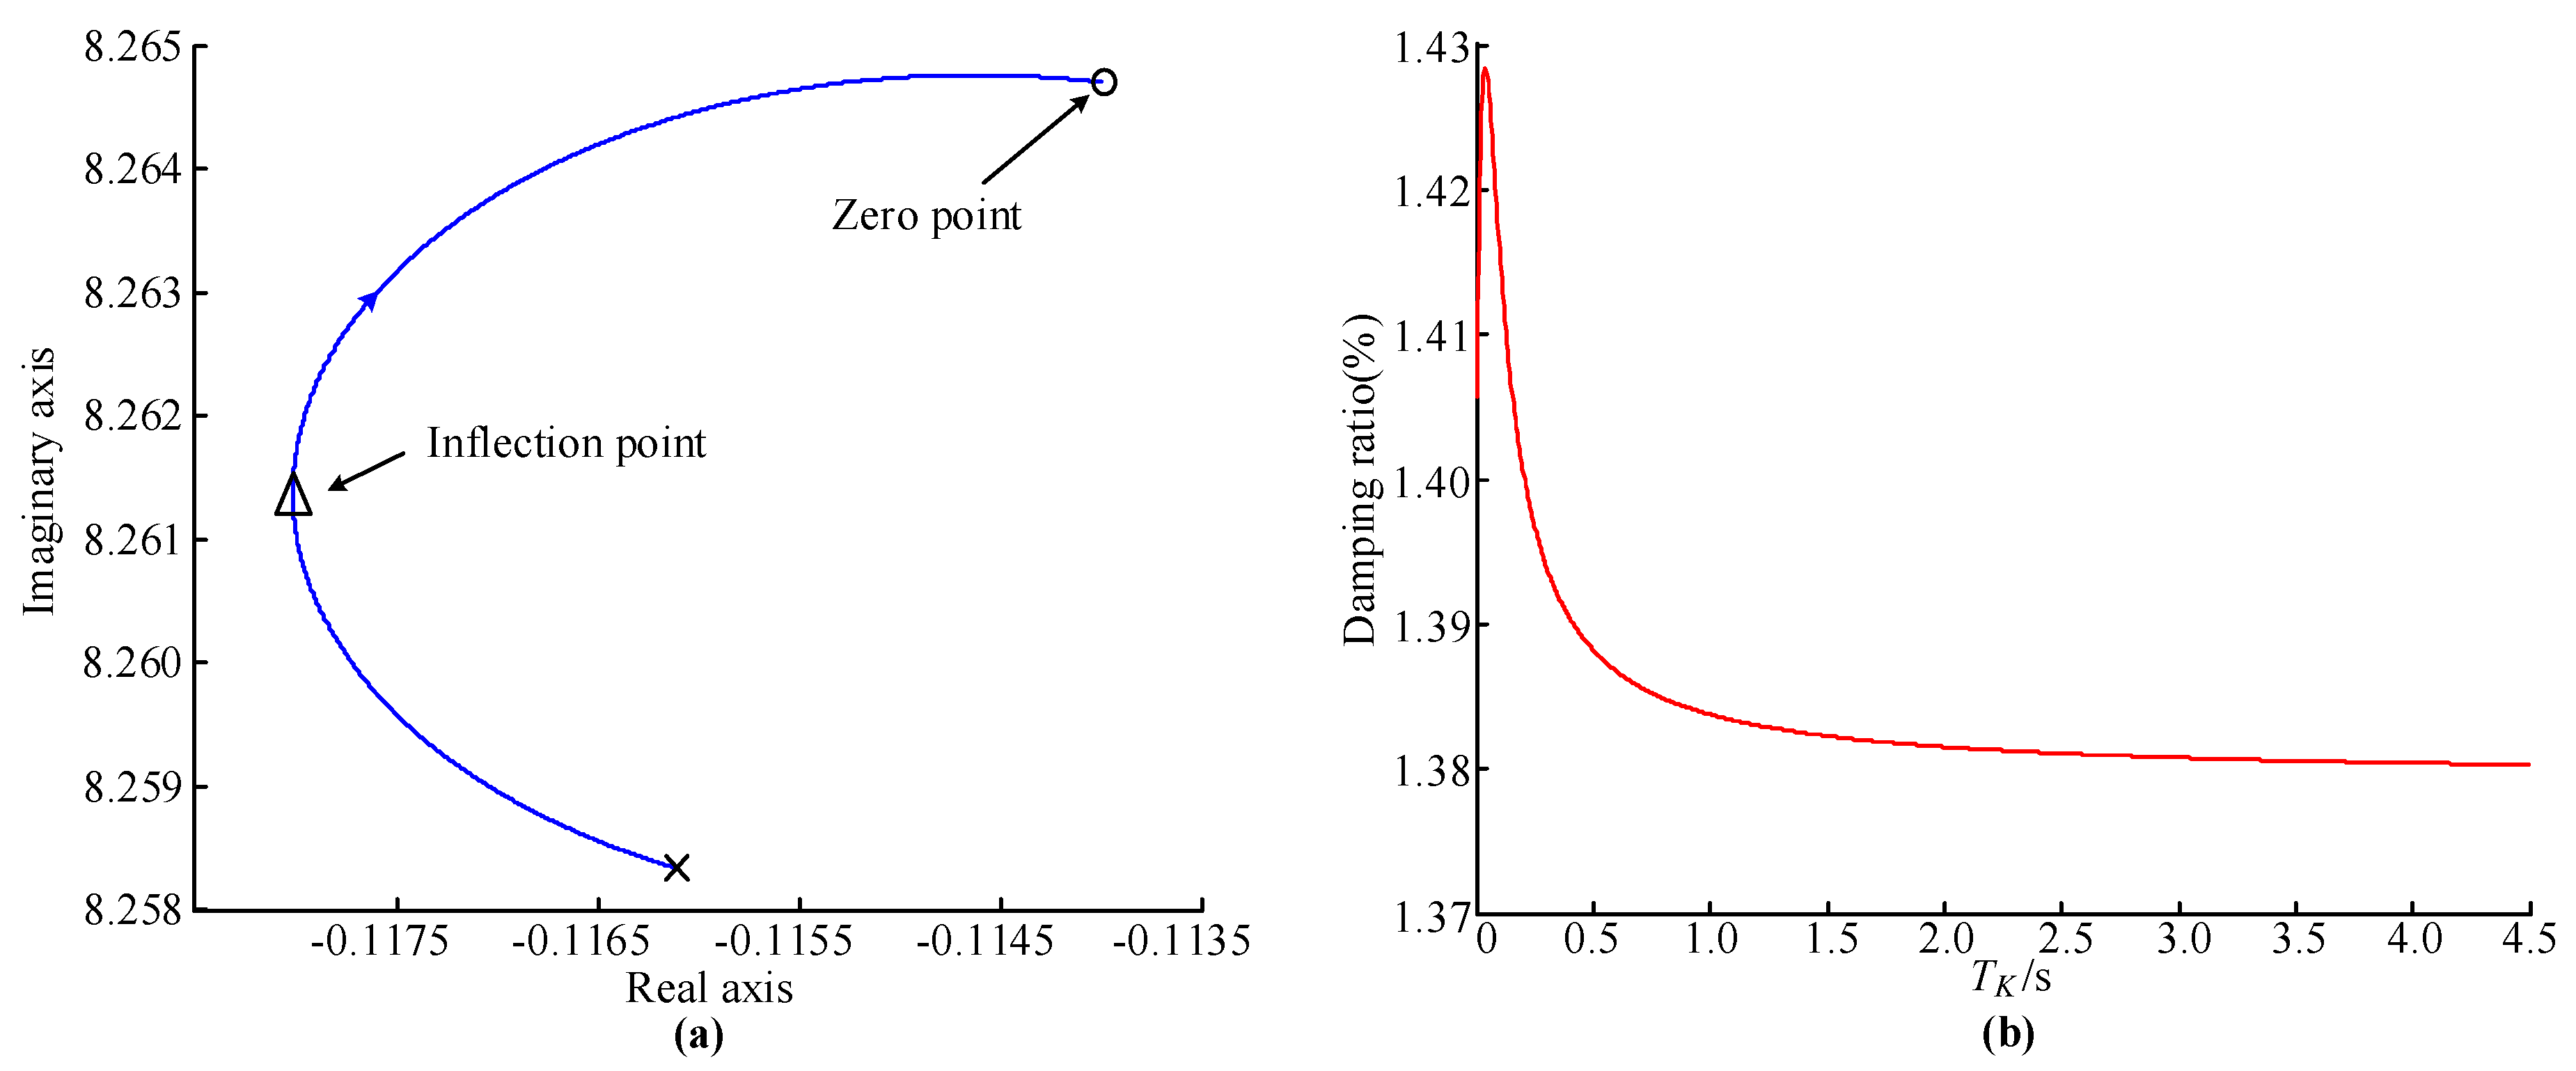
The influence rules of the virtual damping coefficient and voltage droop coefficient on the damping ratio are almost monotonic, while the influence rules of inertia time constant and time constant of reactive power loop on the damping ratio are non-monotonic. However, all of these parameters only have slight impacts on the system damping ratio. It is not practical to provide additional damping torque to the power system only by adjusting the control parameters of VSG.
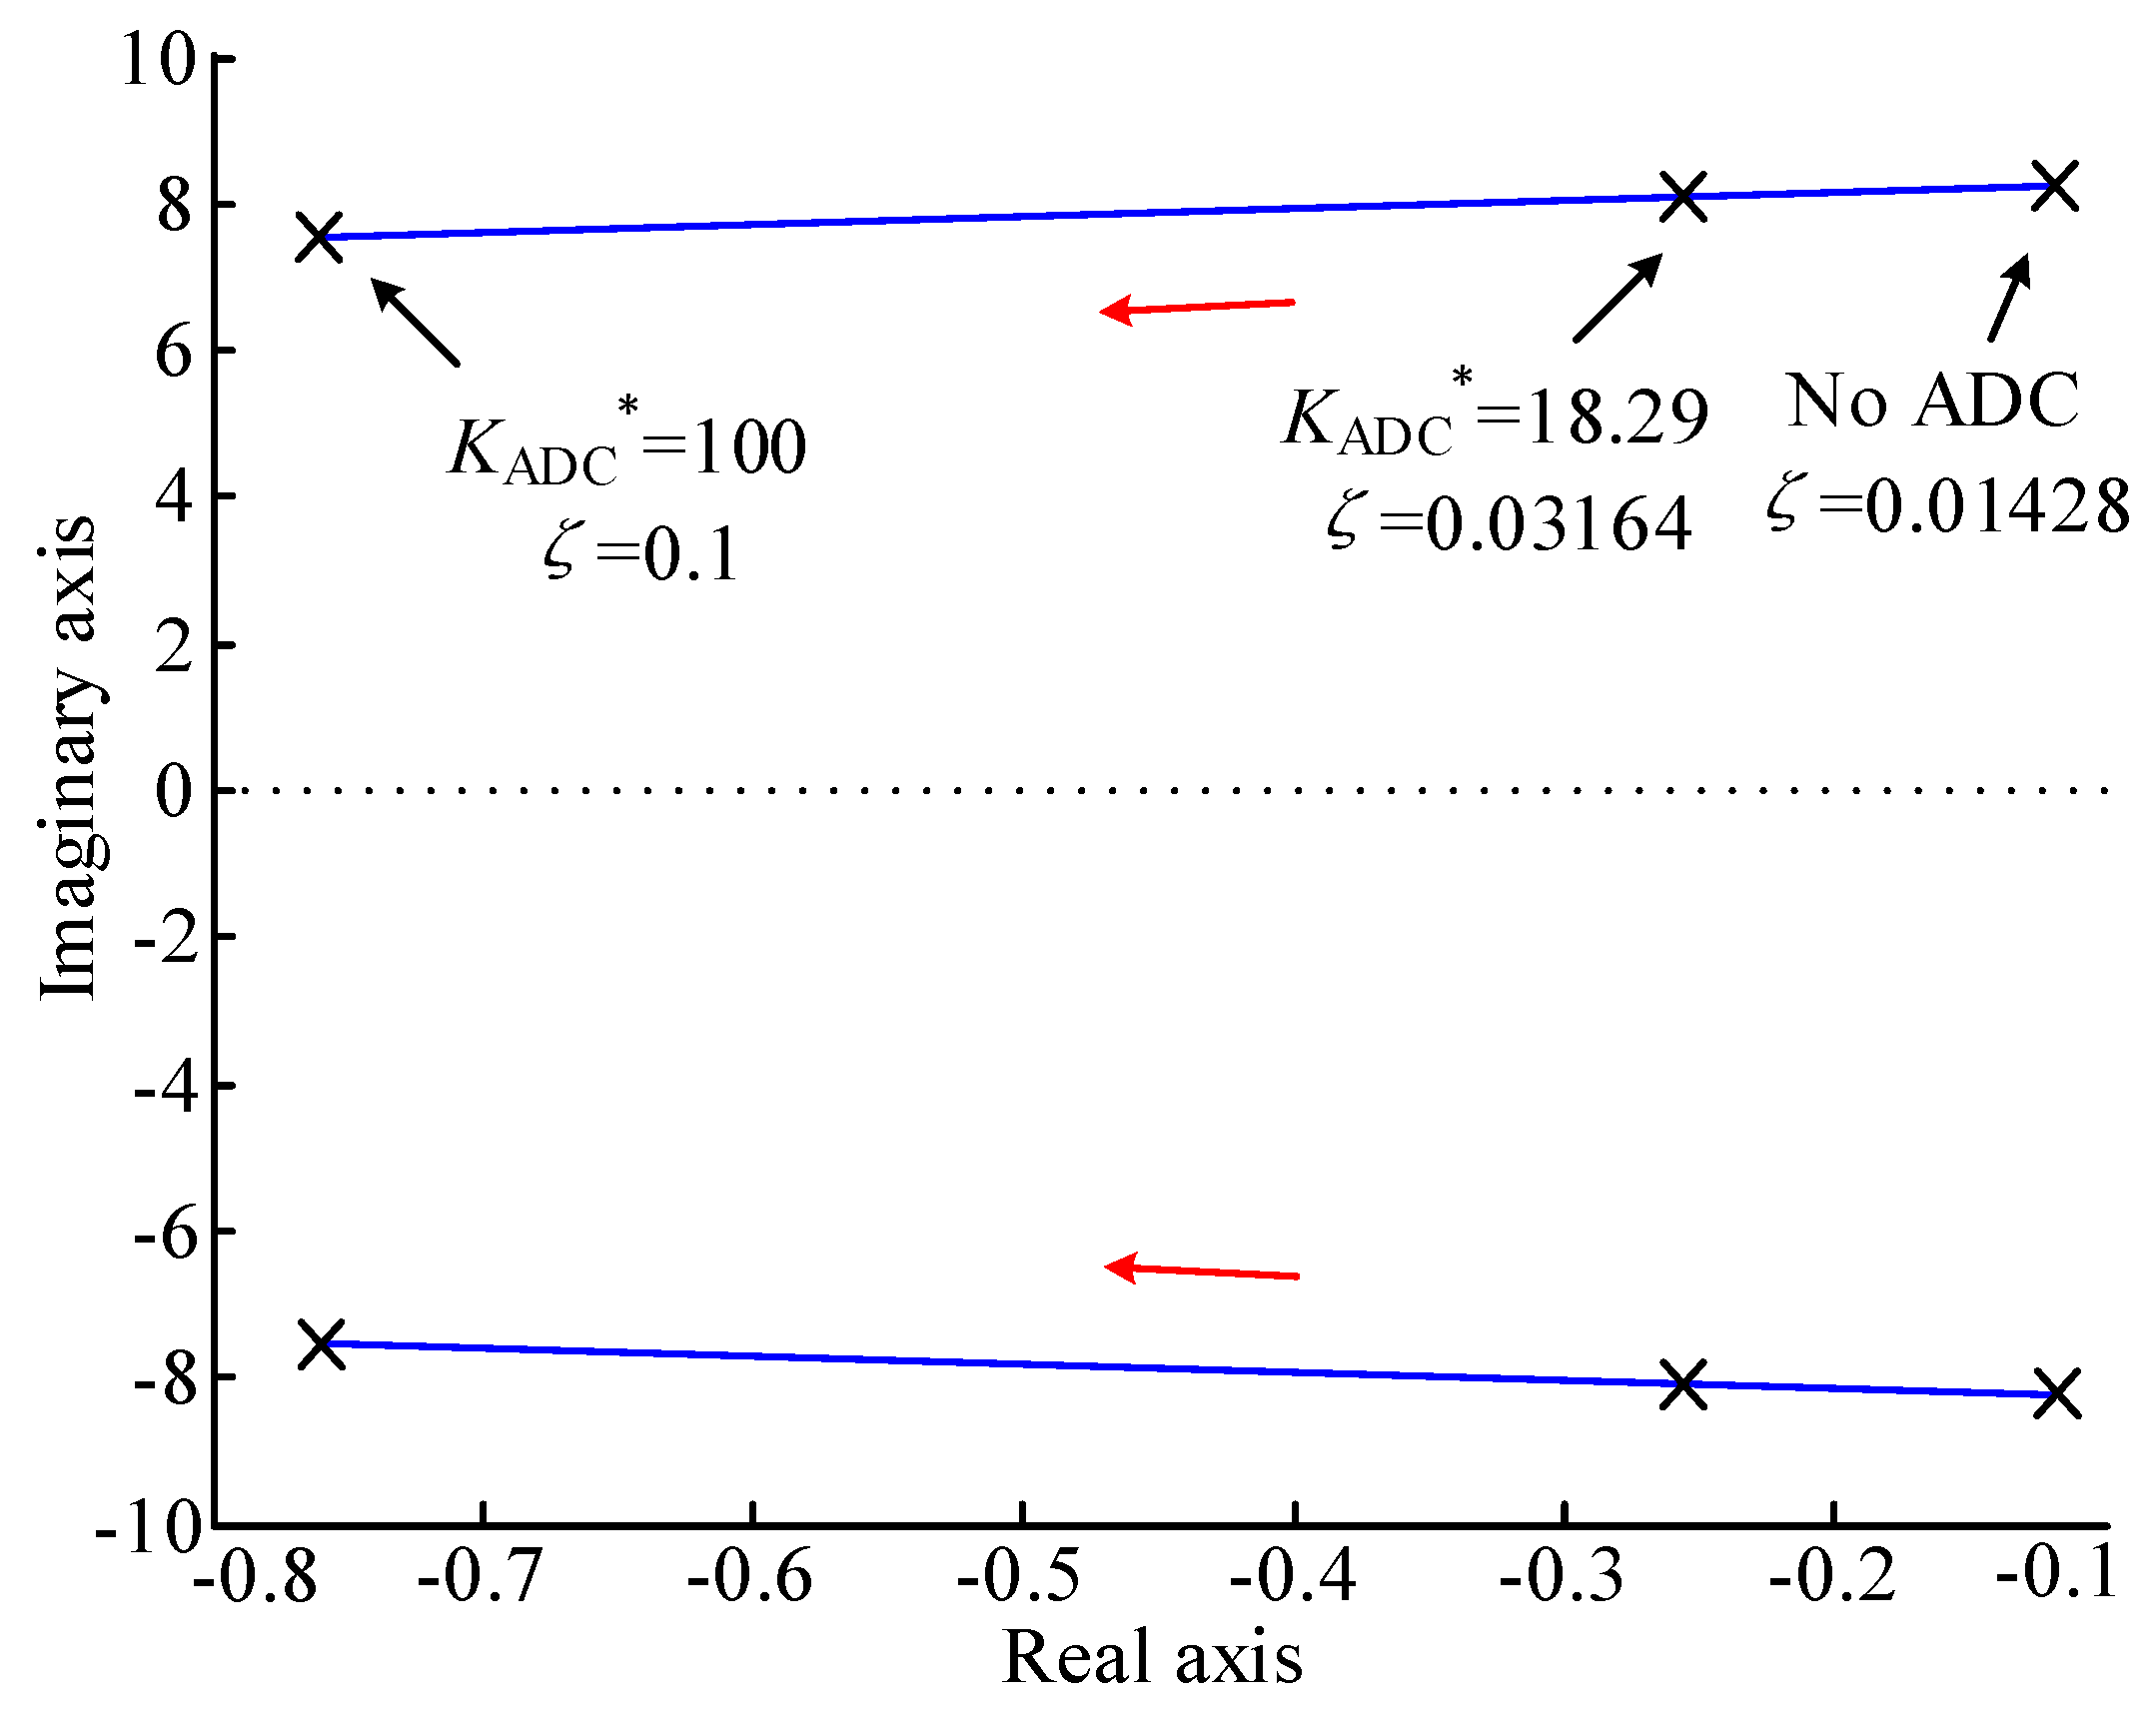
(3)
Similarly to traditional PSS, the input signal of ADC can be chosen as the variation of generator speed, the variation of electromagnetic power or some signals associated with the speed. When the input signal is the variation of generator speed, ADC should compensate the phase delay caused by the active power loop of VSG to obtain the greatest damping torque.
This paper only analyzes the influence of VSG on the system damping characteristics in the single-machine infinite bus system. The influence of VSG and the generality of the conclusions in multi-machine power systems need further study. The dynamics of RES generation need to be considered when analyzing the impacts of VSG on the system damping characteristics. Furthermore, an optimization method for the parameter design of ADC will be researched in future work.

Acknowledgments

This work is supported by the Open Fund of the State Key Laboratory of Operation and Control of Renewable Energy & Storage Systems (NYB51201700682) and the Science and Technology Project of the State Grid Corporation of China.

Author Contributions

Bingtuan Gao, Chaopeng Xia, and Ning Chen contributed to developing the ideas in this research; Bingtuan Gao and Chaopeng Xia designed the controller; Chaopeng Xia and Khalid Mehmood Cheema performed simulations and analyzed the data. All of the authors were involved in preparing this manuscript.

Conflicts of Interest

The authors declare no conflict of interest.

Appendix A

The derivation of VSG model presented in Equation (1) is demonstrated as follows.
According to the control diagram shown in Figure 2, the mathematical model of VSG in a real unit system can be derived as:
d θ VSG d t = ω VSG ,
J d ω VSG d t = T ref T VSG D p ω VSG ω 0 ,
K d 2 E d t = Q ref Q e 2 D q U pcc U n ,
P ref = T ref ω VSG , P VSG = T VSG ω VSG ,
where θ VSG is the phase angle of internal potential; ω VSG is the virtual angular speed; J is the virtual inertia coefficient; T ref is the reference of input torque; T VSG is the output electromagnetic torque; D p is the virtual damping coefficient; K is the integral coefficient; E is the rms value of internal potential; U pcc is the rms value of phase voltage of the PCC and U n is the rated rms value of phase voltage; Q ref is the reference of reactive power; Q e is the output reactive power; D q is the voltage droop coefficient; P ref is the reference of active power; P VSG is the output active power.
The phase difference between the internal potential and the voltage of PCC can be calculated as
d δ VSG d t = ω VSG ω 0 = ω VSG * 1 ω 0 ,
where δ VSG is the phase difference between the internal potential and the voltage of PCC; ω 0 is the rated angular speed of grid. In most cases, the angular speed of PCC ω pcc is equal to ω 0 . Small deviation only exists in the transient state. Therefore, we approximately assume that ω pcc is equal to ω 0 .
Dividing both sides of (A2) by the T B = S B / ω 0 , where T B is the base value of torque and S B is the base power of the system, Equation (A2) can be rewritten as
T J VSG d ω VSG * d t = T ref * T VSG * D p * ω VSG * 1 ,
where T J VSG = ( J ω 0 2 ) / S B is the inertia time constant; D p * = ( D p ω 0 2 ) / S B is the p.u value of virtual damping coefficient. Other variables have been defined above and all the variables superscripted with * denote the p.u value of corresponding one.
Similarly, dividing both sides of (A3) by the base power S B , Equation (A3) can be rewritten as:
T K d E * d t = Q ref * Q e * D q * U pcc * 1 ,
where T K = ( 2 U B K ) / S B is the time constant of reactive power loop of VSG; D q * = ( 2 U B D q ) / S B is the p.u value of voltage droop coefficient.
Because the deviation between ω VSG and ω 0 is very small during normal operation, Equation (A4) can be written approximately as
P ref = T ref ω 0 , P VSG = T VSG ω 0 .
Dividing both sides of Equation (A8) by S B = T B ω 0 , one can obtain P ref * = T ref * and P VSG * = T VSG * . Equation (A6) can also be expressed as
T J VSG d ω VSG * d t = P ref * P VSG * D p * ω VSG * 1 .
In addition, when the active power loss of the filter circuit is neglected, the output active power and reactive power from the inverter to the PCC can be calculated as
P VSG * = E * U pcc * X s * sin δ VSG , Q e * = E * U pcc * cos δ VSG E * X s * ,
where the X s is the impedance of filter reactor.
Finally, the mathematical model of VSG in a p.u system includes Equations (A5), (A7), (A9) and (A10).

References

  1. Klein, M.; Rogers, G.J.; Kundur, P. A fundamental study of inter-area oscillations in power systems. IEEE Trans. Power Syst. 1991, 6, 914–921. [Google Scholar] [CrossRef]
  2. Larsen, E.V.; Swann, D.A. Applying power system stabilizers Part I, II and III. IEEE Trans. Power Appar. Syst. 1981, 100, 3017–3046. [Google Scholar] [CrossRef]
  3. Zhang, X.; Lu, C.; Liu, S.; Wang, X. A review on wide-area damping control to restrain inter-area low frequency oscillation for large-scale power systems with increasing renewable generation. Renew. Sustain. Energy Rev. 2016, 57, 45–58. [Google Scholar] [CrossRef]
  4. Quintero, J.; Vittal, V.; Heydt, G.T.; Zhang, H. The impact of increased penetration of converter control-based generators on power system modes of oscillation. IEEE Trans. Power Syst. 2014, 29, 2248–2256. [Google Scholar] [CrossRef]
  5. Liu, W.; Ge, R.; Lv, Q.; Li, H.; Ge, J. Research on a Small Signal Stability Region Boundary Model of the Interconnected Power System with Large-Scale Wind Powe. Energies 2015, 8, 2312–2336. [Google Scholar] [CrossRef]
  6. Shah, R.; Mithulananthan, N.; Bansal, R.C.; Ramachandaramurthy, V.K. A review of key power system stability challenges for large-scale PV integration. Renew. Sustain. Energy Rev. 2015, 41, 1423–1436. [Google Scholar] [CrossRef]
  7. Eftekharnejad, S.; Vittal, V.; Heydt, G.T.; Keel, B.; Loehr, J. Small signal stability assessment of power systems with increased penetration of photovoltaic generation: A case study. IEEE Trans. Sustain. Energy 2013, 4, 960–967. [Google Scholar] [CrossRef]
  8. Beck, H.P.; Hesse, R. Virtual synchronous machine. In Proceedings of the IEEE International Conference on Electrical Power Quality and Utilisation, Barcelona, Spain, 9–11 October 2007; pp. 1–6. [Google Scholar]
  9. Zhong, Q.C.; Weiss, G. Synchronverters: Inverters that mimic synchronous generators. IEEE Trans. Ind. Electron. 2011, 58, 1259–1267. [Google Scholar] [CrossRef]
  10. Chen, Y.; Hesse, R.; Turschner, D.; Beck, H.P. Improving the grid power quality using virtual synchronous machines. In Proceedings of the IEEE International Conference on Power engineering, energy and electrical drives, Malaga, Spain, 11–13 May 2011; pp. 1–6. [Google Scholar]
  11. D’Arco, S.; Suul, J.A. Equivalence of virtual synchronous machines and frequency-droops for converter-based microgrids. IEEE Trans. Smart Grid 2014, 5, 394–395. [Google Scholar] [CrossRef]
  12. Wang, S.; Hu, J.; Yuan, X.; Sun, L. On inertial dynamics of virtual-synchronous-controlled DFIG-based wind turbines. IEEE Trans. Energy Convers. 2015, 30, 1691–1702. [Google Scholar] [CrossRef]
  13. Ming, W.L.; Zhong, Q.C. Synchronverter-based transformerless PV inverters. In Proceedings of the IEEE Annual Conference on Industrial Electronics Society, Dallas, TX, USA, 29 October–1 November 2014; pp. 4396–4401. [Google Scholar]
  14. Pichetjamroen, A.; Ise, T. Power Control of Low Frequency AC Transmission Systems Using Cycloconverters with Virtual Synchronous Generator Control. Energies 2016, 10, 34. [Google Scholar] [CrossRef]
  15. Aouini, R.; Marinescu, B.; Kilani, K.B.; Elleuch, M. Synchronverter-based emulation and control of HVDC transmission. IEEE Trans. Power Syst. 2016, 31, 278–286. [Google Scholar] [CrossRef]
  16. Guan, M.; Pan, W.; Zhang, J.; Hao, Q.; Cheng, J.; Zheng, X. Synchronous generator emulation control strategy for voltage source converter (VSC) stations. IEEE Trans. Power Syst. 2015, 30, 3093–3101. [Google Scholar] [CrossRef]
  17. Duong, M.Q.; Grimaccia, F.; Leva, S.; Mussetta, M.; Le, K.H. Improving transient stability in a grid-connected squirrel-cage induction generator wind turbine system using a fuzzy logic controller. Energies 2015, 8, 6328–6349. [Google Scholar] [CrossRef] [Green Version]
  18. Tan, A.; Lin, X.; Sun, J.; Lyu, R.; Li, Z.; Peng, L.; Khaild, M.S. A Novel DFIG Damping Control for Power System with High Wind Power Penetration. Energies 2016, 9, 521. [Google Scholar] [CrossRef]
  19. Bian, X.Y.; Geng, Y.; Lo, K.L.; Fu, Y.; Zhou, Q.B. Coordination of PSSs and SVC damping controller to improve probabilistic small-signal stability of power system with wind farm integration. IEEE Trans. Power Syst. 2016, 31, 2371–2382. [Google Scholar] [CrossRef]
  20. Hashemi, Y.; Shayeghi, H.; Moradzadeh, M.; Safari, A. Design of hybrid damping controller based on multi-target gravitational search optimization algorithm in a multi-machine power system with high penetration of PV park. J. Cent. South Univ. 2016, 23, 1163–1175. [Google Scholar] [CrossRef]
  21. Shah, R.; Mithulananthan, N.; Lee, K.Y. Large-scale PV plant with a robust controller considering power oscillation damping. IEEE Trans. Energy Convers. 2013, 28, 106–116. [Google Scholar] [CrossRef]
  22. Miguel, A.T.L.; Lopes, L.A.C.; Luis, A.M.T.; Jose, R.E.C. Self-tuning virtual synchronous machine: A control strategy for energy storage systems to support dynamic frequency control. IEEE Trans. Energy Convers. 2014, 29, 833–840. [Google Scholar]
  23. Shintai, T.; Miura, Y.; Ise, T. Oscillation damping of a distributed generator using a virtual synchronous generator. IEEE Trans. Power Deliv. 2014, 29, 668–676. [Google Scholar] [CrossRef]
  24. Alipoor, J.; Miura, Y.; Ise, T. Power system stabilization using virtual synchronous generator with alternating moment of inertia. IEEE J. Emerg. Sel. Top. Power Electron. 2015, 3, 451–458. [Google Scholar] [CrossRef]
  25. Li, D.; Zhu, Q.; Lin, S.; Bian, X.Y. A Self-Adaptive Inertia and Damping Combination Control of VSG to Support Frequency Stability. IEEE Trans. Energy Convers. 2017, 32, 397–398. [Google Scholar] [CrossRef]
  26. Dong, S.; Chen, Y.C. Adjusting Synchronverter Dynamic Response Speed via Damping Correction Loop. IEEE Trans. Energy Convers. 2017, 32, 608–619. [Google Scholar] [CrossRef]
  27. Liu, J.; Miura, Y.; Bevrani, H.; Ise, T. Enhanced virtual synchronous generator control for parallel inverters in microgrids. IEEE Trans. Smart Grid 2016. [Google Scholar] [CrossRef]
  28. Ashabani, M.; Mohamed, Y.A.R.I. Integrating VSCs to weak grids by nonlinear power damping controller with self-synchronization capability. IEEE Trans. Power Syst. 2014, 29, 805–814. [Google Scholar] [CrossRef]
  29. Wu, H.; Ruan, X.; Yang, D.; Chen, X.; Zhao, W.; Lv, Z.; Zhong, Q.C. Small-signal modeling and parameters design for virtual synchronous generators. IEEE Trans. Ind. Electron. 2016, 63, 4292–4303. [Google Scholar] [CrossRef]
  30. Zhang, Y.; Bose, A. Design of wide-area damping controllers for interarea oscillations. IEEE Trans. Power Syst. 2008, 23, 1136–1143. [Google Scholar] [CrossRef]
  31. Leon, A.E.; Solsona, J.A. Power oscillation damping improvement by adding multiple wind farms to wide-area coordinating controls. IEEE Trans. Power Syst. 2014, 29, 1356–1364. [Google Scholar] [CrossRef]
  32. Chaudhuri, B.; Majumder, R.; Pal, B.C. Wide-area measurement-based stabilizing control of power system considering signal transmission delay. IEEE Trans. Power Syst. 2004, 19, 1971–1979. [Google Scholar] [CrossRef]
  33. Wu, H.; Tsakalis, K.S.; Heydt, G.T. Evaluation of time delay effects to wide-area power system stabilizer design. IEEE Trans. Power Syst. 2004, 19, 1935–1941. [Google Scholar] [CrossRef]
Figure 1. Typical structure of VSG.
Energies 10 01146 g001
Figure 2. Control diagram of VSG.
Energies 10 01146 g002
Figure 3. A single-machine infinite bus system with an RES power plant.
Energies 10 01146 g003
Figure 4. Damping torque analysis on the electromagnetic power of the synchronous generator Δ P e .
Energies 10 01146 g004
Figure 5. The phase relationships between E and U pcc .
Energies 10 01146 g005
Figure 6. The influence of D p * on the damping characteristics: (a) root locus plot; (b) trend chart of damping ratio.
Energies 10 01146 g006
Figure 7. The influence of T J VSG on the damping characteristics: (a) root locus plot; (b) trend chart of damping ratio.
Energies 10 01146 g007
Figure 8. The influence of D q * on the damping characteristics: (a) root locus plot; (b) trend chart of damping ratio.
Energies 10 01146 g008
Figure 9. The influence of T K on the damping characteristics: (a) root locus plot; (b) trend chart of damping ratio.
Energies 10 01146 g009
Figure 10. Control diagram of VSG with the ADC.
Energies 10 01146 g010
Figure 11. Transfer function of active power loop with ADC.
Energies 10 01146 g011
Figure 12. Distribution of poles for different sets of K ADC * .
Energies 10 01146 g012
Figure 13. Dynamic response of generator speed under (a) different D p * ; (b) different T J VSG ; (c) different D q * ; (d) different T K .
Energies 10 01146 g013
Figure 14. Dynamic response of generator speed under different K ADC * .
Energies 10 01146 g014
Figure 15. The relationship between output active power of VSG and generator speed.
Energies 10 01146 g015
Table 1. Electrical parameters of the synchronous generator (AVR: automatic voltage regulator.)
ParametersValuesParametersValues
Nominal power (MVA)100Nominal voltage (kV)13.8
Mechanical power (p.u)0.8D-axis synchronous reactance (p.u)1.305
Inertia time constant (s)7.4Q-axis synchronous reactance (p.u)0.474
D-axis transient time constant (s)4.4529D-axis transient reactance (p.u)0.296
Damping coefficient (p.u)2.6Stator resistance (p.u) 2.8544 × 10 3
Proportional coefficient of AVR (p.u)200Time constant of AVR (s)0.001
Reference Voltage of AVR (p.u)1
Table 2. Electrical parameters of the RES power plant.
ParametersValuesParametersValues
DC voltage (kV)20Switching frequency (kHz)20
Nominal AC voltage (kV)10Equivalent inductance at AC side (mH)7
Reference of active power (MW)20Reference of reactive power (Mvar)0

