Article

Capacity Decay Mechanism of the LCO + NMC532/Graphite Cells Combined with Post-Mortem Technique

1
National Active Distribution Network Technology Research Center, Beijing Jiaotong University, Beijing 100044, China
2
Collaborative Innovation Center of Electric Vehicles in Beijing, Beijing Jiaotong University, Beijing 100044, China
*
Author to whom correspondence should be addressed.
Energies 2017, 10(8), 1147; https://doi.org/10.3390/en10081147
Submission received: 14 June 2017 / Revised: 25 July 2017 / Accepted: 2 August 2017 / Published: 4 August 2017

Abstract

:
Lithium ion batteries are widely used in portable electronics and transportations due to their high energy and high power with low cost. However, they suffer from capacity degradation during long cycling, thus making it urgent to study their decay mechanisms. Commercial 18650-type LiCoO2 + LiNi0.5Mn0.3Co0.2O2/graphite cells are cycled at 1 C rate for 700 cycles, and a continuous post-mortem analysis is performed. Based on these tests, the decay mechanism of the cells is finally proposed. The changes of differential capacity curves of the full cells show that the loss of active materials, loss of lithium ions and cell polarization are the main factors contributing to capacity loss. Non-fully charging of the electrodes is also one of the reasons, but only takes up a minor portion. Impedance results indicate that the charge transfer resistance becomes larger during cycling, especially at low state of charge. Morphology and surface chemistry analysis demonstrates that the electrode particles after cycling exhibit some minor cracks and some additional layers are formed on surfaces of both the cathode and anode electrodes. All of these effects may contribute to the impedance increase, and consequently lead to degradation of the full cells. Thus, a good protection of the surface of the cathode and anode shows great potential to improve the capacity maintenance and prolong the cycle life of the cells.

1. Introduction

In the past few decades, the demand of lithium ion batteries (LIBs) with high energy density and low cost, has been increasing as power sources for portable electronics, electric vehicles (EVs) and renewable energy storages [1,2,3,4,5]. Recently, the rapid development of EVs is being witnessed. At the same time, the pursuit of long mileage and high speed puts forward higher requirements for advanced lithium ion batteries in transportation fields [6].
Among the commercial cathodes of lithium ion batteries, lithium cobalt oxide (LCO) is one of the earliest materials widely used in portable electronics, due to its high energy density [7,8]. However, it suffers from the disadvantage of high cost and poor safety. Recently, some derivative layered cathodes are explored that are safer and more affordable, such as LiNixMnyCozO2 (x + y + z = 1) systems [9,10,11,12]. These materials are expanding in their application. Among these systems, the LiNi0.5Mn0.3Co0.2O2 (NMC532) material fully demonstrates its superior features in terms of high energy density, high power density and moderate cost [13,14,15]. Until now, the graphite (Gr) is still the most widely used anode material for lithium ion batteries, because of its good electronic conductivity and high crystallinity [16,17]. With the fast development of ground transportation and higher demand from people, the lithium ion batteries using LCO + NMC532 blended cathodes combined with Gr anode are becoming one of the most promising cell chemistries, due to their high energy density, power density, safety performance and moderate cost. Despite such advantages, it suffers from capacity degradation with long cycling during the usage process. Thus, it is significant to study its capacity fading mechanism.
The aging mechanism of lithium ion batteries is a subject that depends on the study of the inter-chemistry and physics changes of active materials, as well as the electrolytes and the interfaces of the electrodes and electrolyte [18]. Many researchers have made efforts to study the aging mechanisms of various lithium ion batteries. They used non-destroyed method, such as differential capacity (dQ/dV) analysis, and post-mortem method, as well as some other electrochemical techniques to study the reasons for failure of batteries. Dubarry et al. [19] identified the capacity fading mechanism of a commercial LiFePO4 cell by incremental capacity analysis (ICA) technique, and showed that lithium inventory loss was the main factor of capacity decay, in addition to the loss of active materials. Sarre et al. [20] reported that the aging in lithium ion batteries may have primarily resulted from reactions of active materials with electrolyte at the solid-electrolyte-interface (SEI), degradation of active materials and some other aging factors including electrode binders. Zhang [21] pointed out that the cycle life of the LCO cells significantly depended on the charging protocols and studied the effect of the progressive growth of surface layers on cathode and anode electrodes. Guan et al. [22] quantitatively analyzed the degradation mechanism of LCO/mesocarbon microbeads (MCMB) battery at high rates, and summarized that the capacity decay was mainly attributed to decay of the reversible capacity of LCO electrode, irreversible loss of active lithium in the SEI film and lithium remaining in the anode due to polarization. Kobayashi et al. [23] studied the fading mechanism of cylindrical nickel-cobalt oxide (LiNi0.73Co0.17Al0.10O2)/hard carbon lithium ion batteries. They revealed the crystal structure of the positive electrode changed from rhombohedral to cubic symmetry on the surface and a Li2CO3 film was formed after cycling. Abraham et al. [24] studied the power fade mechanisms of 18650-type LiNi0.8Co0.2O2/graphite lithium ion cells at 40 to 70 °C. They correlated the power fade with impedance rise, and showed that the positive electrode was the main reason leading to impedance rise. Zheng et al. [25] studied the effect of dissolution of transition metal (TM) ions on the capacity fading of LiNi1/3Co1/3Mn1/3O2-based cells, and found that the impedance rise of the graphite anode was the main reason for the cell failure. Lee et al. [26] studied the capacity fading mechanisms of a pouch-type LiNi0.6Co0.2Mn0.2O2/graphite cell and revealed the loss of active lithium ions due to SEI film formation combined with electrode degradation, were the main reasons for capacity fading. Jung et al. [27] studied the degradation mechanisms of LiNi0.5Co0.2Mn0.3O2 cathode material charged to different voltages and found the structural change and phase transformation from pristine rhombohedral to a mixture of spinel and rock salt resulted in sluggish kinetics and deteriorated the capacity retention. Gilbert et al. [28] identified the cycling behavior of NMC532/graphite full cell cycled in the 3–4.4 V range. They indicated the full cell capacity decayed linearly with cycle number, originating from irreversible lithium loss in the negative SEI layer. Markervich et al. [29] studied the capacity fading of lithiated graphite electrode, and found that cracks in the graphite particles and a decrease of average crystalline size occurred with cycling. However, most of these studies are focused on extreme conditions, such as high charge cut-off voltages, high rates, high temperatures or power decay mechanisms. Thus, it is of great significance to study the cycling performance and decay mechanisms of the lithium ion batteries under normal conditions, since most of the batteries are used under normal working conditions during most of their lifetime. Furthermore, to observe the continuous changes of thermodynamics and kinetics features of the cycled cells is an essential strategy to accurately study the decay mechanism of the cells.
In this work, the commercial 18650-type LCO + NMC532/Gr full cells were subjected to charge and discharge test at 1 C rate for 700 cycles. The capacity decay of the full cells was studied. Differential capacity curves were introduced to identify the reasons for the cell deterioration. Electrochemical impedance spectroscopy (EIS) was used to illustrate the resistance change during cycling. The particles morphology and surface chemistry characterizations of both cathode and anode electrodes were performed on the disassembled fresh and fatigued cells to study the morphological changes. Based on these observed results, the decay mechanisms of the full cells were discussed and the strategies to improve their cycling performance were suggested.

2. Studies of Full Cells

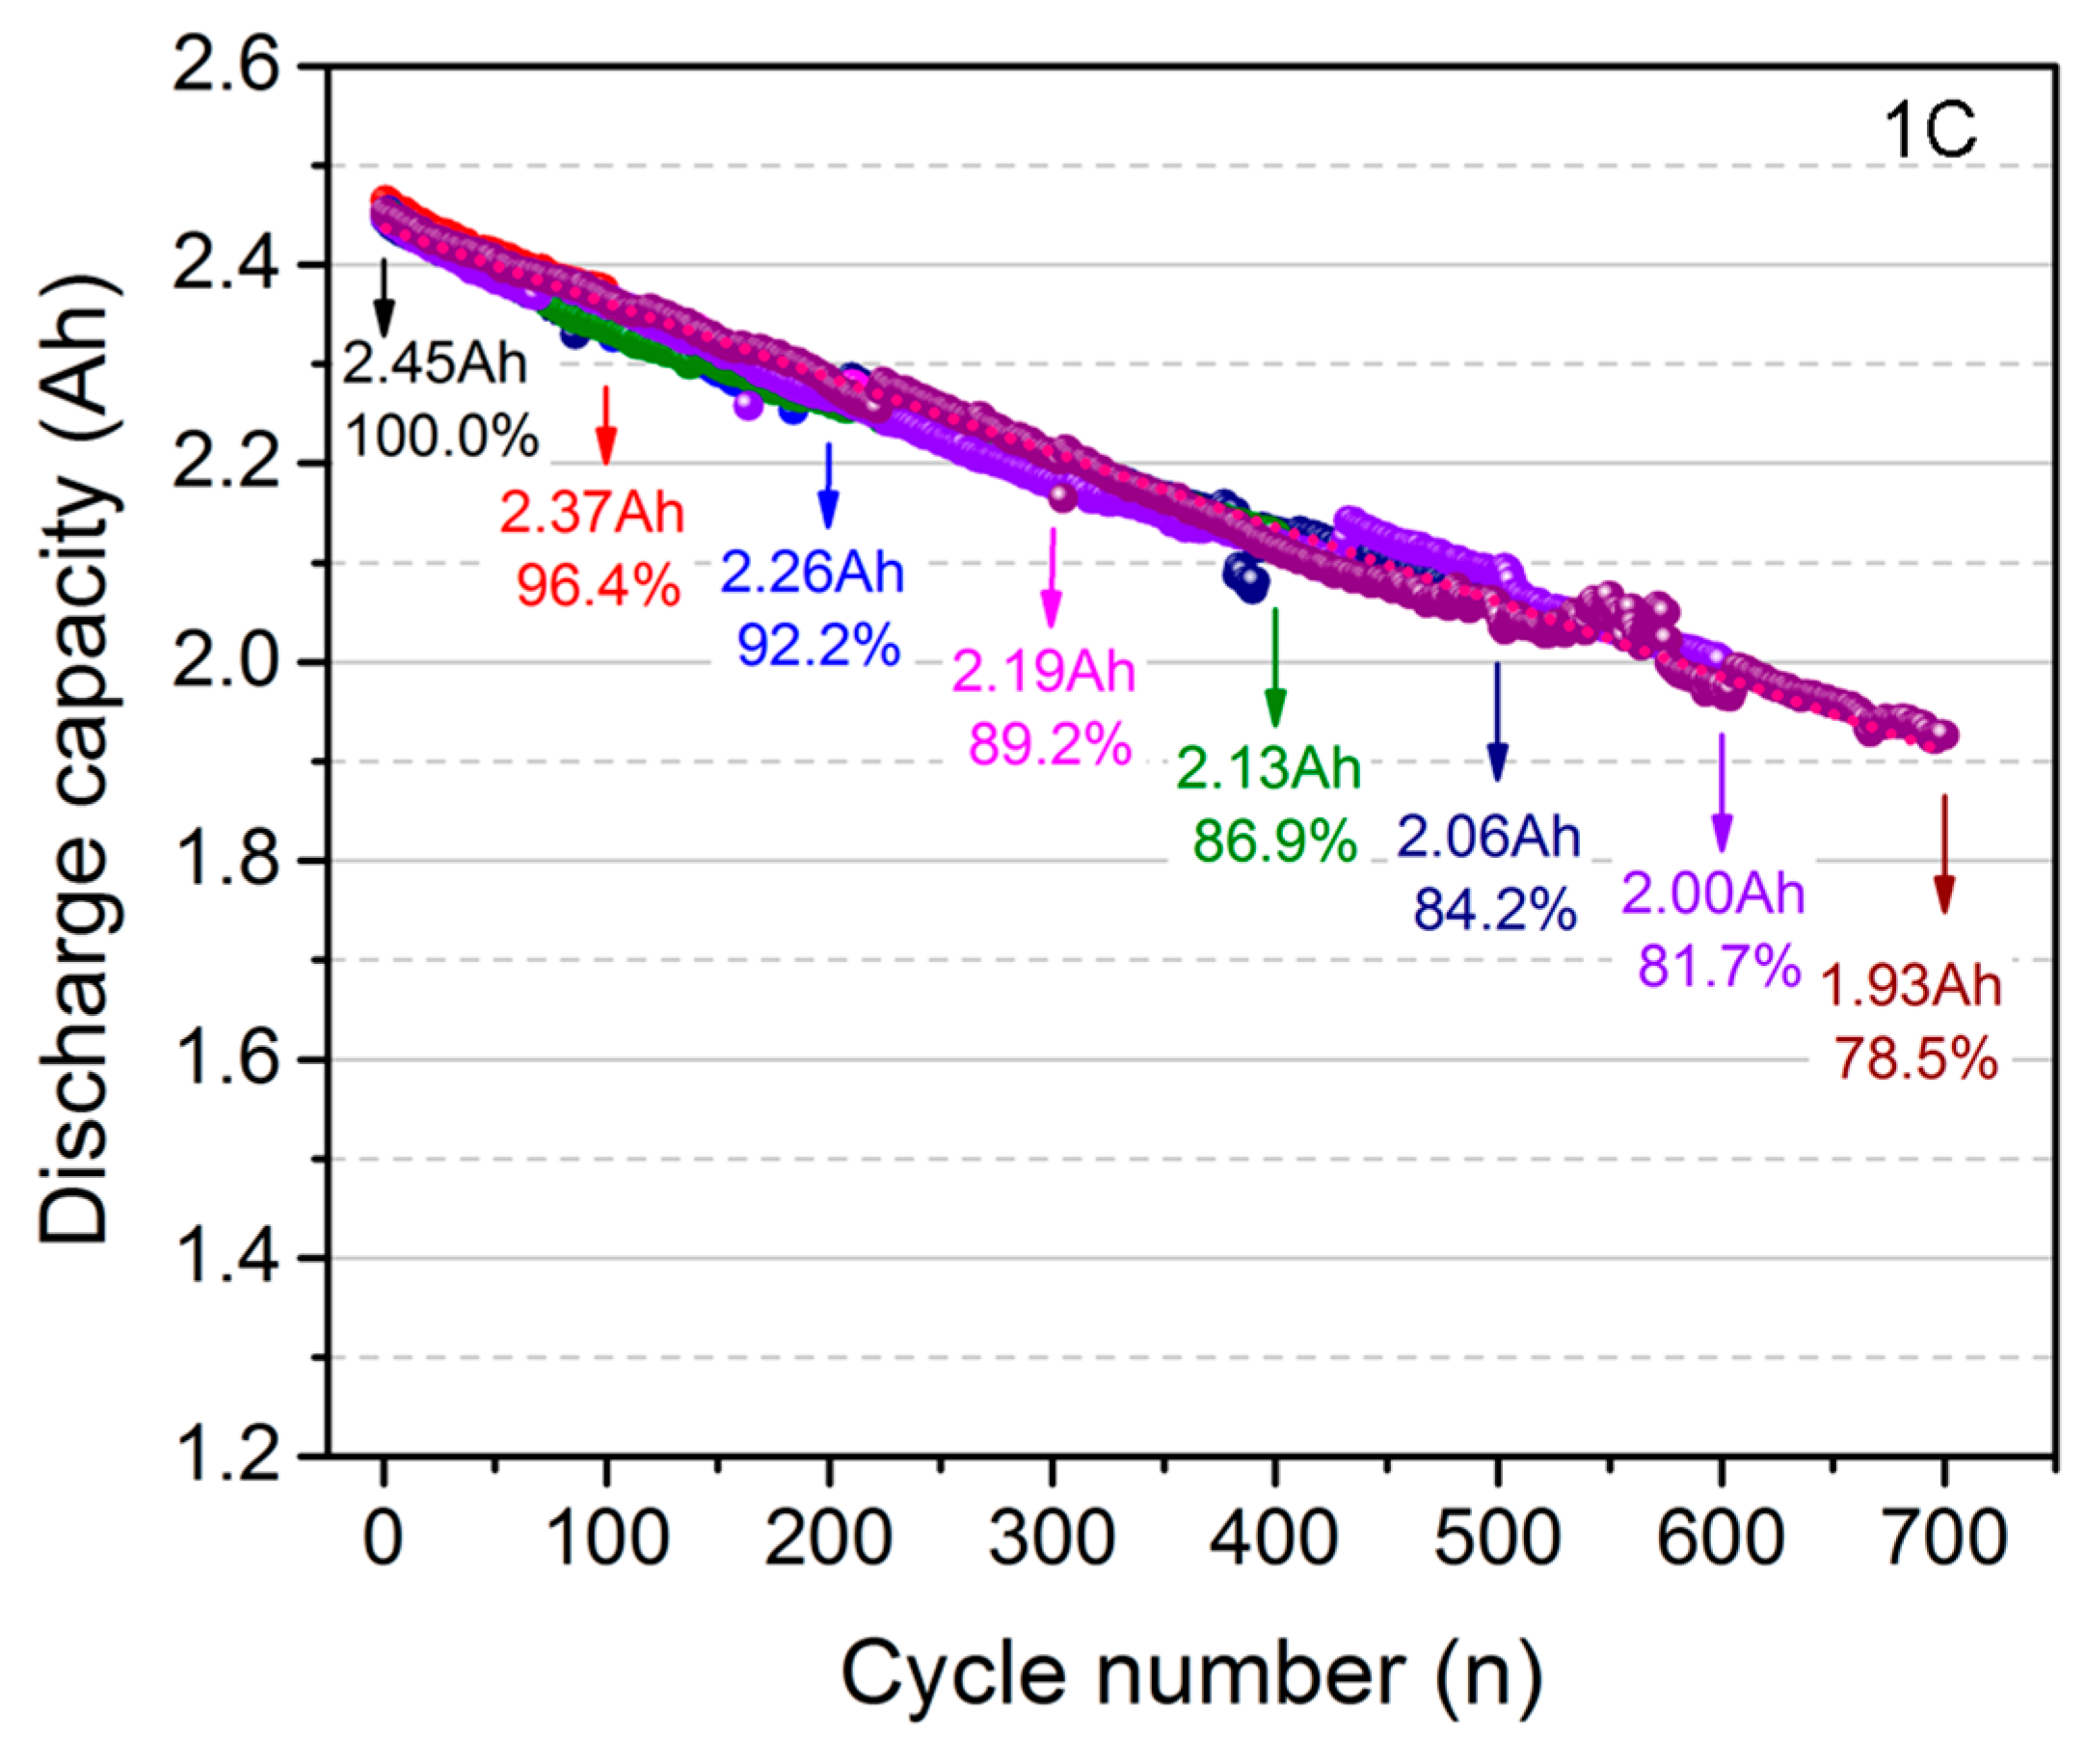
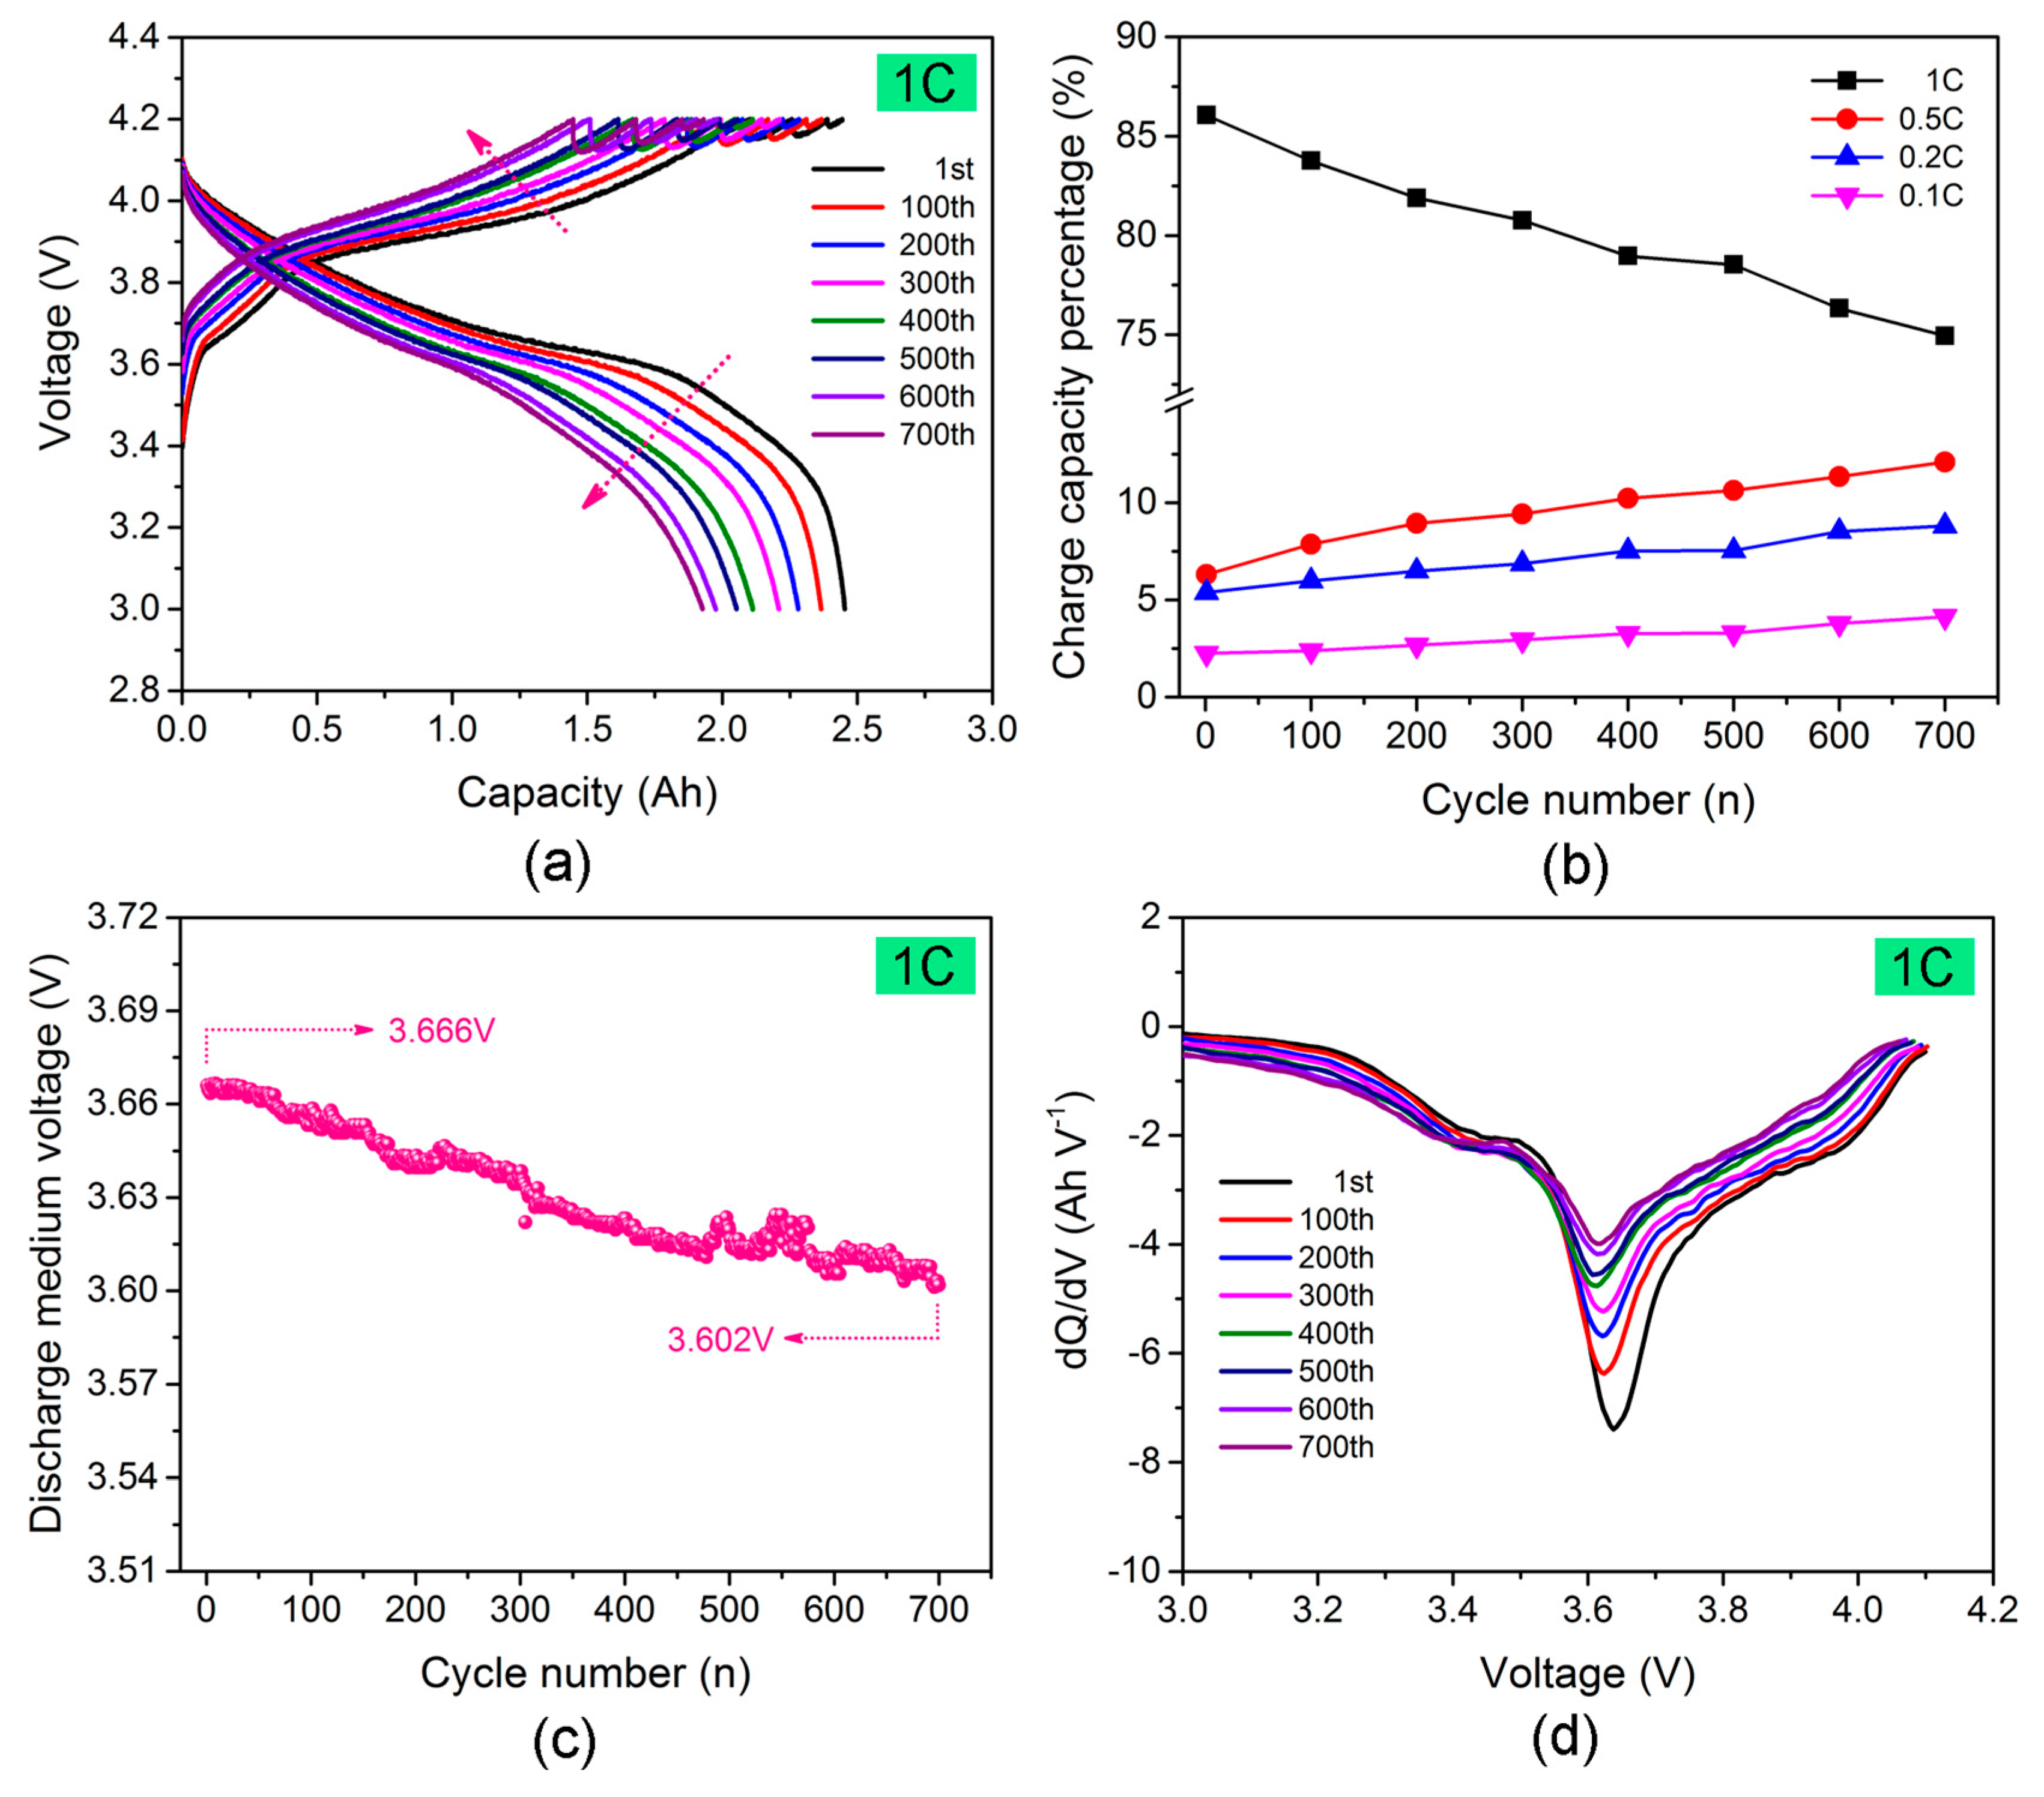
2.1. Long-Term Cycling Studies of Full Cells at 1 C Rate

The long-term cycling performance of the 18650-type LCO + NMC532/Gr full cells has been studied, as shown in Figure 1. This figure depicts the discharge capacities and capacity retentions of the cells experiencing 100, 200, 300, 400, 500, 600 and 700 cycles, respectively. From the figure, we can see that the discharge capacities and capacity retentions are basically identical with each other among different cells. Thus, the data of the cells can be deemed to be reliable and reproducible. It can be seen that the discharge capacities gradually decrease during the long cycling process. The initial discharge capacity of the full cell is about 2.45 Ah. As cycling proceeds, the discharge capacity gradually decreases to 2.37 Ah, 2.26 Ah, 2.19 Ah, 2.13 Ah, 2.06 Ah, 2.00 Ah and 1.93 Ah at the 100th, 200th, 300th, 400th, 500th, 600th and 700th cycle, and the corresponding capacity retention is 96.4%, 92.2%, 89.2%, 86.9%, 84.2%, 81.7% and 78.5%, respectively. The capacity approximately decays linearly with the cycle numbers.
We also fit the trend of capacity decay using a linear equation:
QN = a + bN,
where the QN represents the discharge capacity of the full cells at the Nth cycle; N is the cycle number; a is the intercept with Y axis; and b is the slope, respectively. The fitting result is also shown in the figure using a pink dashed line, and a is 2.4369, b is −7.53 × 10⁻⁴. This simple formula can possibly be used to predict the capacity of the cells when they go through ultra-long cycling.
In addition to discharge capacities and capacity retentions, it is also important to understand the voltage features of the cells, which can provide more information about the dynamics characteristics of the cell components. The charge and discharge curves at 1 C rate cycling are displayed in Figure 2a. Four charge rates including 1 C, 0.5 C, 0.2 C and 0.1 C, have been established and applied in the cycling process based on the charge protocol in practical application. The lower-currents charge steps are always considered to be equal to the constant voltage charge process in the traditional constant-current-constant-voltage (CCCV) regime. The purpose of these steps is to fully charge the cells. In addition, the constant current charge mode is much easier to be implemented and managed in comparison with the constant voltage charge mode. After the multiple constant currents charge steps, the cells are then discharged at 1 C rate. From Figure 2a, obvious voltage changes can be observed during long charge and discharge process. The charge voltage becomes higher with the increasing cycle numbers, and the discharge voltage gradually drops, which is believed to be related to the origins of capacity decay of the electrodes.
To clearly verify the charge capability of the cells, the contribution of charge capacity by each constant current charging step is isolated. The charge capacity percentage (CCP) is calculated based on the total charge capacity with the cycling, as indicated by Figure 2b. The batteries cannot be fully charged at the high rate of 1 C due to the high polarization and increasing resistances, and the charged capacities at 1 C rate decrease with the increase of cycle number. The CCP at 1 C rate distinctly decreases from the beginning of 86.1% to the final 75.0% after 700 cycles, which means that the charge capability of the cells at high rate is decreasing. While, the “lost” charge capacities are compensated by low current (0.5 C, 0.2 C and 0.1 C rates) charge procedures. Therefore, the CCP of 0.5 C, 0.2 C and 0.1 C rates gradually increases during the whole cycling process. Both the decreased charge capacities at 1 C rate and the increased ones at low rates are nearly linear with the cycle number. Moreover, at 0.5 C rate, the polarization of the batteries becomes much smaller than that at 1 C rate, so most of the “lost” charge capacities of the batteries can be compensated and made up under this moderate rate. At the very low rates of 0.2 C and 0.1 C, where the polarization of the batteries is negligible, only a minor proportion of the total charge capacities can be compensated. Thus, it is notable that although the charge capacities at all the three low currents are linearly increasing, the CCP of 0.5 C rate grows faster than the other two rates. However, the increased CCP of 0.1 C rate is negligible from the beginning of 2.3% to the final 4.2%. This implies that most of the capacity of the cells has been obtained at high to moderate rate charge procedures. Thus, even when employing the lower charge current, in which condition the cell polarization is smaller, the very tiny continued charge capacity can be achieved. This result confirms that the cells can possibly be “fully charged” by using the four current rates of our charge protocol.
We also introduce the “discharge medium voltage” to interpret the voltage changes during long cycling, which is shown in Figure 2c. Discharge medium voltage is the corresponding voltage when the cells are discharged to their half capacity. We can see that it drops from 3.666 V to 3.602 V after the cells undergo 700 cycles. This indicates that the polarization and the resistances of the cells become more evident. Meanwhile, the contributed energy output will be reduced accordingly. This is not ideal when lithium ion batteries are used as power sources for transportations and energy storage systems. The voltage change can also be viewed from the discharge dQ/dV plots derived from the 1 C cycling profiles, as shown in Figure 2d. Both the intensities and the areas of the reductive peaks decrease on aging, and the position of the peaks also shifts to the lower voltage value. This indicates that the discharge capability changes to be more depressed and polarization of the cells increases during cycling, which will be further discussed in the following sections.

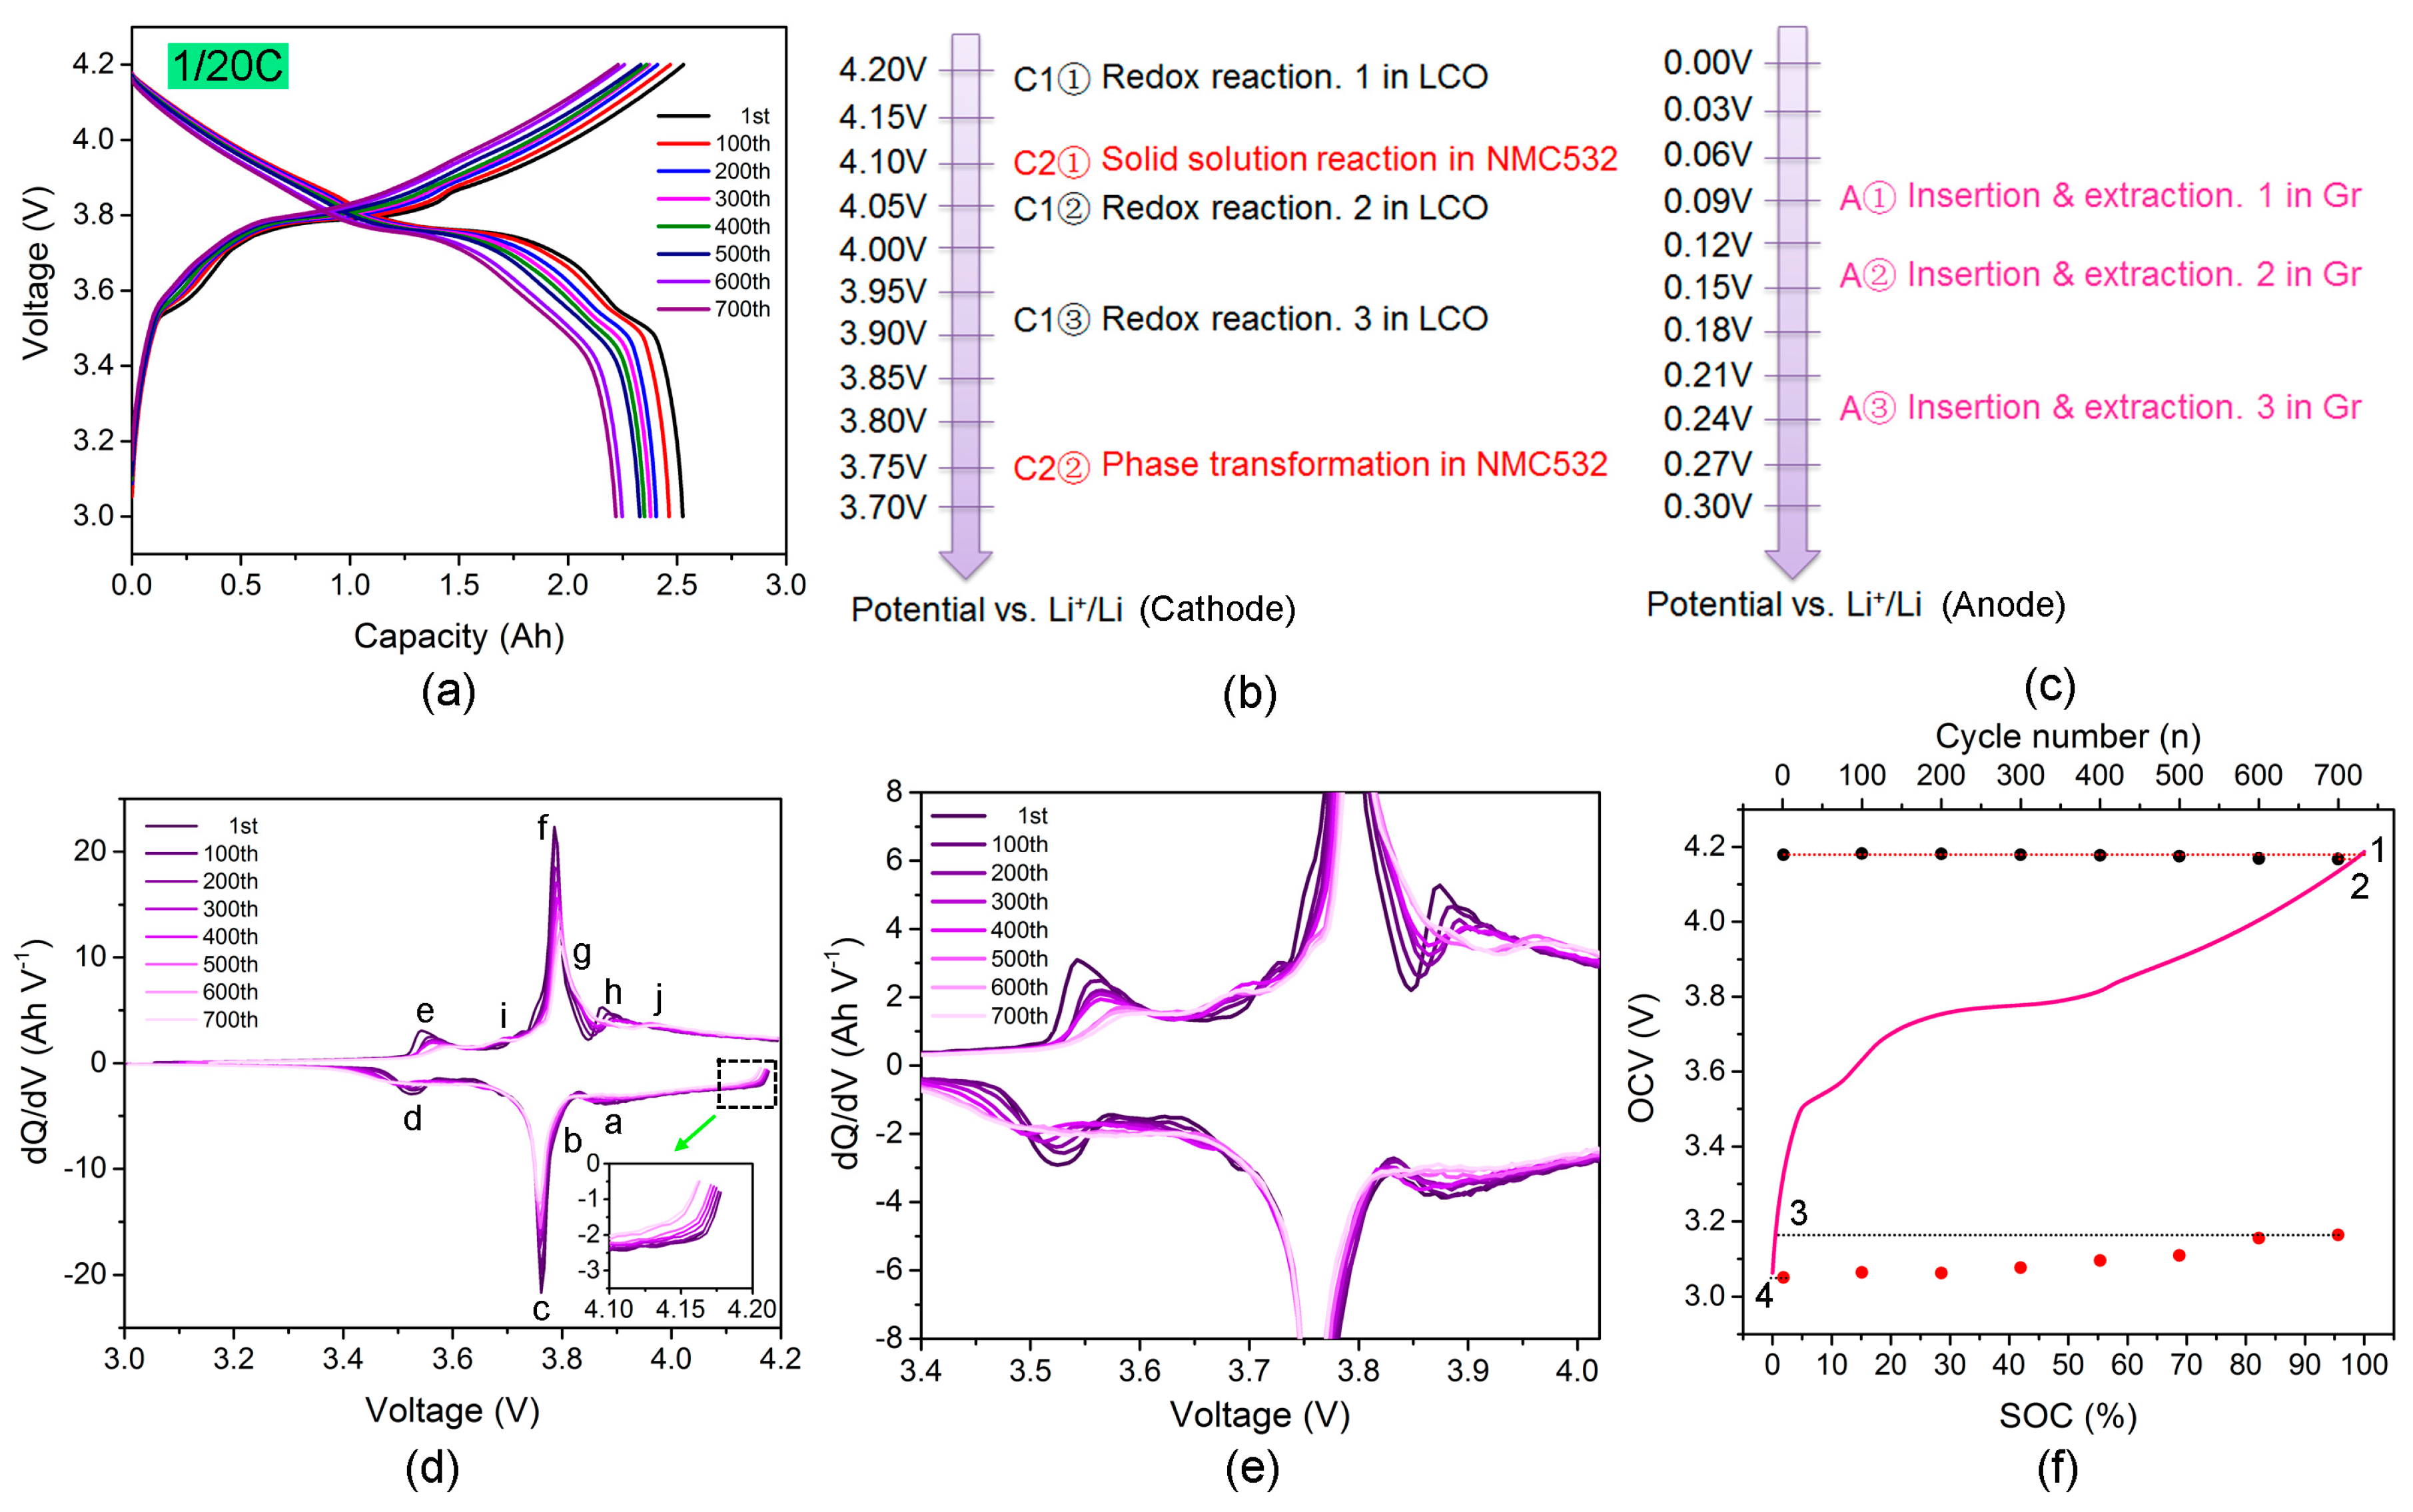
2.2. Detailed Studies of Thermodynamic Characteristics of Full Cells at a Low Rate

To eliminate the effect of cell polarization on the study of capacity decay mechanism, once the cells were cycled for each 100 cycles, they were fully discharged to 3.0 V at 0.05 C rate with a rest of 2 h, and then charged and discharged at a rate of 0.05 C for one cycle. There was also a rest time for 2 h between charge and discharge. The charge and discharge curves at various hundreds of cycles are presented in Figure 3a. Obvious charge and discharge capacity loss can be observed. In the initial cycle, the cell can deliver a discharge capacity of 2.53 Ah. The discharge capacity decreases to 2.46 Ah, 2.40 Ah, 2.38 Ah, 2.35 Ah, 2.33 Ah, 2.25 Ah and 2.22 Ah at 100th, 200th, 300th, 400th, 500th, 600th and 700th cycle, respectively. For the 700th cycled cells, the capacity retention is 87.9% compared to the initial discharge capacity, that is, the real capacity loss is 12.1%. In addition to the capacity loss, salient voltage change can also be demonstrated, in either charge or discharge profile, which can be clearly illustrated in detail by making differential calculations, for instance, dQ/dV plots.
The dQ/dV plots can provide more information about the electrochemical behavior changes of the full cells during long-term cycling process. Its sensitivity is higher than the charge/discharge profiles, which can help us to obtain a more clear understanding of capacity decay mechanisms [30]. Importantly, it involves the capacity loss from active materials and phase transformation. By carefully analyzing the evolutions of the position, magnitude and shape of redox peaks in the dQ/dV profiles upon cycling, and much more information about the gradual variation of cell chemistries can be acquired. Figure 3b,c display the potential position of the redox reactions of the individual LCO, NMC532 and Gr electrodes vs. Li+/Li, respectively. It is reported that the LCO electrode has two very weak couples of redox peaks at 4.19/4.13 V and 4.06/4.03 V vs. Li+/Li (noted as C1① and C1②), and a strong couple of oxidation/reduction peak at 3.97/3.85 V vs. Li+/Li (noted as C1③), associated with the redox reaction of Co3+/Co4+ couple. Sometimes the two couples of weak peaks cannot be observed due to the overlap with or effect of some other peaks [31,32]. NMC532 electrode includes two main reactions at 3.9–4.2 V vs. Li+/Li (noted as C2①) related to solid solution reaction and at around 3.7–3.8 V vs. Li+/Li (noted as C2②) originated from phase transformation [33,34]. For Gr anode, it is always considered to present three significant voltage plateaus during charge/discharge process in full cells. They locate at 0.105/0.065 V, 0.14/0.095 V and 0.23/0.19 V vs. Li+/Li (noted as A①, A②, and A③), respectively, which are attributed to the insertion into and extraction from the graphite layer of the lithium ions [35,36]. Figure 3d shows the dQ/dV profiles of the full cells during charge and discharge with various cycle numbers. In full cells, the displayed voltage is the difference of cathode voltage minus anode voltage. The main peaks are identified based on the chemistry redox reactions of LCO + NMC532 cathode and Gr anode indicated in Figure 3b,c. While some of the redox peaks in the figure are overlapped with each other, we can still clearly clarify the main redox peaks of the full cells. Peaks ‘a’ and ‘h’ reflect the groups of C2①*A①, peaks ‘b’ and ‘g’ for C1③*A①, peaks ‘c’ and ‘f’ for C2①*A② combined with C1③*A②, peaks ‘d’ and ‘e’ for C2②*A③, which are specifically listed in Table 1.
There are several major modes of the capacity decay of batteries with cycling, including mass loss of active materials, loss of lithium inventory, polarization, non-fully discharging and non-fully charging. These modes behave very differently in different evolutions in dQ/dV profiles [30]. For example, the mass loss of active materials usually leads to the proportional reduction of both intensity and areas of all the peaks in dQ/dV plots. For the loss of lithium inventory, the intensity of some peaks will be reduced, some peaks would even disappear. In addition, some new peaks may appear accordingly. The polarization generally results in the higher voltage shift of peaks for charge process and lower voltage shift of the peaks for discharge process. In the case of non-fully discharging and non-fully charging conditions, the beginning or ending point of the dQ/dV curves will change in comparison with the initial state.
In Figure 3d, for the discharge process, although the peaks experience gradual evolution during cycling, they can reach the initial baseline after the cells are discharged to the cut-off voltage. It implies that the cells can be nearly fully discharged despite long cycling. There is almost invisible capacity loss associated with non-fully discharging. The reduction of intensity and shift to lower voltage of the “peaks” below 4.2 V with the long cycling in the inset of Figure 3d are worth noting, especially after 500 cycles, which indicates that the cell is less charged, which will be demonstrated later.
To obtain a better understanding of the evolution of the anodic and cathodic peaks, the dQ/dV plots in Figure 3d are zoomed in, as displayed in Figure 3e. The predominant variations in the dQ/dV plots with aging are related to peaks ‘a’, ‘b’ and ‘c’, which are located at near 3.88 V, 3.76 V and 3.52 V, respectively. First, the magnitude of all the three peaks decreases with cycling and even disappears after 500 cycles, indicating the gradually severe loss of the active materials. The loss of active materials may result from the structural changes and/or phase transformation of the complicated cathode materials. The other reason is that some of the active materials are segregated by film layers formed on the electrode surface, leading to indirect capacity loss [37,38], which will be confirmed later. However, the peaks of 500th to 700th cycled cells show subtle change, possibly due to little active material loss at this stage. Second, the area reduction of peak ‘a’ (belong to C2①) seems to be more serious than peak ‘b’ (attributed to C1③) in the discharge dQ/dV curves. Moreover, the original peak ‘h’ (belong to C2①) gradually disappears and a new peak ‘j’ (attributed to C1②) emerges in the charge dQ/dV profiles with the increasing cycle number. Both the two changes may be due to the fact that there is more mass loss of NMC532 electrodes than LCO. However, it is hard to distinguish the ratio of the loss of these two cathode materials. Third, the main cathodic peaks shift to lower voltage and anodic peaks shift to higher voltage with extended cycles, implying the increase of polarization effect, which will be further described in the following EIS results. Fourth, both the peaks ‘a’ and ‘b’ are in the stage of A① for the anode, however, the intensity of peak ‘a’ gradually decreases, and the peak ‘b’ completely disappears when the cells experience 500 cycles. These changes illustrate that there are no more sufficient lithium ions extracted from Gr anode and inserted into cathode compared with the initial state, implying the occurrence of lithium ion loss during cycling. The possible reasons for lithium loss are that the extracted lithium ions from cathode reach to the surface of the anode and then form the SEI film, or take part in the side reactions in the internal cells [39]. Fifth, for the charge dQ/dV profiles, the anode is at the stage of A③ for the peak ‘e’, and the intensity of this peak decreases and a new peak ‘i’ (A② for the anode) emerges with cycling. While for the cathodes, it is at the same stage of C2② all the time for the two peaks. It demonstrates there is not enough anode used for participating in electrochemical reaction during the A③ stage and it needs to be compensated by A②. This change further confirms the lithium ion loss and the mass loss of graphite anode.
To clarify the quantitative results of capacity loss resulting from non-fully charging and non-fully discharging, the open-circuit voltage (OCV) after the cells are charged with 2 h rest (OCV-ch, black circle) and discharged with 2 h rest (OCV-dis, red circle) is employed, as shown in Figure 3f. The pink curve in Figure 3f is the OCV-SOC (state of charge) curve, which is derived from the average profiles of charge and discharge curves at 0.05 C rate. Through comparing the OCV-ch and OCV-dis with the OCV-SOC curve, we can calculate the corresponding SOC loss before and after cycling, i.e., capacity loss. ‘1’ and ‘2’ represent the initial SOC of the 1st charged cells and final SOC of the 700th charged cells, respectively. ‘4’ and ‘3’ correspond to the initial SOC of the 1st discharged cells and final SOC of the 700th discharged cells, respectively. The OCV does not change much in the initial 500 cycles; however, it evidently varies after 600 and 700 cycles. It is found that there is a 1.7% SOC decrease due to the non-fully charging derivative from the SOC difference between point ‘1’ and ‘2’, and only 0.62% from non-fully discharging from the SOC difference between point ‘4’ and ‘3’ after 700 cycles. Taking into consideration the total capacity loss of 12.1% when the cells suffer 700 cycles, they account for 14% and 5% of the whole capacity loss, respectively.

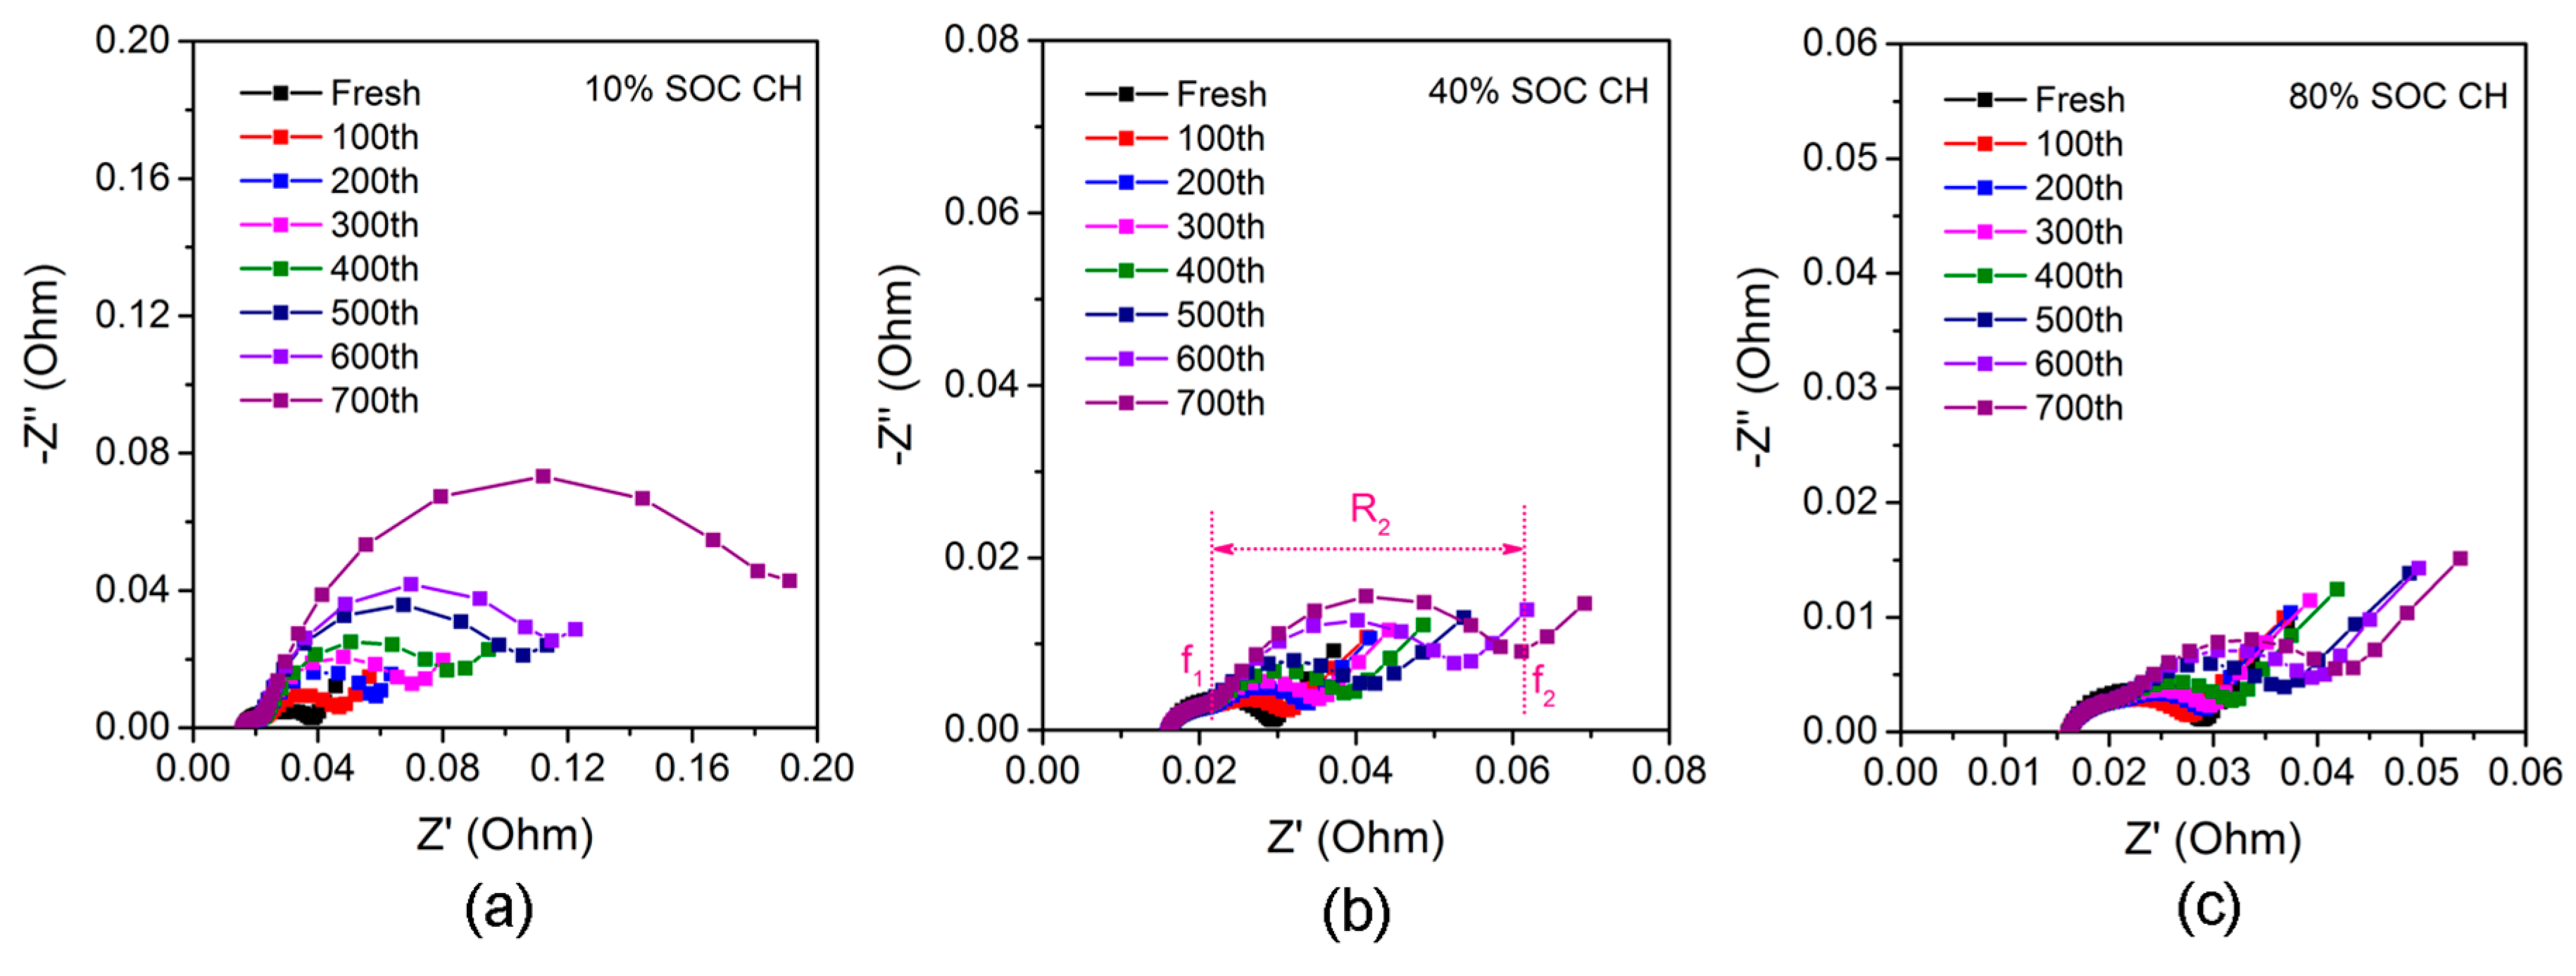
2.3. Analysis of Kinetic Characteristics of Full Cells

To gain information about polarization of the NMC + LCO532/Gr full cells, the EIS of the full cells are conducted as presented in Figure 4. The spectroscopies are tested when the cells are charged to 10% SOC, 40% SOC and 80% SOC, respectively. Most of them present an immature semicircle (SC1) at high frequency, a depressed semicircle (SC2) at medium frequency, and a slope tail (ST) at low frequency. The semicircle at high frequency is attributed to the interface resistance (Rs) of particles and particles, particles and binders, as well as SEI film. The semicircle at medium frequency results from the charge transfer resistance (Rct) of positive and negative electrodes. It reflects the kinetics of the active electrodes. The slope tail at low frequency represents the Warburg impedance (W), which comes from the diffusion of lithium ions in active materials.
The three figures exhibit similar features and the SC1 part does not change significantly, while the SC2 part gradually increases during cycling. In order to more clearly compare the impedance at different SOC with various cycle numbers, some parameters are defined. f1 and f2 are the beginning and ending frequency of the SC2, respectively; and R2 is the width of the SC2 part. The detailed values of the parameters are listed in Table 2. It shows that f1 does not change much with cycling, which is consistent with the nearly unchanged semicircle at high frequency. However, f2 gradually decreases followed with increase of R2 on aging, especially at lower SOC. Since f1 and f2 are inversely proportional to the time constant (τ), and the variation trend of R2 can be regarded as that of Rct to a certain extent, both the decrease of f2 and increase of R2 illustrate the sluggish kinetics of the active electrodes. This possibly results from the structural changes and/or phase transformation of active electrodes, or isolation of active particles and conductive additives, or the collapse of the crystal structure of materials, as well as electrolyte oxidation/decomposition on the surface of the active materials [40,41].
From the figures and the listed values of the parameters in Table 2, some more information can be explored. The increase rate of R2 is lower in the former 400 cycles, however, it significantly increases from the 500th to 700th cycle, illustrating the impedance increase is possibly the main reason for the degradation of the cells in the last several hundred cycles. This is in accordance with the results shown in Figure 3. The sudden increase of R2 at 10% SOC can also be employed to explain the reasons for higher voltage shift of the first peak ‘e’ at around 3.5 V during charge regime in the dQ/dV plots in Figure 3d,e.

3. Studies of Half Cells

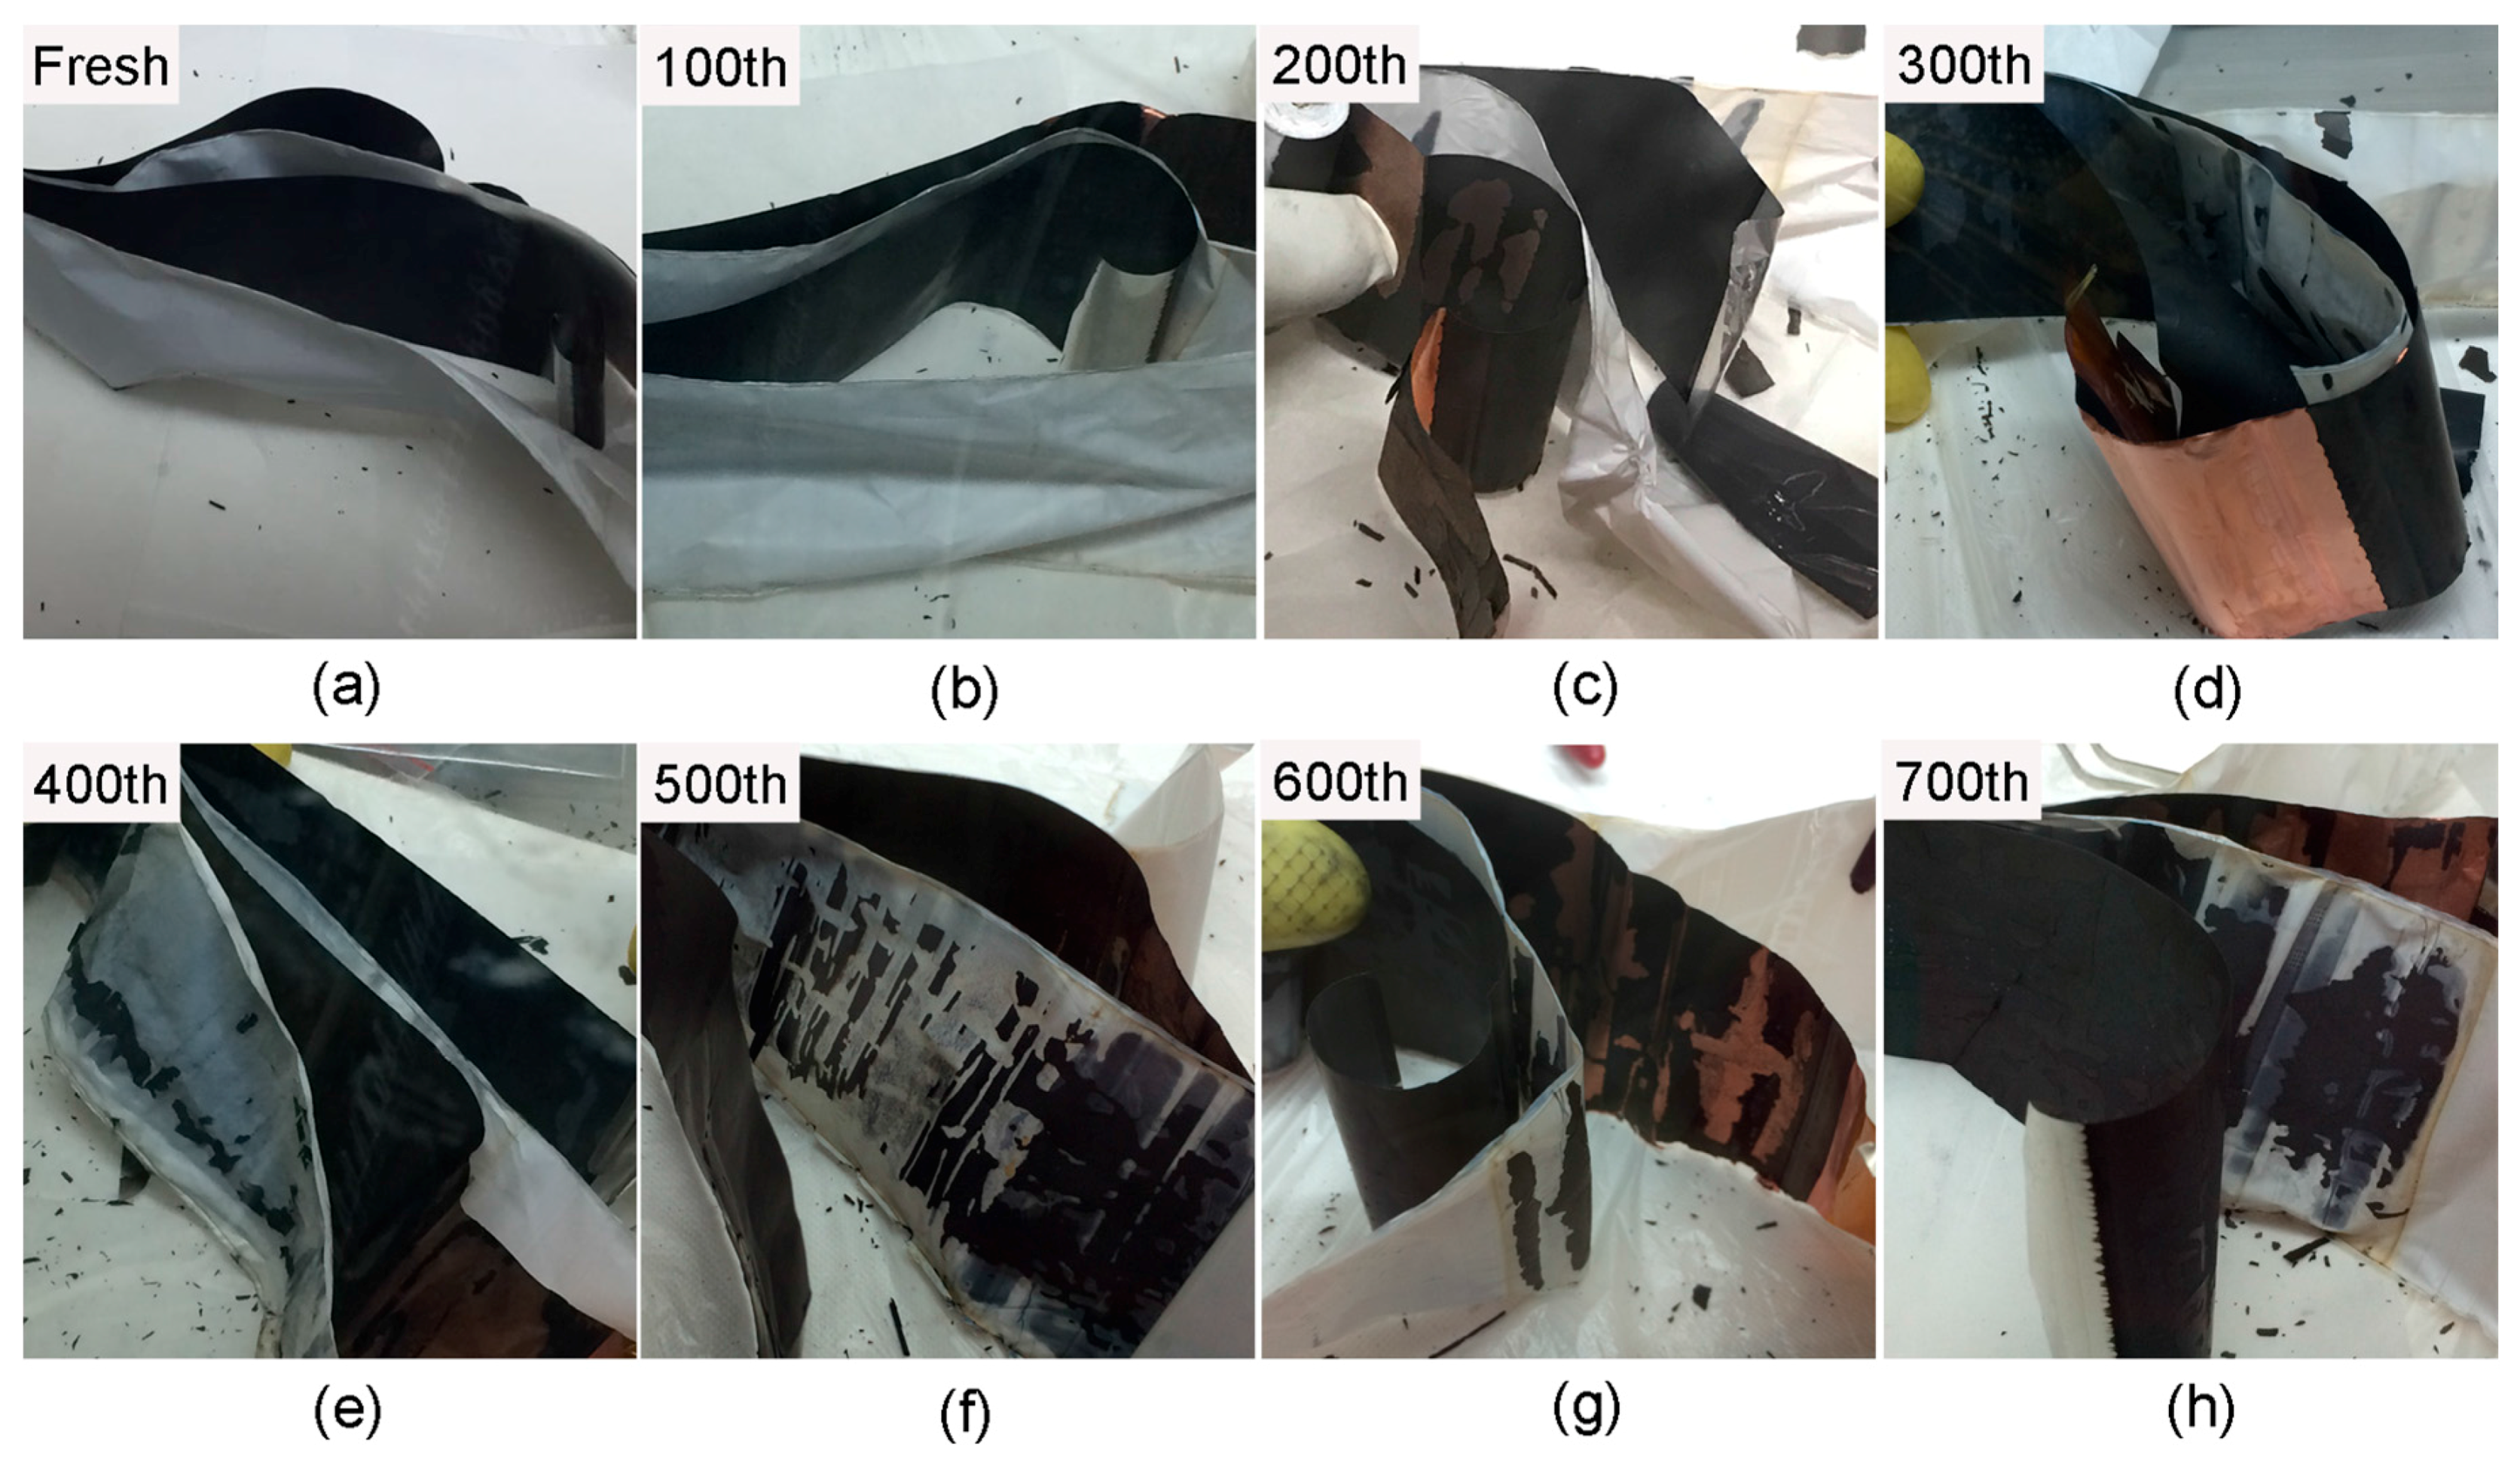
3.1. Harvest of Half Cells

To further understand the decay mechanisms of the LCO + NMC532/Gr full cells, they were disassembled after undergoing each 100 cycles at 1 C rate, which is shown in Figure 5. The cathodes and anodes were then harvested separately. The post-mortem results show the separator of the fresh cells without cycling is clean white and no impurities are adhered. After 100 cycles, it is similar with the fresh one. But for the 200th cycled cells, the color of the separator changes to be darker and some black material is adhered to it. In addition, some graphite anode active materials fall off the copper current collector. With the extended cycling, more and more anode materials are easy to peel off and some of the cathode materials also stick to the separator. The exfoliation is especially severe when the cells cycle for 500 to 700 cycles. The post-mortem copper current collector is barely covered with anode materials at this time. All of these suggest that the electrical contact and the contact among particles gradually loosen upon cycling. This result may be one of the reasons for the increase of impedance and decrease of the electrochemical performance of the cells.

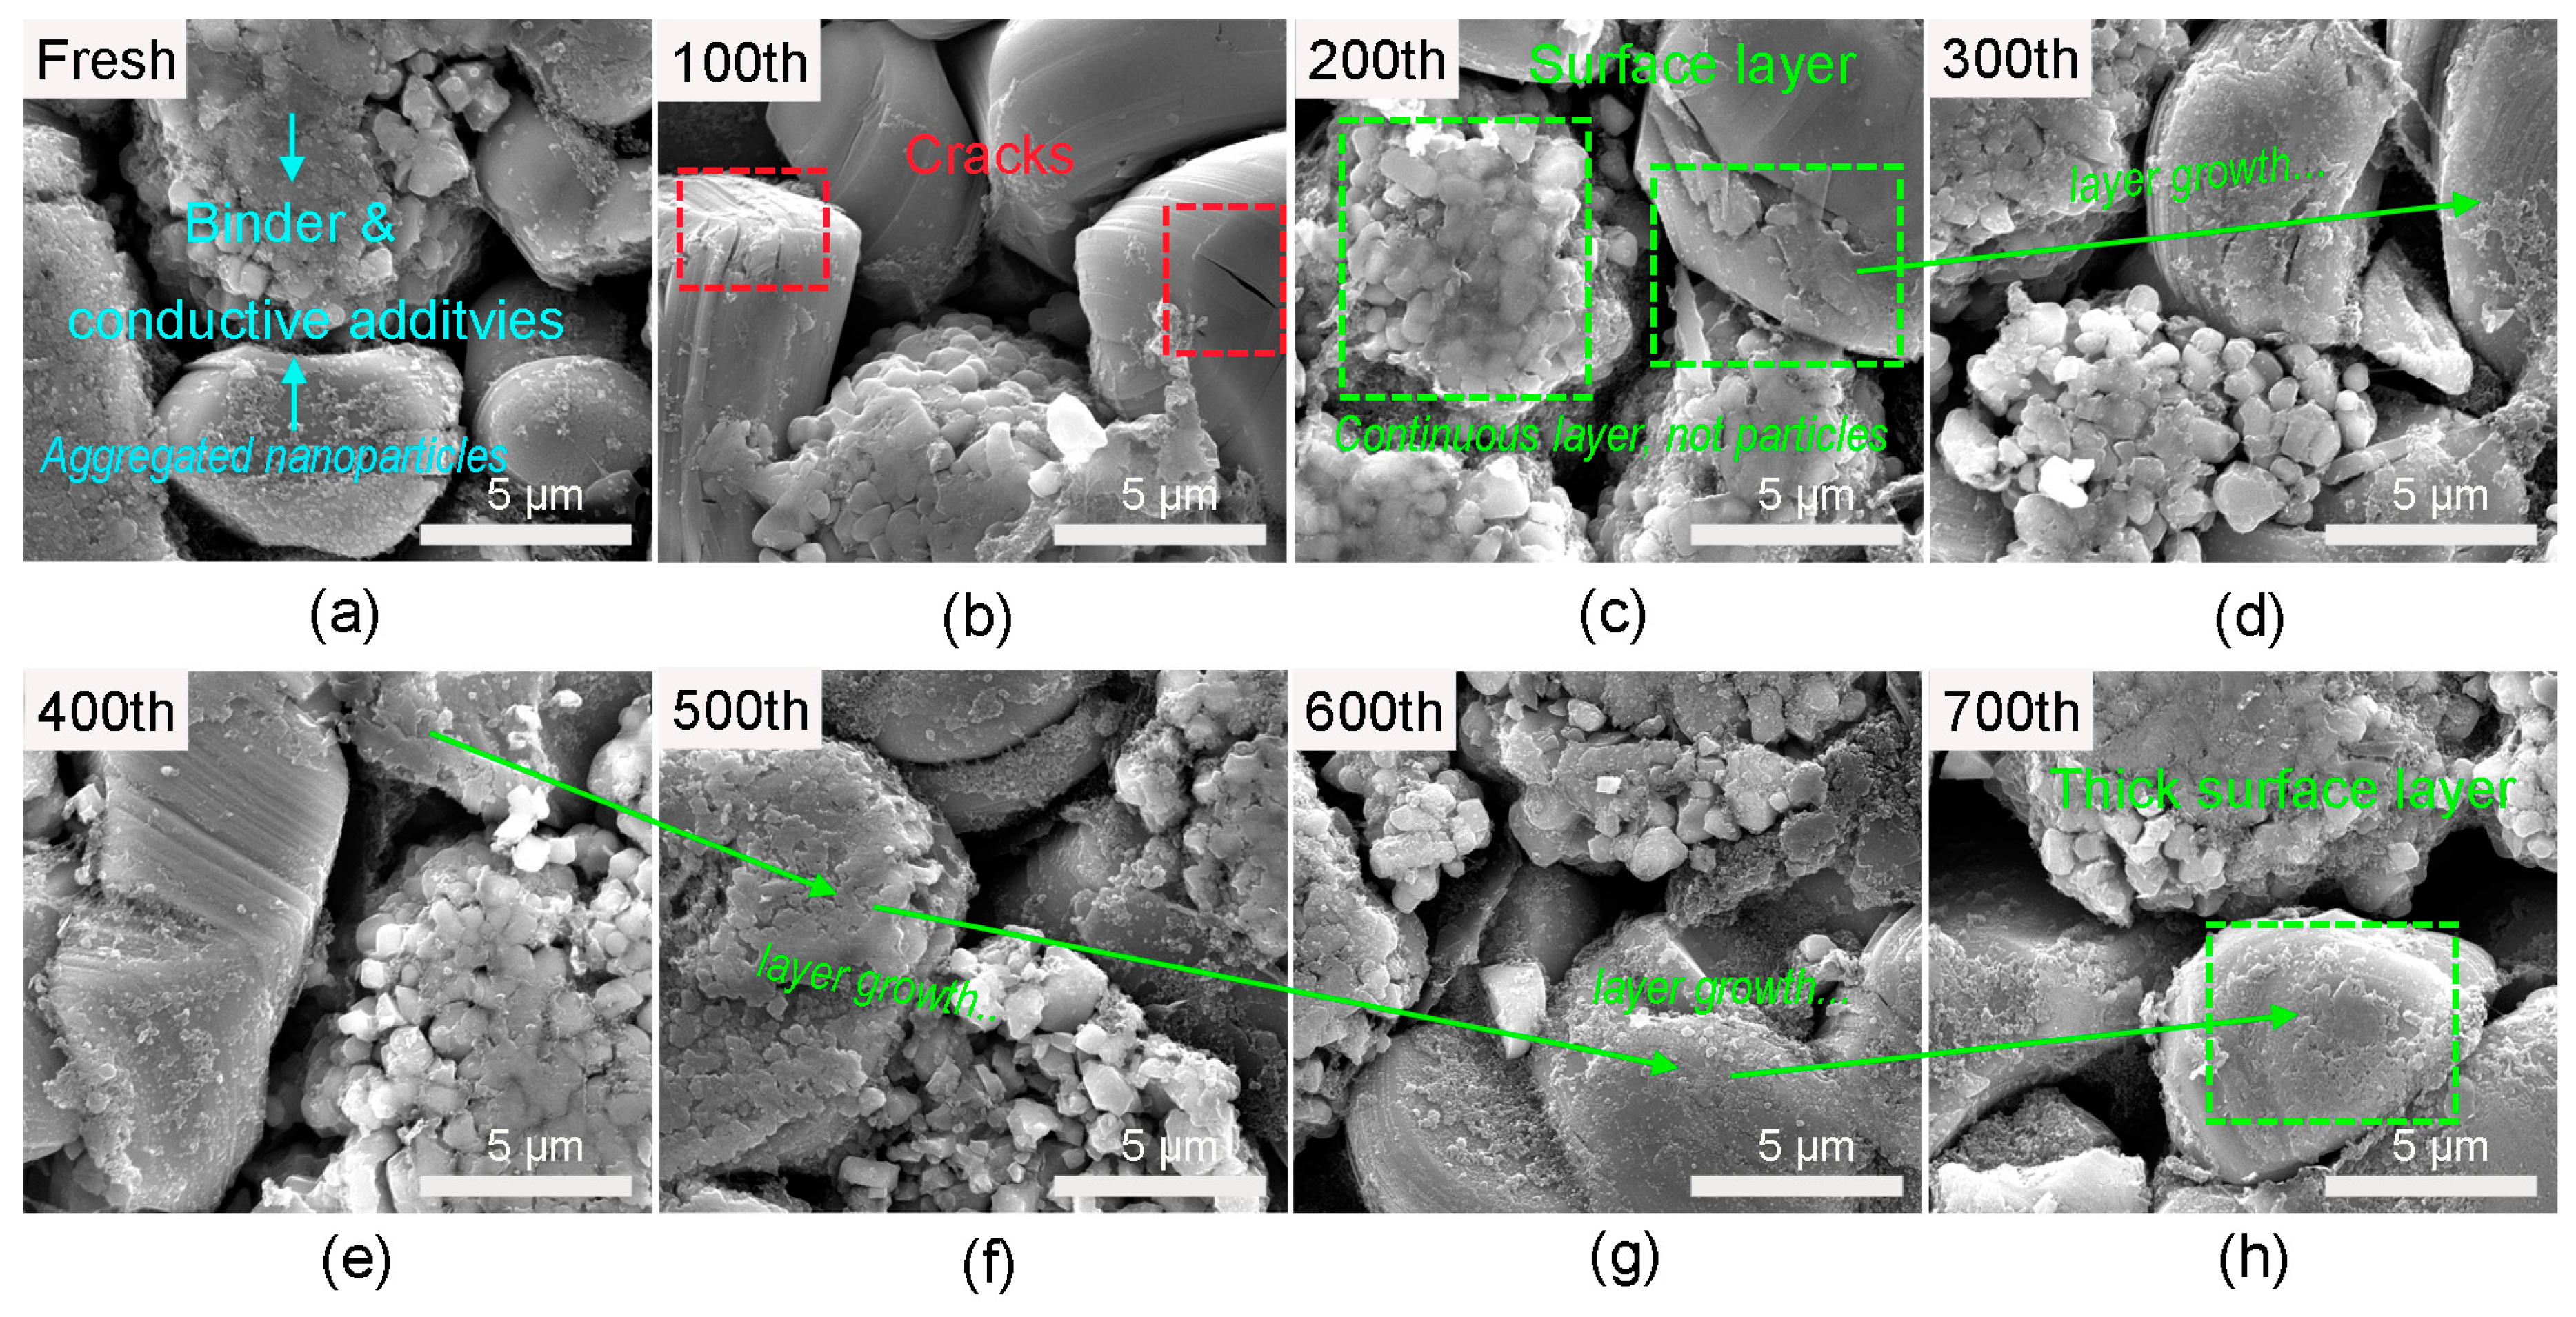
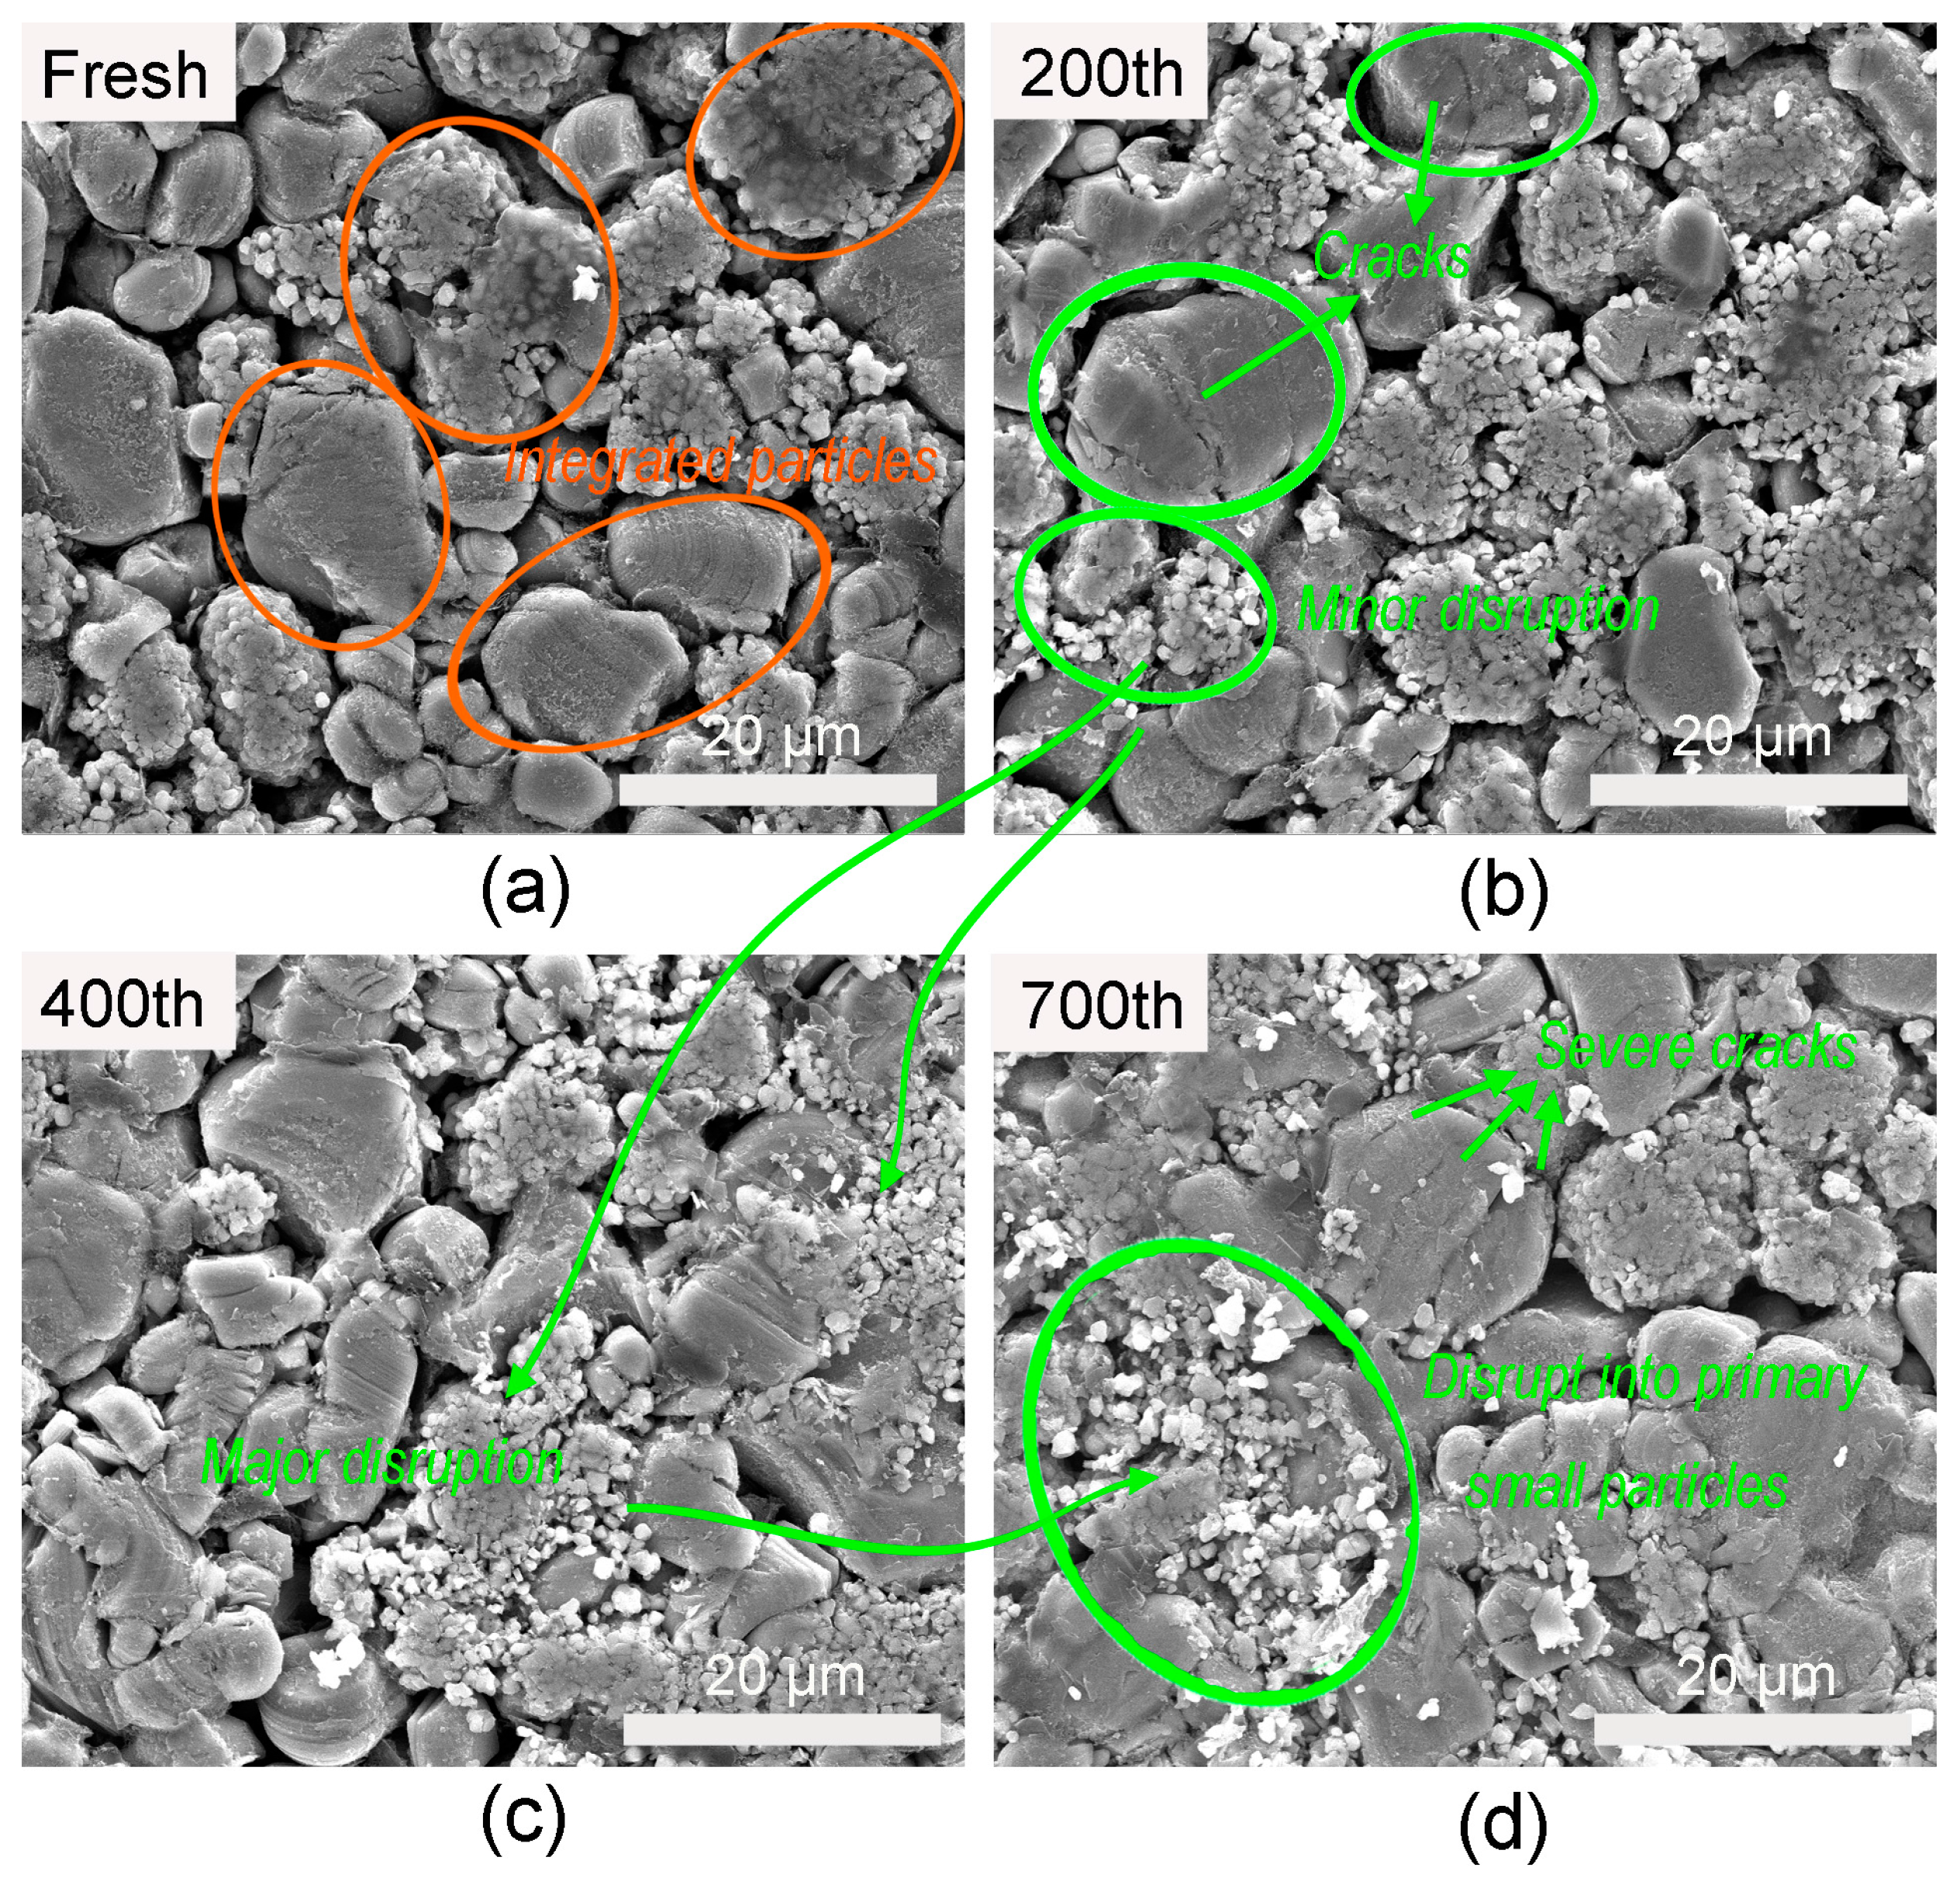
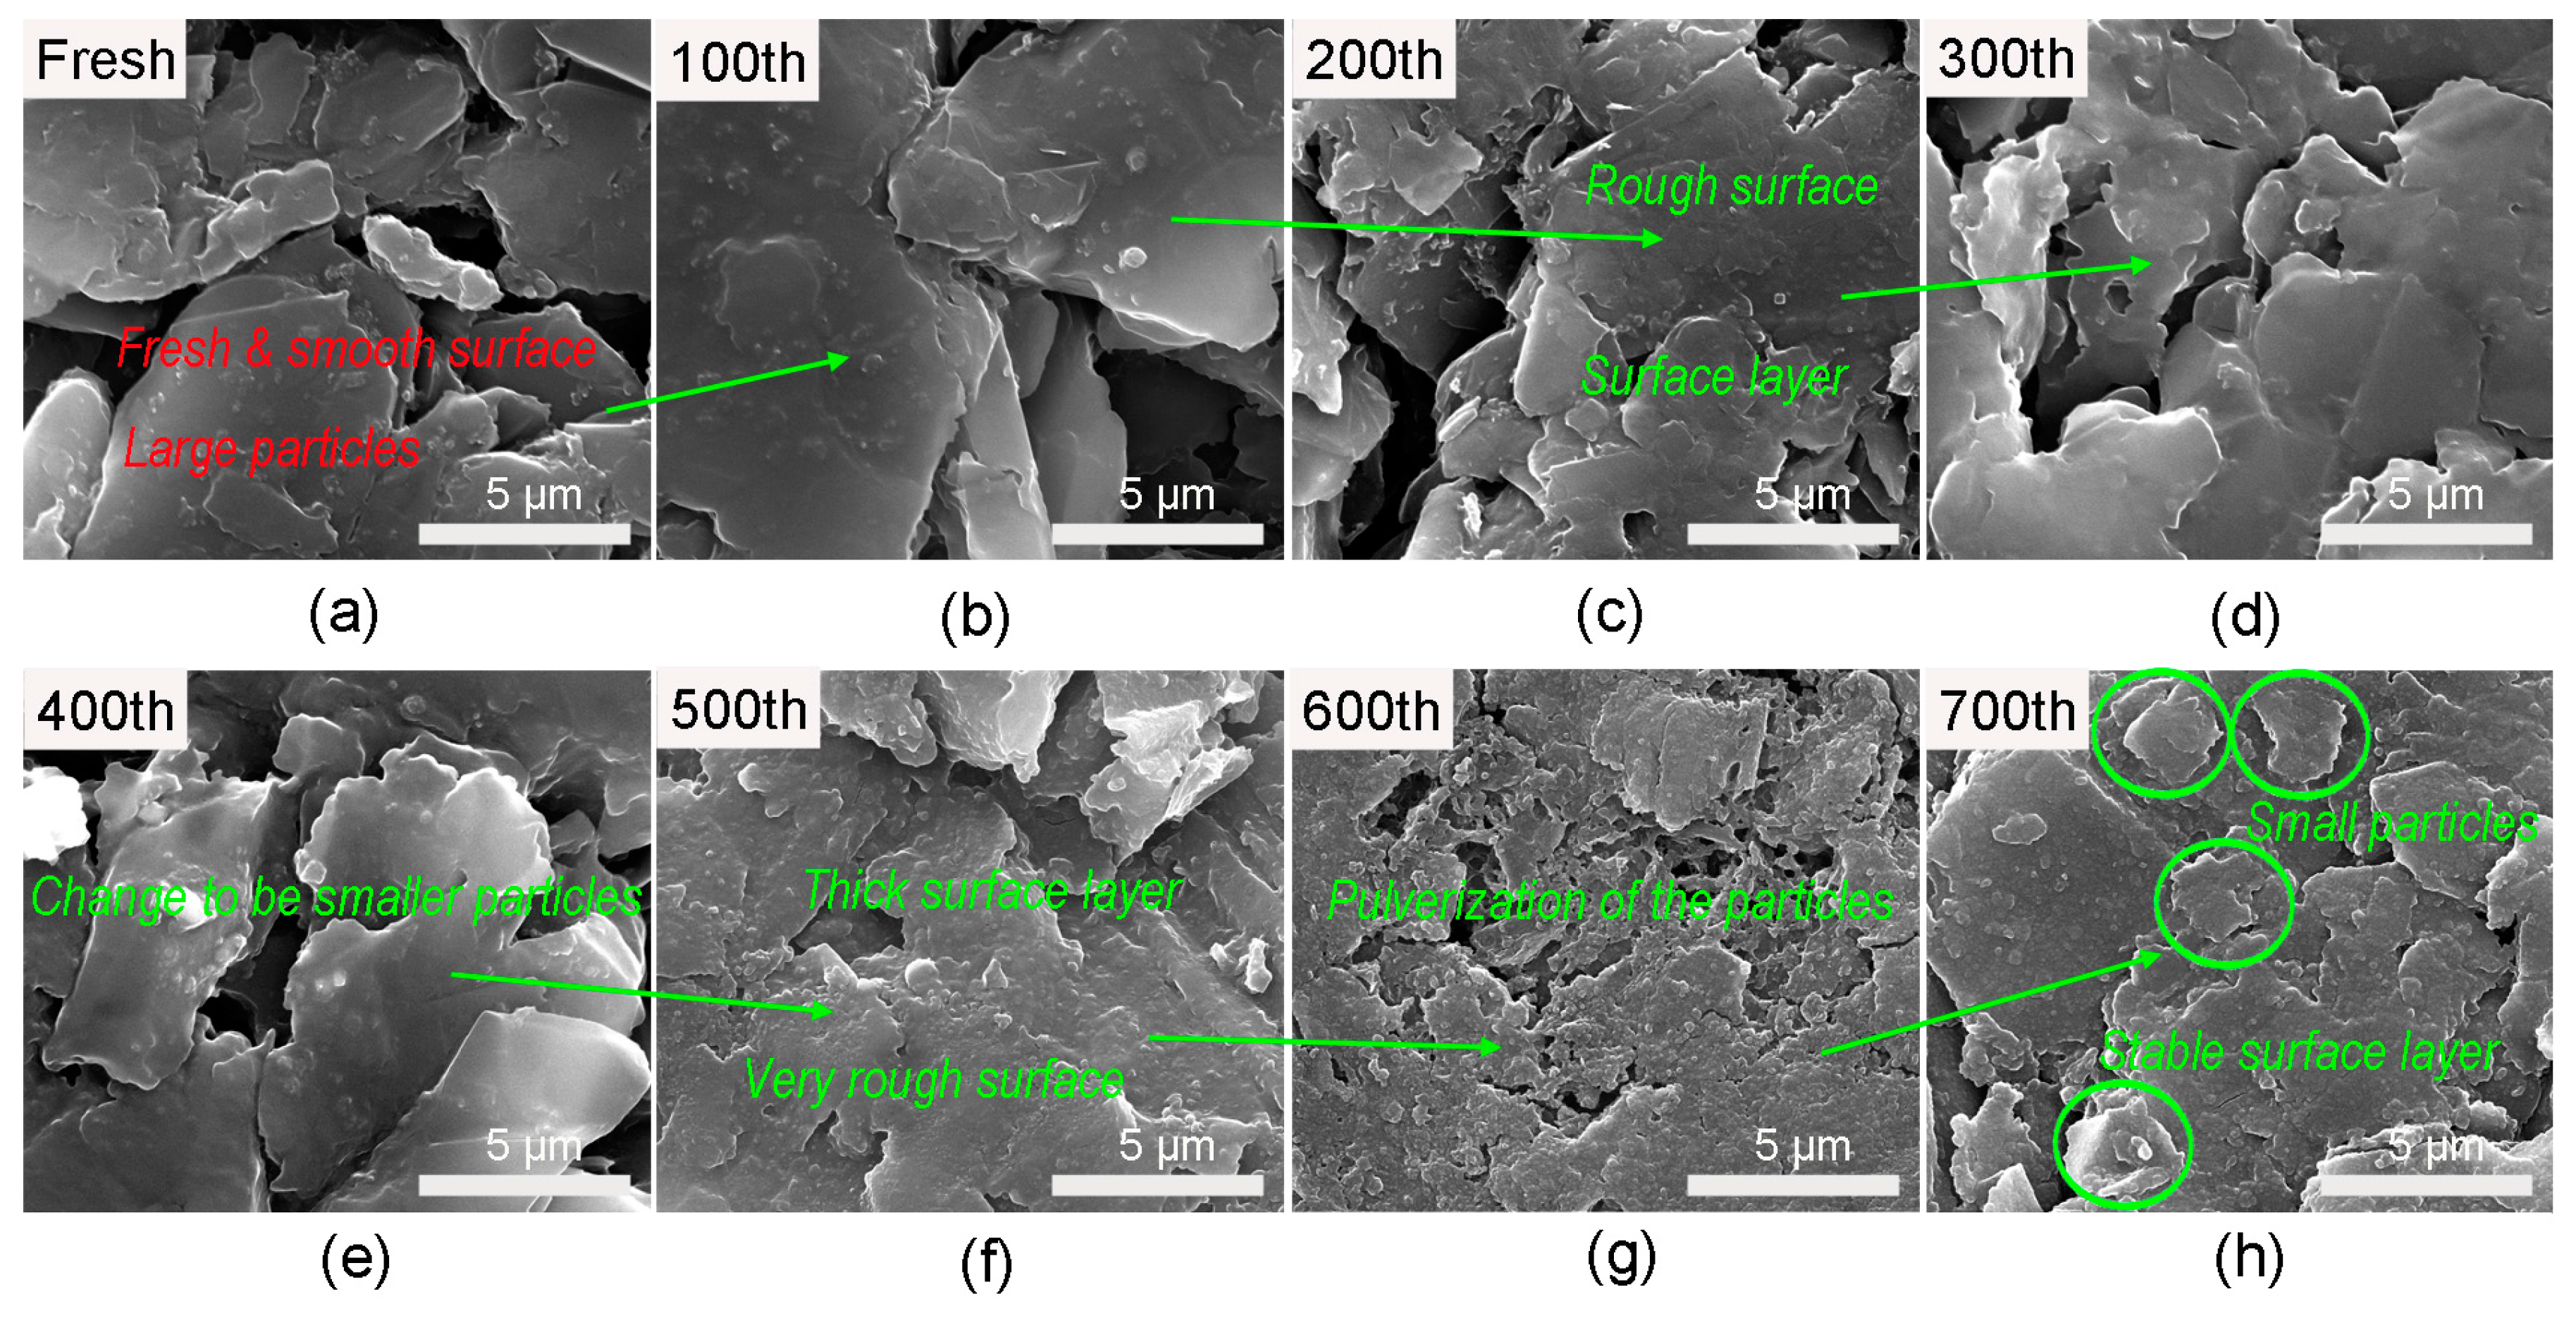
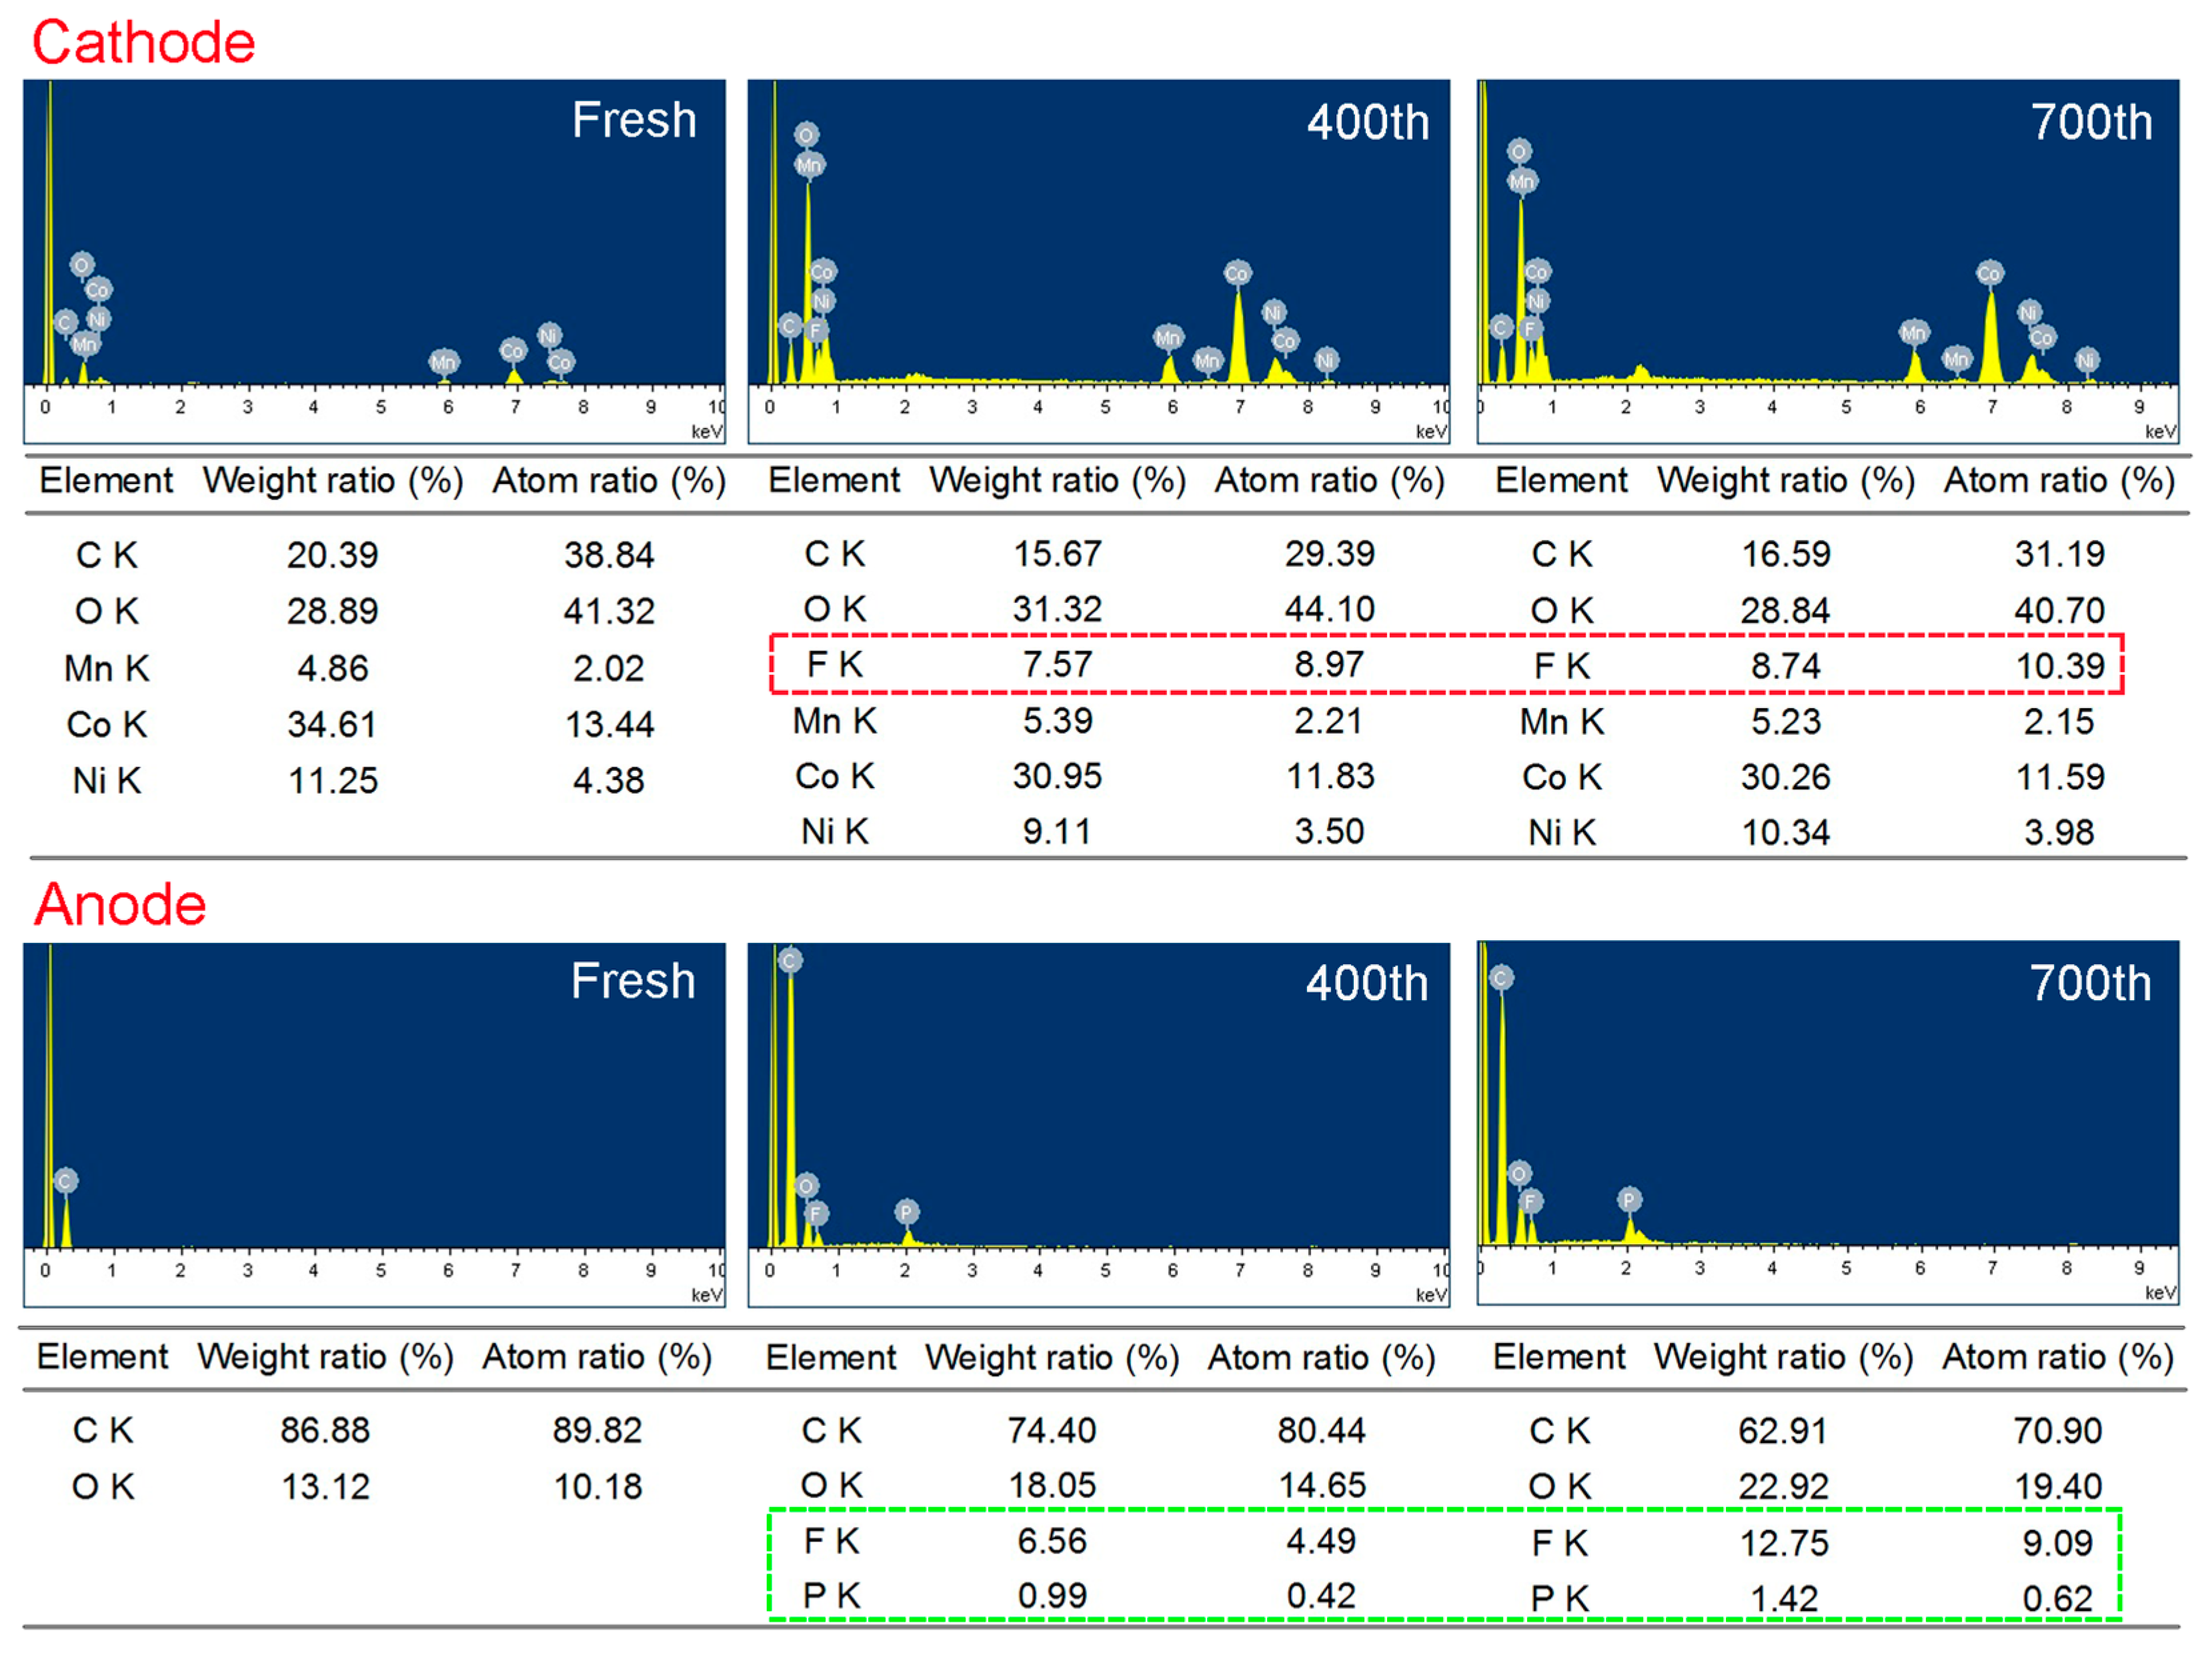
3.2. Morphology and Surface Chemistry Studies of the Harvested Electrodes

The morphology and surface chemistry characteristics of the harvested cathode and anode materials, obtained from Figure 5, are executed using Field Emission Scanning Electron Microscopy (FESEM) (FEI QUANTA 250, FEI Company, Hillsboro, OR, USA) combined with X-ray spectroscopy (EDX, Oxford INCA EDS, Oxford Instruments, Abingdon, Oxfordshire, United Kingdom) method. The SEM images of harvested cathode electrodes at high magnification are shown in Figure 6. We can see that the electrodes consist of two kinds of particles with different morphologies. They are irregular primary large particles (LCO materials) and spherical-like secondary particles assembled with small primary particles (NMC532 materials). The particle size of the LCO materials is 5–15 μm. The size of the secondary particles of the NMC532 materials is 5–10 μm, and the primary particles are hundreds of nanometers. A distinct difference can be observed between the fresh electrode and long-term cycled electrodes. For the fresh electrodes, the particles themselves present a relatively smooth surface and are homogenously mixed with conductive additives and binder. The binder combined with conductive additives in the fresh electrodes present as some clusters of aggregated nanoparticles, indicated by the cyan arrows. After the cells cycle for 100 cycles, there are some cracks in the large primary particles, but they are not obvious, as indicated by red dashed rectangles in Figure 6b. After 200 cycles, the very thin and transparent layer is formed on the surface of most of the particles, as marked by green dashed rectangles in Figure 6c. At this moment, these films present as a continuous growth layers on the surface of active materials, rather than as aggregated nanoparticles. Thus, we can clearly distinguish surface films from conductive additives and binder. From 300th to 500th cycled electrodes, the formed layer is becoming thicker, due to the continuous formation and decomposition process. After cycled for 700 cycles, it changes to be a thick surface layer and uniformly covers on the surface of the active materials, indicated by the green dashed rectangles in Figure 6h. Consequently, the exposed surface of active materials almost disappears, which inhibits the lithium ions from inserting into and extracting from the electrodes during charge and discharge procedures.
To clearly observe the cracks on the particles, the FESEM images under low magnification are performed, as shown in Figure 7. It can be seen that the fresh electrodes consist of integrated large particles combined with binder and conductive additives. After 200 cycles, small cracks appear in the LCO particles, but not very distinct. Moreover, minor disruption of the NMC532 particles are also observed, which is marked with green circles in Figure 7b. With the increase of cycle numbers, the cracks and disruption are becoming more and more apparent, and obvious disruption emerges after 400 cycles. After up to 700 cycles, severe cracks can be convinced in the LCO particles and the integrated secondary particles of NMC532 materials almost disrupt into primary small particles. Note that the particles crack in NMC532 particles is worse than that in LCO materials, which confirms the results obtained from the dQ/dV curves that the mass loss of NMC532 materials is worse than that of LCO materials. The severe crack may induce some defects of diffusion channels of lithium ions [27]. Both the surface film formed on the particles and the cracks in the bulk particles are parts of the reasons leading to the sluggish electrochemical performance of the cells. In addition, the growing rate of the surface film and the extent of particles cracks are basically in agreement with the impedance changes.
The FESEM images of the harvested anode electrodes experiencing various cycles are also shown in Figure 8. For the fresh anode, the large particles exhibit smooth surface. Similar with cycled cathode electrodes, there are some films formed on the surface of the cycled anode materials. It is not obvious when the cells cycle for 100 cycles, but it is easy to be observed for the 200th cycled samples. The surface of the particles turns to be rough in comparison with the fresh sample, which is considered as a surface layer. Then, this film grows very rapidly after long-term cycling. It is very distinct for the electrodes cycled from 500 to 700 cycles. Thick surface layer is formed on the 500th cycled electrodes, and the surface becomes rougher. In addition to surface film, fissuration and pulverization of the particles can also be seen from the 400th cycled Gr electrodes and it becomes fairly severe for the 700th cycled sample. The original large particles break into small particles and stable layers are formed on the surface of the electrodes. The evolutions of the surface layers are indicated by the green circles and arrows. All of these variations would affect the diffusion of the lithium ions during charge and discharge process, finally deteriorating the properties of the full cells.
The EDX results shown in Figure 9 provide the evidence of the existing elements on the surface of the fresh electrode particles and their evolutions with cycling. For the fresh cathode electrode, it only contains transition metal atoms, including Ni, Mn and Co, regardless of carbon and O. However, as the cycling extends, F is formed on the surface and the content of it becomes higher with longer cycle numbers, as indicated by red dashed rectangle. While for the cycled anode electrodes, F and P begin to appear on the surface of the materials and the amount of these two elements significantly grows after 700 cycles, signed by the green dashed rectangle. Most of the newly formed elements come from the electrolyte decomposition and some other side reactions [28]. It would also make the cells suffer from capacity fading.

4. Materials and Methods

4.1. Electrochemical Performance Tests of the Full Cells

The 18650-type full cells were provided by a third party, with a nominal capacity of 2.4 Ah. The cathode and anode materials were based on LiCoO2 + LiNi0.5Mn0.3Co0.2O2 and graphite. The electrodes consisted of active materials mixed with binder and conductive additives. The binder used in cathode electrode was PVDF (Polyvinylidene Fluoride), and SBR (Styrene Butadiene Rubber) combined with CMC (Carboxyl Methyl Cellulose) for the negative electrode. The conductive additives used in both cathode and anode electrodes were SP (Super P). The long-term cycling tests of the cells were performed in the voltage range of 3.0–4.2 V at 30 °C. For the long-term cycling steps, the cells were first charged at a constant current of 1 C rate to 4.2 V, and then 0.5 C to 4.2 V, and then 0.2 C to 4.2 V and finally 0.1 C to 4.2 V, to ensure the cells were fully charged. After that, the cells were discharged to 3.0 V at a constant current of 1 C rate. The cells were rested for 15 min between charge and discharge processes. Before long-term cycling tests, the cells initially experienced five formation cycles, which were charged at a constant current of 0.5 C rate with following constant voltage charge until the current decreased to 0.05 C, and then discharged at 0.5 C. The cells only underwent five formation cycles without prolonged cycling were defined as fresh samples. Once the cells were cycled for 100 cycles at 1 C rate, they were fully discharged to 3.0 V at a very low rate of 0.05 C, and then charged/discharged for one cycle at 0.05 C in the voltage range of 3.0–4.2 V, to obtain more thermodynamic information about the electrodes during cycling.
Electrochemical impedance spectroscopy tests were also applied to analyze the dynamic features of the cells. It was performed when the cells charged to 10%, 40% and 80% SOC. The EIS tests were conducted on Zahner (ZAHNER-Elektrik GmbH & CoKG, Kronach, Germany) in the range of 10 mHz to 100 kHz.

4.2. Morphology and Surface Chemistry Characterization of the Harvested Electrodes

Once the cells experienced 100 cycles at 1 C rate with the following charge-discharge cycle at very low rate and EIS tests at various SOC, they were disassembled to harvest the cathode and anode electrodes, separately. Before disassembly, the cells were fully discharged to 3.0 V at 0.5 C followed with a very low rate of 0.05 C. Cell disassembly was conducted in a glove box filled with Ar. After washed using DMC (dimethyl carbonate), the morphology of the harvested electrodes was examined by field emission scanning electron microscopy (FESEM, FEI QUANTA 250, FEI Company, Hillsboro, OR, USA). The elemental analysis on the surface of the electrodes was performed using the equipped energy dispersive X-ray spectroscopy (EDX).

5. Conclusions

This work studies the fading mechanisms of the 2.4 Ah 18650-type LCO + NMC532/Gr full cells. The thermodynamic and kinetics characteristics of the cells with various cycles are examined. Continuous electrochemical changes can be determined through analyzing the differential capacity curves of cycled cells with different cycle numbers. The dQ/dV tests demonstrate that both the loss of cathode and anode active materials and the loss of lithium ions inventory probably contribute to the capacity decay of the full cells. The electrochemical impedance spectroscopy results show that the polarization/resistance of the cells increases with the increasing cycle numbers, illustrating the sluggish kinetics of the cells upon cycling. Based on the post-mortem analysis of fresh and cycled electrodes, the particles cracks and the obvious surface films are formed in both cycled cathode and anode electrodes. The two cathode materials show different morphological changes. The LCO shows micro crystal cracks, while the disruptions of secondary particles of NMC532 materials are particularly distinct after the 700 cycles. In addition, F and/or P emerge on the surface films of the cycled cathode and anode electrodes. We believe that these are the primary contributing factors to the declining electrochemical performance of the full cells. Thus, protecting the surface of particles likely leads to maintaining higher capacity retention to a certain amount. Our work may provide guidance for the better understanding, usage and applications of LIBs. This study method should shed light on the study of the decay mechanisms of other types of lithium ion batteries and energy store systems.

Acknowledgments

This work is supported by the Natural Science of Foundation of China under Grant Number U1664255.

Author Contributions

Linjing Zhang, Jiuchun Jiang and Weige Zhang conceived and designed the experiments; Linjing Zhang performed the experiments, analyzed the data and wrote the paper.

Conflicts of Interest

The authors declare no conflict of interest.

References

  1. Tarascon, J.-M.; Armand, M. Issues and challenges facing rechargeable lithium batteries. Nature 2001, 414, 359–367. [Google Scholar] [CrossRef] [PubMed]
  2. Whittingham, M.S. Lithium batteries and cathode materials. Chem. Rev. 2004, 104, 4271–4302. [Google Scholar] [CrossRef] [PubMed]
  3. Kang, K.; Meng, Y.S.; Bréger, J.; Gray, C.P.; Ceder, G. Electrodes with high power and high capacity for rechargeable lithium batteries. Science 2006, 311, 977–980. [Google Scholar] [CrossRef] [PubMed]
  4. Armand, M.; Tarascon, J.-M. Building better batteries. Nature 2008, 451, 652–657. [Google Scholar] [CrossRef] [PubMed]
  5. Scrosati, B.; Hassoun, J.; Sun, Y.-K. Lithium-ion batteries. A look into the future. Energy Environ. Sci. 2011, 4, 3287–3295. [Google Scholar] [CrossRef]
  6. Thackeray, M.M.; Wolverton, C.; Isaacs, E.D. Electrical energy storage for transportation-approaching the limits of, and going beyond, lithium-ion batteries. Energy Environ. Sci. 2012, 5, 7854–7863. [Google Scholar] [CrossRef]
  7. Mizushima, K.; Jones, P.C.; Wiseman, P.J.; Goodenough, J.B. LixCoO2 (0 < x ≤ −1): A new cathode material for batteries of high energy density. Mater. Res. Bull. 1980, 15, 783–789. [Google Scholar]
  8. Antolini, E. LiCoO2: Formation, structure, lithium and oxygen nonstoichiometry, electrochemical behaviour and transport properties. Solid State Ion. 2004, 170, 159–171. [Google Scholar] [CrossRef]
  9. Liu, Z.; Yu, A.; Lee, J.Y. Synthesis and characterization of LiNi1-x-yCoxMnyO2 as the cathode materials of secondary lithium batteries. J. Power Sources 1999, 81–82, 416–419. [Google Scholar] [CrossRef]
  10. Hwang, B.J.; Tsai, Y.W.; Chen, C.H.; Santhanam, R. Influence of Mn content on the morphology and electrochemical performance of LiNi1-x-yCoxMnyO2 cathode materials. J. Mater. Chem. 2003, 13, 1962–1968. [Google Scholar] [CrossRef]
  11. Sun, Y.-K.; Myung, S.-T.; Park, B.-C.; Prakash, J.; Belharouak, I.; Amine, K. High-energy cathode material for long-life and safe lithium batteries. Nat. Mater. 2009, 8, 320–324. [Google Scholar] [CrossRef] [PubMed]
  12. Wei, Y.; Zheng, J.; Cui, S.; Song, X.; Su, Y.; Deng, W.; Wu, Z.; Wang, X.; Wang, W.; Rao, M.; Lin, Y.; Wang, C.; Amine, K.; Pan, F. Kinetics tuning of Li-ion diffusion in layered Li(NixMnyCoz)O2. J. Am. Chem. Soc. 2015, 137, 8364–8367. [Google Scholar] [CrossRef] [PubMed]
  13. Noh, M.; Cho, J. Optimized synthetic conditions of LiNi0.5Co0.2Mn0.3O2 Cathode materials for high rate lithium batteries via co-precipitation method. J. Electrochem. Soc. 2013, 160, A105–A111. [Google Scholar] [CrossRef]
  14. Su, Y.; Cui, S.; Zhuo, Z.; Yang, W.; Wang, X.; Pan, F. Enhancing the high-voltage cycling performance of LiNi0.5Mn0.3Co0.2O2 by retarding its interfacial reaction with an electrolyte by atomic-layer-deposited Al2O3. ACS Appl. Mater. Interfaces 2015, 7, 25105–25112. [Google Scholar] [CrossRef] [PubMed]
  15. He, M.; Su, C.-C.; Peebles, C.; Feng, Z.; Connell, J.G.; Liao, C.; Wang, Y.; Shkrob, I.A.; Zhang, Z. Mechanistic insight in the function of phosphite additives for protection of LiNi0.5Co0.2Mn0.3O2 cathode in high voltage Li-ion cells. ACS Appl. Mater. Interfaces 2016, 8, 11450–11458. [Google Scholar] [CrossRef] [PubMed]
  16. Flandrois, S.; Simon, B. Carbon materials for lithium-ion rechargeable batteries. Carbon 1999, 37, 165–180. [Google Scholar] [CrossRef]
  17. An, S.J.; Li, J.; Daniel, C.; Mohanty, D.; Nagpure, S.; Wood, D.L., III. The state of understanding of the lithium-ion-battery graphite solid electrolyte interphase (SEI) and its relationship to formation cycling. Carbon 2016, 105, 52–76. [Google Scholar] [CrossRef]
  18. Wong, D.; Shrestha, B.; Wetz, D.A.; Heinzel, J.M. Impact of high rate discharge on the aging of lithium nickel cobalt aluminum oxide batteries. J. Power Sources 2015, 280, 363–372. [Google Scholar] [CrossRef]
  19. Dubarry, M.; Liaw, B.Y. Identify capacity fading mechanism in a commercial LiFePO4 cell. J. Power Sources 2009, 194, 541–549. [Google Scholar] [CrossRef]
  20. Sarre, G.; Blanchard, P.; Broussely, M. Aging of lithium-ion batteries. J. Power Sources 2004, 127, 65–71. [Google Scholar] [CrossRef]
  21. Zhang, S.S. The effect of the charging protocol on the cycle life of a Li-ion battery. J. Power Sources 2006, 161, 1385–1391. [Google Scholar] [CrossRef]
  22. Guan, T.; Zuo, P.; Sun, S.; Du, C.; Zhang, L.; Cui, Y.; Yang, L.; Gao, Y.; Yin, G.; Wang, F. Degradation mechanism of LiCoO2/mesocarbon microbeads battery based on accelerated aging tests. J. Power Sources 2014, 268, 816–823. [Google Scholar] [CrossRef]
  23. Kobayashi, H.; Shikano, M.; Koike, S.; Sakaebe, H.; Tatsumi, K. Investigation of positive electrodes after cycle testing of high-power Li-ion battery cells I. An approach to the power fading mechanism using XANES. J. Power Sources 2007, 174, 380–386. [Google Scholar] [CrossRef]
  24. Abraham, D.P.; Liu, J.; Chen, C.H.; Hyung, Y.E.; Stoll, M.; Elsen, N.; MacLaren, S.; Twesten, R.; Haasch, R.; Sammannb, E.; Petrov, I.; Amine, K.; Henriksen, G. Diagnosis of power fade mechanisms in high-power lithium-ion cells. J. Power Sources 2003, 119–121, 511–516. [Google Scholar] [CrossRef]
  25. Zheng, H.; Sun, Q.; Liu, G.; Song, X.; Battaglia, V.S. Correlation between dissolution behavior and electrochemical cycling performance for LiNi1/3Co1/3Mn1/3O2-based cells. J. Power Sources 2012, 207, 134–140. [Google Scholar] [CrossRef]
  26. Lee, Y.-J.; Choi, H.-Y.; Ha, C.-W.; Yu, J.-H.; Hwang, M.-J.; Doh, C.-H.; Choi, J.-H. Cycle life modeling and the capacity fading mechanisms in a graphite/LiNi0.6Co0.2Mn0.2O2 cell. J. Appl. Electrochem. 2015, 45, 419–426. [Google Scholar] [CrossRef]
  27. Jung, S.-K.; Gwon, H.; Hong, J.; Park, K.-Y.; Seo, D.-H.; Kim, H.; Hyun, J.; Yang, W.; Kang, K. Understanding the degradation mechanisms of LiNi0.5Co0.2Mn0.3O2 cathode material in lithium ion batteries. Adv. Energy Mater. 2013, 4, 1300787. [Google Scholar] [CrossRef]
  28. Gilbert, J.A.; Bareño, J.; Spila, T.; Trask, S.E.; Miller, D.J.; Polzin, B.J.; Jansen, A.N.; Abraham, D.P. Cycling behavior of NCM523/graphite lithium-ion cells in the 3–4.4 V range: Diagnostic studies of full cells and harvested electrodes. J. Electrochem. Soc. 2017, 164, A6054–A6065. [Google Scholar] [CrossRef]
  29. Markervich, E.; Salitra, G.; Levi, M.D.; Aurbach, D. Capacity fading of lithiated graphite electrodes studied by a combination of electroanalytical methods; Raman spectroscopy and SEM. J. Power Sources 2005, 146, 146–150. [Google Scholar] [CrossRef]
  30. Dubarry, M.; Svoboda, V.; Hwu, R.; Liaw, B.Y. Incremental capacity analysis and close-to-equilibrium OCV measurements to quantify capacity fade in commercial rechargeable lithium batteries. Electrochem. Solid ST 2006, 9, A454–A457. [Google Scholar] [CrossRef]
  31. Reimers, J.N.; Dahn, J.R. Electrochemical and in situ X-ray diffraction studies of lithium intercalation in LixCoO2. J. Electrochem. Soc. 1992, 139, 2091–2097. [Google Scholar] [CrossRef]
  32. Huang, B.; Jang, Y.-I.; Chiang, Y.-M.; Sadoway, D.R. Electrochemical evaluation of LiCoO2 synthesized by decomposition and intercalation of hydroxides for lithium-ion battery applications. J. Appl. Electrochem. 1998, 28, 1365–1369. [Google Scholar] [CrossRef]
  33. Pentyala, N.; Guduru, R.K.; Mohanty, P.S. Binder free porous ultrafine/nano structured LiCoO2 cathode from plasma deposited cobalt. Electrochim. Acta 2011, 56, 9851–9859. [Google Scholar] [CrossRef]
  34. Dixit, M.; Kosa, M.; Lavi, O.S.; Markovsky, B.; Aurbach, D.; Major, D.T. Thermodynamic and kinetic studies of LiNi0.5Co0.2Mn0.3O2 as a positive electrode material for Li-ion batteries using first principles. Phys. Chem. Chem. Phys. 2016, 18, 6799–6812. [Google Scholar] [CrossRef] [PubMed]
  35. Dahn, J.R. Phase diagram of LixC6. Phys. Rev. B 1991, 44, 9170–9177. [Google Scholar] [CrossRef]
  36. Ohzuku, T.; Iwakoshi, Y.; Sawai, K. Formation of lithium-graphite intercalation compounds in nonaqueous electrolytes and their application as a negative electrode for a lithium ion (shuttlecock) cell. J. Electrochem. Soc. 1993, 140, 2490–2498. [Google Scholar] [CrossRef]
  37. Vetter, J.; Novák, P.; Wagner, M.R.; Veit, C.; Möller, K.-C.; Besenhard, J.O.; Winter, M.; Wohlfahrt-Mehrens, M.; Vogler, C.; Hammouche, A. Ageing mechanisms in lithium-ion batteries. J. Power Sources 2005, 147, 269–281. [Google Scholar] [CrossRef]
  38. Barré, A.; Deguilhem, B.; Grolleau, S.; Gérard, M.; Suard, F.; Riu, D. A review on lithium-ion battery ageing mechanisms and estimations for automotive applications. J. Power Sources 2013, 241, 680–689. [Google Scholar] [CrossRef]
  39. Dubarry, M.; Truchot, C.; Liaw, B.Y.; Gering, K.; Sazhin, S.; Jamison, D.; Michelbacher, C. Evaluation of commercial lithium-ion cells based on composite positive electrode for plug-in hybrid electric vehicle applications. Part II. Degradation mechanism under 2 C cycle aging. J. Power Sources 2011, 196, 10336–10343. [Google Scholar] [CrossRef]
  40. Zhang, Q.; White, R.E. Calendar life study of Li-ion pouch cells. J. Power Sources 2007, 173, 990–997. [Google Scholar] [CrossRef]
  41. Buchberger, I.; Seidlmayer, S.; Pokharel, A.; Pianaa, M.; Hattendorff, J.; Kudejova, P.; Gilles, R.; Gasteiger, H.A. Aging analysis of graphite/ LiNi1/3Mn1/3Co1/3O2 cells using XRD; PGAA and AC impedance. J. Electrochem. Soc. 2015, 162, A2737–A2746. [Google Scholar] [CrossRef]
Figure 1. Long-term cycling performance: discharge capacities and capacity retentions of the lithium cobalt oxide (LCO) + NMC532/Gr full cells.
Energies 10 01147 g001
Figure 2. (a) Charge/discharge profiles at 1 C rate; (b) Charge capacity percentage at 1 C, 0.5 C, 0.2 C and 0.1 C rate based on the total charge capacity with cycling; (c) Discharge medium voltage at 1 C rate; (d) Discharge dQ/dV plots at 1 C rate of the LCO+NCM532/Gr full cells.
Energies 10 01147 g002
Figure 3. (a) Charge/discharge profiles at 0.05 C rate at various hundreds of cycles; (b,c) Potential position of the redox reactions of the individual LCO, NMC532 and Gr electrodes vs. Li+/Li, respectively; (d) Corresponding dQ/dV plots at 0.05 C rate, (inset) the magnification of the dashed rectangle part; (e) Zoomed in dQ/dV plots; (f) Open-circuit voltage (OCV)-state of charge (SOC) curve and OCV-ch and OCV-dis at various cycles of the LCO + NMC532/Gr full cells.
Energies 10 01147 g003
Figure 4. EIS results of the LCO + NMC532/Gr full cells at various SOC during charging: (a) 10% SOC; (b) 40% SOC; (c) 80% SOC.
Energies 10 01147 g004
Figure 5. Pictures of harvested cell parts including LCO + NMC532 cathodes, Gr electrodes and separators experienced various cycles: (a) fresh; (b) 100th; (c) 200th; (d) 300th; (e) 400th; (f) 500th; (g) 600th; (h) 700th.
Energies 10 01147 g005
Figure 6. Field Emission Scanning Electron Microscopy (FESEM) images of harvested LCO + NMC532 cathode electrodes experienced various cycles at high magnification: (a) fresh; (b) 100th; (c) 200th; (d) 300th; (e) 400th; (f) 500th; (g) 600th; (h) 700th.
Energies 10 01147 g006
Figure 7. FESEM images of harvested LCO + NMC532 cathode electrodes experienced various cycles at low magnification: (a) fresh; (b) 200th; (c) 400th; (d) 700th.
Energies 10 01147 g007
Figure 8. FESEM images of harvested Gr anode electrodes experienced various cycles: (a) fresh; (b) 100th; (c) 200th; (d) 300th; (e) 400th; (f) 500th; (g) 600th; (h) 700th.
Energies 10 01147 g008
Figure 9. X-ray spectroscopy (EDX) results of harvested LCO + NCM532 cathode electrodes and Gr anode electrodes after experienced various cycles.
Energies 10 01147 g009
Table 1. Analysis of peaks in dQ/dV plots based on electrode chemistries of LCO + NMC532 cathode and Gr anode.
Peakd/eic/fb/ga/hj
Redox coupleC2②*A③-C2①*A②
C1③*A②
C1③*A①C2①*A①-
Redox couple-C2②*A②---C1②*A①
Table 2. Quantitative parameters derived from the AC impedance spectroscopy of the LCO + NMC532/Gr full cells at various SOC (state of charge) during charging.
Cycle Number (n)10% SOC CH40% SOC CH80% SOC CH
f1 (Hz)f2 (Hz)R2 (mΩ)f1 (Hz)f2 (Hz)R2 (mΩ)f1 (Hz)f2 (Hz)R2 (mΩ)
06.60.189.1NANANANANANA
10020.10.0924.128.00.349.0NANANA
20028.00.0537.128.00.1812.538.50.348.4
30028.00.0549.328.00.1814.538.50.349.5
40028.00.0559.428.00.1817.338.50.3411.2
50038.50.0285.428.00.0922.138.50.1816.3
60038.50.0294.428.00.0931.138.50.1818.7
70032.60.01170.028.00.0539.638.50.1821.0

