Adaptive Fuzzy Control for Power-Frequency Characteristic Regulation in High-RES Power Systems


Abstract
:1. Introduction
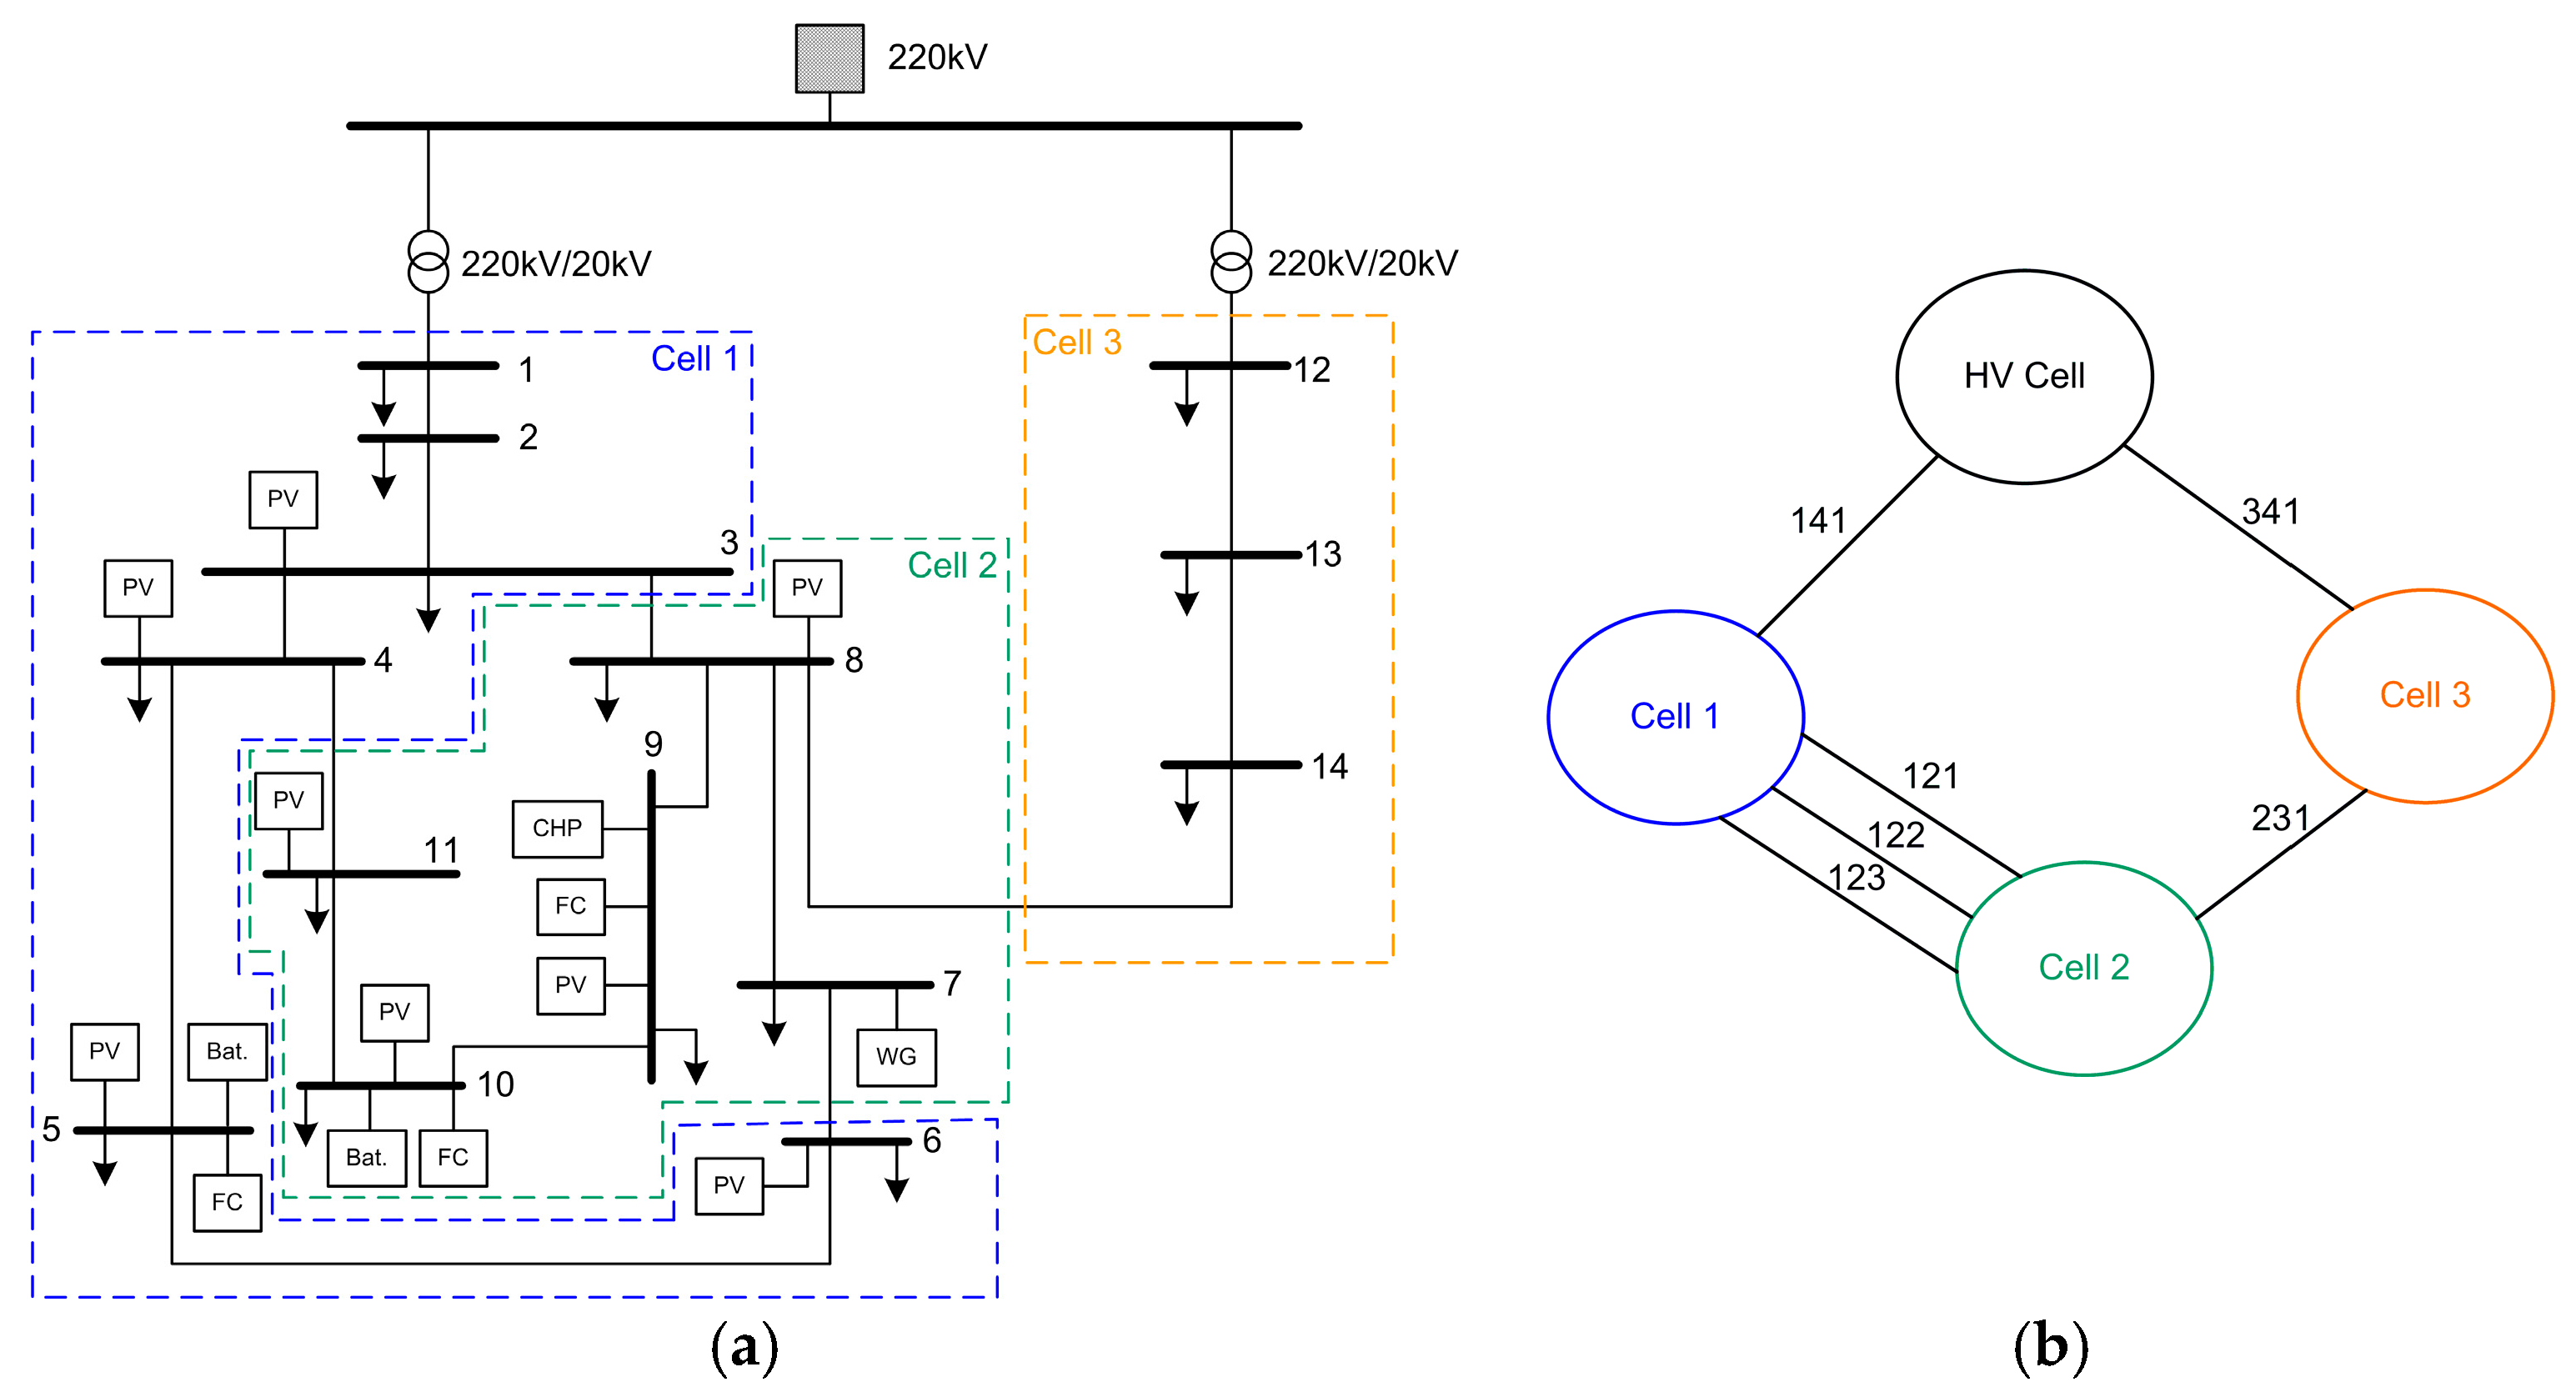
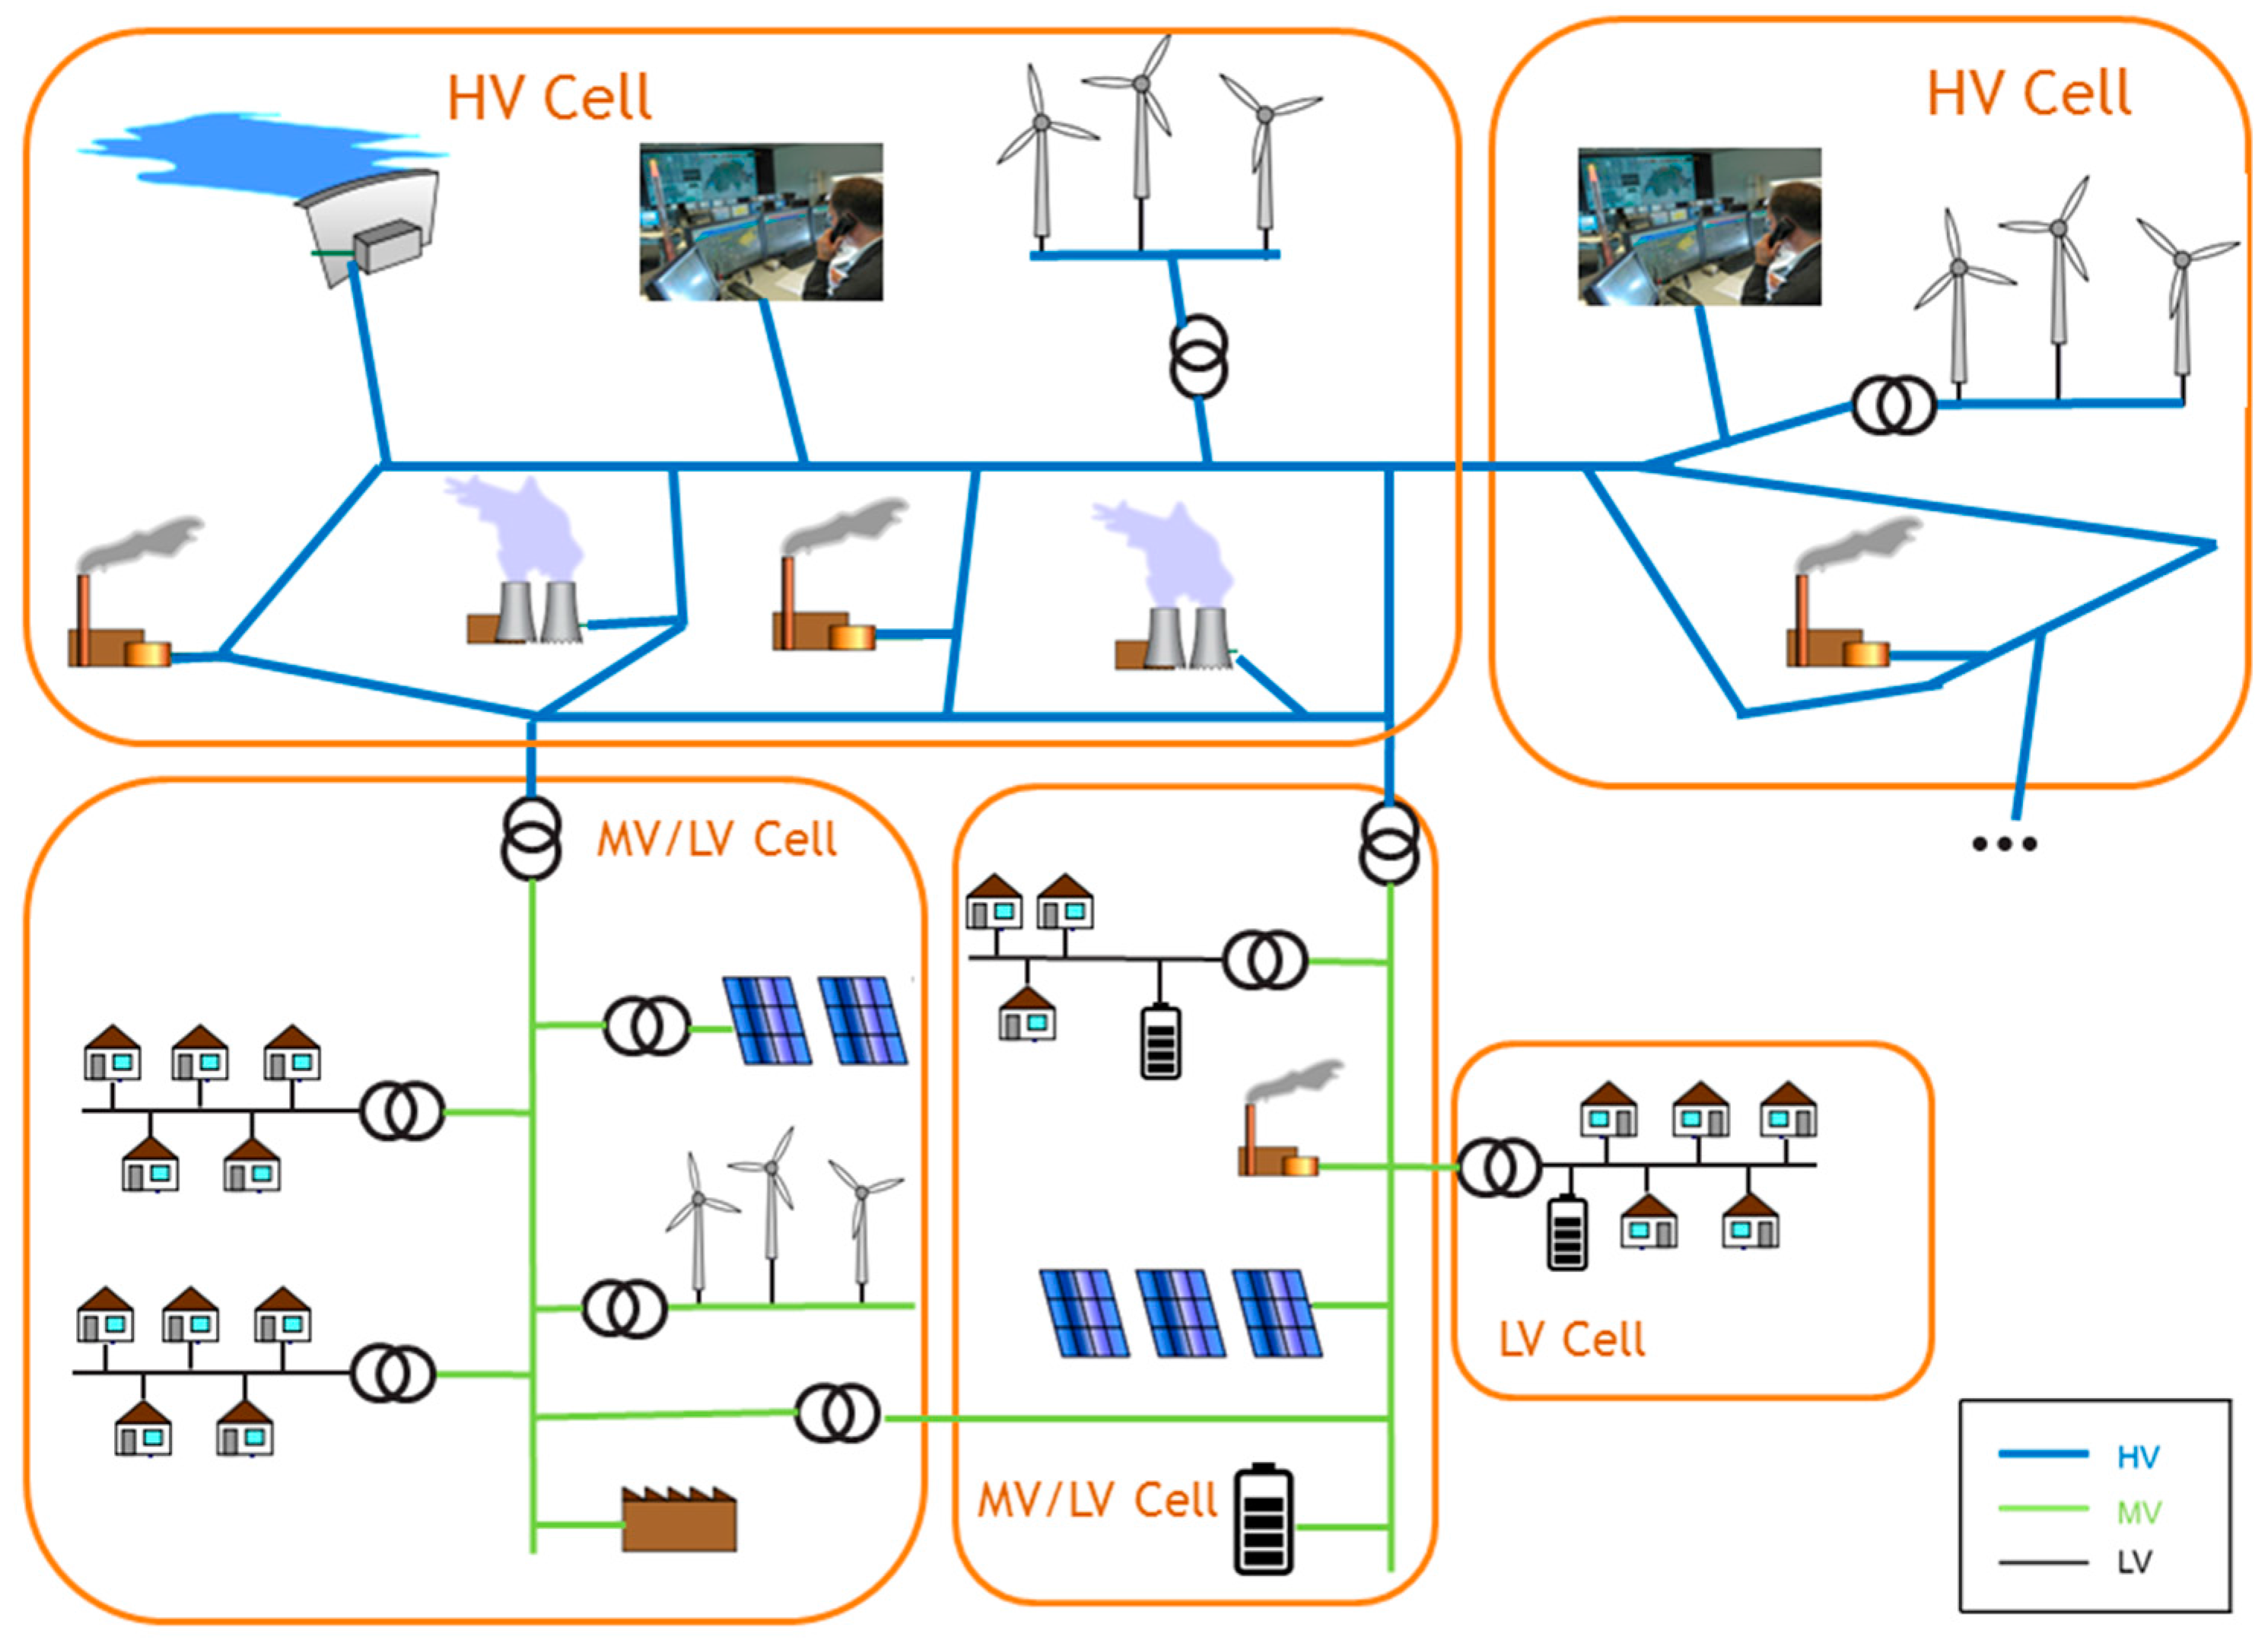
2. The “Cell” and “Web-of-Cells” Concepts
3. Proposed Adaptive Frequency Containment Control
3.1. Analysis of the Control Requirements
- The conventional approach of the NPFC specification presumes that all CAs, even remotely located, contribute proportionally to the incident. Even though this approach is effective for power systems with centralised power production at transmission level, in power systems with high degree of dispersion, where reserves can be located in LV grids far away from the area of imbalance, the LV distribution grids may experience sizeable changes in power flows. This can potentially lead to congestion, over/under voltages and increased power losses in the grid.
- If DER units such as photo voltaics (PVs) and wind generators (WGs) participate in the provision of FCC, they may be required to curtail their production based on remotely located incidents. Thus, this curtailment would lead to reduction of useful RES generation from areas not responsible for the imbalance incident.
- Operating frequency limits will most probably be reconsidered and relaxed so that operation would require less demanding frequency control and reduction in the corresponding containment reserves.
- Apart from their principal operating goal, DER can be used in multiple-purpose ancillary services provision, particularly the provision of virtual inertia as a primary requirement of future frequency control [10,11]. The fixed droop provision by these DER units in conjunction with the extra control strategies they provide may, under specific circumstances, lead to output saturation and incapacitation of the reserves.
- Mainly, local activation of primary reserves.
- Reduction in power losses, congestion, over/under voltage issues caused in other cells.
- Less conflicts in usage of resources, especially RES and DER used by other ancillary services controllers.
- Potential scheduling at cell level which leads to reduced computational burden and increased accuracy. This is due to the fact that the power frequency characteristic is determined at cell level based on the cell’s rating. The calculation of the NPFC at Synchronous Area level is then based on the energy yield of the cells and their contribution to the NPFC instead of considering all units individually.
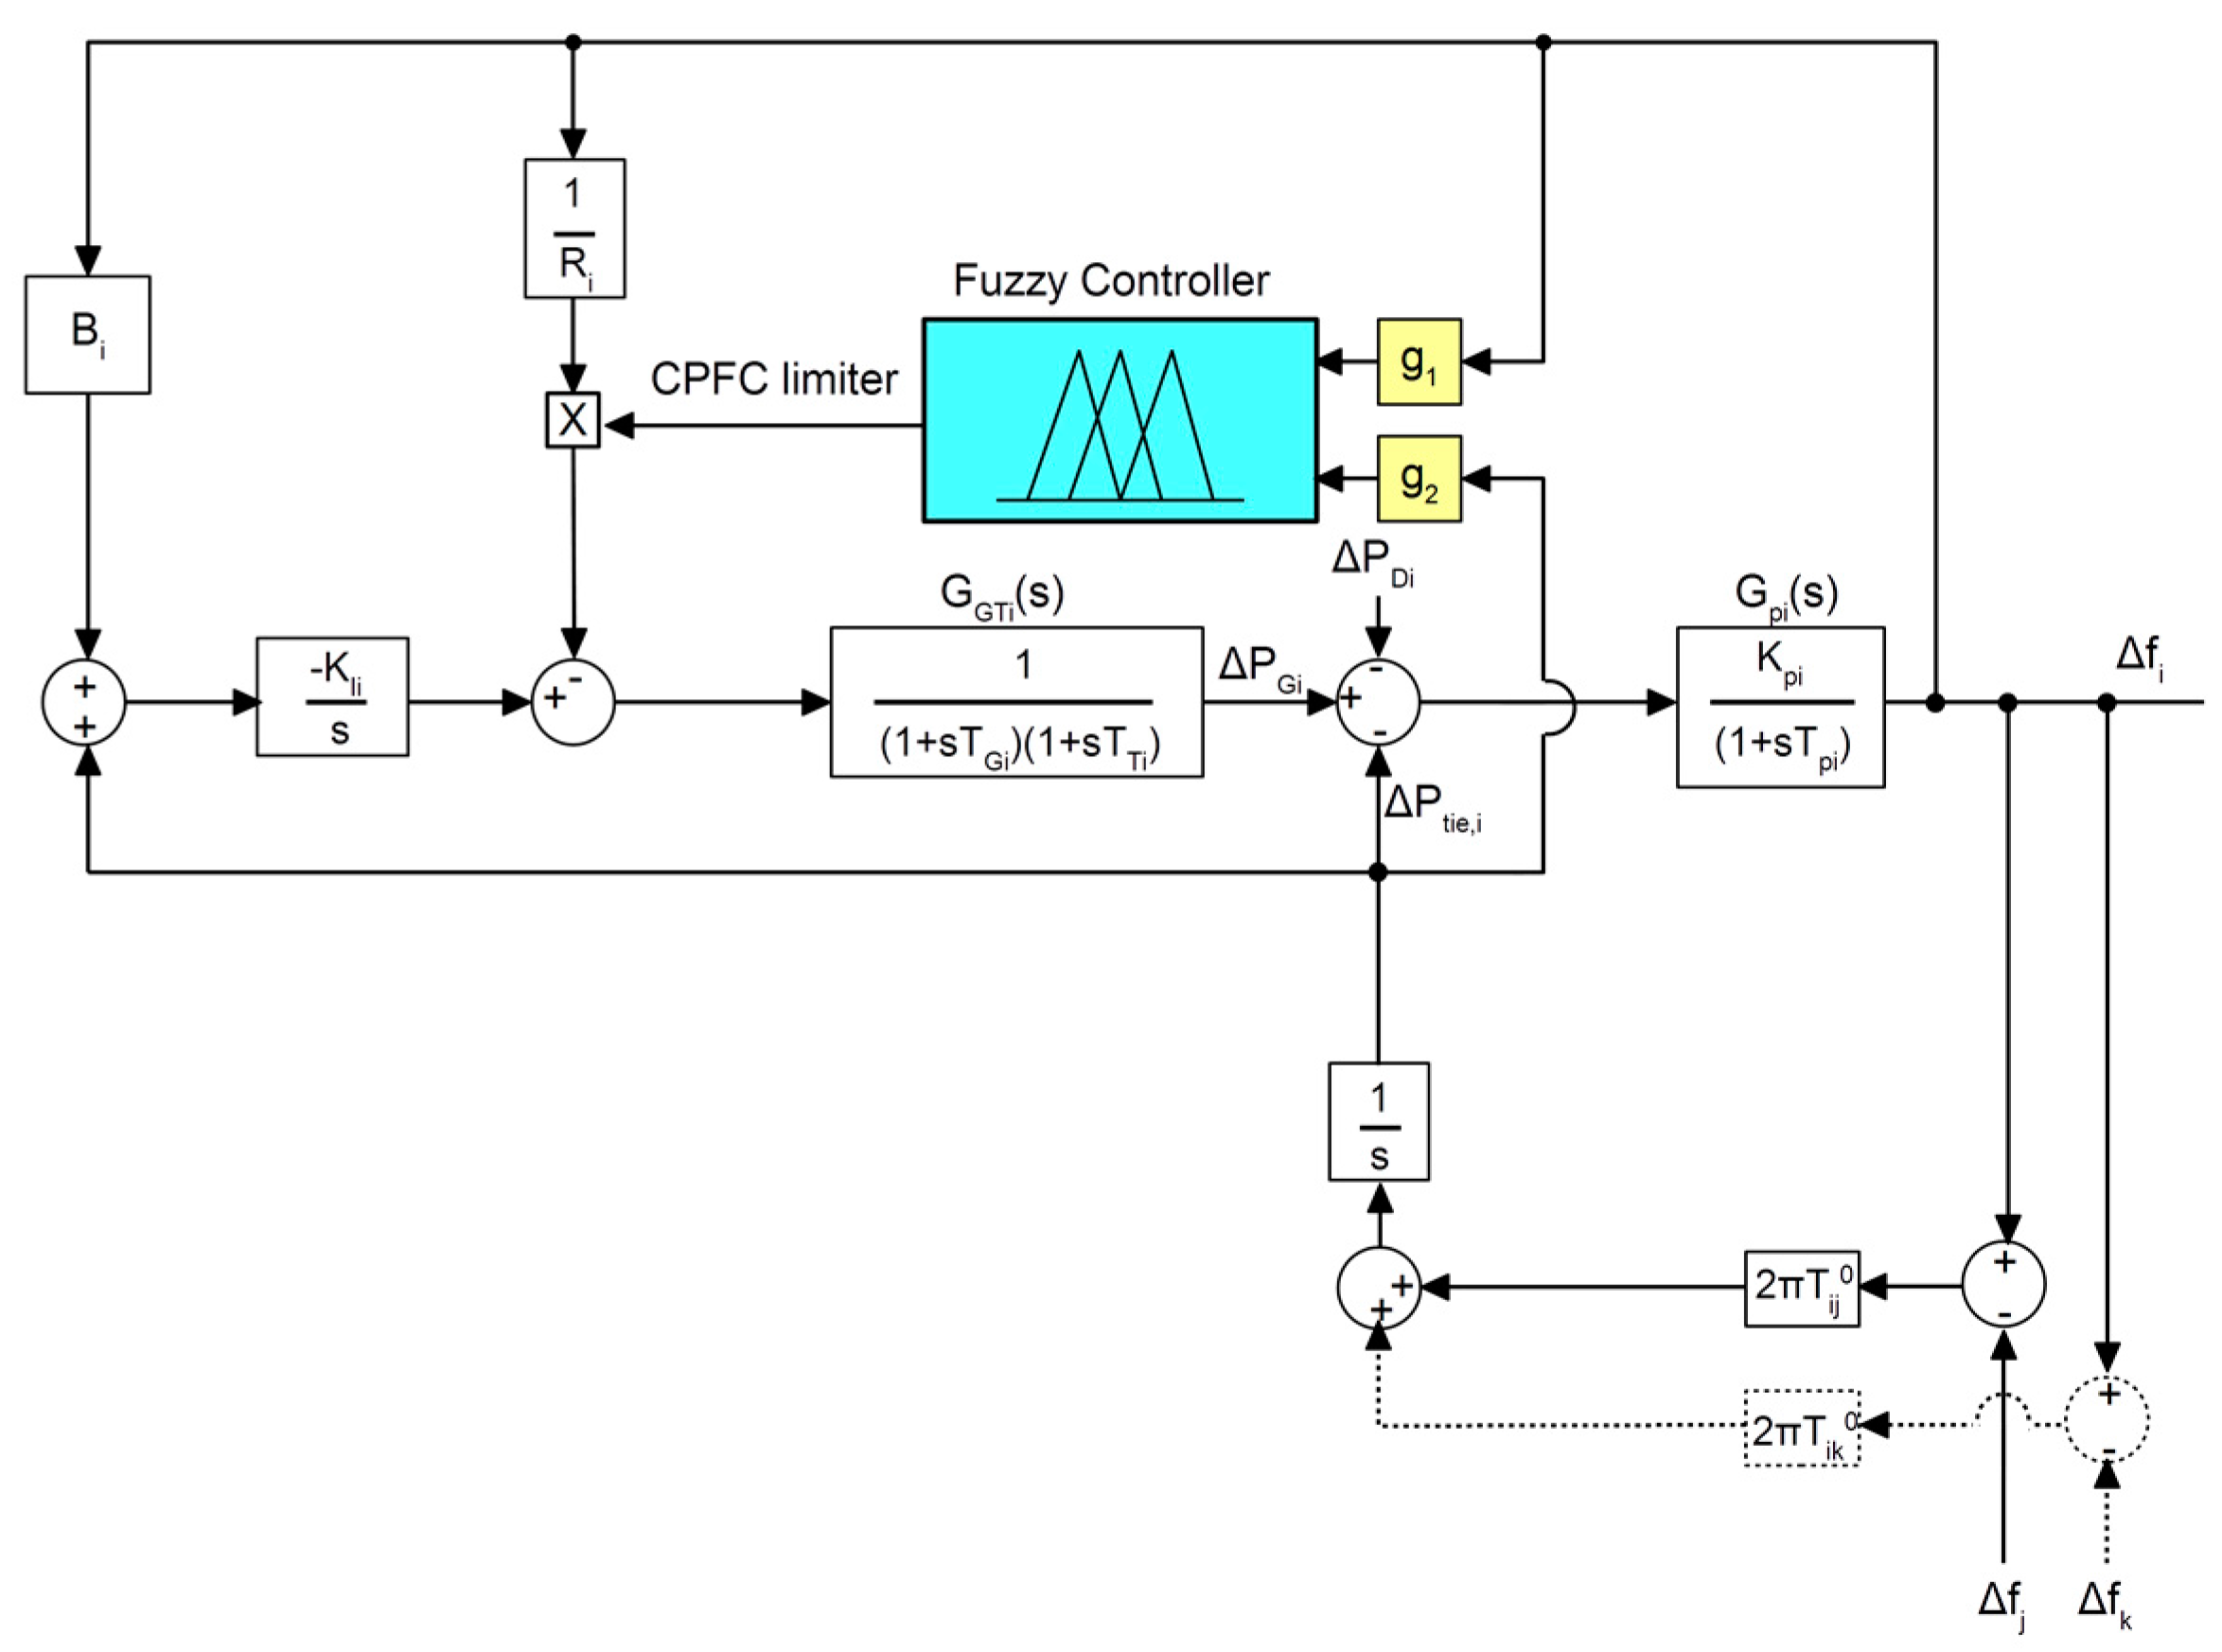
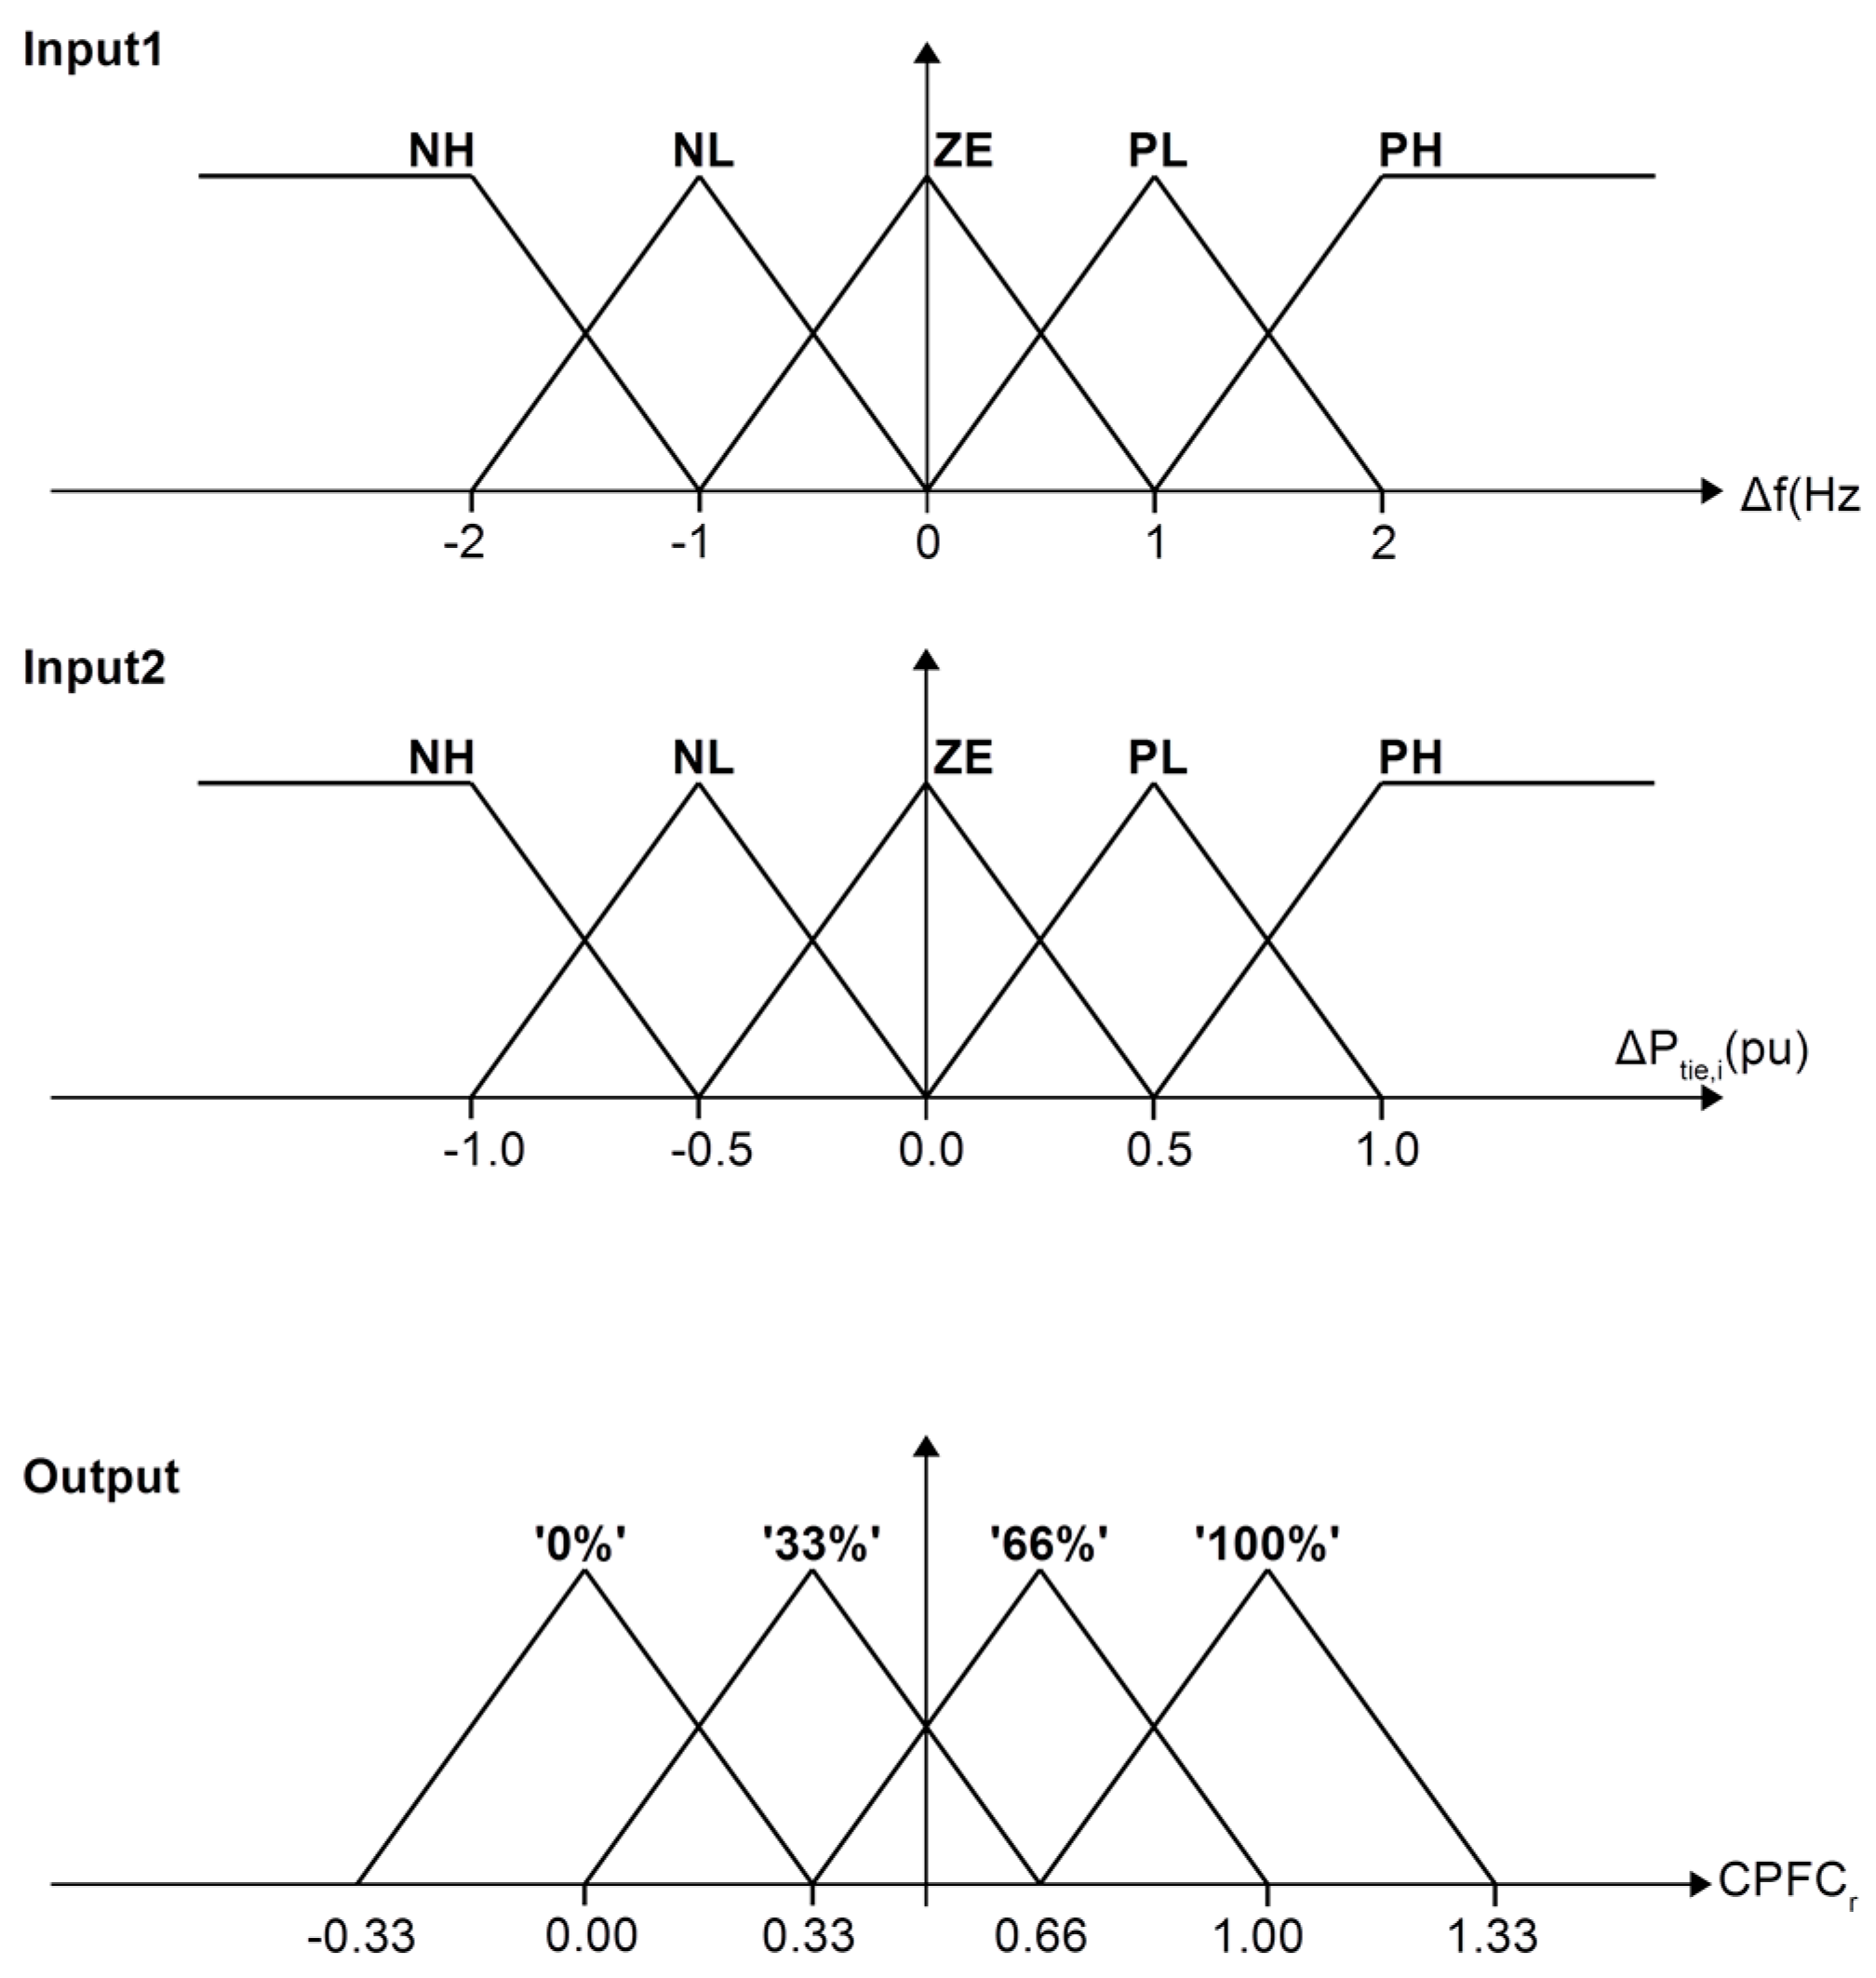
3.2. Fuzzy Logic Controller Selection and Design
4. Simulation Results
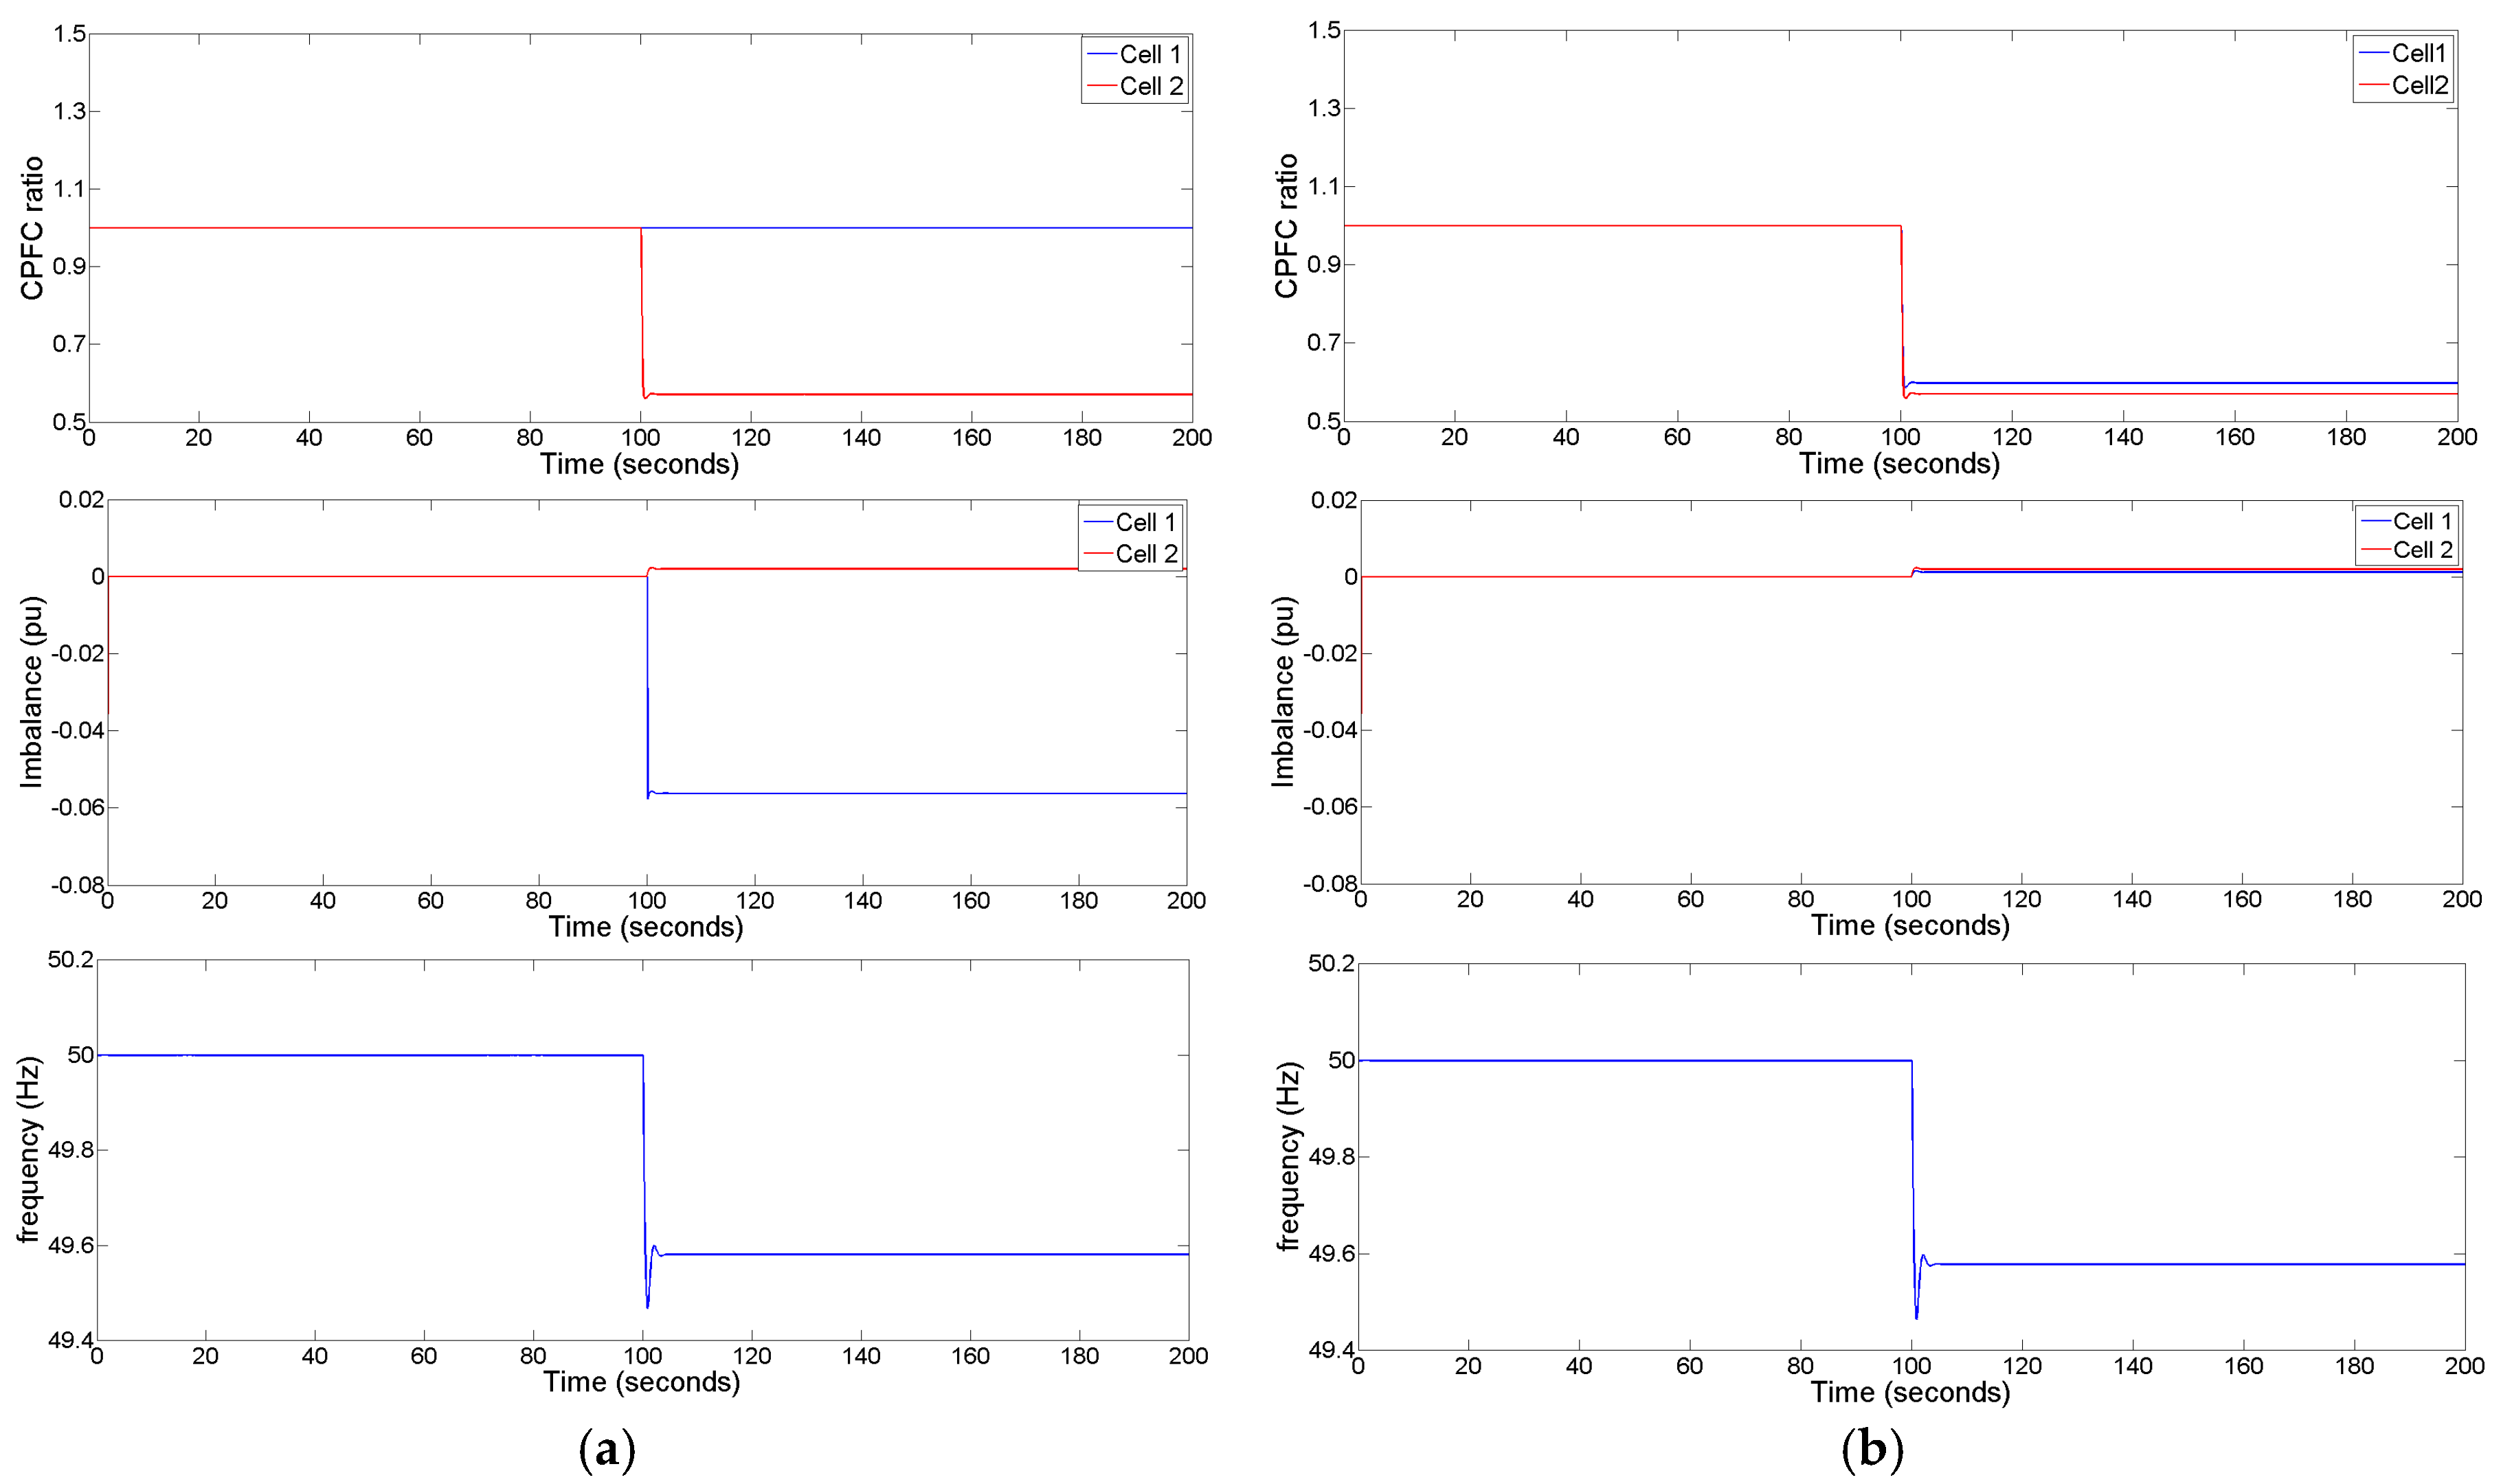
4.1. Scenario A: Short-Term Analysis
4.2. Scenario B: Long-Term Analysis
5. Conclusions
Acknowledgments
Author Contributions
Conflicts of Interest
References
- European Commission. Strategic Energy Technology (SET) Plan-Towards an Integrated Roadmap: Research and Innovation Challenges and Needs of the EU Energy System; European Commission: Rome, Italy, 2014; pp. 1–2. [Google Scholar]
- e-Highway 2050. Available online: www.e-highway2050.eu/e-highway2050/ (accessed on 20 October 2016).
- ENTSO-E. 10 Year Network Development Plan 2014; ENTSO-E: Brussels, Belgium, 2014; pp. 6–16. Available online: https://www.entsoe.eu/major-projects/ten-year-network-development-plan/tyndp 2014/Documents/TYNDP%202014_FINAL.pdf (accessed on 8 May 2017).
- D’hulst, R.; Fernández, J.M.; Rikos, E.; Kolodziej, D.; Heussen, K.; Geibel, D.; Temiz, A.; Caerts, C. Voltage and Frequency Control for Future Power Systems: The ELECTRA IRP Proposal. In Proceedings of the International Symposium on Smart Electric Distribution Systems and Technologies (EDST 2015), Vienna, Austria, 8–11 September 2015; pp. 1–6. [Google Scholar]
- Martin-Martínez, F.; Sánchez-Miralles, A.; Rivier, M. A literature review of Microgrids: A functional layer based classification. Renew. Sustain. Energy Rev. 2016, 62, 1133–1153. [Google Scholar] [CrossRef]
- Su, W.; Wang, J. Energy Management Systems in Microgrid Operations. Electr. J. 2012, 25, 45–60. [Google Scholar] [CrossRef]
- Hatziargyriou, N. Microgrids: Architectures and Control; Wiley/IEEE Press: London, UK, 2014. [Google Scholar]
- Parhizi, S.; Lotfi, H.; Khodaei, A.; Bahramirad, S. State of the Art in Research on Microgrids: A Review. IEEE Access 2015, 3, 890–925. [Google Scholar] [CrossRef]
- ENTSO-E. Continental Europe Operation Handbook- Appendix 1, Load Frequency Control and Performance; ENTSO-E: Brussels, Belgium, 2004; pp. 1–9. Available online: https://www.entsoe.eu/publications/system-operations-reports/operation-handbook/Pages/default.aspx (accessed on 8 May 2017).
- Vogler-Finck, P.J.C.; Früh, W.-G. Evolution of primary frequency control requirements in Great Britain with increasing wind generation. Electr. Power Energy Syst. 2015, 73, 377–388. [Google Scholar] [CrossRef]
- Teng, F.; Mub, Y.; Jia, H.; Wuc, J.; Zeng, P.; Strbac, G. Challenges on primary frequency control and potential solution from EVs in the future GB electricity system. Appl. Energy 2017, 194, 353–362. [Google Scholar] [CrossRef]
- Oureilidis, K.; Demoulias, Ch. A decentralized impedance-based adaptive droop method for power loss reduction in a converter-dominated islanded microgrid. Sustain. Energy Grids Netw. 2016, 5, 39–49. [Google Scholar] [CrossRef]
- Chaudhuri, N.R.; Chaudhuri, B. Adaptive Droop Control for Effective Power Sharing in Multi-Terminal DC (MTDC) Grids. IEEE Trans. Power Syst. 2013, 28, 21–29. [Google Scholar] [CrossRef]
- Marzbanda, M.; Moghaddamb, M.M.; Akoredec, M.F.; Khomeyranib, G. Adaptive load shedding scheme for frequency stability enhancement in microgrids. Electr. Power Syst. Res. 2016, 140, 78–86. [Google Scholar] [CrossRef]
- Liu, H.; Hu, Z.; Song, Y.; Lin, J. Decentralized Vehicle-to-Grid Control for Primary Frequency Regulation Considering Charging Demands. IEEE Trans. Power Syst. 2013, 28, 3480–3489. [Google Scholar] [CrossRef]
- Amin Ghasemi, M.; Parniani, M. Prevention of distribution network overvoltage by adaptive droop-based active and reactive power control of PV systems. Electr. Power Syst. Res. 2016, 133, 313–327. [Google Scholar] [CrossRef]
- Hoseinzadeh, B.; Faria da Silva, F.M.; Bak, C.L. Adaptive Tuning of Frequency Thresholds Using Voltage Drop Data in Decentralized Load Shedding. IEEE Trans. Power Syst. 2015, 30, 2055–2062. [Google Scholar] [CrossRef]
- Ahmadi, S.; Shokoohi, S.; Bevrani, H. A fuzzy logic-based droop control for simultaneous voltage and frequency regulation in an AC microgrid. Electr. Power Energy Syst. 2015, 64, 148–155. [Google Scholar] [CrossRef]
- Mai Ersdal, A.; Imsland, L.; Uhlen, K.; Fabozzi, D.; Thornhill, N.F. Model predictive load—Frequency control taking into account imbalance uncertainty. Control. Eng. Pract. 2016, 53, 139–150. [Google Scholar] [CrossRef]
- Hota, P.K.; Mohanty, B. Automatic generation control of multi-source power generation under deregulated environment. Electr. Power Energy Syst. 2016, 75, 205–214. [Google Scholar] [CrossRef]
- Papadimitriou, C.; Vovos, N. A Fuzzy Control Scheme for Integration of DGs into a Microgrid. In Proceedings of the 15th IEEE Mediterranean Electrotechnical Conference Melecon, Valletta, Malta, 26–28 April 2010; pp. 872–877. [Google Scholar]
- CIGRE. Benchmark Systems for Network Integration of Renewable and Distributed Energy Resources; CIGRE Task Force C6.04.02; CIGRE: Paris, France, 2009. [Google Scholar]


| Symbol | Description |
|---|---|
| Hi | Inertia constant in [s] |
| Di | Load self-regulation in [pu/Hz] |
| Kpi | Area’s constant in [Hz/pu] |
| Tpi | Area’s time constant [s] |
| Gpi(s) | Transfer function of cell i |
| Tij | Tie-line static limit [pu/rad] |
| Ri | Droop slope in [Hz/pu] |
| Bi | Frequency bias [pu/Hz] |
| TGi | Governor’s time constant in [s] |
| TTi | Turbine’s time constant in [s] |
| GGTi(s) | Transfer function of the combined governor-turbine system in cell i |
| KIi | Integrator’s gain |
| g1, g2 | Fuzzy controller input gains for frequency and tie-line power errors |
| Δfi, Δfj, Δfk | Frequency error in cells i, j and k respectively |
| ΔPtie,i | Tie-line power error in cell i |
| ΔPGi, ΔPDi | Deviation of generation and demand in cell i |
| Δfi | NH | NL | ZE | PL | PH | |
|---|---|---|---|---|---|---|
| ΔPtie,i | ||||||
| NH | 0% | 33% | 100% | 100% | 100% | |
| NL | 33% | 66% | 100% | 100% | 100% | |
| ZE | 66% | 100% | 100% | 100% | 66% | |
| PL | 100% | 100% | 100% | 66% | 33% | |
| PH | 100% | 100% | 100% | 33% | 0% | |
| Parameter | Value |
|---|---|
| H | 5 s |
| D | 0.01 pu/Hz |
| Kp | 100 Hz/pu |
| Tp | 20 s |
| B | 1 pu/Hz |
| TG | 0.008 s |
| TT | 0.03 s |
| KI | 0.01 |
| Function | With Adaptive FCC | With Fixed Droop |
|---|---|---|
| ABS (Reduction) | 8.59 × 10⁷ (Ws) (−19.7%) | 1.07 × 10⁸ (Ws) |
| Cost | 6.94 × 10¹² (W2s) | 9.46 × 10¹² (W2s) |
| (Reduction) | (−26.7%) | - |
| RES | With Adaptive FCC | With Fixed Droop |
|---|---|---|
| Wind Generation (Reduction) | 1.24 × 10⁸ (Ws) (−18.0%) | 1.51 × 10⁸ (Ws) |
| Photovoltaic Generation | 8.97 × 10⁶ (Ws) | 9.56 × 10⁶ (Ws) |
| (Reduction) | (−6.2%) | - |
© 2017 by the authors. Licensee MDPI, Basel, Switzerland. This article is an open access article distributed under the terms and conditions of the Creative Commons Attribution (CC BY) license (http://creativecommons.org/licenses/by/4.0/).
Share and Cite
Rikos, E.; Caerts, C.; Cabiati, M.; Syed, M.; Burt, G. Adaptive Fuzzy Control for Power-Frequency Characteristic Regulation in High-RES Power Systems. Energies 2017, 10, 982. https://doi.org/10.3390/en10070982
Rikos E, Caerts C, Cabiati M, Syed M, Burt G. Adaptive Fuzzy Control for Power-Frequency Characteristic Regulation in High-RES Power Systems. Energies. 2017; 10(7):982. https://doi.org/10.3390/en10070982
Chicago/Turabian StyleRikos, Evangelos, Chris Caerts, Mattia Cabiati, Mazheruddin Syed, and Graeme Burt. 2017. "Adaptive Fuzzy Control for Power-Frequency Characteristic Regulation in High-RES Power Systems" Energies 10, no. 7: 982. https://doi.org/10.3390/en10070982
APA StyleRikos, E., Caerts, C., Cabiati, M., Syed, M., & Burt, G. (2017). Adaptive Fuzzy Control for Power-Frequency Characteristic Regulation in High-RES Power Systems. Energies, 10(7), 982. https://doi.org/10.3390/en10070982