1. Introduction
Residential and commercial buildings are estimated to contribute approximately 40% of the final energy use and cause approximately 36% of the greenhouse gas emissions within the European Union (EU) [
1]. In 2010 the EU adopted the Europe 2020 strategy where one of five headline targets covers climate change and energy sustainability. The Europe 2020 strategy was followed in 2014 by the 2030 resolution framework for climate and energy policies. The resolution aims to make the EU’s economy and energy system more competitive, secure, and sustainable [
2]. To reduce the energy use in the growing building sector, in 2002 the EU implemented the Energy Performance of Buildings Directive, which was amended in 2010 [
3]. The Energy Performance of Buildings Directive and the 2012 Energy Efficiency Directive [
4] are the EU’s main legislation when it comes to reducing energy use in buildings.
The main objectives in the Energy Performance of Buildings Directive is to promote the improvement of the energy performance of buildings within the EU, taking into account outdoor climate and local conditions, as well as indoor climate requirements and cost-effectiveness. Within the directive, member states shall ensure that new buildings must be nearly zero energy buildings (NZEBs) by the end of 2020, with an exception for new public buildings, which must be NZEBs by the end of 2018. The member states should also develop policies and creative incentives to refurbish buildings that fulfill the requirements of NZEBs. Each individual member state should decide the definition of NZEBs, but the energy performance of buildings should be calculated on the basis of a methodology, which may be differentiated at national and regional level, but should take into account existing European standards. The definition of NZEBs should also include a numerical indicator of primary energy use expressed in kWh/m
2 per year [
3]. A majority of the member states in the EU have implemented or are developing a numerical indicator for primary energy use [
5]. The REHVA Task Force “Nearly Zero Energy Buildings” has published a comprehensive definition of NZEBs where the primary energy indicator sums up all delivered and exported energy and compensate with national primary energy factors [
6]. For the Nordic member states (Sweden, Denmark and Finland), where the climate, building types/construction and energy systems are similar, the calculation method basically follows the method presented by the Federation of European Heating, Ventilation and Air Conditioning Associations (REHVA), with some differences [
7,
8,
9].
Energy efficiency building codes and other efforts to reduce the use of energy in buildings were almost nonexistent before the first “oil crisis” in 1973 [
10]. Since then, many definitions such as “low energy”, “net energy”, “passive”, and “plus energy houses” have been developed together with definitions like “zero carbon” and “carbon neutral buildings” [
11]. The definitions can have different meanings in different regions and countries and can be adopted differently in building codes and policies. This has led to market confusion, so targeted definitions need to be clearly formulated and used consistently. This is probably one of the reasons for slow development towards a common NZEB concept within the EU where construction practices and procedures are implemented, especially when buildings are refurbished [
12].
In early 2014 the Swedish government instructed the Swedish National Board of Housing, Building, and Planning to propose a reasonable definition of NZEBs and introduce it in the Swedish building code (“BBR”) [
8]. The work with the definition has struggled and in January 2017 a second proposal was delivered to the Swedish Government [
13].
There is a growing interest in Sweden for sustainable building assessment/certification schemes. The three most common certification schemes in Sweden are Miljöbyggnad (a Swedish certification scheme), GreenBuilding, and Leadership in Energy and Environmental Design (LEED). Miljöbyggnad is the dominant scheme [
14,
15].
In Miljöbyggnad, the specific energy use (kWh/m2, year) of delivered energy to the building is expressed as an energy efficiency value. The energy efficiency value is directly related to the former national building code and its calculation of the energy efficiency value, but with higher demands for energy efficiency. There is an ongoing process to adjust Miljöbyggnad to the latest version of the Swedish building code and its implementation of NZEBs.
Sweden has a rather cold climate, which means that the use of energy for most buildings is strongly connected to the outdoor temperature. Buildings contribute almost 40% of the energy use in Sweden. When the DH market shares of total national residential and service sector heat markets are compared, Sweden has the highest share followed by Denmark and Finland. All three countries have a market share above 50% [
16]. For multi-dwelling buildings in Sweden, DH delivers approximately 92% of the heat demand [
17].
The market share for DH in buildings within the EU is 13%. The heat market for buildings is dominated by onsite boilers using fossil fuels [
16]. This presents an opportunity to increase the use of DH in urban areas with high heat density. If biofuels or other heat sources/fuels with low CO
2 emissions are used, DH has a potential to be a technology for a cost-effective de-carbonization of the energy system in the EU [
18].
The production units that cover the base load in a district heating system (DHS) are characterized by a long utilization time and, in Sweden, are often based on combined heat and power (CHP) plants that use biofuels or domestic waste as energy source and/or waste heat from local industries [
19]. Peak load plants have short utilization time and commonly use fossil fuels [
19].
Electricity is distributed at the regional and national level by power transmission networks. The local distribution network connects buildings and other users of electricity to the power transmission network. The national power transmission network is connected to nearby countries and Sweden has high-voltage connections with Norway, Finland, Denmark, Germany, Poland, and Lithuania. Therefore, the system boundaries for the electricity market are not limited to local or national levels and changes in use of electricity in Sweden will affect the power systems in other countries. The evaluation of the impact on global CO
2 emissions from changes in electricity use or production locally or nationally is difficult to evaluate and several accounting methods are used [
20,
21].
Distributed energy generation (DEG) systems are the opposite of centralized generation systems, such as large power plants. DEG systems can be, for example, small-sized wind turbines or micro-CHP plants installed at, or near, a multi-dwelling building. The most common DEG systems for multi-dwelling building owners are solar photovoltaic (PV) systems [
22].
3. Method
3.1. Primary Energy and Primary Energy Factors
Primary energy (PE) is energy that is either extracted or captured directly from natural resources and not transformed. Examples of primary energy sources are crude oil, natural gas, unprocessed wood and heat, or electricity directly produced by sunlight or wind. To calculate the use of PE, primary energy factors (PEFs) are used. The PEFs are defined as the ratio between primary energy use and final energy use. According to the Energy Performance of Buildings Directive, the energy performance should be calculated on the basis of a methodology, which may be differentiated at national and regional levels, but should take into account existing European standards [
12,
23]. The numerical values of PEFs will affect the evaluation of the energy performance of buildings substantially and it is important that the PEFs are chosen carefully [
23].
3.2. Swedish Proposal for Nearly Zero Energy Buildings
In January 2017 the Swedish National Board of Housing delivered a proposal for a definition of NZEBs. The proposal sets several building-related limits, i.e., a maximum mean heat transfer coefficient of buildings, a maximum installed electric heat power and a method to calculate the PE number. This article focuses on the PE number and the PE number is expressed in Equation (1). Delivered energy to the building is used in the calculation of the PE number.
where:
PE number = Primary energy number (kWhprimary energy/m2, year)
Eheat,el = Electricity used for space heating (kWh/year)
Ecool,el = Electricity used for cooling (kWh/year)
EDHW,el = Electricity used for domestic hot water (kWh/year)
Eop,el = Electricity used for operation of the building (kWh/year)
Eheat = Energy carriers other than electricity used for space heating (kWh/year)
Ecool = Energy carriers other than electricity used for cooling (kWh/year)
EDHW = Energy carriers other than electricity used for domestic hot water (kWh/year)
Fgeo = Geographic correction factor (between 0.9 and 1.6)
PEel = Primary energy factor for electricity (kWhprimary energy/kWhel)
PErem = Primary energy factor for energy carriers other than electricity (kWhprimary energy/kWhheat or fuel)
Atemp = Heated floor area of building (heated to more than 10 °C) (m2)
The PEFs for electricity used in the Swedish proposal for NZEBs are set to 1.6 until the end of 2020 and to 2.5 from 2021 and on. The PE used to produce electricity is assumed to be lower in Europe and Sweden in the future [
23,
24,
25]. The PEF of 1.6 in the Swedish proposal for NZEBs can be considered to be a politically-set factor to harmonize with existing building regulations/standards. The PEF of 2.5 harmonizes with the default value of the PEF for saving electricity according to Annex IV in the Energy Efficiency Directive. It is based on an energy conversion efficiency of 40% from fuel to electricity [
4,
25]. The PEF for other energy carriers than electricity, the PE
rem factor, is set by the Swedish National board of Housing to PEF = 1. This means that the PEF value of DH supplied to a building has the value 1 independent of the system fuel mix. This has to be questioned because it means that waste heat from industries and heat from CHP plants will receive the same PEF value as oil used for heating. The purpose of our analysis is to investigate the impact on the building’s estimated energy performance by the Board of Housings choice of PEF values. The selected PEF values are critically reviewed in
Section 5 and
Section 6.
The Fgeo factor range is between 0.9 and 1.6 and the intention is to compensate for the outdoor climate (outdoor temperature) in different regions of Sweden. The simulated building is located in Eskilstuna in Central Sweden, and Fgeo = 1.0 is used. A DEG system that produces thermal energy only affects the heat demand and is not affected by the factor PEel. Produced heat not used instantly is commonly stored, e.g., in a heat storage tank, to be used when demand occurs. Electricity produced by DEG systems affects the PE number if the electricity is used inside the building. Exported electricity to the grid does not affect the PE number. This means that if a heat pump system is used for space heating and for heating domestic hot water, the internal use of electricity in the building is increased. This leads to a larger share of the electricity produced by the PV system being used for operation of the heat pump, instead of being exported to the grid, and the PE number will decrease.
3.3. Simulations
All simulations have been performed in the transient simulation program Trnsys (Madison, WI, USA) [
26]. Trnsys is widely used, known and validated within the research community and is an equation-based program. The Trnsys model consists of a number of connected types where the output from one type is used as the input for the next type. All types are solved in sequence until the user-specified tolerance for the model is achieved.
The current model is based on a model developed in [
27] and modified and enhanced in [
28]. It has been modified further for this article. The main heating sources used in the simulations are DH, an exhaust air heat pump (EAHP), and a ground source heat pump (GSHP).
Both the PV and the solar thermal (ST) system face south and are tilted 45°, which is close to the optimal tilt for Eskilstuna. The GSHP is controlled based on the ambient temperature. A linear heating curve decides which supply temperature the heat pumps should supply to the hydronic system at every specific ambient temperature. DHW is prioritized, which means that even if there is a heating demand at the same time as a DHW demand the heat pump produces DHW. The set temperature for the DHW is 55 °C and the DHW tank is heated to 65 °C every week in order to limit the risk of legionella growth. The rated heating capacity used in the simulations is 192 kW. The ventilation flow in the building is 0.5 L/s, m2, floor area, and this is used in the simulations.
The ST system is connected to the lower part of a 5 m3 heat storage tank in all the simulation model alternatives and also to the borehole in the simulation model with the GSHP. The main heat source is connected to the top of the heat storage tank in all simulations and directly to the hydronic system, the floor heating system, in the heat pump models in order to achieve as low supply temperatures as possible.
In all simulation models except the one with GSHP in combination with an ST system, the ST system only supplies heat to the heat storage tank. In the GSHP and ST system combination, the ST system also supplies heat to the borehole when the storage tank is fully charged or the temperature of the solar collector is lower than the temperature in the storage tank, but higher than the borehole temperature. The main heating sources are sized in order to meet the building demand for domestic hot water and its space heat demand. The different combinations of DEG systems and main heat source are presented in
Table 1. This table is a modified version of a table that appears in [
29].
3.4. Reference Building
The building used in this article is located in the Swedish city of Eskilstuna in Central Sweden, and is based on an actual deeply-renovated building. It has a heated area of 3331 m
2 and consists of 24 apartments. The U-value for the different building components is presented in
Table 2 [
29].
All simulations have a three-minute time step and the data has been compiled on an hourly basis. The annual heating demand and domestic hot water demand of the building is 180 MWh which corresponds to a specific heat demand for the building of 54.0 kWh/m2, year. When the heat pumps cannot supply the entire heat demand, electricity is used in an immersion heater to cover the peak demand. The seasonal coefficient of performance (SCOP) obtained in the simulations for the heat pump systems without supplementary DEG systems are 2.7 for the EAHP and 4.1 for the GSHP. When the PE number is calculated, the PV system sizes varies up to 50 kWp and the ST system sizes up to almost 200 m2. For the CO2 emission evaluations, a PV system of 25 kWp and a 100 m2 ST system are used in the simulation. PV modules of 1 kWp, or 4 m2 solar thermal collectors per apartment, can be considered as standard system sizes in Sweden.
3.5. Evaluation of Changes in Global CO2 Emissions
The change in global CO
2 emissions due to changes in use or production of electricity is evaluated with three different accounting methods. The first method uses the composition of the mean electricity mix in the EU for 2014 (EUEM). The second and third methods assume that all changes in the use of electricity affect the marginal production unit. This means that the most expensive source of electricity production within the electricity cross-trading region is decreased when the power demand decreases. The marginal electricity approach is compared for both the short-term marginal production unit, coal condensing power (CC), and long-term marginal production unit, natural gas combined cycle condensing power (NGCC) [
20,
21].
The evaluation of changes in global CO
2 emissions when the use of heat is delivered by DHS is evaluated by assuming different “standard” DHS compositions. Many factors influence the composition of different heat production units such as availability of different fuels locally, industrial waste heat, etc. A DHS is a dynamic system and the fuel price affects the merit order for the different production units, but many DHS also produce electricity in CHP plants, and then the electricity spot price also affects the merit order of the production units. The users of heat also involve their habitual or industrial schedules in the system optimization due, for example, to the peaks of domestic hot water use in the mornings and afternoons. In this article, a static DHS is assumed where the different production units are divided into a base load, an intermediate load and a peak load, where the two duration time limits between the production units are set by the outdoor temperature. This method allows for analysis of different types of DHS in an easy, but fairly accurate, way [
30,
31].
In cold countries, the base load commonly covers the heat demand during summer which can be substantially lower than during the winter months. During the coldest days, the peak demand can be considerable and DHS in cold countries usually have a boiler with a short utilization time for peak loads. Common duration time limits for base load and peak load are 6000 and 1000 h, respectively [
32]. This means that the peak production unit is in use for 1000 h/year and that the base load duration time at peak load is 6000 h. When considering different incentives, targets and visions by the EU and its member states, the use of fossil fuels will decrease and the use of CHP plans will increase [
33,
34]. This will probably lead to a decrease in the duration time limits for both the peak and base load plants to reduce the use of fossil fuels for peak demands and increase electricity production from CHP plants using low CO
2 emission fuels. For the investigated town Eskilstuna, the crossover temperature between the base load and the intermediate load is +5 °C and the crossover temperature between the intermediate load and the peak load is −5 °C [
34,
35]. This corresponds to an approximate annual duration time limit for the base load of 4000 h and an approximate annual duration time limit for the peak load of 900 h [
35]. A load duration diagram for Eskilstuna is presented in
Figure 1 where the duration time limits are shown.
The different configurations for the DHS are presented in
Table 3. The production units are both CHP plants and heat-only boilers (HOB). The CHP plants are assumed to produce electricity with a constant power to heat ratio of 0.25 when the fuel is solid waste and 0.35 when other fuels are used. The plant efficiency when fossil fuels are used is assumed to be 0.9, and 0.8 when solid waste is used [
29]. In
Table 4 is the CO
2 emission factors presented for the different allocation methods for changes in use/production of electricity and the emission factors for the different fuels used in the DHS [
1,
36,
37,
38]. The CO
2 emission for solid waste derives from the fossil part of the waste [
39]. This means that the alternative use of this fraction of the waste is recycling. The recommended value used in the calculations is controversial but recommended by reference [
39] and commonly used in Sweden.
Note that when the changes in global CO2 emissions are evaluated, all electricity produced by the PV system has an impact, but when the PE number is calculated, only electricity used within the building boundaries is counted.
4. Results
4.1. The PE Number for Different Heating Systems with Solar PV or Solar Thermal Systems
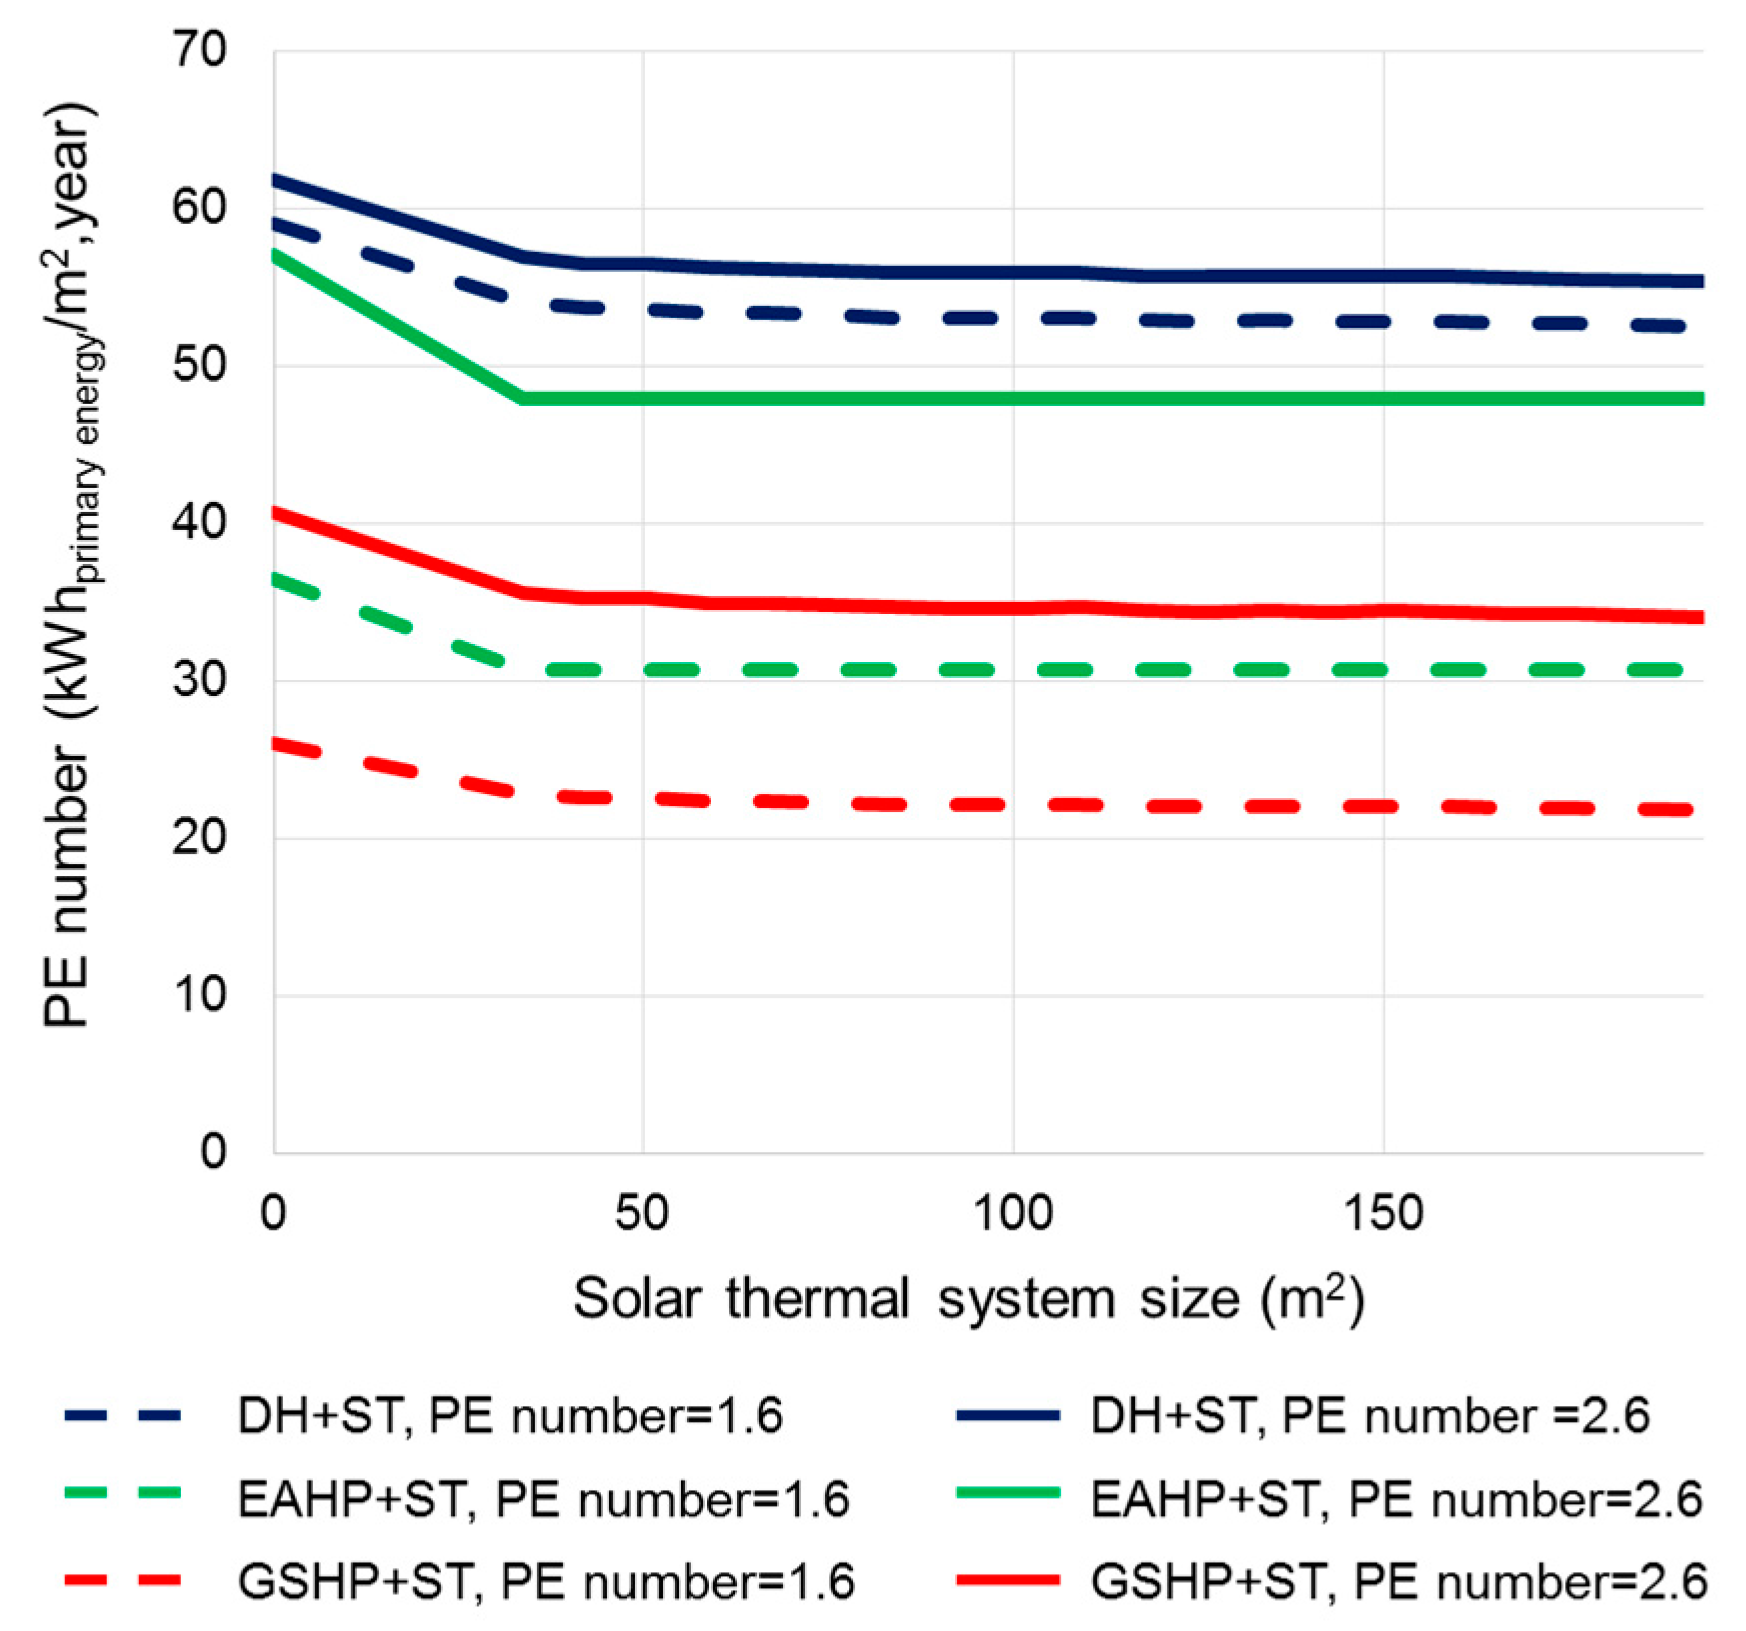
The calculated PE numbers for the investigated building heated with DH, a GSHP and an EAHP, together with different sizes of ST systems, are presented in
Figure 2. The results are given for values of the PE factors of 1.6 and 2.5. The corresponding PE numbers of the heating systems in combination with PV systems are shown in
Figure 3. Contributions from solar collectors and solar cells are considered as reductions of supplied energy if it is used in the building. Export of PV electricity to the electric grid or ST heat to the DH network is not recognized as a reduction of the energy use of the building. This means that an ST system will save more primary energy in a DH system than a PV system and a PV system will be more effective in a heat pump system.
A building connected to a DHS uses electricity for operation of the building and in the households. The electricity for operation is included in the PE number defined by the building code in Equation (1). The household electricity is not included, however. When a PV system is installed on this building, the PE number is decreased, since less electricity for operation is required. This decrease is limited, however, and saturates for a system of 10 kWp, since the electricity load for operation is small. A larger PV system will mainly cause overproduction and export to the grid the PV electricity, which is not included in the PE number, according to Equation (1). The figures show that an ST system connected to a DHS gives a lower PE number than a PV system. This is because the ST system can save the substantially-larger DH load. The decrease of the PE number is effective as long as the solar collectors are saving hot water during the summer. When the ST system exceeds 40 m2 the energy savings stagnate, since the summer load of hot water is covered.
Figure 2 and
Figure 3 show that the building with heat pumps will obtain lower PE numbers than a building with DH. This is determined by the value of the seasonal coefficient of performance (SCOP) of the heat pump. A heat pump with a SCOP which is identical to PE
el in Equation (1) will give the same PE numbers for DH and a heat pump. Higher SCOP values than PE
el will result in lower primary energy use for heat pumps than for DH. A higher PE
el factor increases the PE number of the heat pumps and makes the difference between the EAHP and the GSHP buildings larger. The figures also show that a PV system will save more primary energy if the PE
el factor is higher.
The results of the simulations are summarized in
Table 5 for all systems in combination with a 25 kW
p PV system or a 100 m
2 solar thermal system.
4.2. Change in Global CO2 Emissions
The impact on the global emission of CO
2 is estimated when heat pumps are replacing the four different DHS system defined in
Table 3 and when PV and ST systems are installed on the building. The DHS without any DEG system is used as a reference and the changes in global CO
2 emissions for the other combinations are calculated. The results for the four different DHS system are presented in
Figure 4,
Figure 5 and
Figure 6.
The global CO2 emissions are affected in different ways. When the boilers in the DHS use less, or a different, fuel the direct emissions are affected. If a CHP plant is generating less power this is compensated by another production unit in the electric grid. When the PV system is producing power then electricity is saved in the grid. The changes in global CO2 emissions when the electricity use/production is changed are calculated with three different allocation methods. The marginal production of electricity is assumed to consist of the EU mean electricity mix (EUEM), natural gas (NGCC), or coal (CC) power.
In
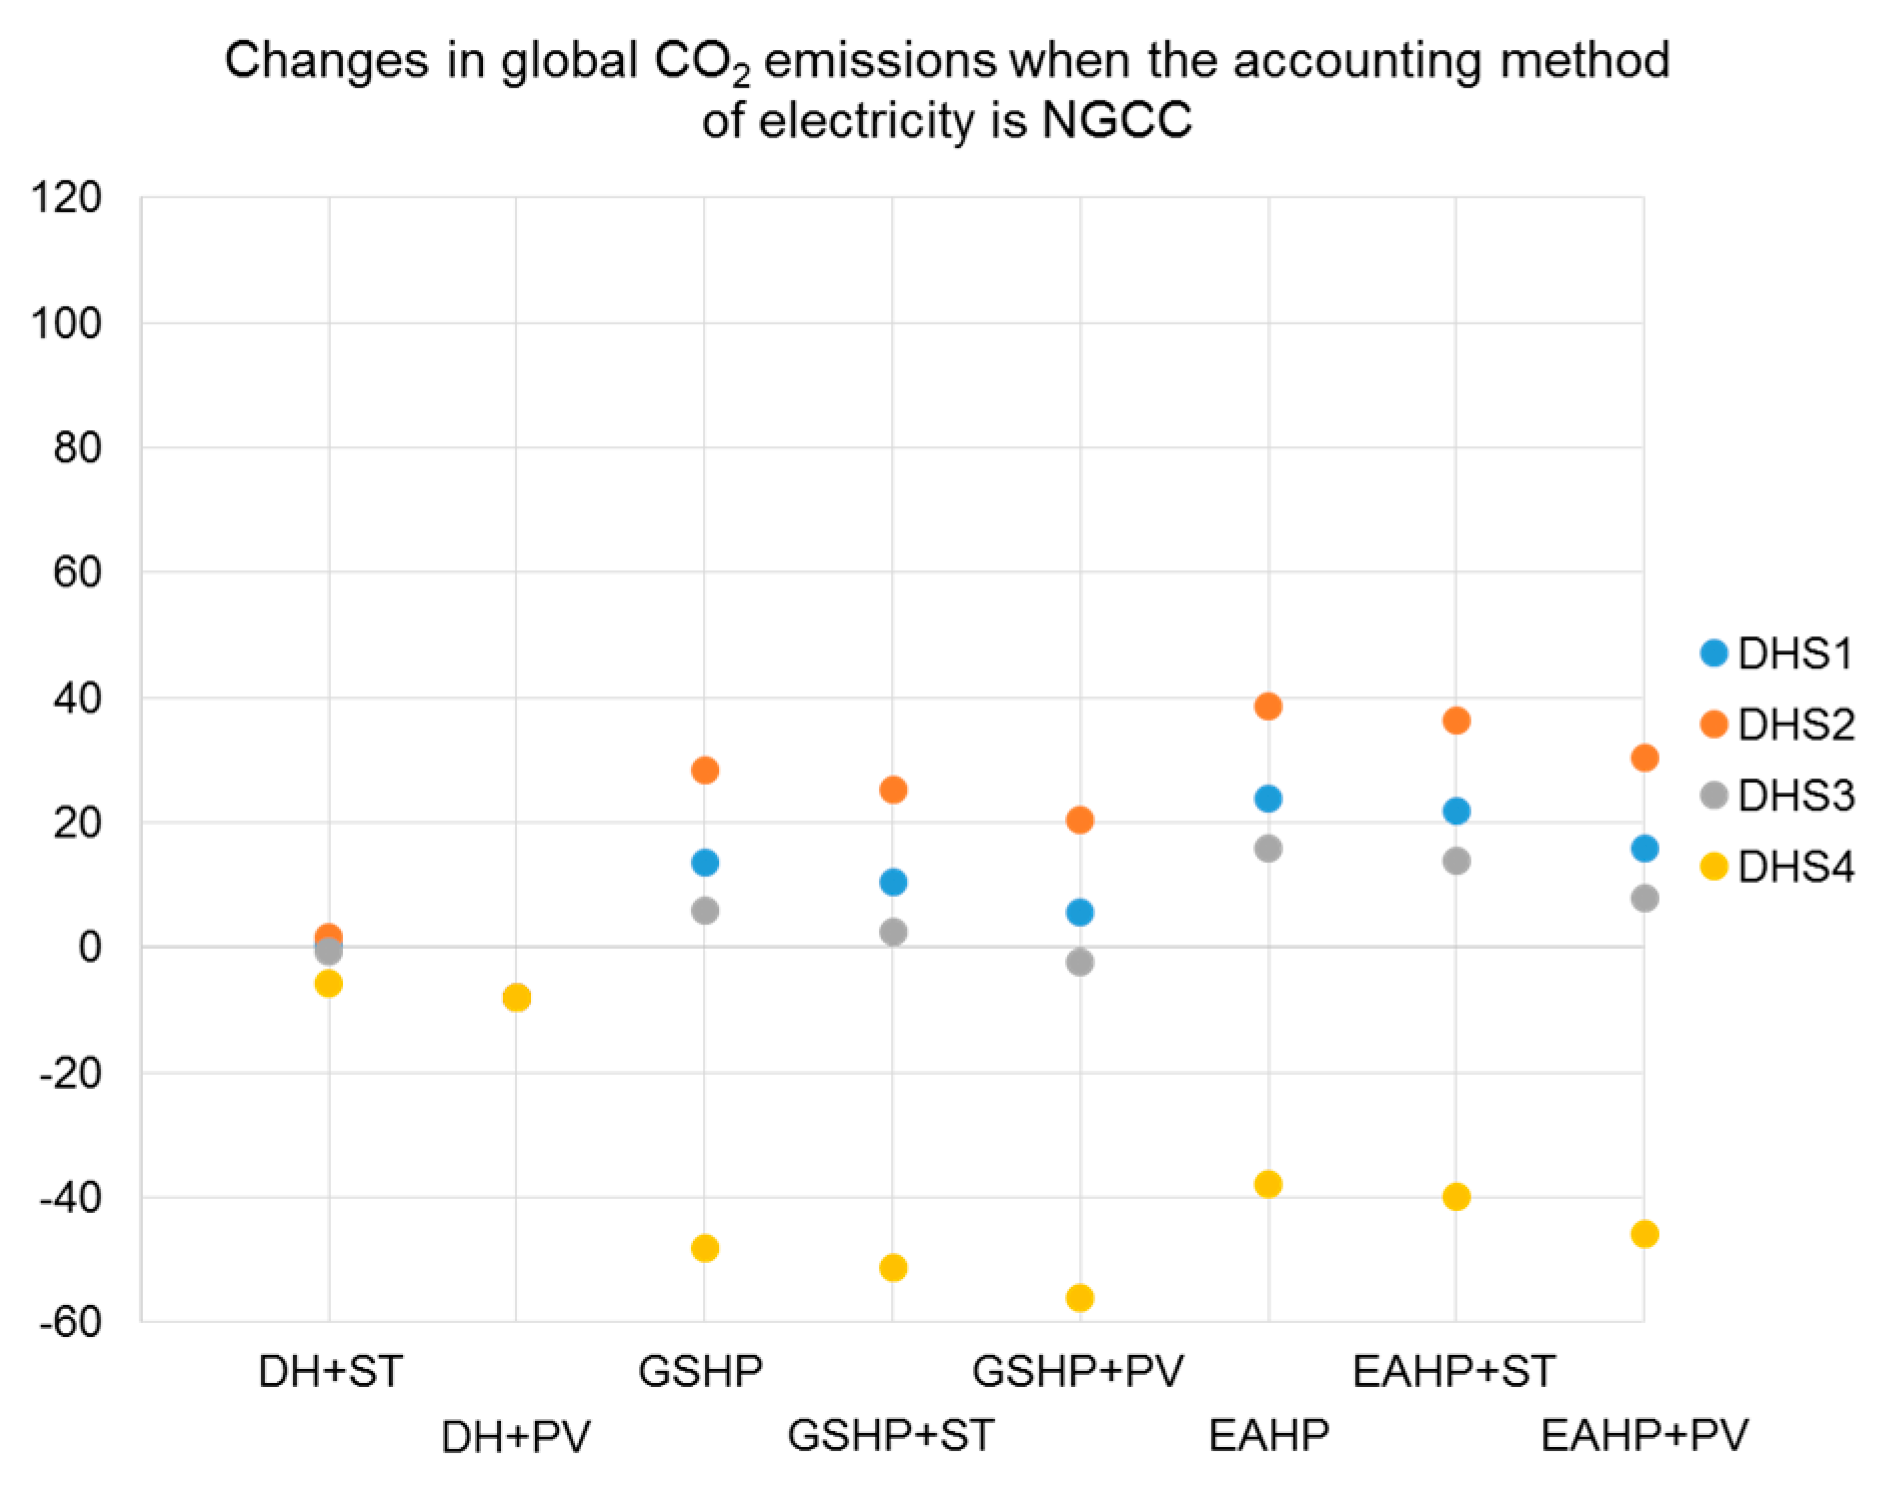
Figure 4 the different heating sources and DHS are compared when the accounting method for changes in electricity use/production is NGCC.
The CO2 emissions for the different heating sources are compared to if heat is delivered by DH only. Almost all heat pump system combinations increase the global CO2 emissions for DHS 1–3. The result of transformation means that biofuel is saved, less CHP power is generated and more electricity is used by the heat pumps. The lowest CO2 emissions are obtained if the building combines the DH with a PV installation. When fossil fuels are used in the DHS (DHS 4) the heat pump systems decrease the global CO2 emissions substantially.
When the DHS produces more electricity due to the use of a biofuel CHP plant as intermediate load (DHS 2), the decreased heat load with a corresponding decrease of electricity production when heat pump systems are used will increase the global CO2 emissions compared to DHS 1.
When a fuel with higher CO2 emissions is used and less electricity is produced in the DHS (DHS 3) compared to DHS 1 and 2, the heat pump systems affect the global CO2 emission less.
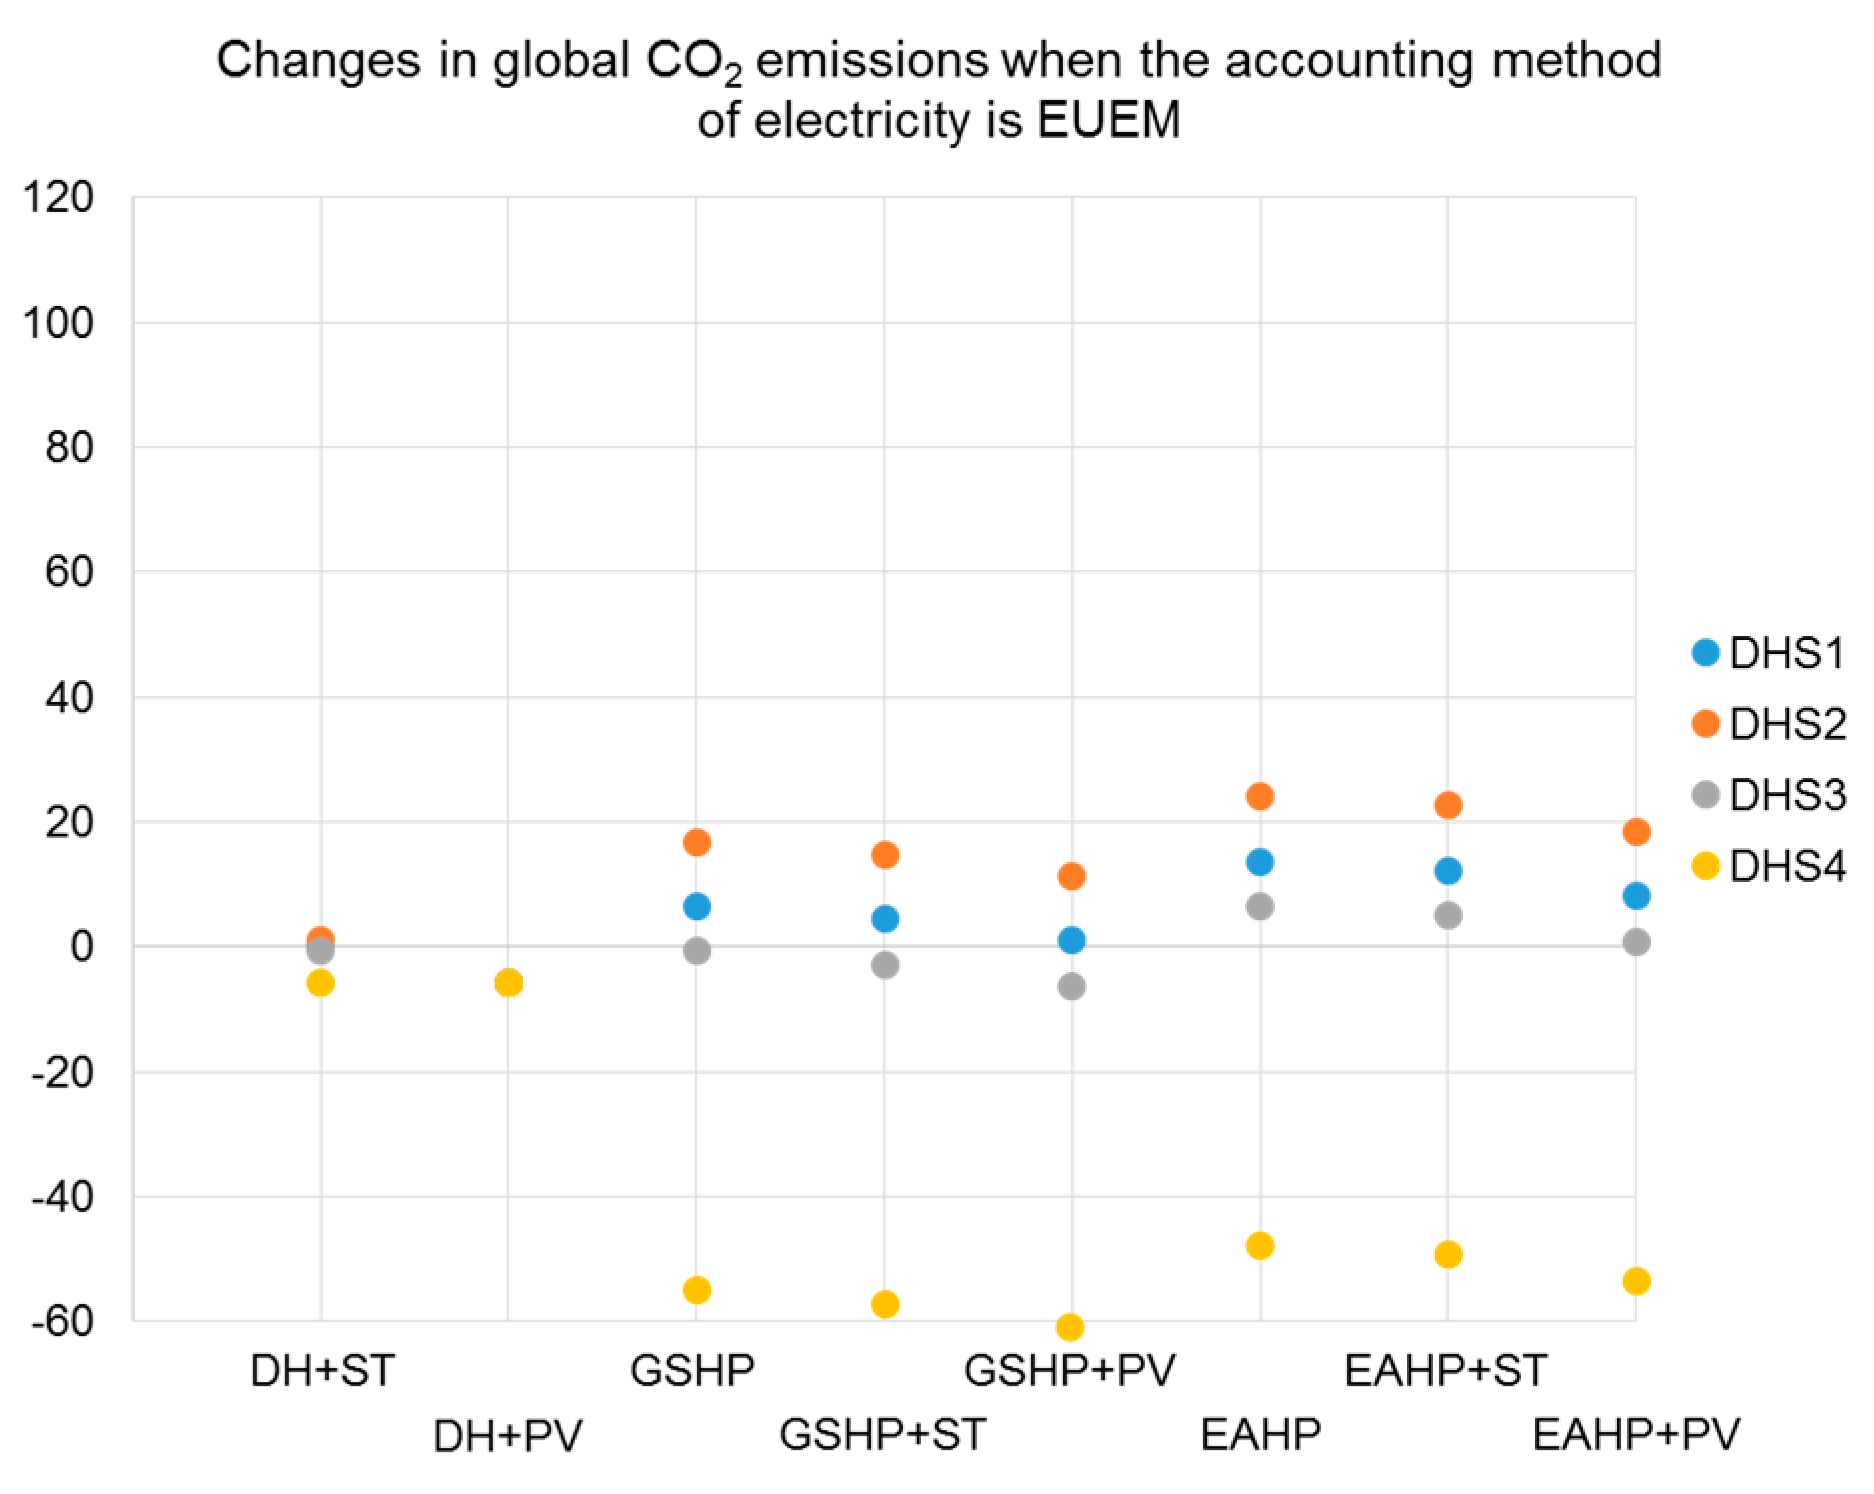
Figure 5 shows the accounting method for changes in electricity use of the EUEM.
When the accounting method for changes in electricity use/production is EUEM, the global changes of CO2 emissions are lower compared to if the accounting method is NGCC. The global CO2 emissions are lower for almost all heat pump systems for DHS 1–3. For DHS 4, the global CO2 emissions are further decreased compared to if the accounting method is NGCC.
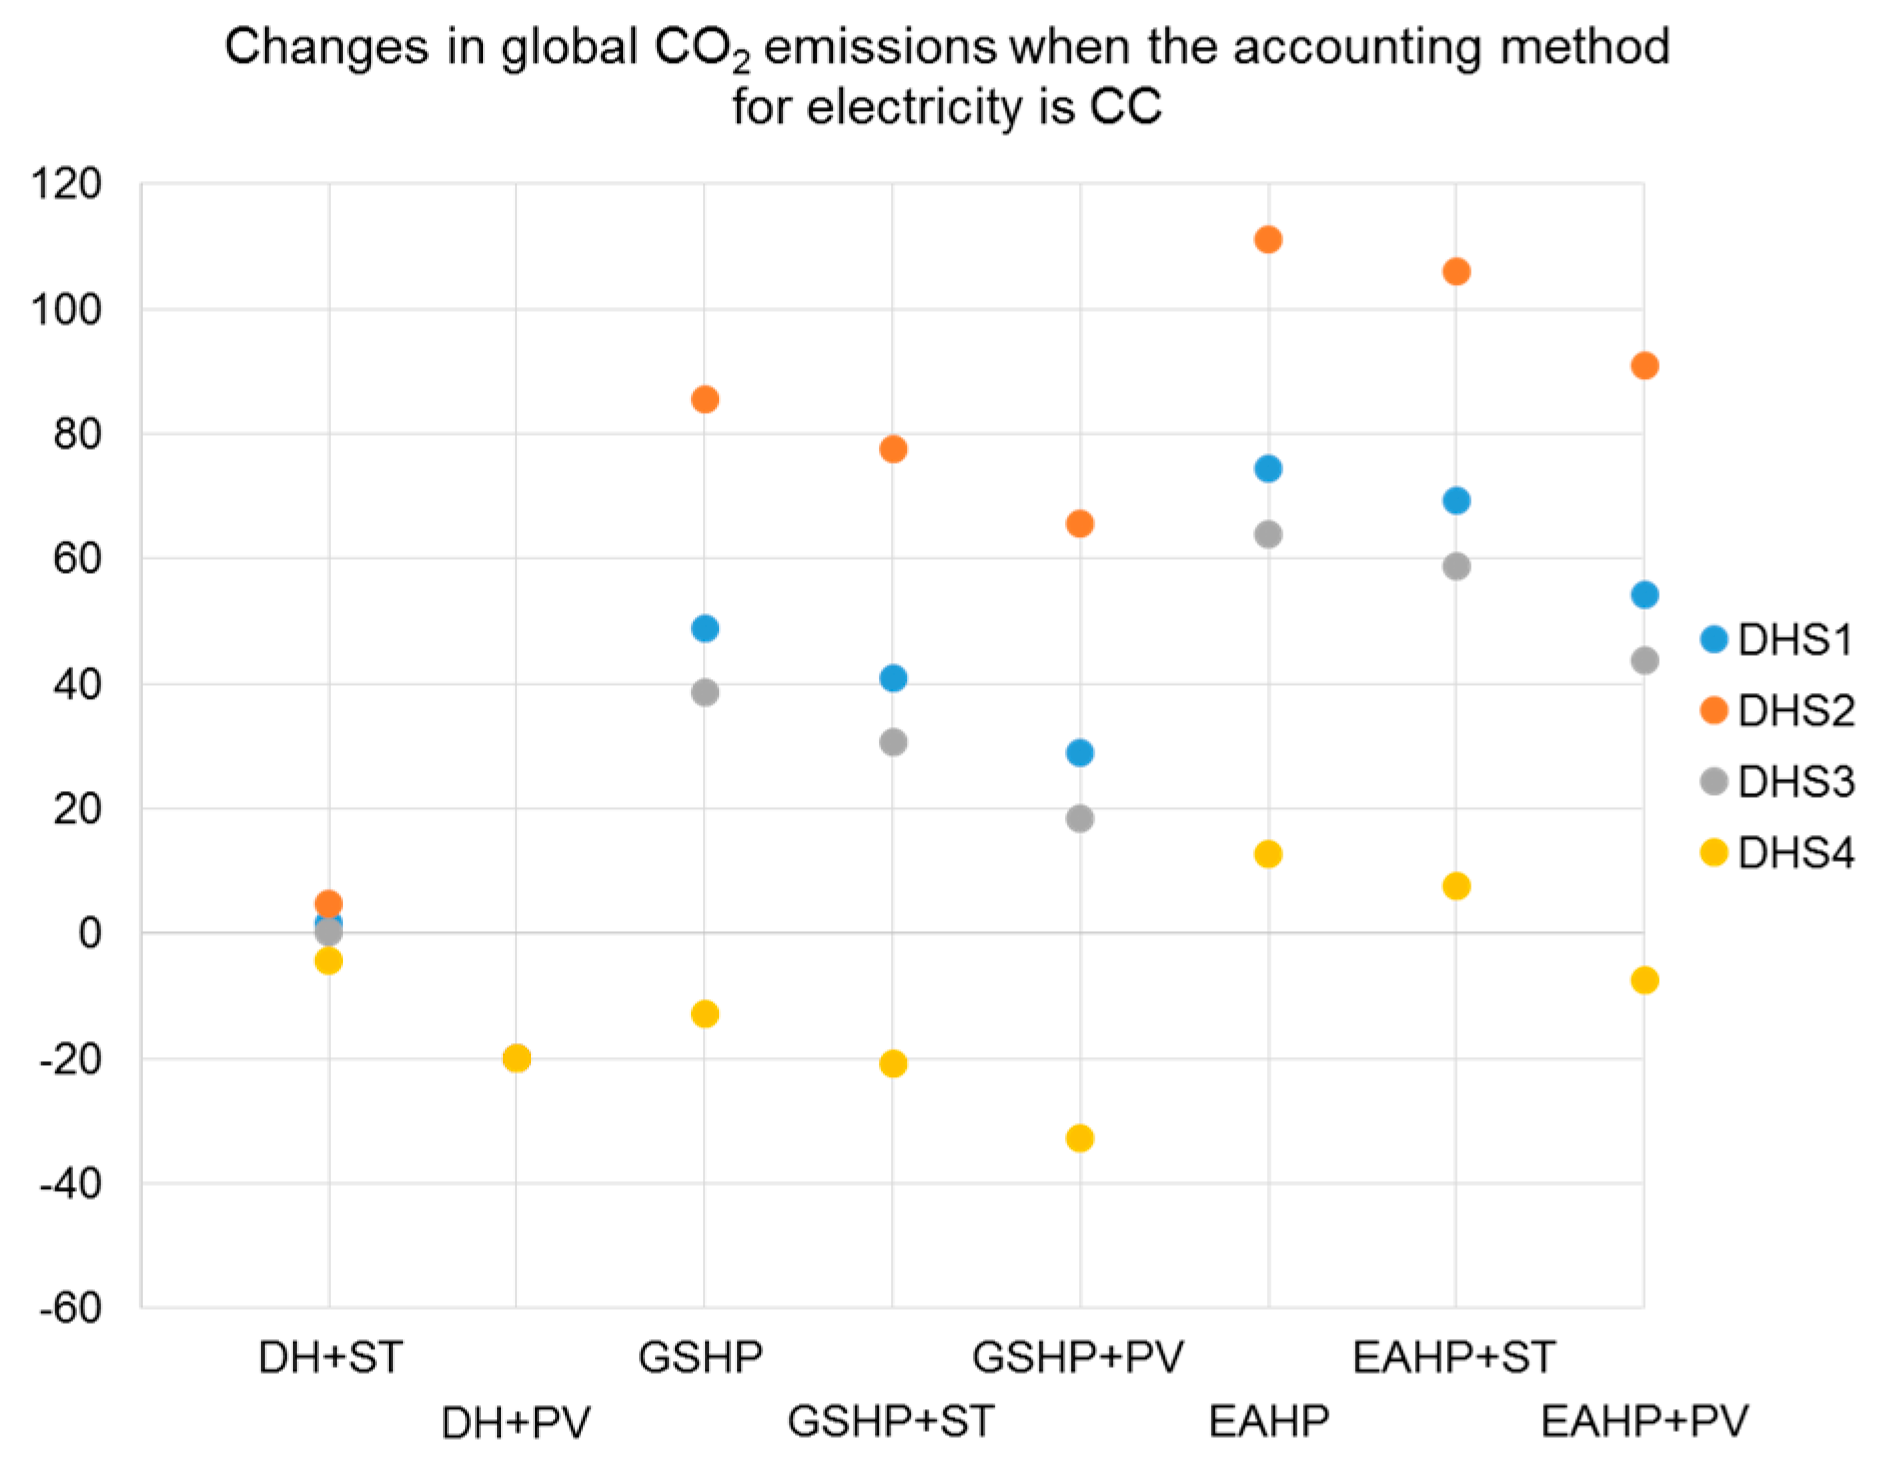
In
Figure 6 is the accounting method for changes in electricity use CC.
When the accounting method for changes in electricity use/production is CC, the global changes of CO2 emissions are higher compared to if the accounting method is NGCC. The global CO2 emissions are higher for all heat pump systems compared to if heat is delivered by a DHS for DHS 1–3. For DHS 4, the global CO2 emission decrease is lower compared to if the accounting method is NGCC and there are an increase in global CO2 emissions for the EAHP.
5. Discussion
In Sweden, the base load and intermediate load in DHS are commonly produced by solid waste incineration CHP plants or by biofuels in CHP or HOB plants. For DHS 1 and 2, where the DHS uses biofuels for the base load and intermediate load, the global CO2 emissions increase when heat pump systems replace DHS. When the DHS use fuels with higher fossil content and produce less electricity (DHS 3) then the introduction of heat pump systems has a lesser impact on global CO2 emissions. The global CO2 emissions are slightly decreased when a GSHP with a high SCOP is used and the allocation method for changes in electricity use/production use is the EUEM. The GSHP decreases the CO2 emissions compared to if heat from a DHS, or an EAHP is used if the DHS uses fossil fuels.
When a PV installation replaces an ST installation the global CO2 emissions will decrease for all system variations and for all allocation methods. The change in global CO2 emissions for the ST system is marginal for all accounting methods used and for all DHS compositions when compared to a PV system. This is because the produced heat from ST systems decreases the electricity production in CHP plants, which counteracts the decrease in global CO2 emissions from the reduced use of fuel. A PV system produces electricity and does not affect the electricity production in CHP plants.
The calculated PE number for a building according to the definition in the Swedish proposal for NZEBs, is considerably lower for a building with a heat pump system than for a building which uses DH. The decrease of the PE number is comparable if an ST or a PV system is installed in a building with an EAHP. The decrease in the PE number is greater if an ST system is installed in a building with DH than if a PV is installed, and the decrease of the PE number is greater if a PV system is installed in a building with a GSHP than if an ST system is installed.
The global CO2 emissions will increase if a multi-dwelling building replaces heat from a DHS that use biofuels and CHP plants with a heat pump. A PV system in combination with DHS gives lower CO2 emissions than ST systems. This means that the Swedish building code favors energy systems that increase global CO2 emissions. The building code should harmonize with other regulations for minimizing CO2 emissions. The proposed use of PE factors in Equation (1) governs an increased use of fossil fuel in the European energy system. The PEel factor of 1.6, which will be introduced in 2017, is too low. If the ratio between the PE factors for electricity and heat is below the SCOP factor of a heat pump system, a building with a heat pump system will obtain a lower PE number than an identical building heated by a DHS. Fuel and heat should also have different PE factors. The primary energy for a boiler is fuel, while the primary energy for heat from a CHP system or waste heat from an industry is defined as heat. The ratio between PEel and heat should be at least three for a more equitable ratio.
Buildings will last considerably longer than the installed energy system. If another energy system is installed then the requirements in the building code might not be fulfilled. A building with a GSHP in combination with a relatively large PV system will obtain a superior energy performance rated by the building code. This can be utilized for constructing a relatively poorly-insulated building, which still fulfills the building code. That is not the intention of the building code.
In the Energy Efficiency Directive of the Commission the targets are formed in terms of primary energy. This means that the values of the PE factors are very important. It is relatively straightforward to determine the relative PE factors for electricity and heat when they are generated from the same primary energy. However, it is difficult to determine the primary energy factors for an energy mix based on different primary energy sources of different energy qualities. The Commission has determined that the physical energy content method should be used. This means that the ability of the primary energy to be converted to heat is valued. The primary energy of non-combustible renewable energy systems like hydroelectric, wind and PV is defined as electricity with the PE factor 1 kWh of primary energy per kWh of electricity. This means that the PE factor of European electricity will decrease when fossil fuels are replaced by hydroelectric, wind and PV power. The goals in the Energy Efficiency Directive will be achieved without the energy use becoming more efficient. If the Commission were to recommend that the partial substitution method should be used for calculating the use of primary energy, it should not decrease when fossil fuel is replaced by renewables. This alternative method values the primary energy’s ability to be converted to electricity. This method is more physically sound than the physical energy content method. The method used means that PE factor of electricity will be continuously lower and district heating becomes less competitive.
6. Conclusions
The energy efficiency goal in the EU is set in terms of primary energy use. This means that the determined values of the PE factors are very important. The method which is recommended by the Commission for calculating the PE factor for an energy mix gives electric energy a low PE factor. When this PE factor is used in the building code of the countries heating with electric energy, e.g., heat pumps, receive a favorable treatment. The suggested low PE factor for electricity in the new Swedish building code will rate a building with a ground source heat pump as more energy efficient than a building supplied with heat from a biofuel district heating system with CHP. This means that the proposed definition will work in favor of installing heat pumps within the district heating area.
Our analysis shows that the global CO2 emissions are the lowest when heat from DHS with CHP plants using low CO2 emission fuels is used together with a PV system. The difference is up to 140 tonnes/year when compared to an exhaust air heat pump. This shows that the primary energy number calculated with relatively low PE factors for electricity gives improper guidance for NZEBs if the aim is minimizing global CO2 emissions. It is, therefore, also questionable to use for sustainable building assessments/certification schemes.
If the aim with the Swedish building code is to decrease the global CO2 emissions then the ratio between the primary energy factors for electricity and heat should be larger than three and considerably higher than today.


