Article

Simulation of Contamination Deposition on Typical Shed Porcelain Insulators

1
School of Energy, Power and Mechanical Engineering, North China Electric Power University, Baoding 071003, China
2
Jinneng Clean Energy Ltd. Company, Taiyuan 030002, China
*
Author to whom correspondence should be addressed.
Energies 2017, 10(7), 1045; https://doi.org/10.3390/en10071045
Submission received: 25 April 2017 / Revised: 7 July 2017 / Accepted: 11 July 2017 / Published: 20 July 2017

Abstract

:
The contamination deposition characteristics of insulators can be used in the development of antifouling work. Using COMSOL software, numerical simulations on the pollution-deposited performance of a porcelain three-umbrella insulator and porcelain bell jar insulator in a wind tunnel were conducted, and the simulated results were compared with the tested results. The comparison shows that the deposit amount is consistent with the order of magnitude and presents a similar tendency with Direct Current (DC) voltage variation; then the rationality of the simulation is verified. Based on these results, simulations of the natural contamination deposition on porcelain insulators and the distribution of pollution along the umbrella skirt were performed. The results indicates that, under a same wind speed, contamination of the porcelain three-umbrella insulator and porcelain bell jar insulator under DC voltage was positively correlated with the particle size. With the same particle size, the proportion of the deposit amount under DC voltage (NSDDDC) to the deposit amount under AC voltage (NSDDAC) of both insulators decreases with the increase in wind speed. However, the ratio increases as particle size increase. At a small wind speed, the deposit amount along the umbrella skirt of the two insulators displays a U-shaped distribution under DC voltage while there is little difference in the contamination amount of each skirt under Alternating Current (AC) voltage.

1. Introduction

An insulator plays the role of mechanical support and electrical insulation of an overhead transmission line. Contamination on the insulator will increase the risk of its pollution flashover and threaten the safe operation of the power system [1,2,3]. With the rapid development of modern industry, environmental pollution has a great impact on the insulation performances of insulators, which brings a significant potential safety hazard to the external insulation of transmission lines, resulting in an incalculable loss to the power system [4,5,6,7]. Therefore, pollution prevention work is still the focus of the power sector. At present, the measurement of the pollution degree has been the basis of the work. Based on the measured data, it can be used as a reference for the external insulation design and the cleaning work of the transmission lines [8].
Investigating the contamination characteristics of typical shed porcelain insulators has important practical significance on reducing the occurrence of pollution flashover accidents [9,10,11,12]. Presently, domestic and foreign scholars extensively apply natural contamination tests, wind tunnel contamination tests, as well as numerical simulation methods to the study of the characteristics of pollution. Zhang et al. [13] studied the natural contamination rules of the post porcelain insulator through a natural pollution test lasting for three years, and pointed out that the non-soluble deposit density (NSDD) and equivalent salt deposit density (ESDD) distribution of insulators was very uneven, and the pollution severity measurement value of the insulator top surface was higher than the bottom surface, generally. Ravelomanantsoa et al. [14] designed an open loop wind tunnel to investigate the insulator contamination characteristics under winter conditions. The results demonstrate that the deposit amount of the upper surface is much greater than that of the bottom surface, and the accumulation rate of the pollution and the wind speed are interrelated by a power law relation. Zhang et al. [15] established a simplified model of insulator through the computational fluid dynamics software FLUENT, simulating the flow field distribution and proposed the particle impact coefficient (P) to judge the collision between the particles and the insulator wall. The research results indicate the coefficient P is affected by particle size and wind velocity, and the larger the coefficient is, the more severe the pollution accumulation will be.
Insulator contamination is the result of integrated action between wind speed, particle size, and voltage. Compared with the experimental study, numerical simulation has the advantages of low cost and short data acquisition time. However, the numerical simulation research of pollution is still relatively small, and the research results of multi-factor coupling under the action of the electric field, flow field, and particle field are still insufficient.
This study attempted to investigate the pollution accumulation using multi-physics field coupling software on the porcelain three-umbrella insulator and porcelain bell jar insulator under the condition of the wind tunnel, and the simulated results were compared with the tested results to verify the feasibility of the simulation method. Using the aforementioned method, in the natural pollution period (without considering the effect of precipitation conditions on pollution), simulation investigations of the contamination deposition on the typical shed porcelain insulators were conducted to analyze the effects of various factors such as wind speed, particle size, and voltage type. Additionally, the distribution of contamination along the umbrella skirt will also be explored.

2. Mathematical Model and its Control Equation

In this paper, in order to simulate the contamination characteristic of the insulator considering the coupling effect of the multi-physics field, the AC/DC electric field module, the turbulence module, and the fluid-particle-tracking module in the COMSOL software package is used. Additionally, the Lagrangian model was used to simulate the gas-solid two-phase flow. The flow field near the insulator is more complex, and when the air flows through the insulator, the flow line is more likely to bend larger. Therefore, in order to make the simulation results closer to the actual situation, the flow field is time-averaged. In order to select the appropriate flow field model, the quantization parameters, such as Reynolds number, are calculated, as shown in Equation (1):
Re = ρ v d μ
where “ρ” is the air density, kg/m3; “v” is the wind speed in the wind tunnel test, m/s; “μ” is the aerodynamic viscosity, Pa·s; “d” is the characteristic length, and the “d” in the simulation is the disk diameter of insulator (for the porcelain three-umbrella insulator, d = 0.33 m; for the porcelain bell jar insulator, d = 0.28 m), m.
Corresponding to the pressure of 101.325 kPa and the temperature of 20 °C, the values of air parameters were substituted into the above formula, so for the porcelain three-umbrella insulator, the Reynolds number is 8.92 × 10⁴; for the porcelain bell jar insulator, the Reynolds number is 7.57 × 10⁴. It can be seen from the calculation results that the flow is in a turbulent state, so the turbulence model is used in the flow field, also the incompressible Renormalization-group (RNG) k-ε model [16,17] is adopted.
The forces of particles when they move in multi-physical field are more complex. Compared with the gravity force and the fluid drag force, the other forces such as Saffman force, Magnus force, pressure gradient force and aerodynamic drag force which particles subjected to were quite small [18], so they can be ignored for simplicity. In the electric field, the dielectrophoretic force [19,20], the Coulomb force and the image force [20] particle suffered will affect the its movement, thus affecting its deposition. However, compared with the electrical force, the three forces were relatively small and can be negligible, and when the charged particles continue to move close to the insulator during the movement process, the electrical force gradually increased, so the impact of electrical force cannot be ignored [21,22]. Thus, under the condition of satisfying the calculation accuracy, especially in order to reduce the amount of calculation, assume that in the flow and electric fields, we mainly consider the influence of the gravitational force (Fg), fluid drag force (Fd), and the electrical force (Fe) of the contaminant particles. The particle motion constraint equation is shown in Equation (2):
{ m p d v d t = F g + F d + F e F g = m p g F d = 1 τ p m p ( u v ) τ p = 4 ρ p d p 2 18 μ C D Re r C D = 24 Re r ( 1 + 0.15 Re r 0.687 ) F e = e Z E Z = π d p 3 ρ p Q 6 e
where “mp” is the particle weight, kg; “v” is the particle velocity, m/s; “Fg” is the gravitational force of the particle, N; “Fd” is drag force of the flow field imposed on the particle, N; “Fe” is the electrical force, N; “u” is the velocity of the flow field, m/s; “τp” is the response time of the particle in the flow field, s; “ρp” is the particle density, and “dp” is the particle size, m; “μ” is the dynamic viscosity of air, Pa·s; “CD” is the drag coefficient; and “Rer” is Reynolds number. Further, “e” is the charge quantity of the elementary charge, C; “E” is the spatial electric field strength, N/C; “Z” is the charge quantity of the particle; and “Q” is the charge quantity of a particle per unit weight a, C/kg.

3. Wind Tunnel Test and Its Simulation Results Analysis

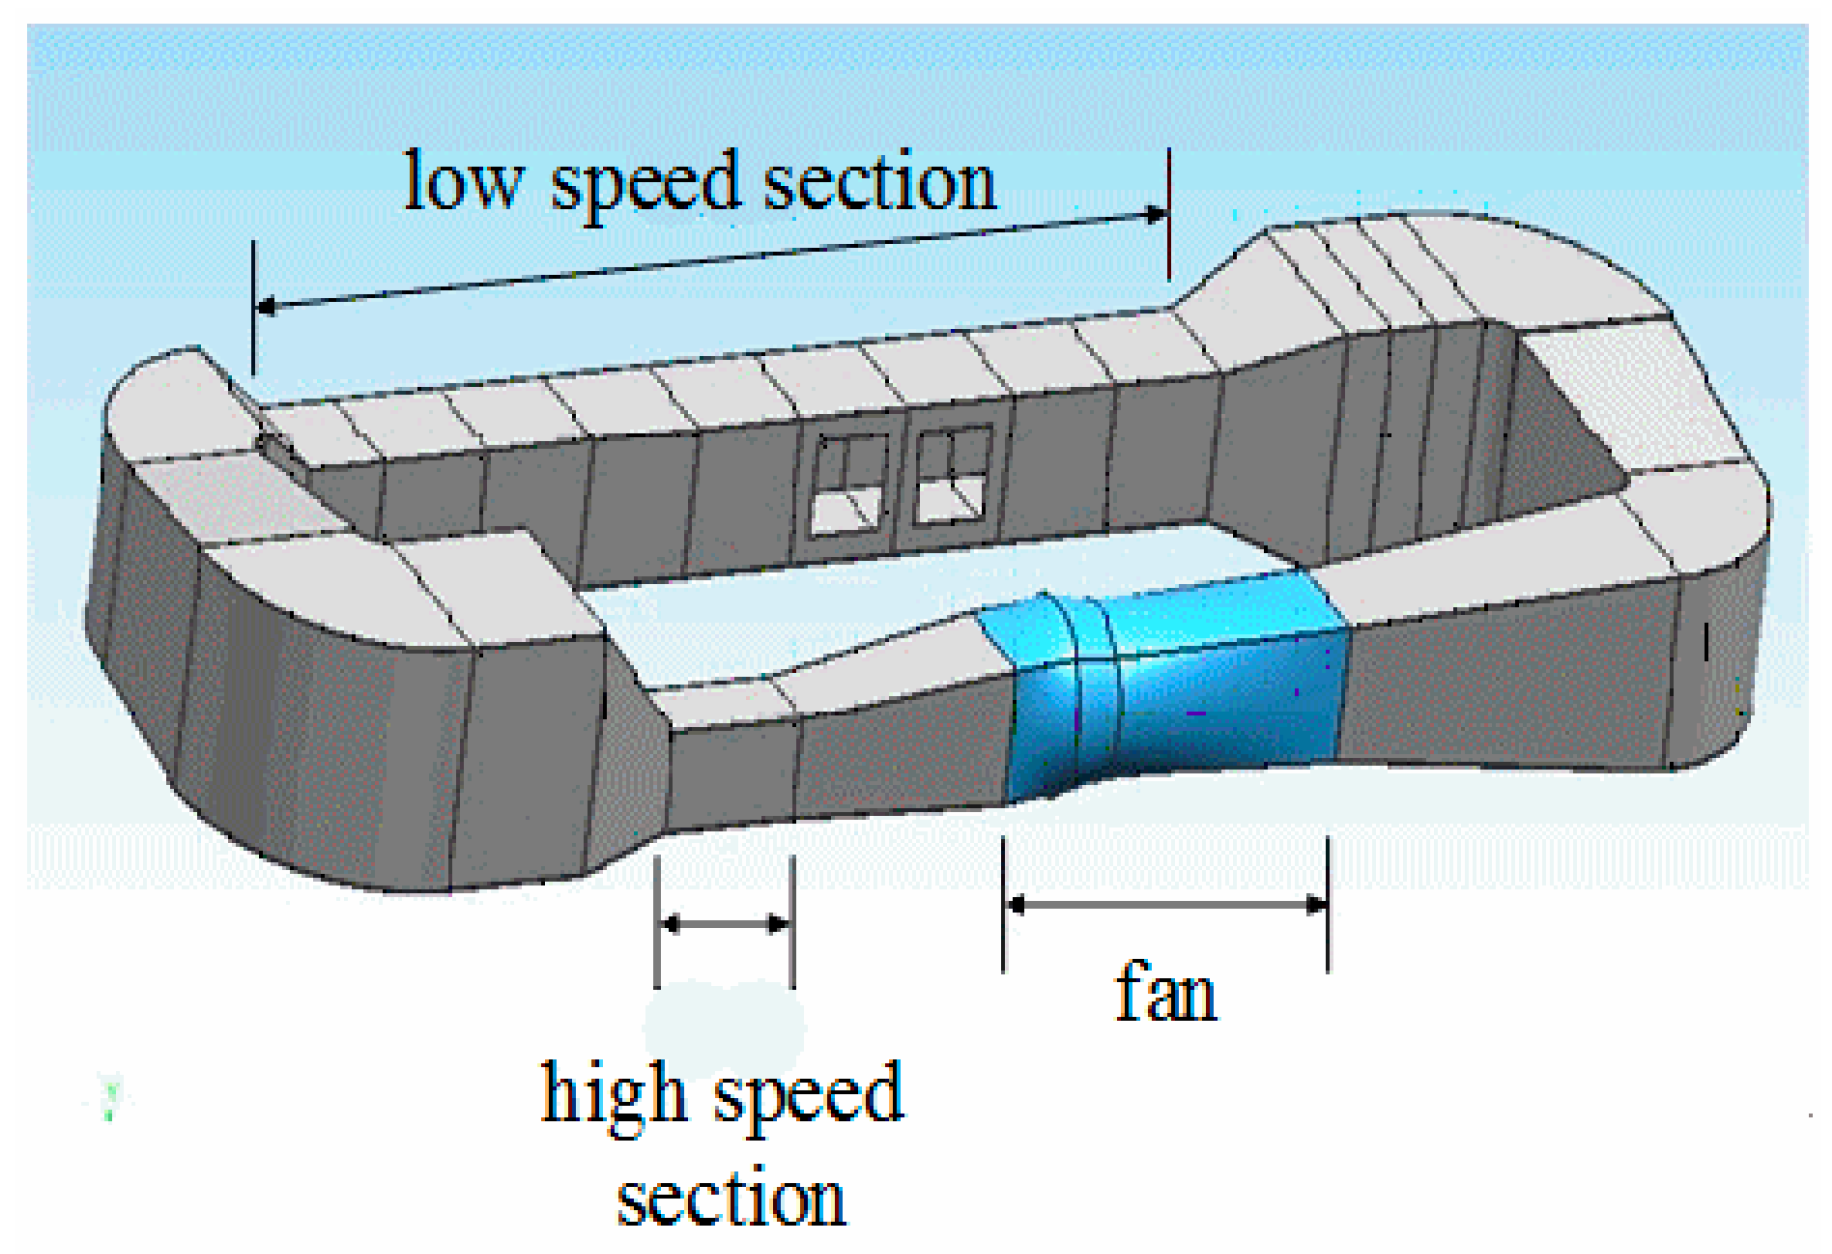
3.1. Wind Tunnel Test Device and its Method

The wind tunnel laboratory equipment at our school is described in Figure 1. The test was carried out in a low-speed section (10.5 m × 1.1 m × 0.8 m). The test environment corresponds to the natural wind conditions in the atmosphere, without considering the effect of rainfall erosion. Therefore, the test wind speed is set at 4 m/s. The main parameters of the porcelain three-umbrella insulator and porcelain bell jar insulator used in the test are summarized in Table 1, and the models are shown in Figure 2. Due to the 0.8 m height restrictions of the wind tunnel laboratory, the insulator string composed of three pieces for each of the above two kinds of insulators was selected as the research objects.
In the wind tunnel test, the lower umbrella skirt steel legs are set as the high-voltage terminals, while the upper umbrella skirt cap is the ground terminal, and 0, ±12, ±18, ±24, ±36 kV DC voltage is applied to the insulators throughout the entire test. The sample consists of sand, diatomite, and NaCl particles mixed at a ratio of 6:6:1. The size of the sand, diatomite, and NaCl particles were approximately 100 μm, 50 μm, and 100 μm, respectively, and their densities were 2.32 g/cm3, 0.47 g/cm3, and 2.165 g/cm3. In the experiment, the contamination amount was measured through the grey density value (diatomite) on the surface of the insulator umbrella skirt. In order to reduce the experimental error, the experiment was repeated five times for each condition, and the maximum error for each test is 4.8%. Eventually, the average value was taken as the actual contamination amount.

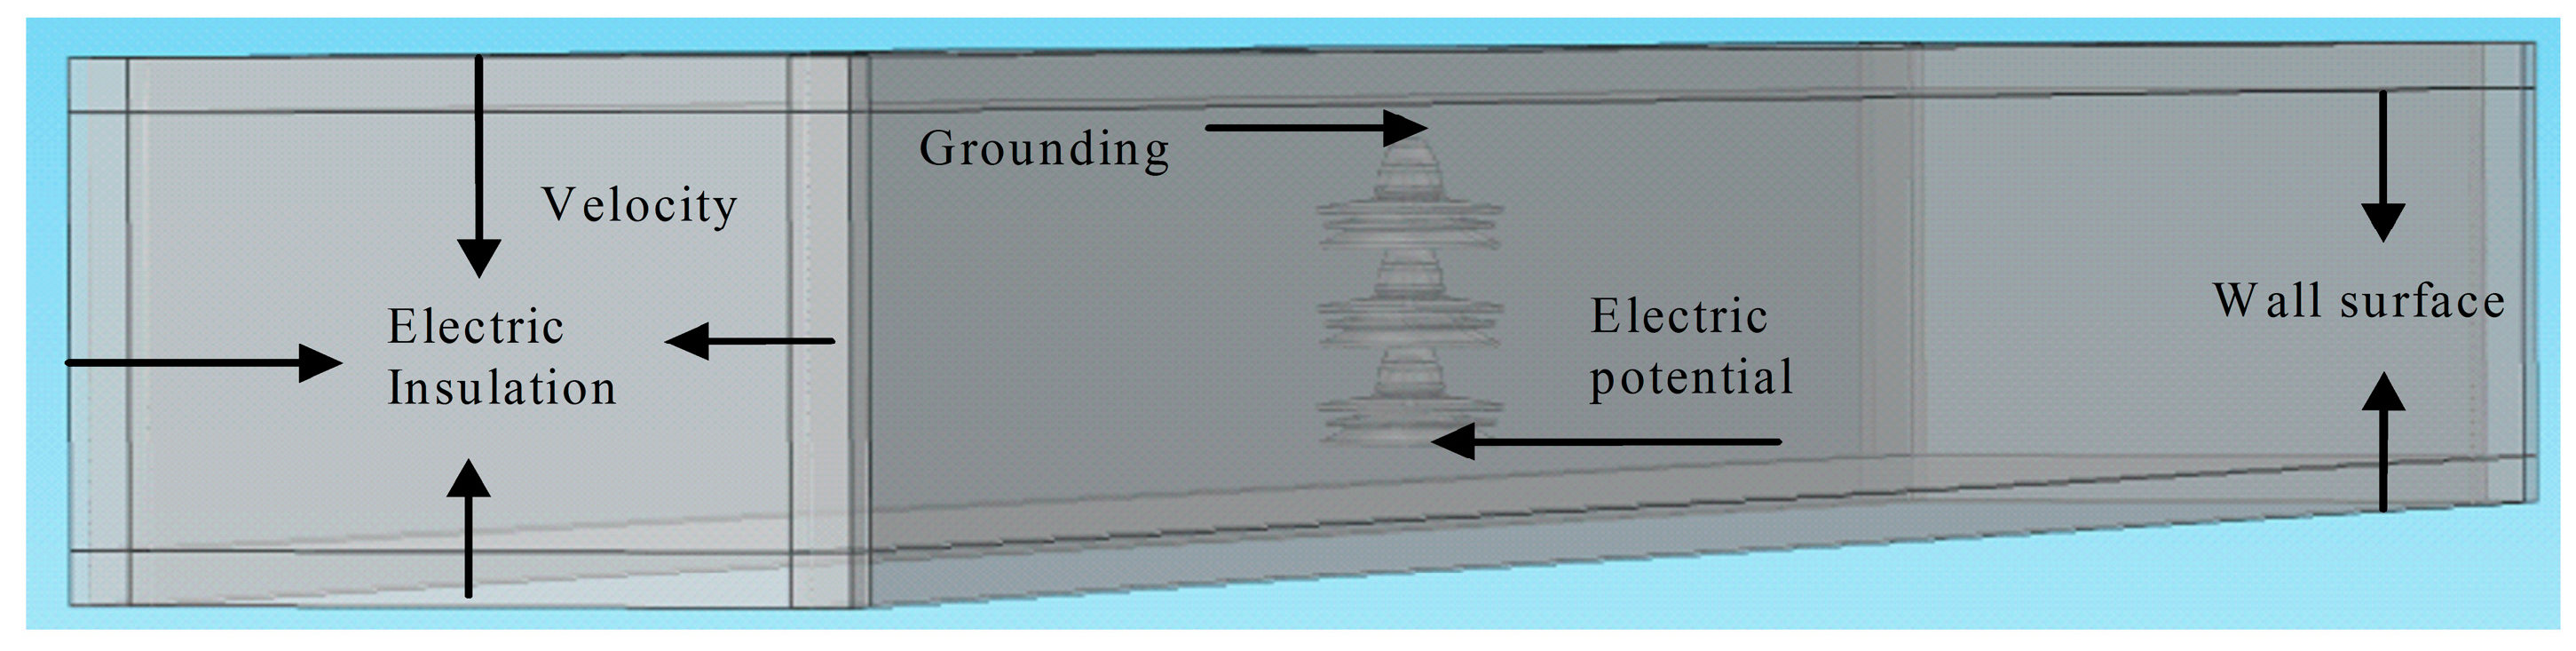
3.2. Wind Tunnel Numerical Simulation

In the simulation, the same cuboid is constructed as per the geometric dimensions of the low-speed segment, and outside the rectangular flow path, a virtual region with a thickness of 100 mm, called the “infinite element domain” [23] was established. Its external boundaries were defined as the absorption region of the electromagnetic wave, as is shown in Figure 3 (take the porcelain three-umbrella insulator for example). The outer boundary of electromagnetic wave absorption region is the default electrical insulation boundary condition. Herein, the flow field entrance is the speed (4 m/s) entrance, and the outlet is the pressure outlet. The other four surfaces are walls, and the wall surface function is used to solve its velocity and pressure distribution. In the particle tracking module, the particles are released from the inlet, and they are carried by the air to enter the flow field region. The deposition process of particles on insulator is quite complicated, so the expression of the particle adhesion criterion is programmed according to the literature [24]. The grid irrelevance verification shows that the mesh number of the porcelain three-umbrella insulator and porcelain suspension disc insulator are, respectively, approximately 700,000 and 540,000, which can better meet the requirements of the actuarial accuracy and the calculation time.

3.3. Comparative Analysis of Test Results and Simulation Results

The wind tunnel test demonstrates that the surface deposit amount of the two types of insulators is saturated after 15 h. Therefore, in the wind tunnel pollution simulation, it is necessary to calculate the amount of pollution in the whole saturation time. As with the experiment, the simulation conditions are repeated the same times, and take the average. As the evaluation index of insulator contamination, the calculation formula of the surface deposit amount (NSDD) is as follows:
N S D D = ξ   n m p t s t p S
where “ξ” is the time factor; “mp” is the particle weight, kg; “n” is the total number of the contamination particles deposited on the skirt surface, which can be directly obtained by the simulation software; “S” is the total surface area of the insulator sheds, m2; “tp” is the contamination simulation time, s; “ts” is the time of wind tunnel contamination test. Figure 4 shows the test results and simulation results for each insulator.
It can be seen from Figure 4 that the wind tunnel test results and simulation results, with respect to the deposit amount, are at the same order of magnitude, and the trend is similar with the DC voltage variation. Compared with the experimental results, the maximum deviation of the porcelain three-umbrella insulator simulation results is 69.3%, while the maximum deviation of porcelain bell jar insulator simulation results is 83%, but its minimum deviation is 13.9%. The values of the simulation results under positive and negative polarity voltages appear almost the same and, from the test results, the main reasons for the differences might be the following: under actual conditions, most dust particles in the air are charged (31% of the fly ash particles are positively charged, 43% are uncharged, and 26% are negatively charged). However, in this work, we assume that the charge quantity of a single particle in a group of particles complies with the probability distribution of a normal random variable, i.e., an equal number of positively- and negatively-charged particles. This assumption is not entirely consistent with the actual distribution of the polarity of the particle charge electricity, thus resulting in the symmetric simulation results.
Due to the limitation of computational resources, the whole process of wind tunnel contamination test is difficult to fully reproduce. Furthermore, the actual insulator has a complex structure, especially the steel feet and iron caps. In addition, the simulation does not take into account the dielectrophoretic force, Coulomb force and image force particles subjected to, which may also be one of the reasons for the larger error. Although the simplified simulation model is similar to the actual structure, the existence of these factors, to a certain extent, lead to the big differences between the wind tunnel test results and simulation results. However, the simulated results and the tested results display a consistently changing pattern and a same order of magnitude, which verifies the rationality of the simulation method proposed to research the deposition performances of the two insulators.

4. Analysis of Simulation Results with Respect to Natural Pollution Accumulation Characteristics

With the aforementioned wind tunnel simulation method, aiming at the meteorological characteristics in the midwest regions of China, the natural pollution accumulation characteristics of the porcelain three-umbrella insulator and porcelain bell jar insulator were studied during the natural accumulation period (the non-rainy season from October to the following March, a total of five months, without considering the rainfall condition) to analyze the coupling effect of the wind speed, the particle size, and the voltage type on the natural contamination accumulation features, and the distribution law of the contamination along the insulator skirt was discussed (this research project comes from program of State Grid Corporation of China, and the project number is GY7111053, so the parameters of wind speed, particle size, and so on are selected in accordance with the requirements of the project).

4.1. Natural Contamination Simulation

According to the structures of the porcelain three-umbrella insulator and porcelain bell jar insulator, as the object of study, the two insulators were selected a string of seven pieces, respectively, to meet the requirements for the actual operating voltage. For convenient research, the umbrella skirts from the high-voltage terminal to the ground terminal were numbered in turn, as shown in Figure 5 (take the porcelain three-umbrella insulator for example). To accord with the actual conditions of the air flow in an infinite space, the flow channel was set as “symmetrical” boundary conditions when the natural pollution simulation model was established. The voltage level applied to the insulator string was 90 kV of DC and AC voltage (the DC voltage corresponds to the average value, while AC voltage corresponds to the effective value), and 0 kV. The contamination particle size was 5 μm, 10 μm, and 20 μm, respectively, and the wind speed is, respectively, 0.5 m/s, 3 m/s, 5 m/s, and 7 m/s. The other boundary conditions were similar to the wind tunnel model conditions.

4.2. Analysis of the Natural Pollution Accumulation Simulation Results

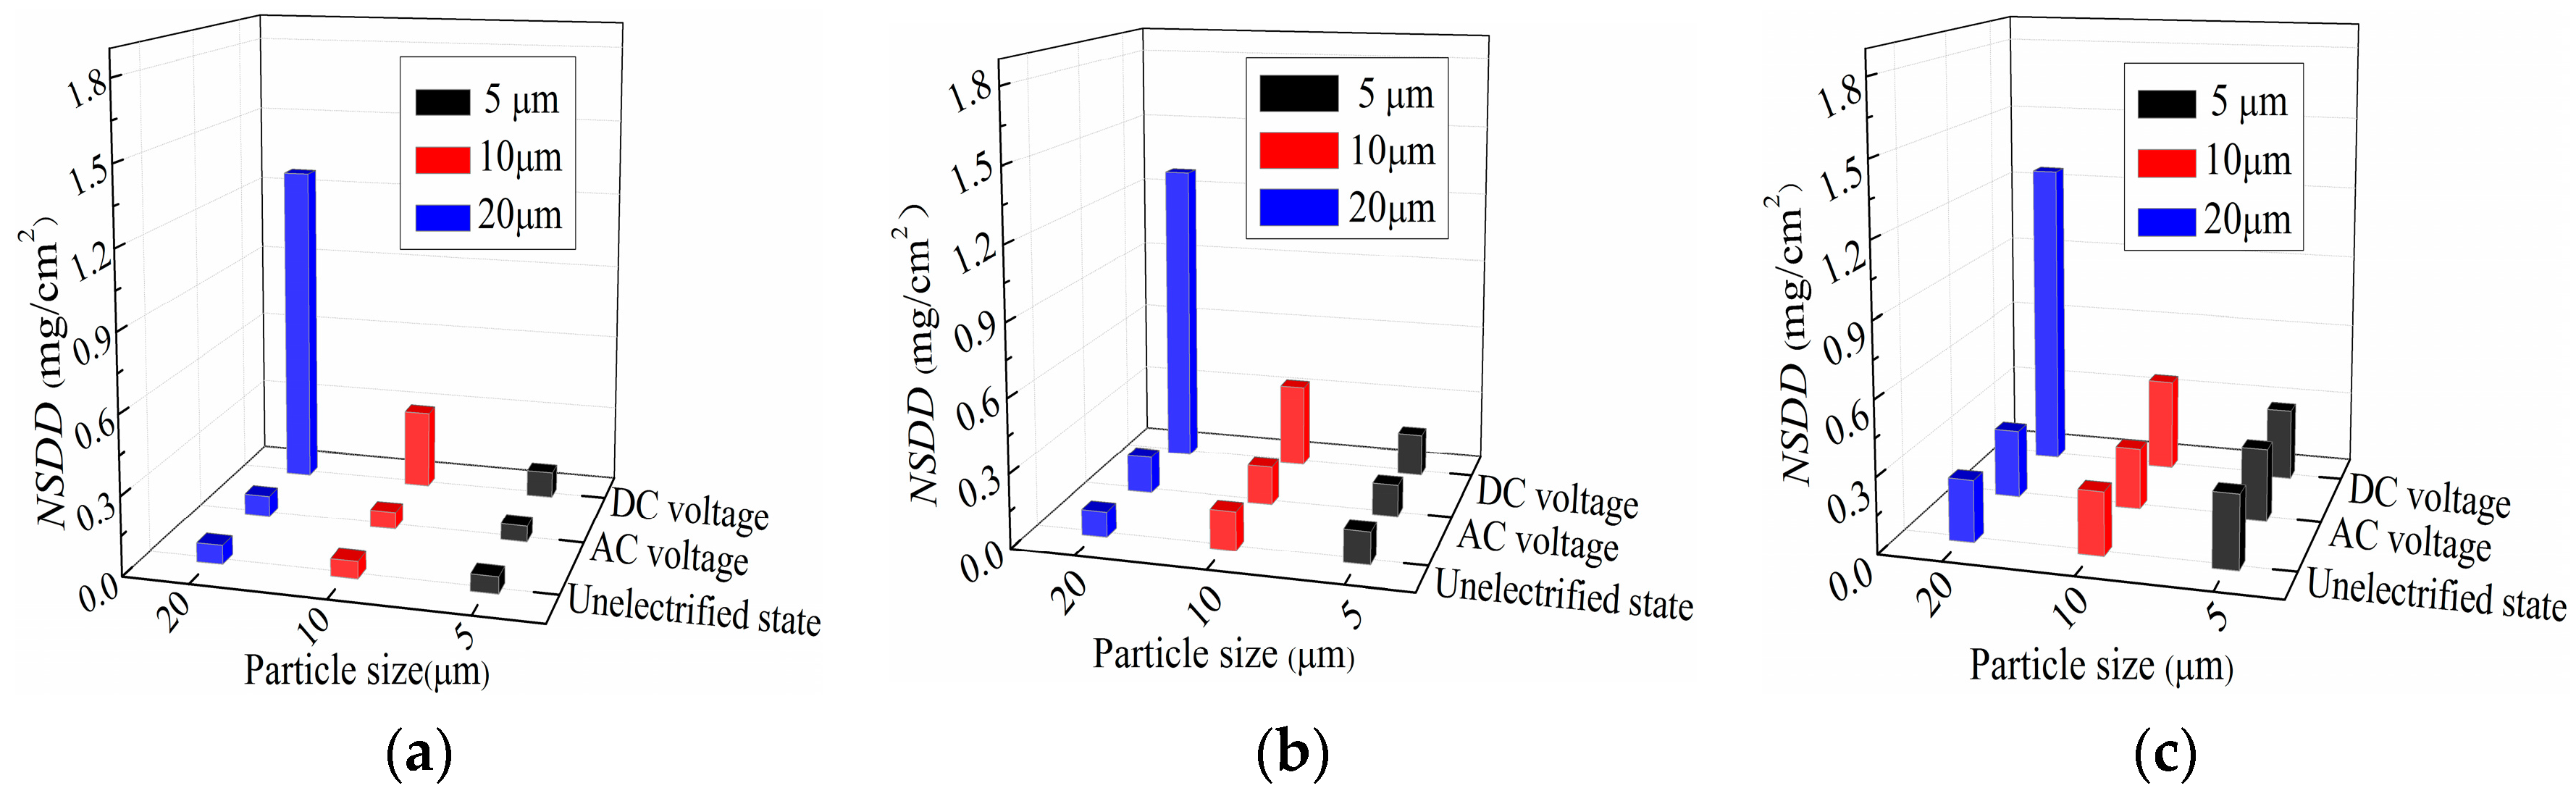
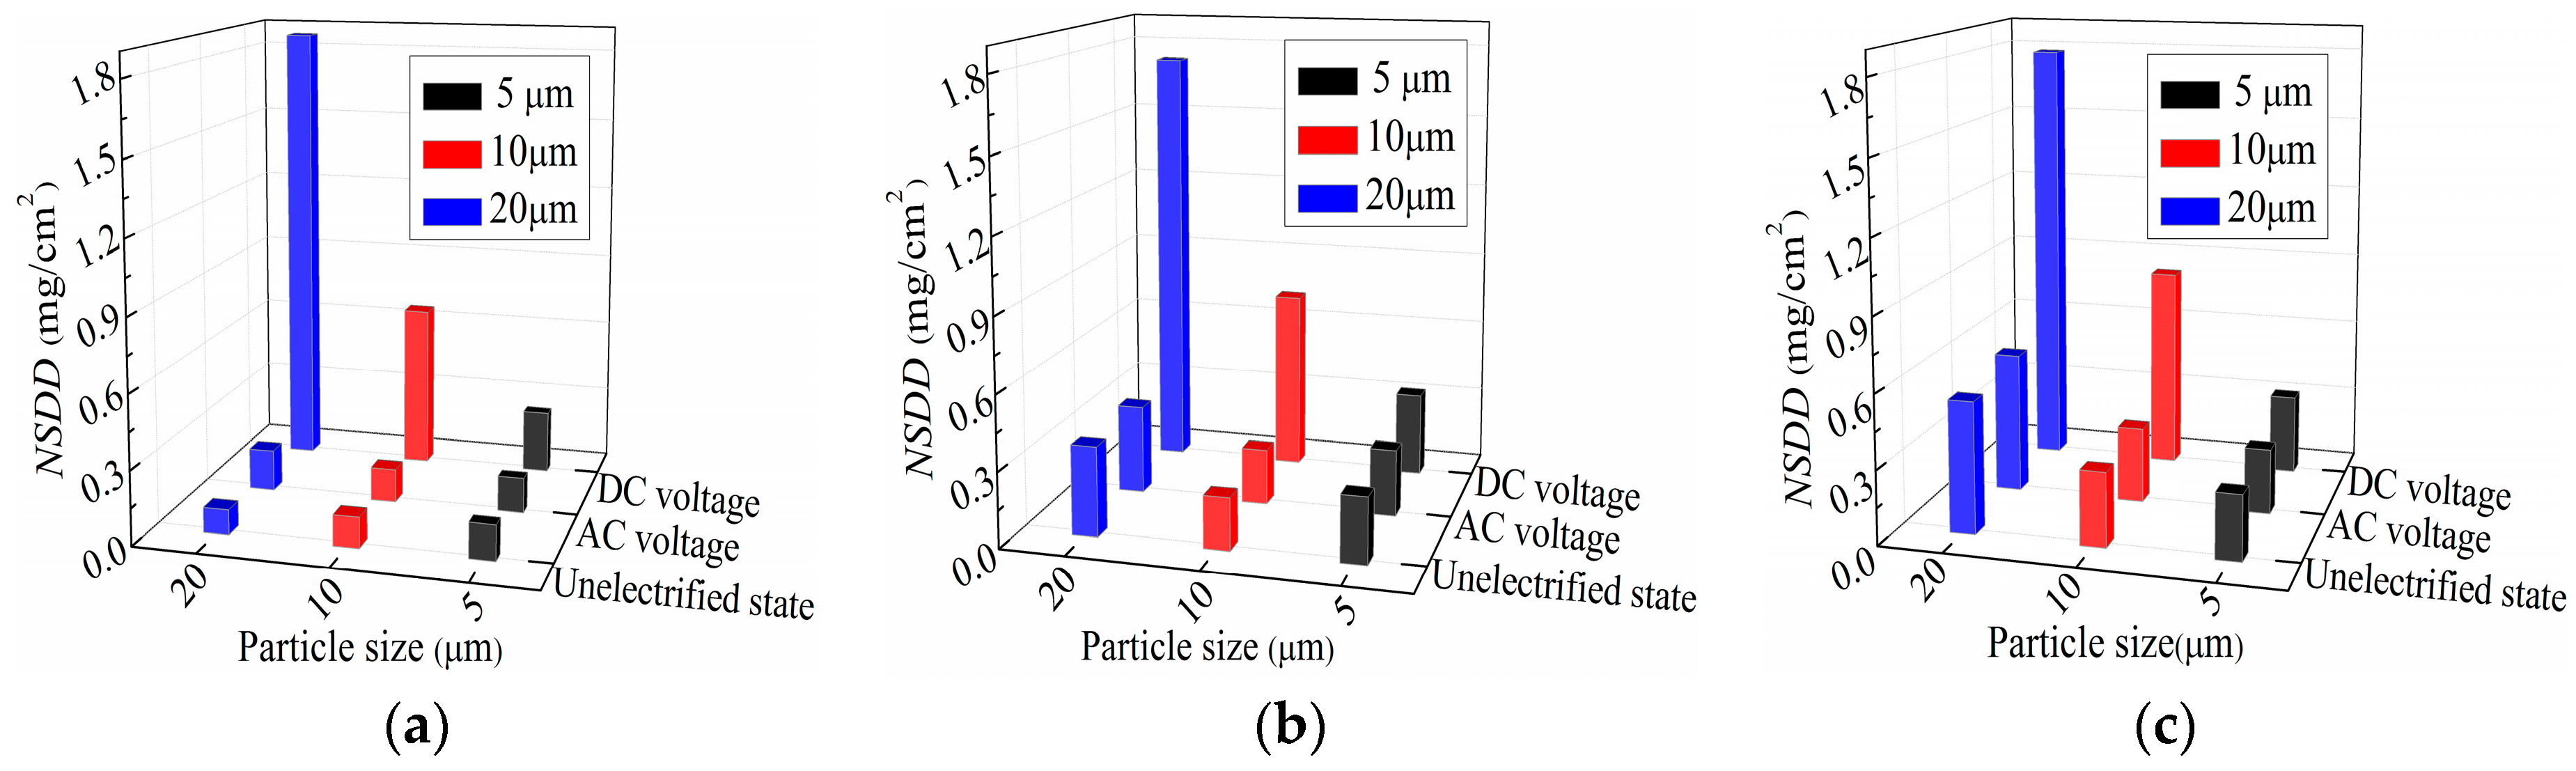
4.2.1. Effects of Multi-Factor Coupling on Contamination Accumulation

The pollution accumulation on the insulator surface is the result of the coupling of many factors. Figure 6 and Figure 7 show the relationship between the overall contamination on the insulators and the particle size, and voltage type under the three wind speeds (3 m/s, 5 m/s, 7 m/s, respectively).
Figure 6 indicates that at a same wind speed, the NSDD of the porcelain three-umbrella insulator under DC voltage is larger than those under AC voltage and the unelectrified state, while the effects of the latter two types of voltage on the NSDD were similar, and the deposit amount were almost the same. With the increase in wind speed, the follow-ability of the pollution particles increases, and the collision probability with the insulator wall were also increased. Therefore, the NSDD under the three kinds of voltages increases as the wind speed increases. At the same particle size, the NSDD exhibits an approximately change with different wind speeds under three voltage types.
It can be noticed from Figure 7 that the NSDD of the porcelain bell jar insulator under DC voltage is the largest, which is similar to the research results of Literature [10] and it increases with the increase in particle size at a same wind speed. When the particle size is the same, the NSDD under each voltage is positively correlated with the wind speed, that is, the NSDD increases as the wind speed increases. In addition, under the same particle size, the differences of the NSDD under the three kinds of voltage decrease with the increasing wind speed.
It can be seen from Figure 6 and Figure 7 that, with the same wind speed, the overall surface deposit amount of the porcelain three-umbrella insulator and porcelain bell jar insulator were the largest under DC voltage, and the deposition difference between AC voltage and the unelectrified state is very small, which may be related to the different effects of voltage types during the pollution contamination. Under AC voltage, the magnitude and direction of the electric force particle is subjected to constant changes when it moves in a cycle, so the effect of the electric force in the alternating electric field is approximately zero. This means the AC electric field has a small impact on pollution particle contamination, which is consistent with the unelectrified state, while the DC voltage exerts a sustainable effect on the whole movement process of the particle, and the particles are moved and deposited to the surface of the insulators caused by the action of DC electric field force. Thus, the NSDD under DC voltage is larger than those under AC voltage and the unelectrified state. It can be seen that from the difference of the NSDD under different voltage types, under DC voltage, the electric force is the main factor leading to the particles depositing on the surface, while under AC voltage and the unelectrified state, the main factors are the gravity and drag force of the particles.
Figure 6 and Figure 7 also show that, under DC voltage, the overall NSDD of the porcelain three umbrella insulator and porcelain bell jar insulator increases linearly with increasing particle size at the same wind speed, and the NSDD of the porcelain bell jar insulator is larger than that of the porcelain three-umbrella insulator. Possible reasons for this are the difference between the two types of insulators. Compared with porcelain three-umbrella insulator, the porcelain bell jar insulator has a more complex umbrella type, such as the long shed ribs on the lower surface, resulting in a more complex flow field and more irregular vortex, so the particles collide easily and are evenly deposited on the wall when it movess near the lower surface, while the umbrella-type of porcelain three-umbrella insulator is smoother, which means they exert a better aerodynamic performance. Therefore, the NSDD of the porcelain bell jar insulator is larger than that of the porcelain three-umbrella insulator under the same conditions.

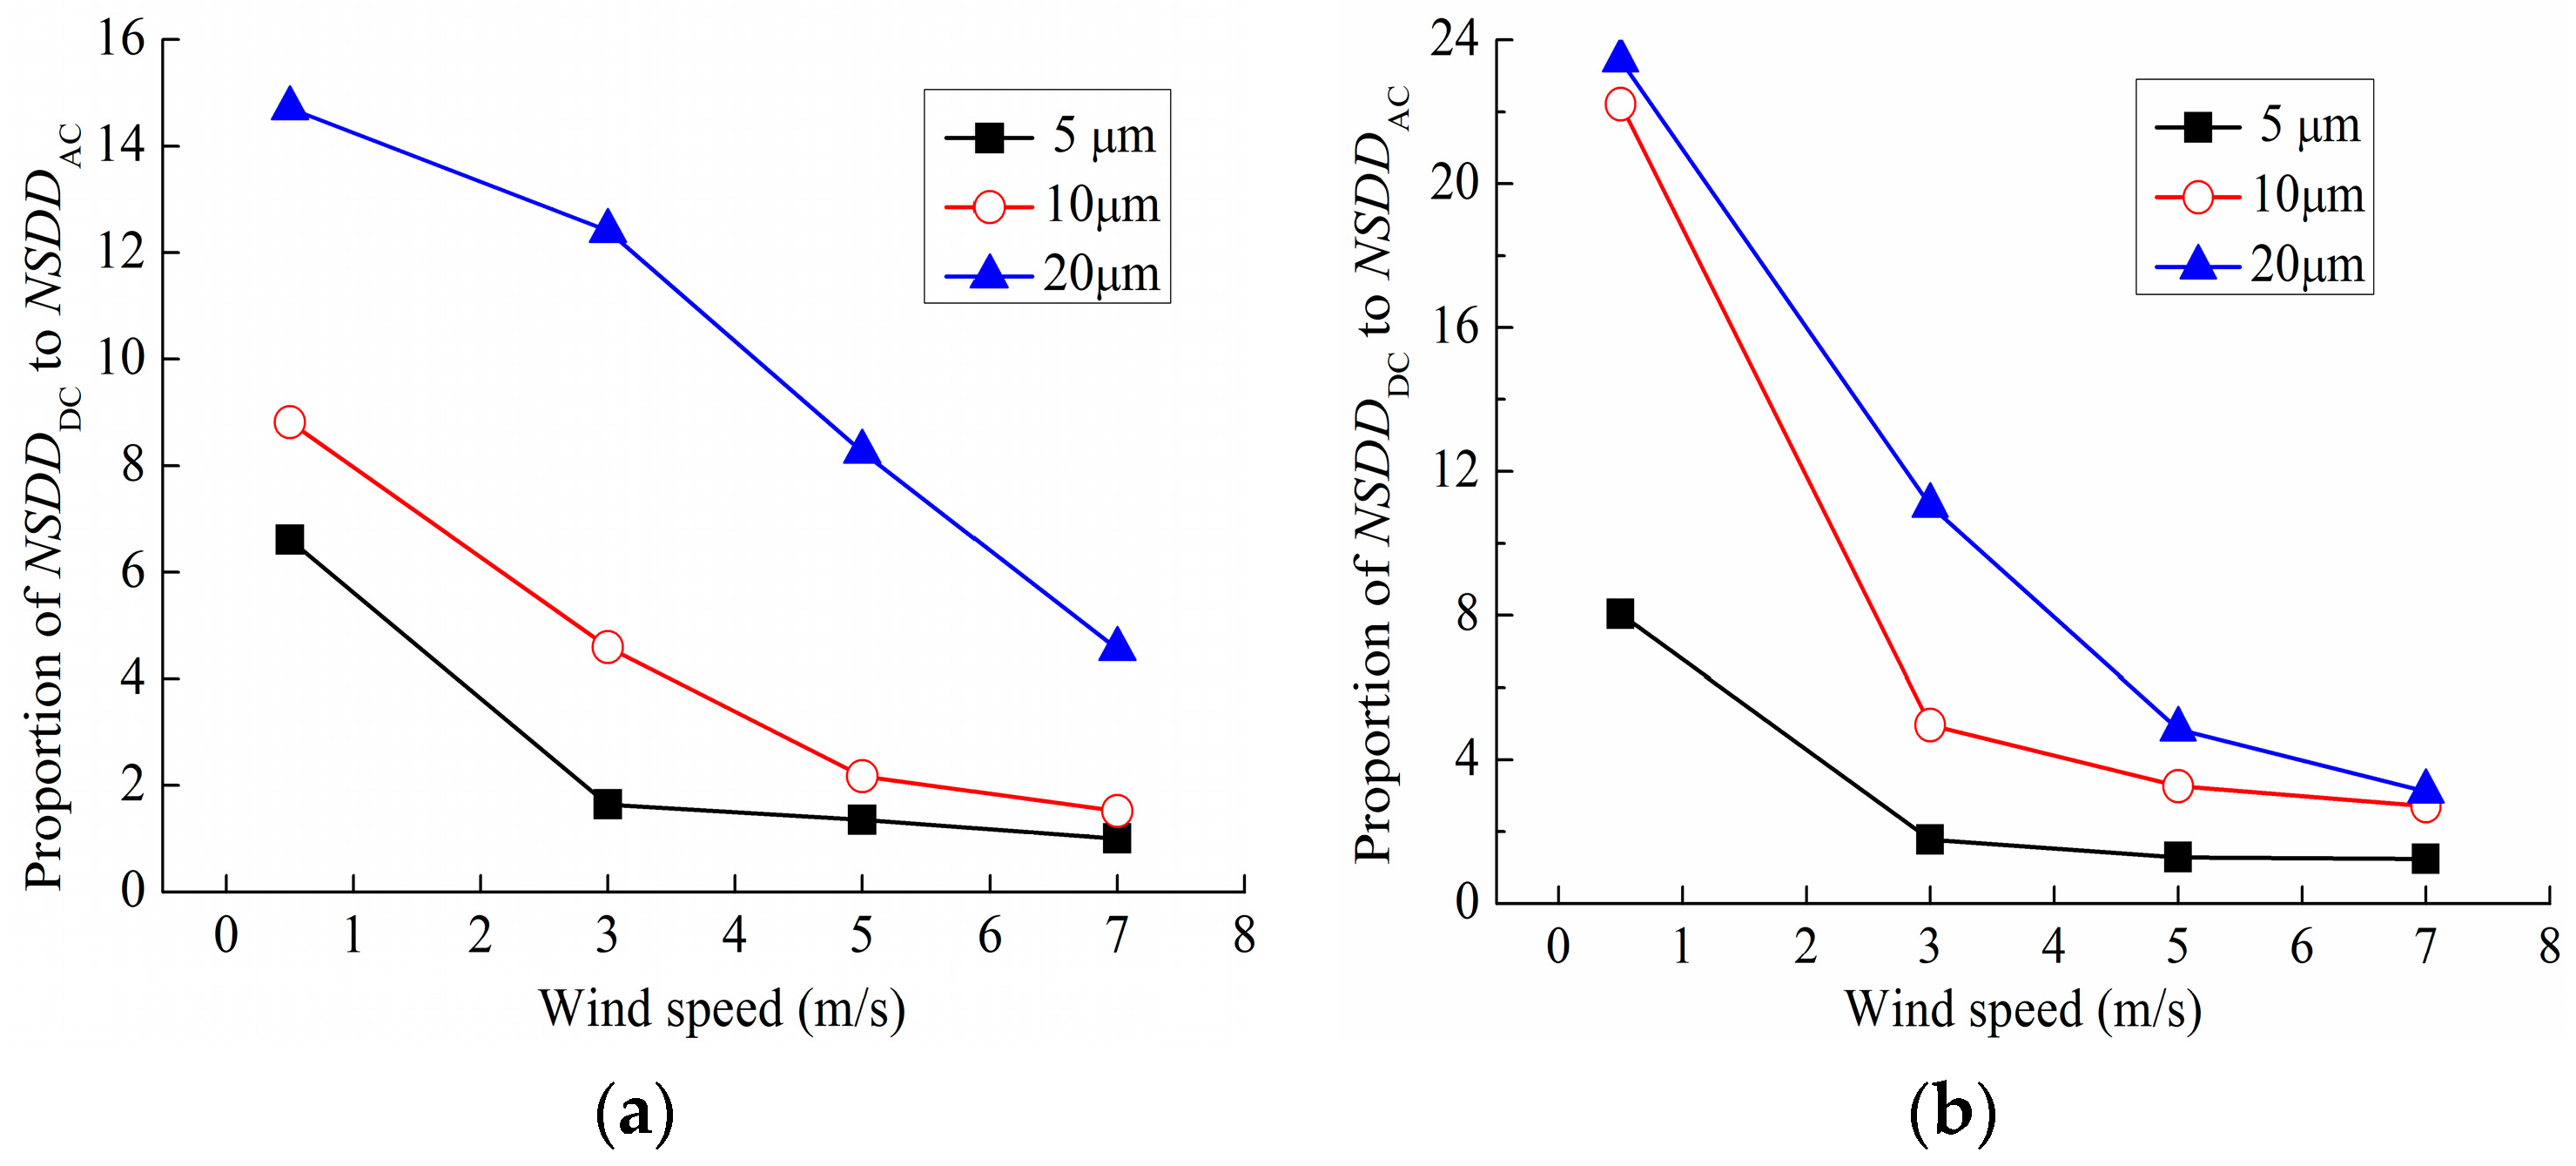
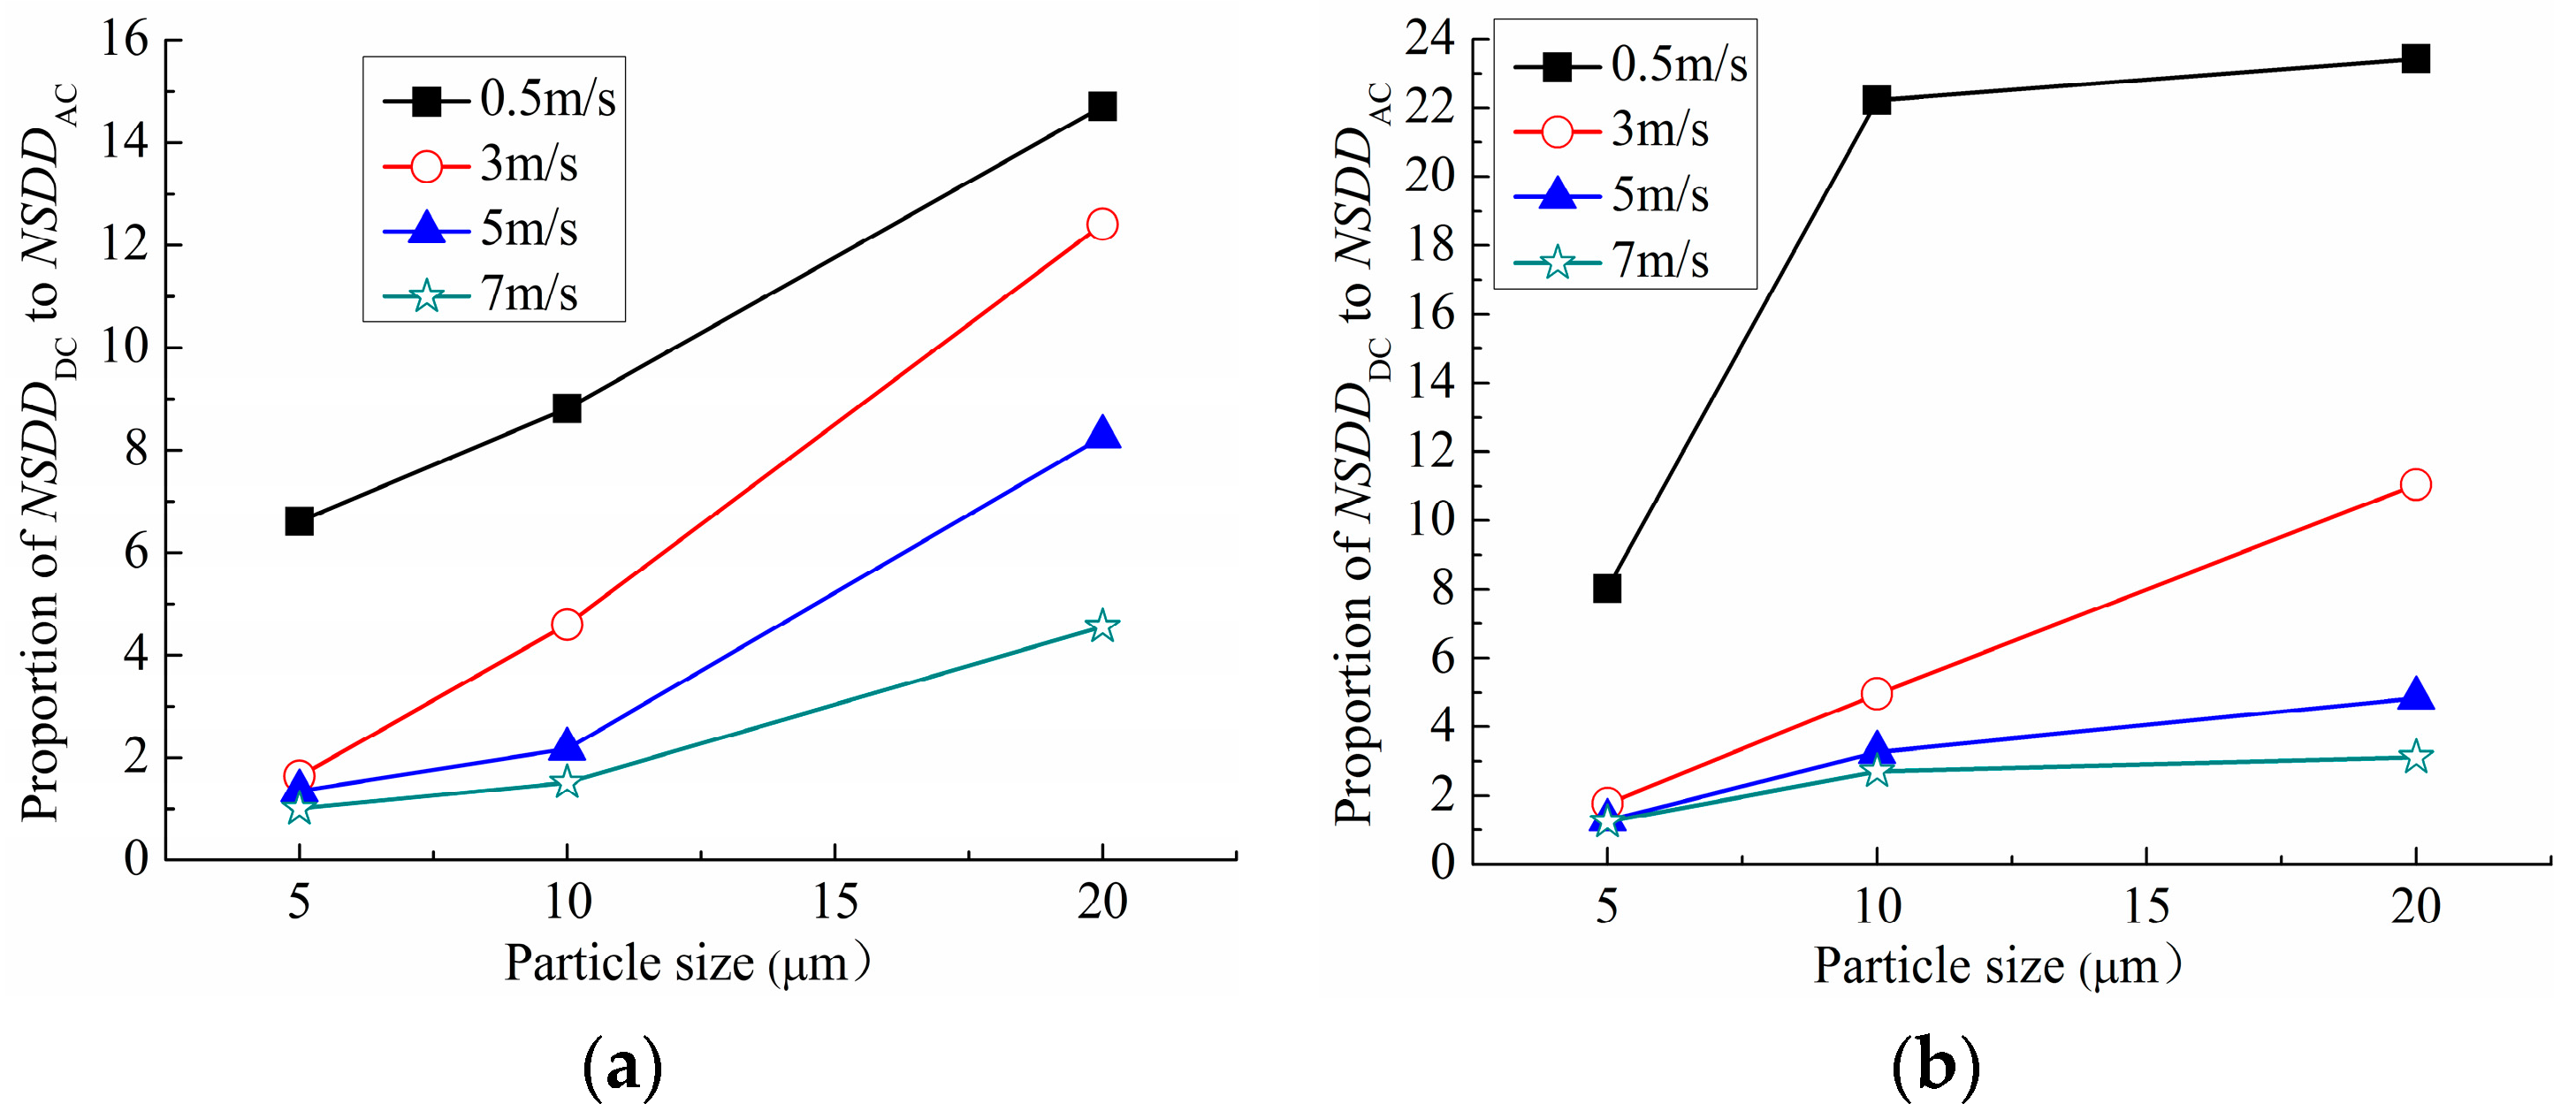
4.2.2. Studies on the Proportion of NSDDDC to NSDDAC

The gravitational force, drag force, and electric force of the particle are related to its particle size and the electric force of the particle is proportional to the square of its size [25]. The effects of the DC and AC voltage on the particulate contamination can also be reflected by the ratio of the proportion of NSDDDC to NSDDAC. Figure 8 and Figure 9, respectively, show the changing curves which the proportion of NSDDDC to NSDDAC of the porcelain three-umbrella insulator and porcelain bell jar insulator versus wind speed and particle diameter.
Figure 8 reveals that, at the same particle size, the proportion of NSDDDC to NSDDAC of the porcelain-three umbrella insulator and porcelain bell jar insulator both decreases with increasing wind speed, and the greater the wind speed, the more slowly the proportion of NSDDDC to NSDDAC changes. This shows that the difference of the NSDD under DC and AC voltage decreases with the increase in wind speed at the same particle size. When the speed increases to a certain critical speed, the effect of the two voltages may be approximately similar. Then, the impact of voltage type on the pollution accumulation was smaller, even can be ignored (especially the porcelain bell jar insulator). This is because at the same particle size, the flow field near the insulator became strong with increasing wind speed, and the flow field becomes more complex due to the existence of the vortex. Then, the drag force increases, but the change of the electric force imposed on particles decreases with increasing wind speed. When the speed increases to a certain speed, the electric force is smaller than the drag force, even can be ignored. Therefore, when the wind speed is larger, the particles collide and deposit on the insulator surface mainly owing to the coupling effect of the drag force and gravity force at a same particle size.
Figure 9 demonstrates that, when the particle size is smaller (≤10 µm), the proportion of NSDDDC to NSDDAC of the porcelain three-umbrella insulator and porcelain bell jar insulator increases with increasing the particle size at the same wind speed. When the particle size is larger (>10 µm), the proportion of NSDDDC to NSDDAC of the porcelain three-umbrella insulator has a larger increase amplification with the increase in particle size, which means there is a larger difference between DC voltage and AC voltages, while the proportion of NSDDDC to NSDDAC of the porcelain bell jar insulator has a small increase in amplification at a very slow change rate with increasing particle size, which means there is a small difference between different voltage types. Under the same conditions, the difference of the degree in the increase of the proportion of NSDDDC to NSDDAC of the two types of insulators may be caused by the differences in their own umbrella structure.
When wind speed is the same and the particle size is small, the electric field force the particle suffers is small. With the increase of particle size, on the one hand, the charge quantity carried by the particles increases, so the electric field force is increased. On the other hand, the increase in particle size also makes the corresponding increase in the gravity of particles. Therefore, at the same wind speed, as the particle size increases, the increase in electric field force and gravity enhance the deposition of pollution particles. However, at this time, drag force also affects the deposition of particles, and with the role of the electric field force, the relative size of gravity together affect the proportion of NSDDDC to NSDDAC under DC voltage and AC voltage.

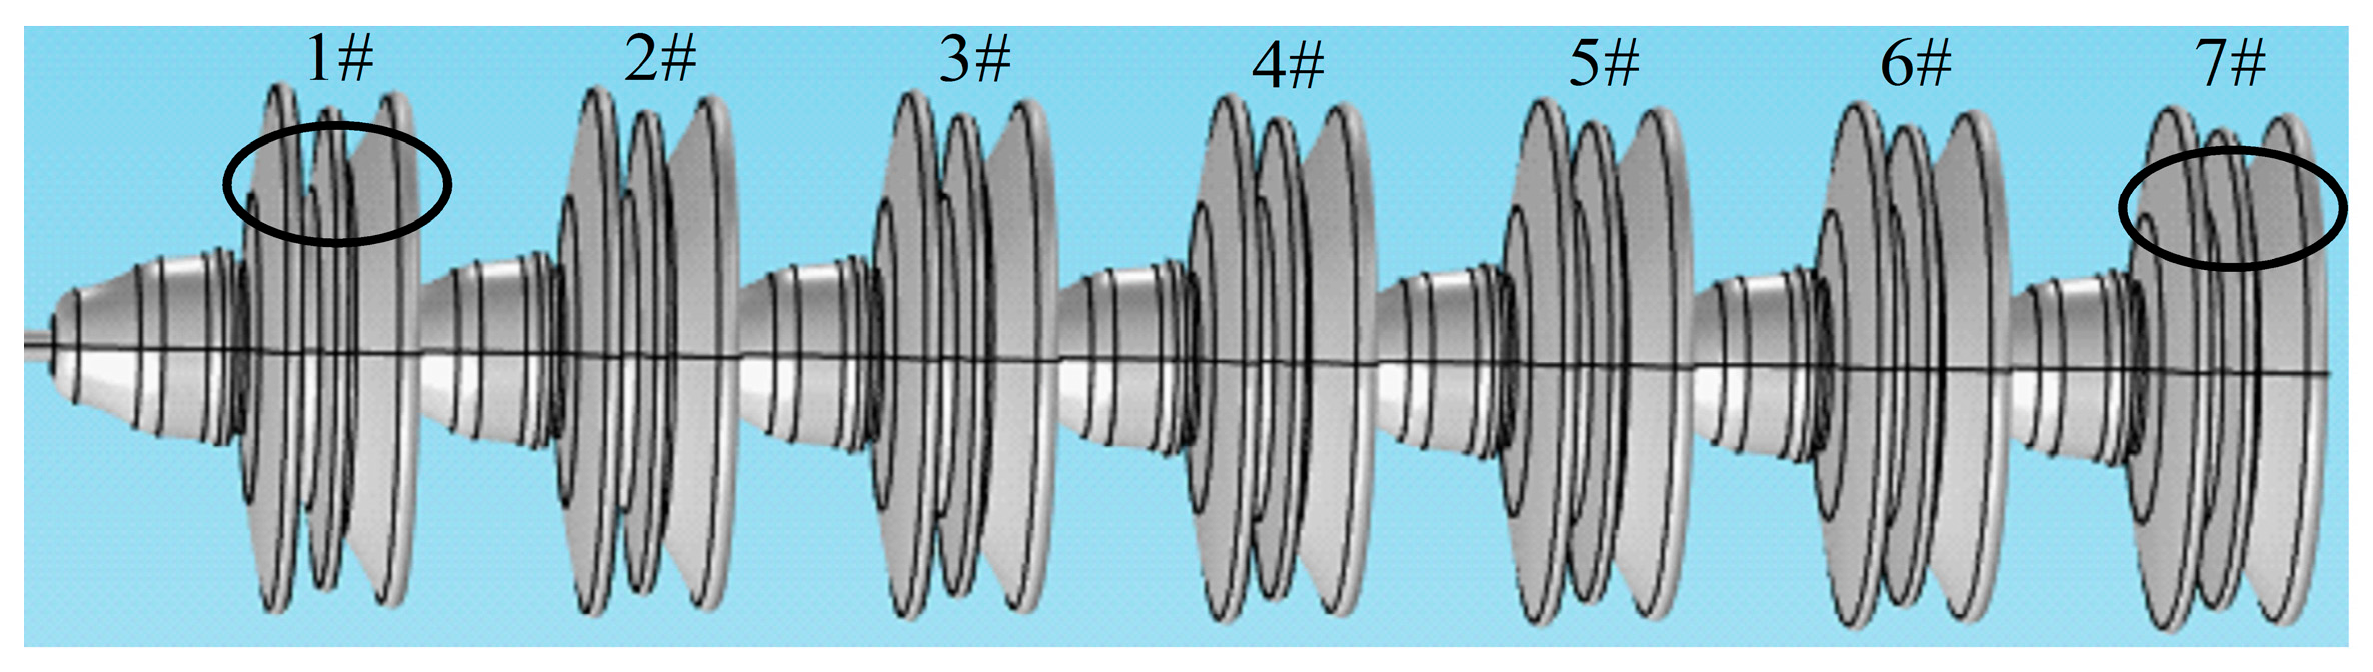
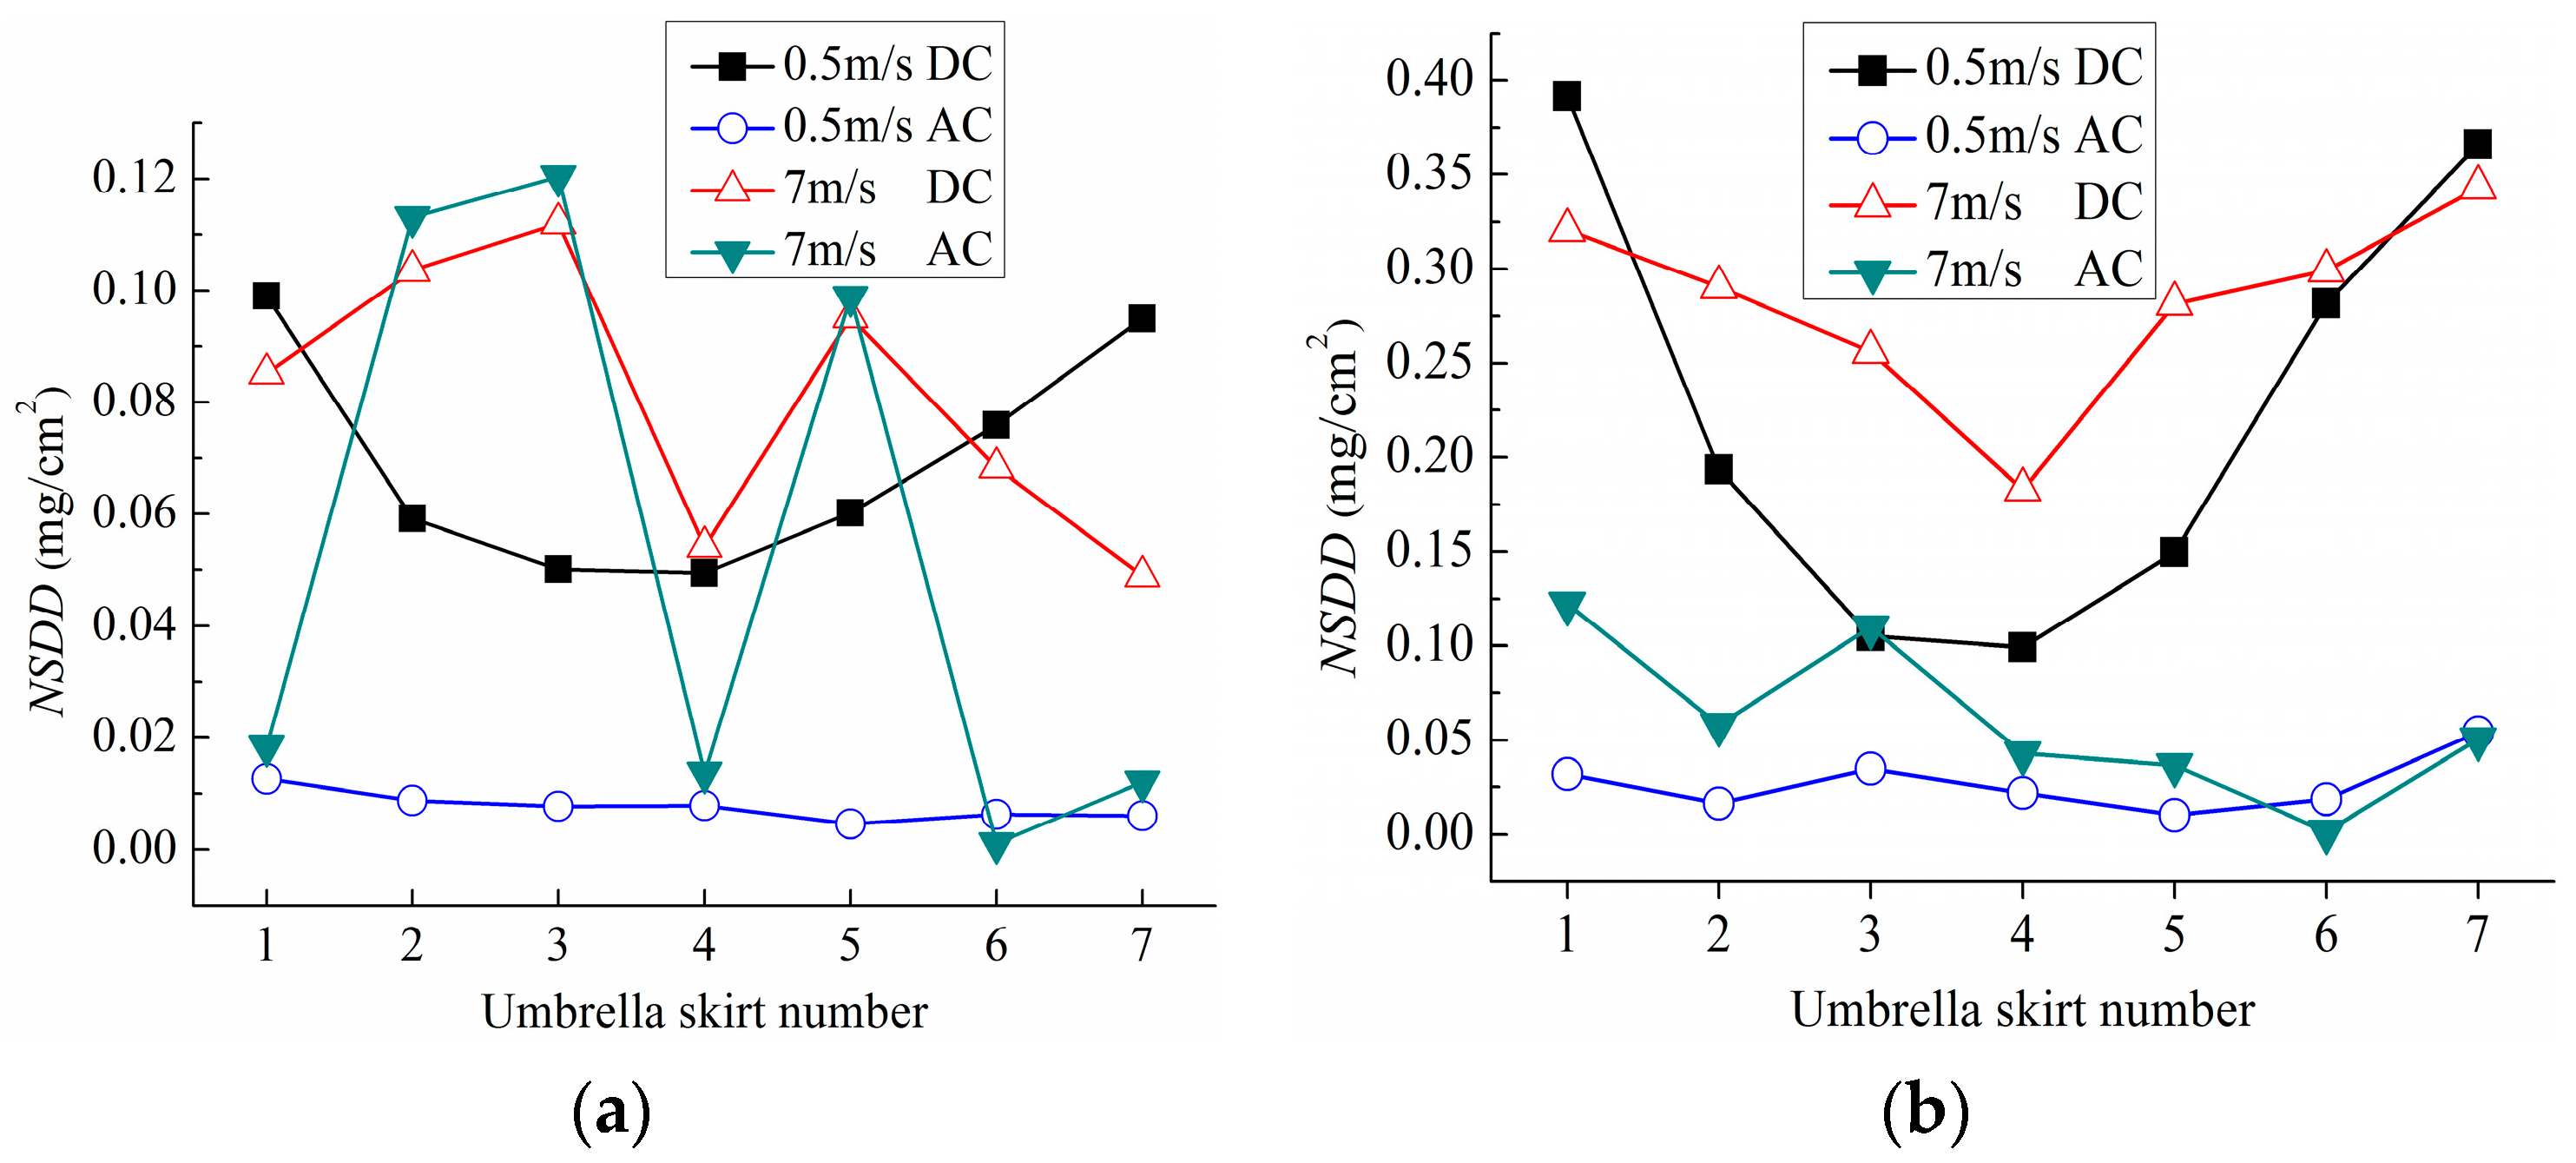
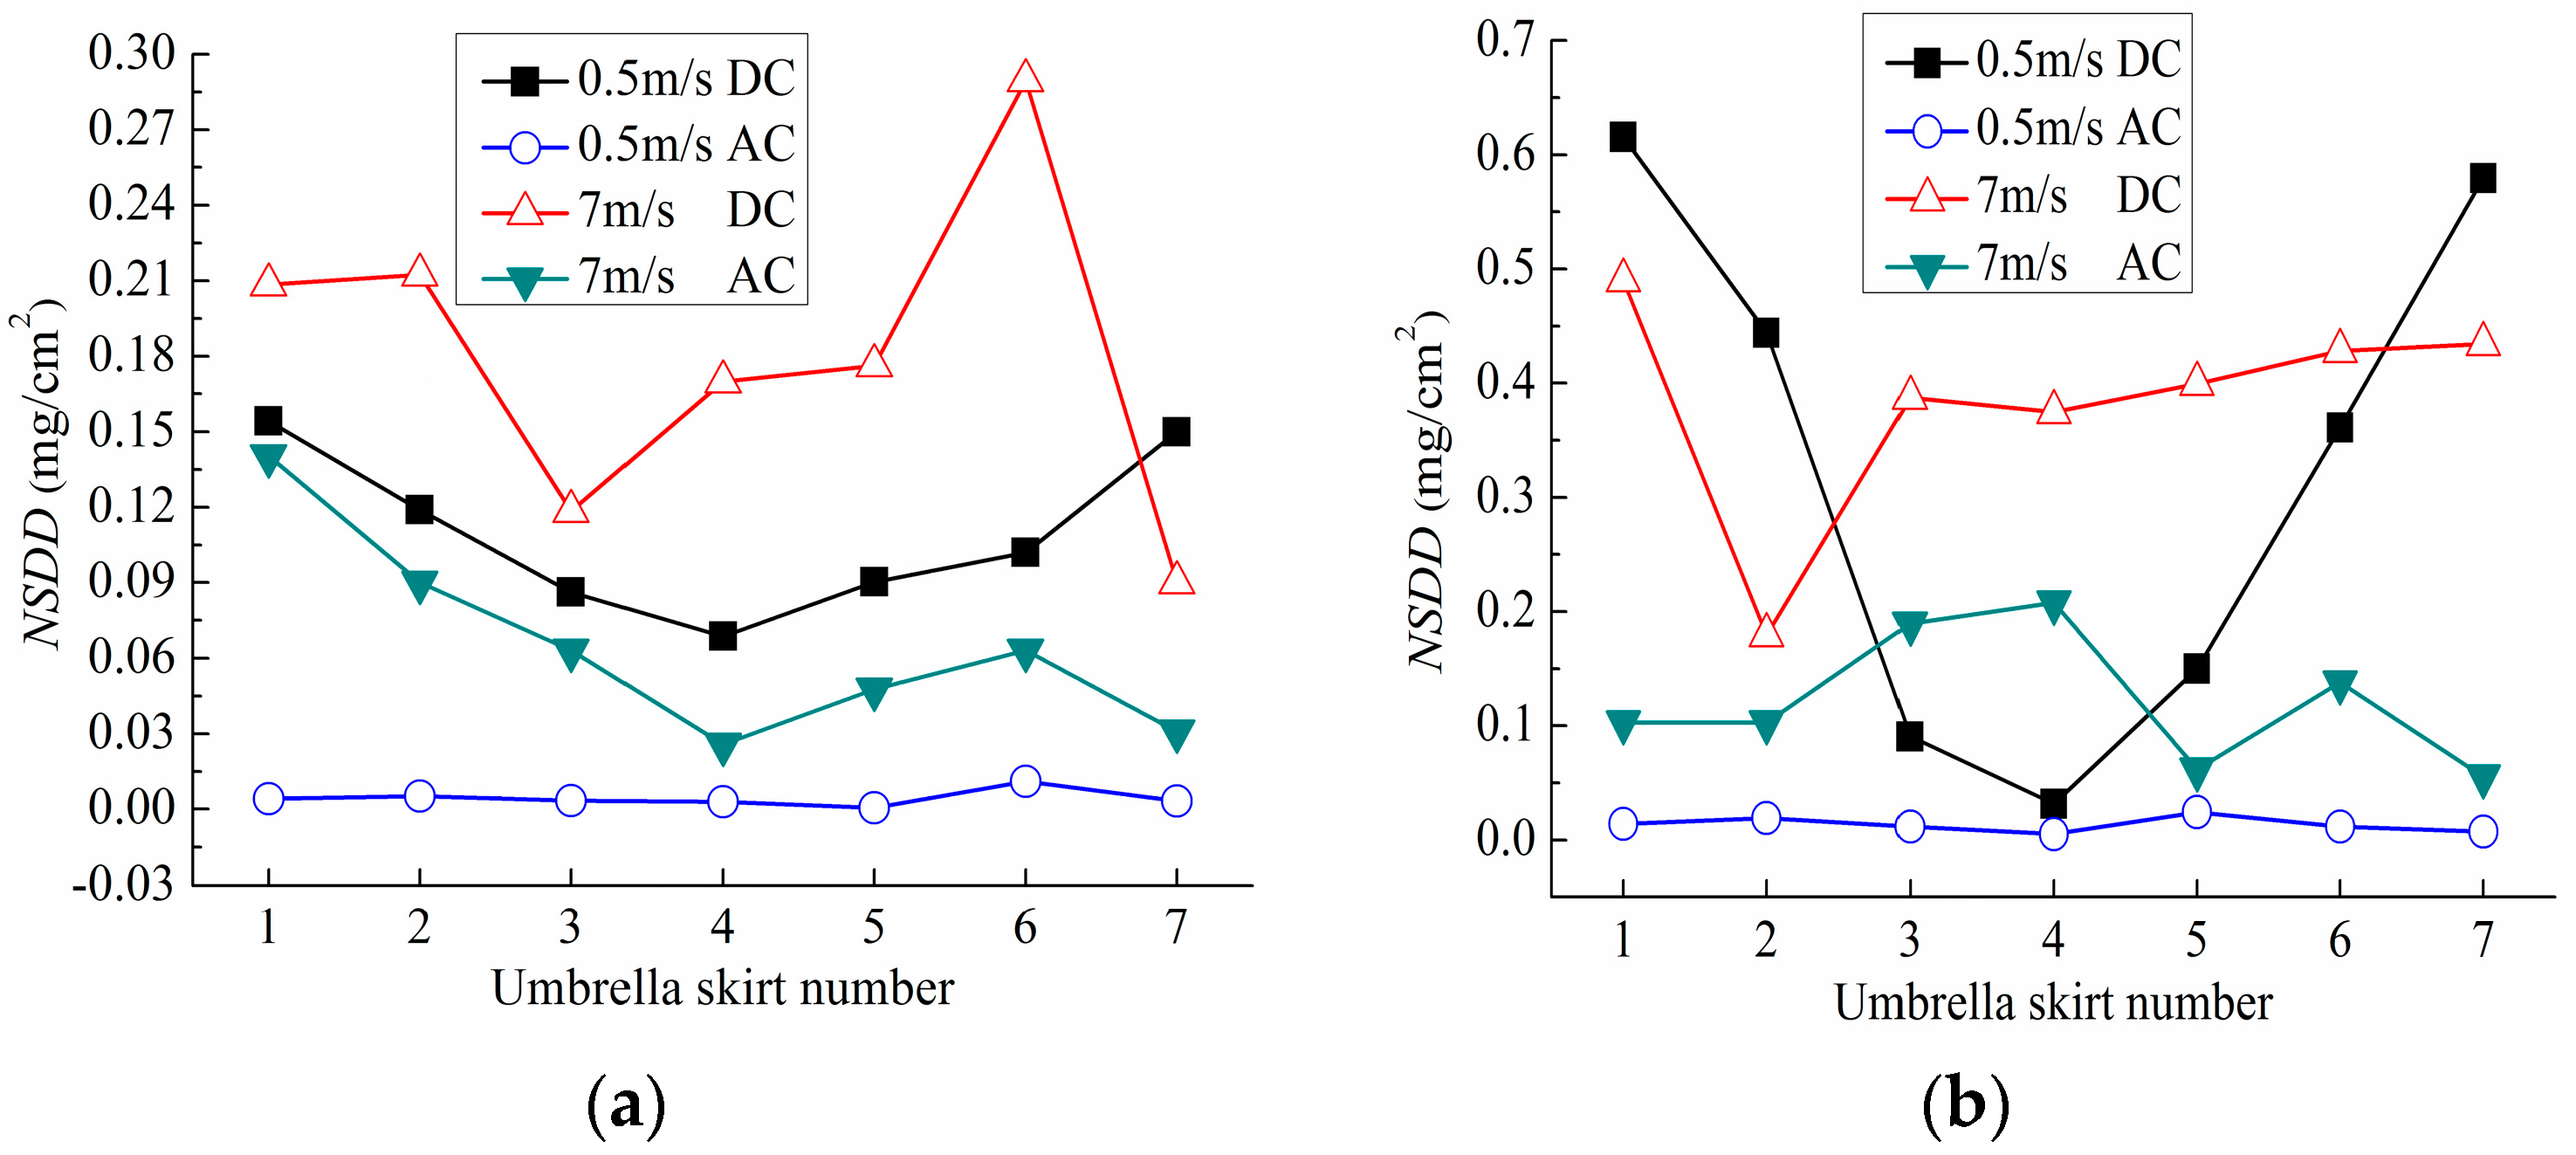
4.2.3. Distribution Law of the Contamination along the Insulator Skirt

Figure 10 and Figure 11 show the distribution law of the porcelain three-umbrella insulator and porcelain bell jar insulator along the umbrella skirt when the wind speed is 0.5 m/s and 7 m/s and the particle size is 10 µm and 20 µm, respectively.
It can be observed from Figure 10 that with the particle size of 10 μm and wind speed of 0.5 m/s, under DC voltage, the deposit amount along the porcelain three-umbrella insulator skirt displays a U-shaped distribution, while the NSDD of each skirt under AC voltage is almost the same, and the difference is quite small. Additionally, the NSDD of each umbrella skirt under DC voltage is larger than that under AC voltage. When the wind speed increases to 7 m/s, compared with the wind speed of 0.5 m/s, the difference between the two curves of NSDD under DC voltage and AC voltage decreases. However, the U-shaped distribution disappears at this time. When the particle size is increased to 20 μm, and the tested wind speed is 0.5 m/s and 7 m/s, NSDD on each umbrella skirt under AC voltage is smaller than that under DC voltage, and the U-shaped distribution along the umbrella skirt under the wind speed of 0.5 m/s is more obvious than that of the 7 m/s.
Figure 11 reveals that when the wind speed is 0.5 m/s and particle size is 10 μm and 20 μm, the NSDD distribution along the porcelain bell jar insulator umbrella skirt is in the shape of the letter “U” under DC voltage. Additionally, take the middle umbrella skirt, that is, the #4 umbrella skirt, as the axis, the deposit amount on the remaining six umbrella skirts is almost a numerically equal symmetrical distribution. However, under AC voltage, the NSDD of each skirt is almost zero. When the wind speed is 7 m/s, the U-shaped distribution under the two particle sizes disappears, and at this wind speed, when the particle size is 10 μm, NSDD on the #6 umbrella skirt near the high voltage side is the most, while the deposit amount along the umbrella skirt under the AC voltage is approximately L-shaped distribution. What‘s more, when the particle size is increased to 20 μm, the contamination amount of #1 umbrella skirt which is near the ground side is the largest, and it shows an approximately L-shaped distribution along the insulator skirt.
A comparison of Figure 10 and Figure 11 suggest that, when the particle size is 10 μm, under DC voltage, and with the wind speed of 0.5 m/s, the NSDD of the above two insulators along the skirt showed a U-shaped distribution. This is related to the U-shaped distribution of electric field along the insulator. Of the hanged seven pieces insulators, the high-voltage side and the ground side are occupied by the larger voltage share, so the field strength is stronger. The strong electric field will lead to the charging of uncharged particles and increasing the number of charged particles. At this small wind speed, drag force the particle suffered is small, so the particle displays weaker following behavior in the flow field. Under the action of strong electric field, the charged particle moves to the surface of the insulator and it is difficult to be separated. Therefore, the NSDD on the #1 and #7 umbrella skirts is relatively larger. When the wind speed increases to 7 m/s, turbulent flow field in the high voltage side is enhanced, the drag force of the particle is larger, and the follow-ability is better. At this time, compared with the strong flow field, the electric field is relatively weak. Particles are directly blown through the insulator without deposition, so the pollution amount of the high-pressure side is small, and the U-shaped distribution also disappeared. In addition, under AC voltage, at the wind speed of 0.5 m/s and a particle diameter of 10 μm and 20 μm, when the particles in the alternating electric field have a periodic motion, the effect of the electric field force is approximately equal to zero. Meanwhile, the drag force that the particle is subjected to is quite small at this wind speed, so the gravity force mainly leads to particle deposition. Therefore, there is small difference in the pollution amount under AC voltage.
With the particle size of 20 µm and the wind speed of 0.5 m/s, contamination of the insulators under DC voltage is U-shaped distribution along the umbrella skirt, and the deposit amount of each umbrella skirt under this voltage is greater than that under AC voltage. When wind speed increases to 7 m/s, the deposit amount of porcelain three-umbrella insulator shows an approximate U-shaped distribution along the skirt, while the porcelain bell jar insulator accumulation along the umbrella skirt is almost an l-shaped distribution. This is because the contamination deposition is the result of the combined effect of the force, gravity, and drag force on the particles. In addition, the larger difference between the umbrella structures of the two insulators, especially the bottom surface structure, may be the reason for the difference in the pollution distribution law.

5. Conclusions

The numerical simulations of the pollution characteristics on porcelain three-umbrella insulator and porcelain bell jar insulators under the campus wind tunnel condition and natural condition were carried out by using the simulation software COMSOL. The comparison between simulated results and tested results demonstrates that the simulation method and model are reasonable. Based on the results, contamination accumulation characteristics in the natural accumulation period were analyzed. The main conclusions are as follows:
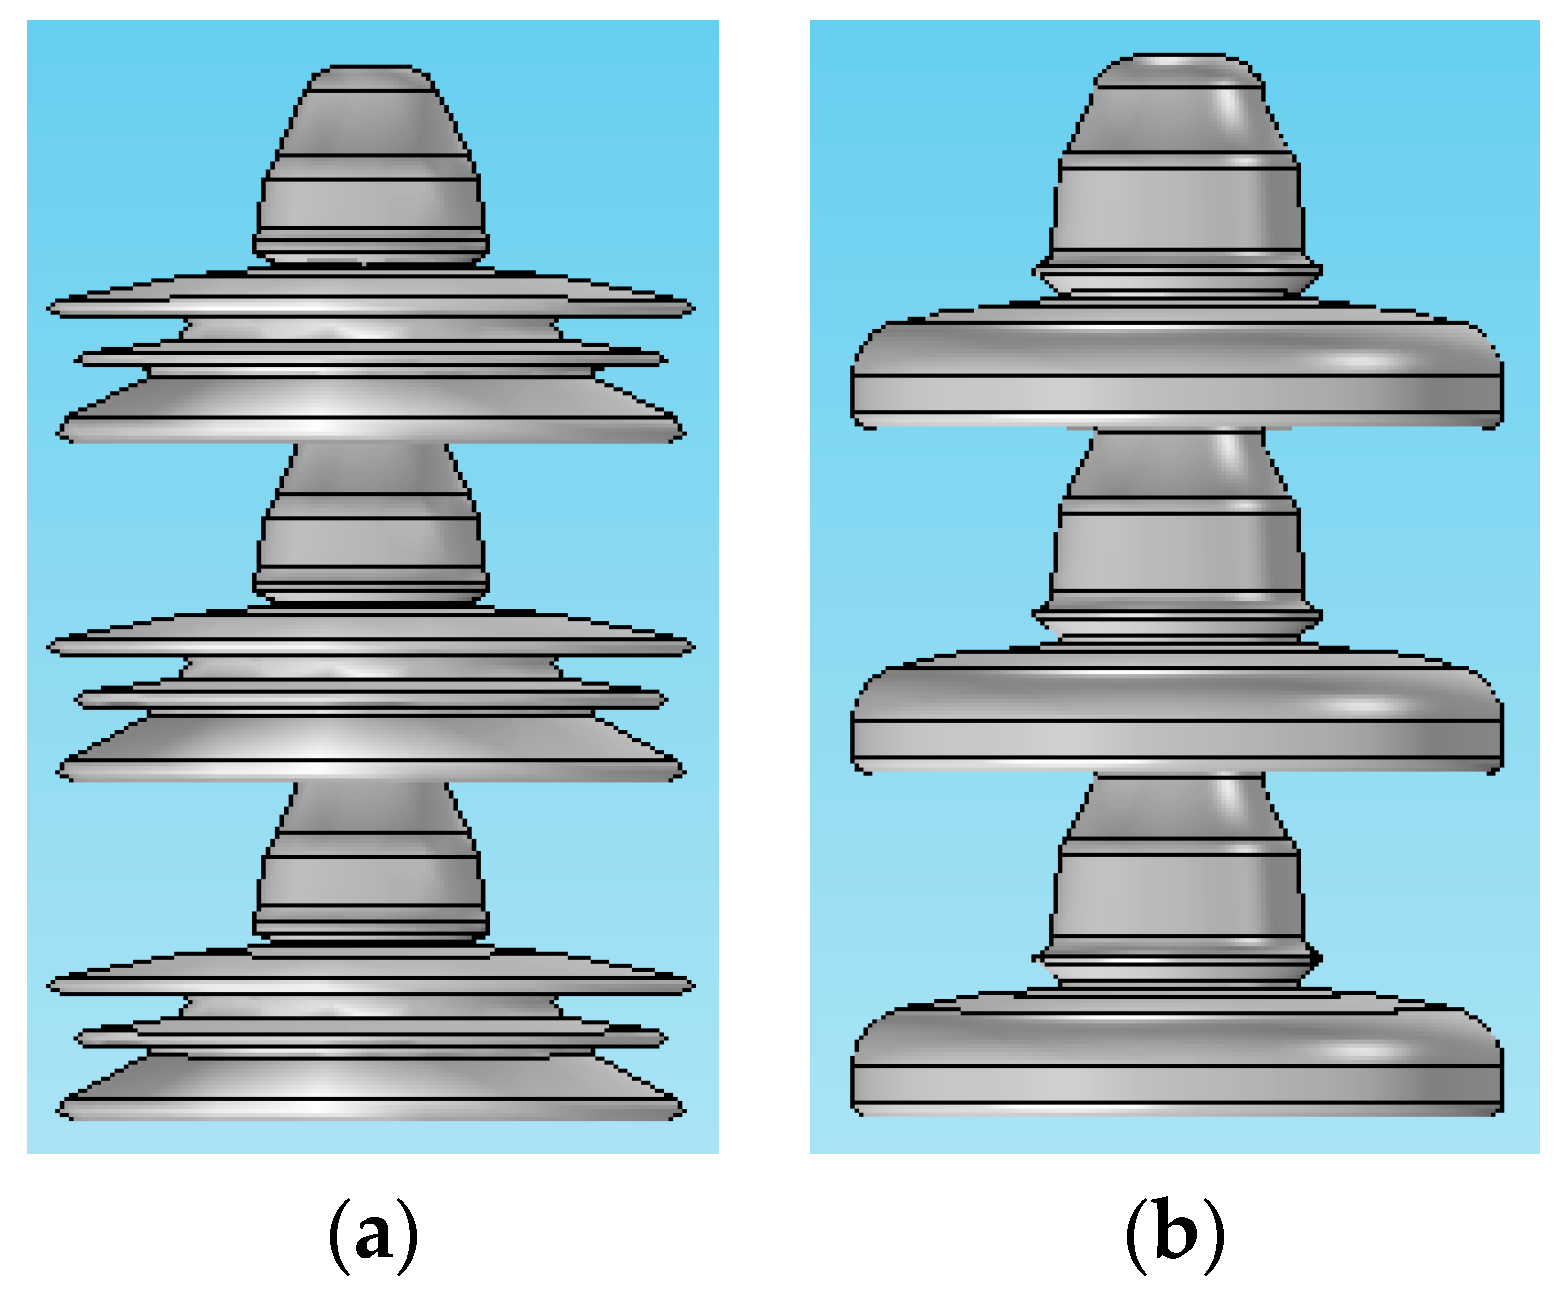
  • At the same wind speed, under DC voltage, the deposit amount on the porcelain bell jar insulator is larger than that of the porcelain three umbrella insulators. Additinoally, the NSDD increases with the increase in particle size, and displays approximately a linear change.
  • Under a small wind speed (≤7 m/s) and small particle size (≤20 µm), the deposition effect of electric force on the particles under DC voltage are the main factors. However, the gravity force and drag force mainly lead to particle deposition under AC voltage and unelectrified state.
  • The proportion of NSDDDC to NSDDAC of porcelain three-umbrella insulator and porcelain bell jar insulator decreases as the wind speed increases at the same particle diameter, while it increases as the particle diameter increases at the same wind speed.
  • When the wind speed is 0.5 m/s, the NSDD on the porcelain three-umbrella insulator and porcelain bell jar insulator along the strings display a U-shaped distribution, while the deposition amount difference on each skirt under AC voltage is quite small. At the wind speed of 7 m/s, U-shaped distribution gradually disappears.

Acknowledgments

The authors thanked China Electric Power Research Institute and North China Electric Power University for providing support. This work was supported by technology research team Program of STATE GRID Corporation of China (grant number GY7111053).

Author Contributions

All authors planned the study; Yukun Lv contributed to the discussion, provided guidance throughout the work, and guided the writing and the data analysis; Weiping Zhao did all the numerical simulations, analyzed the data, and wrote the paper; and Jingang Li and Yazhao Zhang recorded and analyzed some of the data, and offered some advice with respect to the English writing.

Conflicts of Interest

The authors declare no conflict of interest.

References

  1. Xu, S.; Wu, C.; Li, S. Research on pollution accumulation characteristics of Insulators during fog-haze days. Proc. CSEE 2017, 37, 2142–2151. [Google Scholar]
  2. Su, Z. Influences of fog-haze on external insulation of transmission and distribution equipments. Power Syst. Technol. 2013, 37, 2284–2290. [Google Scholar]
  3. Jiang, X.; Shu, L.; Sun, C. Power System Contamination and Ice–Insulation; China Electric Power Press: Beijing, China, 2009. [Google Scholar]
  4. Jiang, X.; Liu, Y.; Meng, Z.; Long, C.; Jin, X.; Zhang, Z. Effect of Fog-Haze on AC Flashover Performance of Insulator. High Volt. Eng. 2014, 40, 3311–3317. [Google Scholar]
  5. Armstrong, M.J.; Ross, C.A.H. Implications of distribution voltage configuration on TeDP electrical systems. Aircr. Eng. Aerosp. Technol. 2014, 86, 501–508. [Google Scholar] [CrossRef]
  6. Hu, C.; Xie, C.; Yuan, C. A review on influence mechanism of haze on external insulation characteristics of transmission and transformation equipment. Power Syst. Prot. Control 2015, 43, 147–154. [Google Scholar]
  7. Bessedik, S.A.; Hadi, H. Prediction of flashover voltage of insulators using least squares support vector machine with particle swarm optimisation. Electr. Power Syst. Res. 2013, 104, 87–92. [Google Scholar] [CrossRef]
  8. Li, H.; Liu, G.; Li, L. Natural contamination deposit law of line disc anti-contamination glass insulator in Guangzhou area. Proc. Chin. Soc. Electr. Eng. Chin. Soc. Electr. Eng. 2011, 31, 118–124. [Google Scholar]
  9. Wang, S.; HU, W.; Gong, J. Natural Pollution Accumulation Characteristics of Overhead Transmission Line Insulator Strings of Zhejiang Electric Power Grid. High Volt. Eng. 2014, 40, 1002–1009. [Google Scholar]
  10. Su, Z.; Liu, Y. Comparison of natural contaminants accumulated on surface of suspension and post insulators with DC and AC stress in northern China’s inland areas. Power Syst. Technol. 2004, 28, 13–17. [Google Scholar]
  11. Zhang, B.; He, J.; Zeng, R.; Liang, X. Voltage distribution along a long ceramic insulator string in a high-voltage tower window. COMPEL Int. J. Comput. Math. Electr. Electron. Eng. 2010, 29, 811–823. [Google Scholar] [CrossRef]
  12. Wang, B.; Liang, X.; Zhang, Y. Natural pollution test of composite and porcelain insulators under AC and DC stress. High Volt. Eng. 2009, 9, 2322–2328. [Google Scholar]
  13. Zhang, R.; Huang, D.; Wu, G. Experimental Research on Natural Contamination Rules of 1000 kV Post Porcelain Insulator. High Volt. Eng. 2015, 41, 3679–3686. [Google Scholar]
  14. Ravelomanantsoa, N.; Farzaneh, M.; Chisholm, W.A. Laboratory investigation of the HV insulator contamination process under winter conditions. In Proceedings of the 2008 International Conference on High Voltage Engineering and Application, Chongqing, China, 9–13 November 2008. [Google Scholar]
  15. Zhang, Z.; Zhang, D.; Jiang, X.; Liu, X. Study on natural contamination performance of typical types of insulators. IEEE Trans. Dielectr. Electr. Insul. 2014, 21, 1901–1909. [Google Scholar] [CrossRef]
  16. Zhang, Z.; Huang, H.; Jiang, X. Analysis of ice growth on different type insulators based on fluid dynamics. Trans. China Electrotech. Soc. 2012, 27, 35–43. [Google Scholar]
  17. Wang, L.; Liu, T.; Mei, H.; Xiang, Y. Research on contamination deposition characteristics of post insulator based on computational fluid dynamics. High Volt. Eng. 2015, 41, 2741–2749. [Google Scholar]
  18. Li, S.; Marshall, J.S.; Ratner, A.; Yao, Q. Molecular dynamics simulation of particle deposition and agglomeration in two-phase dilute flow. J. Eng. Thermophys. 2007, 28, 1035–1038. [Google Scholar]
  19. Hughes, M.P.; Pethig, R.; Wang, X.B. Dielectrophoretic forces on particles in travelling electric fields. J. Phys. D Appl. Phys. 1996, 29, 474–482. [Google Scholar] [CrossRef]
  20. Liu, G. Discrete Element Methods of Fine Particle Dynamics in Presence of van der Waals and Electrostatic Forces. Ph.D. Thesis, Tsinghua University, Beijing, China, 2011. [Google Scholar]
  21. Wang, J.; Chen, L.H.; Liu, Y.; Liang, X.D. Effect of the electric field on the contamination accumulation characteristic of the insulators. High Volt. Eng. 2011, 37, 585–593. [Google Scholar]
  22. Olsen, R.G.; Furumasu, B.C.; Hartmann, D.P. Contamination mechanisms for HVDC insulators. In Proceedings of the IEEE Power Apparatus and Systems Winter Conferences, New York, NY, USA, 30 January–4 February 1977. [Google Scholar]
  23. Babuška, I.; Oh, H.S. The pversion of the finite element method for domains with corners and for infinite domains. Numer. Methods Partial Differ. Equ. 1990, 6, 371–392. [Google Scholar] [CrossRef]
  24. Lv, Y.; Li, J.; Zhang, X.; Pang, G. Simulation Study on Pollution Accumulation Characteristics of XP13-160 Porcelain Suspension Disc Insulators. IEEE Trans. Dielectr. Electr. Insul. 2016, 23, 2196–2206. [Google Scholar] [CrossRef]
  25. Tu, Y.; Sun, Y.; Peng, Q. Particle size distribution characteristics of naturally polluted insulators under the fog-haze environment. High Volt. Eng. 2014, 40, 3318–3326. [Google Scholar]
Figure 1. Schematic diagram of the wind tunnel laboratory.
Energies 10 01045 g001
Figure 2. Insulator models in the wind tunnel, (a) XSP-160; and (b) XP13-160.
Energies 10 01045 g002
Figure 3. Schematic diagram of geometric physical model and boundary condition of low velocity section in the wind tunnel test.
Energies 10 01045 g003
Figure 4. Comparison of the test results and simulation results, (a) porcelain three-umbrella insulator XSP-160; and (b) porcelain bell jar insulator XP13-160.
Energies 10 01045 g004
Figure 5. Insulator skirt number.
Energies 10 01045 g005
Figure 6. NSDD of the porcelain three-umbrella insulator, (a) v = 3 m/s; (b) v = 5 m/s; and (c) v = 7 m/s.
Energies 10 01045 g006
Figure 7. NSDD of the porcelain bell jar insulator, (a) v = 3 m/s; (b) v = 5 m/s; and (c) v = 7 m/s.
Energies 10 01045 g007
Figure 8. Proportion of NSDDDC to NSDDAC versus wind speed curves, (a) porcelain three-umbrella insulator; and (b) porcelain bell jar insulator.
Energies 10 01045 g008
Figure 9. Proportion of NSDDDC to NSDDAC versus particle size curves, (a) porcelain three-umbrella insulator; and (b) porcelain bell jar insulator.
Energies 10 01045 g009
Figure 10. Distribution law of the contamination along the porcelain three-umbrella insulator skirt, (a) dp = 10 µm; and (b) dp = 20 µm.
Energies 10 01045 g010
Figure 11. Distribution law of the contamination along the porcelain bell jar insulator skirt, (a) dp = 10 µm; and (b) dp = 20 µm.
Energies 10 01045 g011
Table 1. The main parameters of the tested insulators.
ModelContents
Structural Height/mmCreepage Distance/mmShed Diameter/mm
Porcelain three-umbrella insulator XSP-160170545330
Porcelain bell jar insulator XP13-160170340280

