In this section, performance of the solo duck WEC without latching and declutching control is first studied as a reference to measure the control effect due to latching and declutching control in subsequent sections.
4.1. Performance without Latching and Declutching Control
When no latching and declutching control is applied, the power-capture ability of the duck WEC can be maximized by simply tuning the PTO moment setup to an appropriate extent, and this is called ‘resistive control’ in this paper. For the linear load, the PTO moment is defined as
where
Bp is the damping coefficient of the PTO system and is called the ‘PTO damping coefficient’ in this paper. Then, the frequency-domain complex amplitude of the duck angular velocity is obtained as
According to [
33], the average captured power of the duck WEC follows
where * represents the complex conjugate. To simplify the expressions, we replace the imaginary part of the denominator of Equation (11) by
Inserting Equation (11) to Equation (12) gives the averaged captured power of the duck WEC
which will be maximized to be
when
Bp satisfies
The power-capture efficiency of the duck WEC can be measured by the Relative Capture Width (RCW), which is defined as
where
Pin is the incident wave power of the unit wave crest. In regular waves, it is [
34]
where
ρ is the water density;
g is the gravity acceleration; and
k is the wave number.
For the coulomb load, the PTO moment is defined as
where
Mp is the moment caused by the hydraulic cylinder in the PTO hydraulic circuit and is called the ‘PTO cylinder moment’ in this paper. To start moving the duck WEC from a still position, the resultant hydrodynamic moment, including the excitation moment, radiation moment and hydrostatic restoring moment, should overcome the PTO cylinder moment
Mp. The averaged captured power of the duck WEC can be calculated as
where
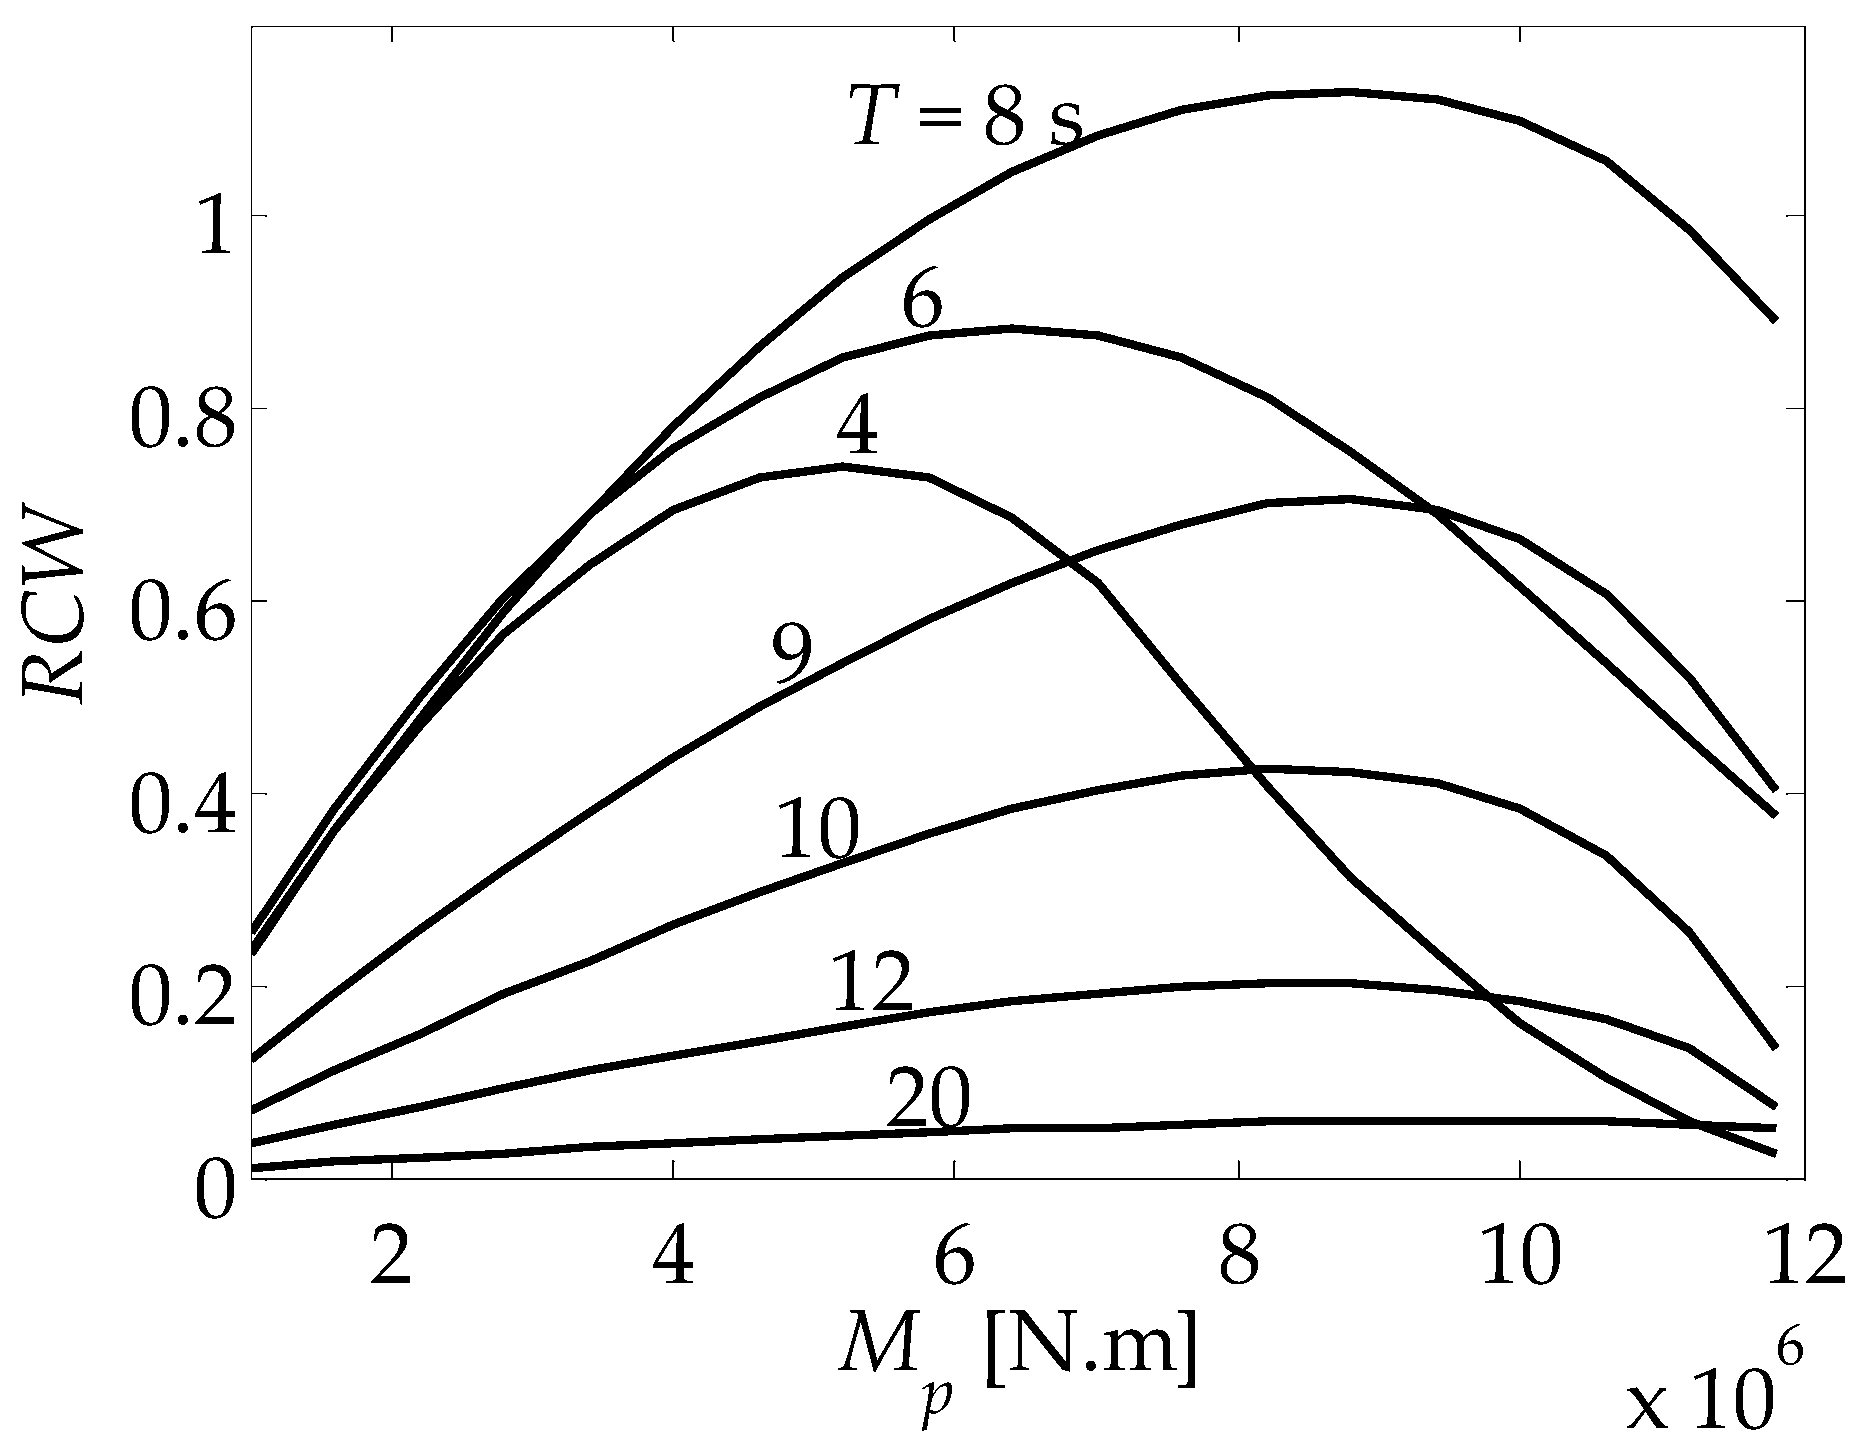
T denotes the wave period. Because of the non-linear behavior of the PTO moment for the coulomb load, the average captured power could not be solved analytically as for the linear load. Here, we numerically find the relative capture width of the duck WEC as a function of the PTO cylinder moment at several typical wave periods, as shown in
Figure 4. It is found that, for a given wave period, the relative capture width is a unimodal function of the PTO cylinder moment. Therefore, the simple derivative-free golden-section search algorithm [
35] is used to find the maximum relative capture width at different wave periods.
In addition to the maximum relative capture width, the peak value of instantaneous performance parameters are paid special attention to in this paper. The peak motion excursion is of significance when motion constraints are considered, as studied in [
36,
37]. The peak PTO moment is a key factor for determining the physical size of the PTO structure so that the peak moment can be effectively resisted. The peak-to-average power ratio defines the volume of the energy-storage system that delivers smoothed power to the grid [
38,
39]. Also, a large peak-to-average power ratio may result in the peak power capacity of the devices greatly exceeding the time-averaged capacity, thus causing low efficiency of the system.
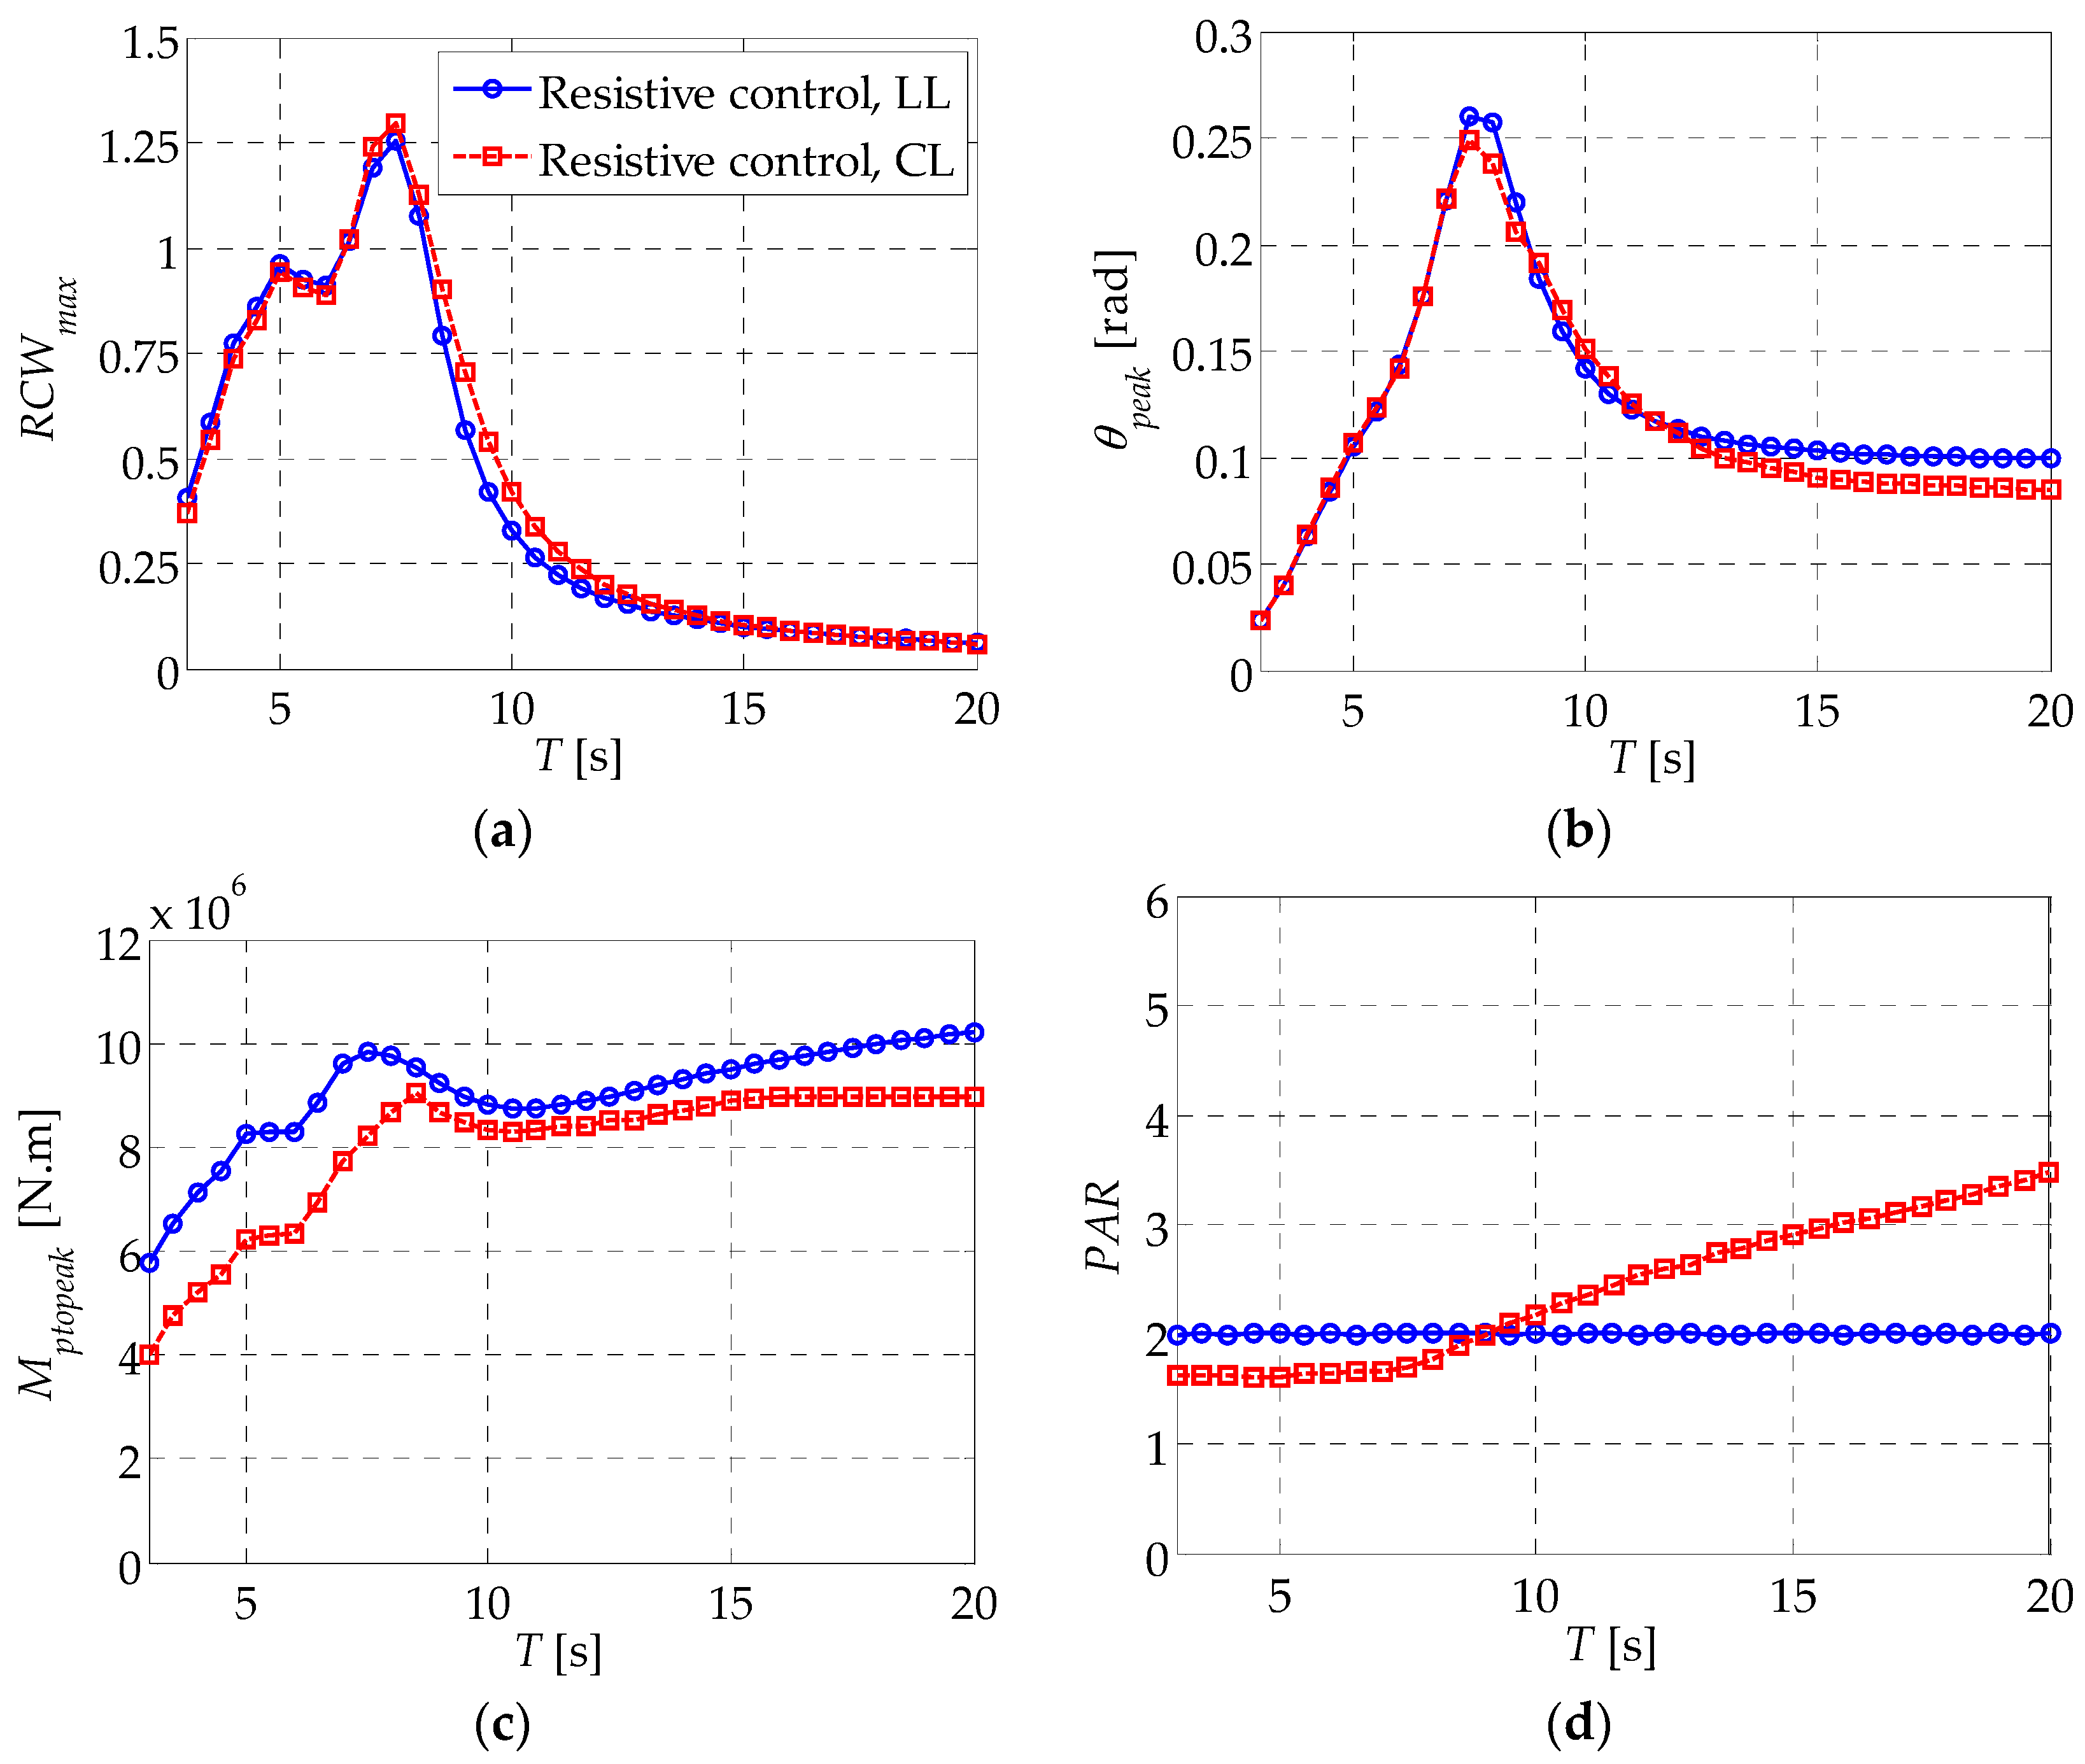
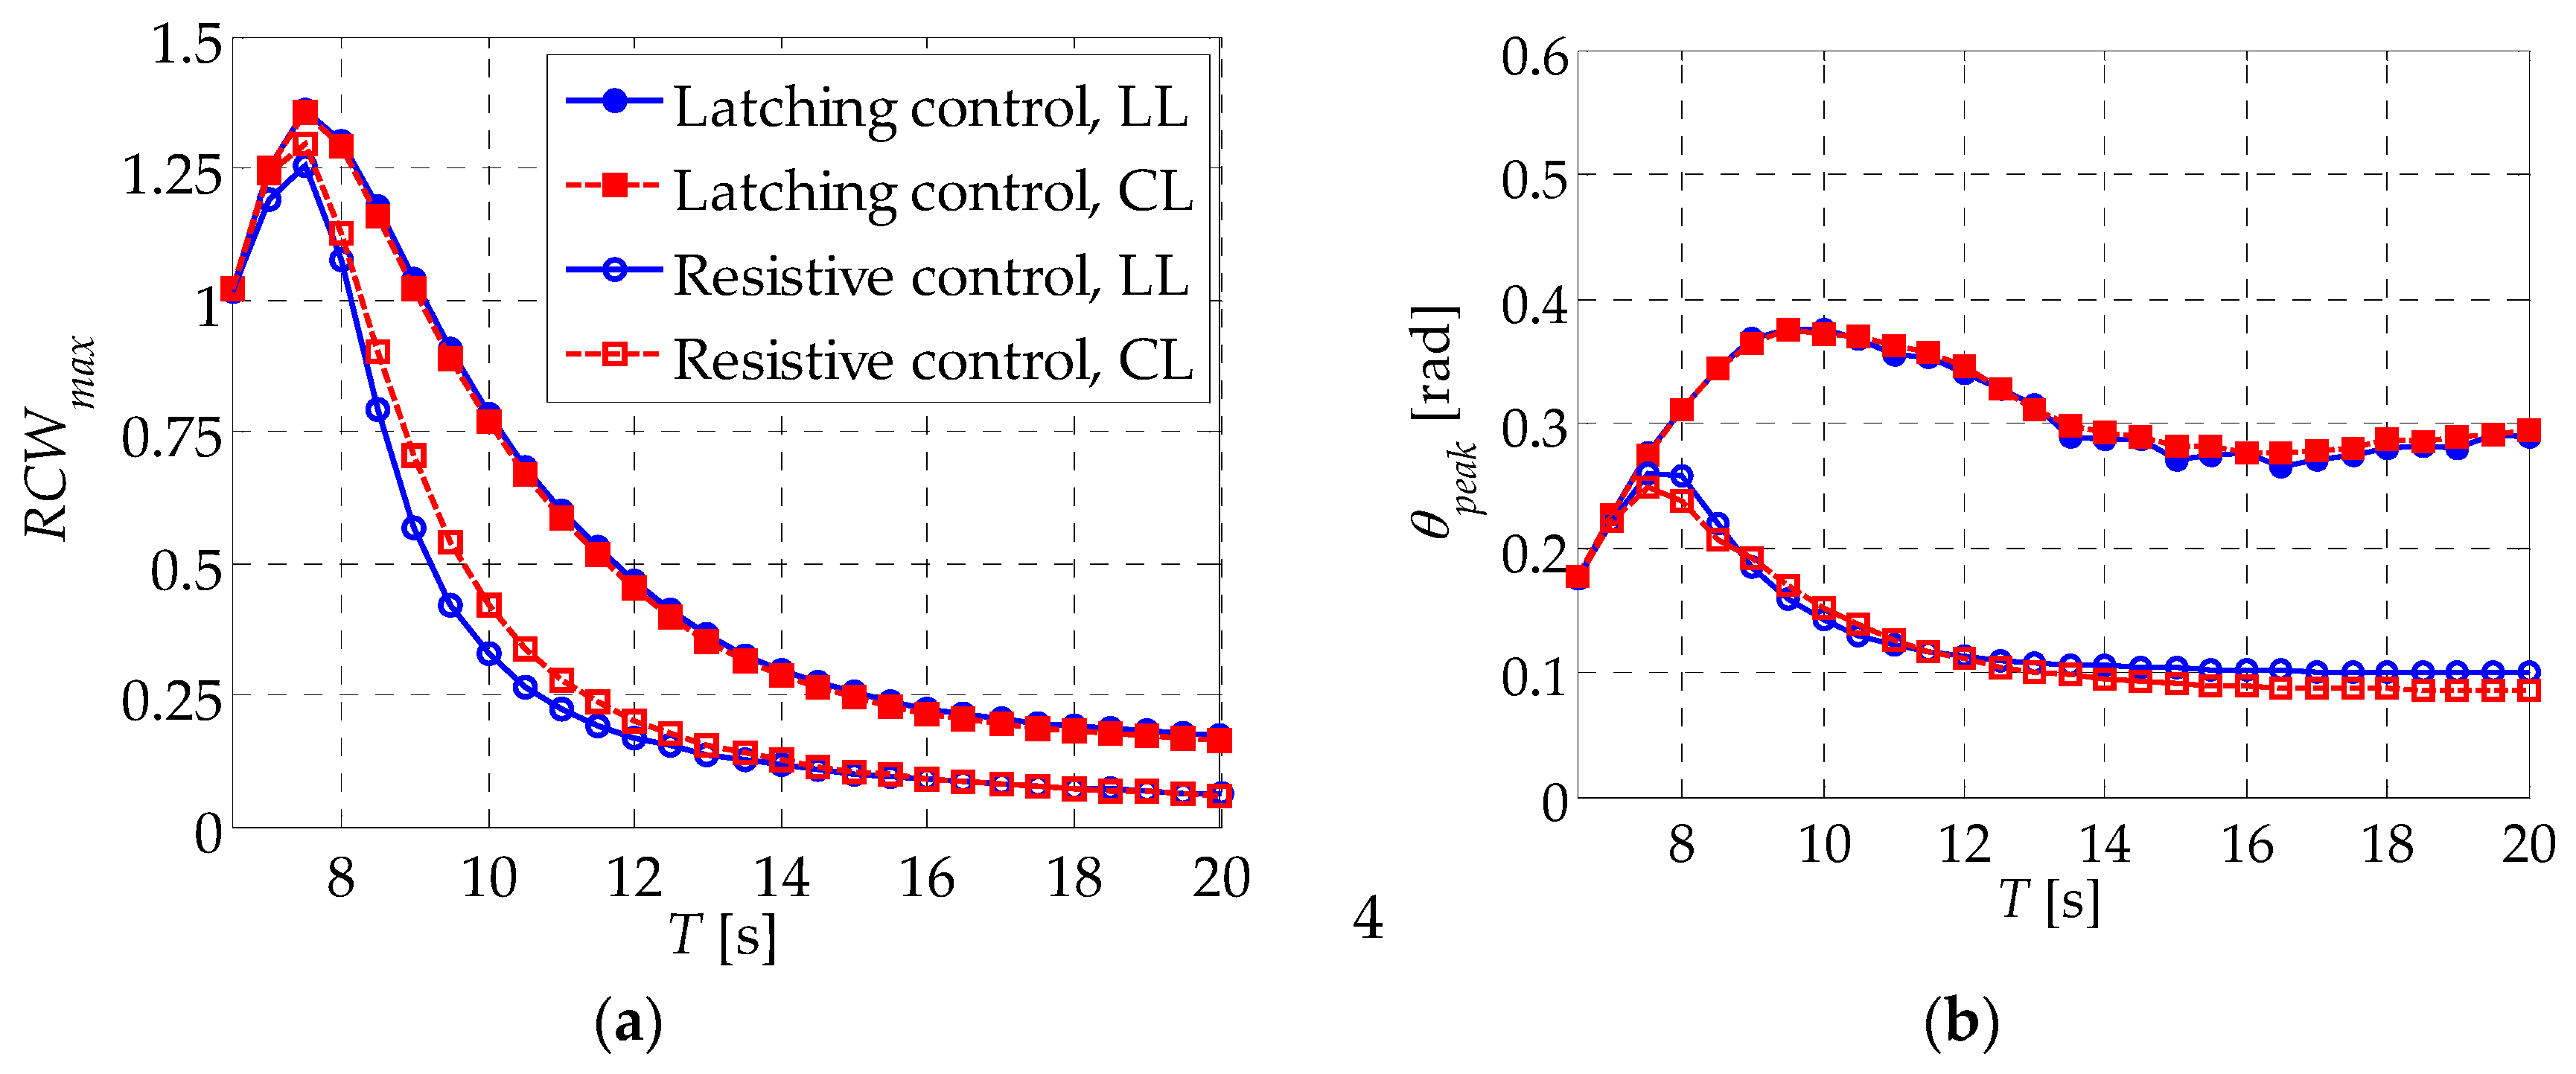
Figure 5 shows the performance of the solo duck WEC as a function of the wave period for different load types when the relative captured width is maximized under resistive control, where
RCWmax is the maximum relative capture width,
θpeak is the peak motion excursion,
Mptopeak is the peak PTO moment, and
PAR is the Peak-to-Average power Ratio. By equating
X in Equation (13) to zero, we find that the natural period of the solo duck WEC
T0 in pitch degree-of-freedom is 6.3 s. This explains the large maximum relative capture width and peak motion excursion within the wave periods from 4 s to 8 s. For wave periods other than from the natural period, the power-capture performance reduces significantly. The maximum relative capture width larger than one confirms the point absorber effect of the solo duck WEC. Hence, the accompanied narrow bandwidth for high power-capture performance is as expected [
11]. One interesting finding is that, despite different load types, the maximum relative capture width and peak motion excursion is quite similar, except at wave periods from 8 s to 11 s for the maximum relative capture width and larger than 12 s for the peak motion excursion, where small deviations are observed. On the other hand, the peak PTO moment and peak-to-average power ratio show relatively large differences. The peak PTO moment for the coulomb load is smaller than that for the linear load, especially at small wave periods. While the peak-to-average power ratio for the coulomb load increases monotonously with the wave period, it keeps at 2 for the linear load as a result of the sinusoidal variation characteristic of the pitch angular velocity.
4.2. Latching Control at T > T0
In this section, latching control is applied to the solo duck WEC for both linear and coulomb loads at wave periods larger than the natural period.
Figure 6 shows the relative capture width as a function of the PTO moment setup, and latching duration for different load types at
T = 10 s, where
tl is the latching duration, during which the WEC is held fixed. Here, ‘PTO moment setup’ is a generic term denoting the PTO damping coefficient for the linear load and the PTO cylinder moment for the coulomb load. Although latching duration can range from zero to half a wave period, i.e., 5 s for
T = 10 s, only 0–4 s is presented here since higher latching duration causes irregular behavior of the pitch angular velocity and low captured power, thus is meaningless in the following investigation. For both the linear and coulomb loads, we find that the relative capture width is a unimodal function near the optimal combination of the PTO moment setup and latching duration that maximizes the relative capture width. Therefore, the maximum relative capture width can be found simply by gradually contracting the variable ranges that contain the solution. Actually, this method uses the same principle as the golden-section search algorithm employed above, but is extended to two dimensions. From
Figure 6, we find that high relative capture width is achieved at a quite narrow range of latching duration of around 2 s, while at a wide range of the PTO moment setup. That means the latching duration should be assigned more accurately than the PTO moment setup to benefit from latching control. Another obvious finding is that, for the coulomb load, when the latching duration is small it almost causes no change of the relative capture width for a given PTO cylinder moment. Actually, this is due to the latching duration being so small that the resultant hydrodynamic moment has not yet been developed to the level that can drive the WEC from still to motion. The duck keeps fixed even after the latching duration until the resultant hydrodynamic moment is sufficiently large, thus variation of the latching duration does not influence the captured power.
Using the method introduced in the above paragraph, we find that the maximum relative capture width is achieved at
tl = 2.02 s,
Bp = 2.08 × 10
7 N·m·s/rad for the linear load and at
tl = 2.10 s,
Mp = 6.22 × 10
6 N·m for the coulomb load when
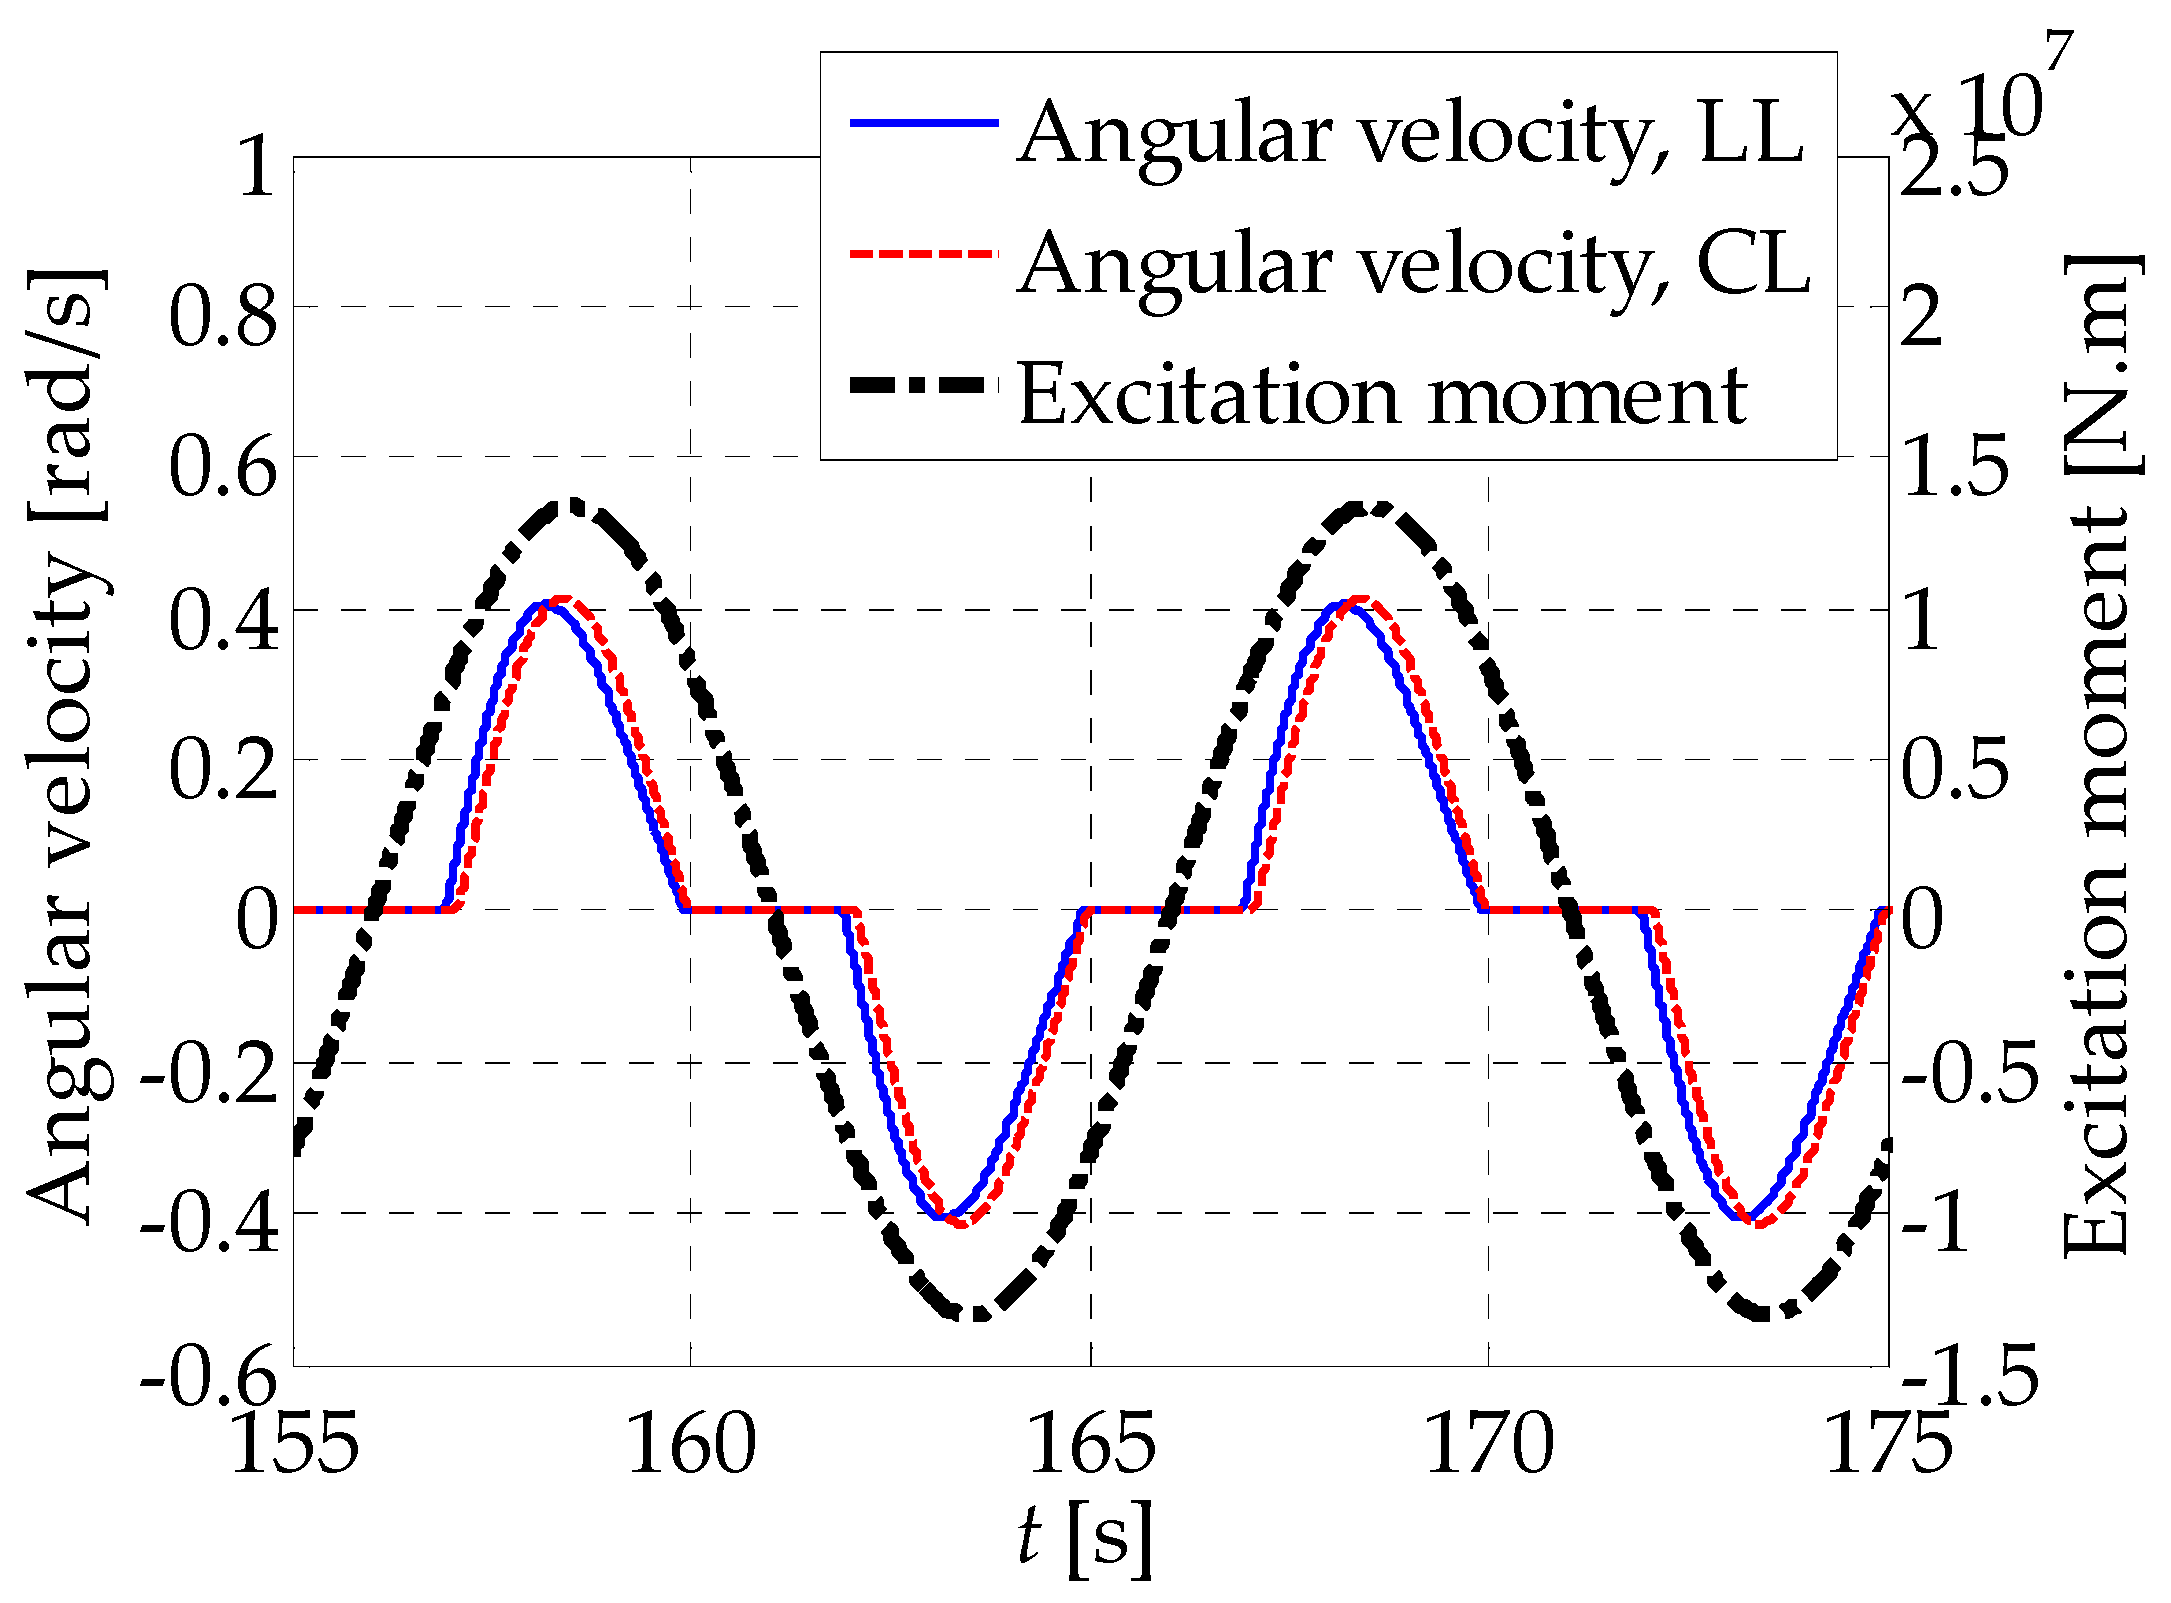
T = 10 s. The time history of angular velocity along with the excitation moment when the maximum relative capture width is achieved for both the linear load and coulomb loads is shown in
Figure 7. It can be seen that the duck is locked for some time after the angular velocity crosses the zero point. One interesting finding is that the angular velocity profiles for the two load types are quite close to each other, and they are both in good phase with the excitation moment. Common sense when it comes to the latching control field suggests the best unlatching instance should advance the time when the excitation force peaks around
T0/4 [
18], so that peaks of the WEC velocity and the excitation force coincide with each other to capture the maximum power. From
Figure 7, we find that the two peaks are closely, but not exactly, matched. This may be explained by the asymmetrical shape of the angular velocity profile with respect to the time when the angular velocity peaks as a result of the asymmetrical total moment applied to the duck in the half-motion period. Since the profile of the excitation moment is symmetrical while that of the angular velocity is asymmetrical, it makes sense that time difference exists between the two peaks so that the maximum power can be captured.
Figure 8 shows the optimal latching duration
tl and optimal unlatching lead time Δ
tl, which is defined as the time difference between when the WEC is unlatched and when the excitation moment peaks, as functions of the wave period for different load types. It can be seen that the optimal unlatching lead time is well distributed around
T0/4, which is plotted as the horizontal black solid line. This again confirms the finding in previous literature [
18] that the unlatching instance should advance the time when the excitation peaks at around
T0/4 in order to capture the maximum power. Although we find from
Figure 7 that the angular velocity profile is asymmetrical, it only skews a little from the sinus curve. This characteristic provides a rough way to estimate the optimal latching duration as
T/2–
T0/2, which is also plotted in
Figure 8 as the black dash line. We find that the optimal latching duration fits this asymptotical line very well. When comparing the difference between the linear and coulomb loads, we find that optimal latching duration and optimal unlatching lead time for the linear load approach the ideal value slightly closer than the coulomb load.
Figure 9 shows the duck WEC performance comparison between latching and resistive control when relative capture width is maximized for different load types. It can be clearly seen that latching control can effectively increase the power-capture ability of the duck WEC at wave periods larger than the natural period.
Table 1 lists the magnification factor of the WEC performance parameters under latching control compared to that under resistive control averaged over the wave period set
Twl = {8, 8.5, 9, ..., 20}, in which the performance change due to latching control is obvious. The captured power under latching control is averaged to be 2.47 and 2.19 times that under resistive control for the linear and coulomb loads, respectively. The peak motion excursion also increases due to latching control, showing an averaged magnification factor of 2.64 and 2.90 for the linear and coulomb loads, respectively. This agrees with the observation in [
19] that increased power capture by latching control is accompanied by magnification of the motion amplitude. Although it is found in
Section 4.1 that small deviations of the maximum relative capture width and peak motion excursion exist between different load types under resistive control, these deviations almost disappear when latching control is applied. This indicates that latching control leads to the same power-capture ability of the solo duck WEC for both load types. Also, when motion constraints are considered, the two load types show no advantage over each other. From
Figure 9c, we find that latching control can lower the peak PTO moment for most of the wave periods, and it is especially prominent for the coulomb load. This may be intuitively explained by the fact that, since the duck finishes one pitch stroke only in a half-natural period, the WEC works at a pseudo-resonant state, resulting in
X being small and even equal to zero. From Equation (16), we find that the optimal
Bp will be reduced. Because the peak angular velocity increases due to latching control, the decrease of peak PTO moment for the linear load, which is the multiplication of
Bp and peak angular velocity, may not be as remarkable as that for the coulomb load. When latching control is employed, the peak PTO moment for the coulomb load is only 0.74 times that for the linear load when averaged over
Twl. This suggests that the physical size of the PTO structure for the coulomb load may be designed smaller in order to resist smaller peak moment. From
Figure 9d, it is found that latching control causes an increase of the peak-to-average power ratio, which agrees with the finding in [
40]. This is due to the fact that the power-capture process is focused within a time interval that is smaller than that when resistive control is applied. To keep the same averaged captured power, the peak instantaneous captured power should be increased within this short time interval, hence the peak-to-average power ratio is increased. When latching control is employed, the peak-to-average power ratio for the coulomb load is only 0.78 times that for the linear load, indicating that the volume of the energy storage system for the coulomb load can be designed smaller than that for the linear load. To summarize from the above analysis, we find that, under latching control, the coulomb load may be the better choice since it reduced the peak PTO moment and peak-to-average power ratio, but in the meantime shows the same captured power and peak motion excursion as the linear load.
4.3. Declutching Control at T < T0
When the wave period is smaller than the natural period of the duck WEC, declutching control could be employed to improve its power-capture performance. In [
21], the PTO is switched off when the angular velocity vanishes, while it is switched on at an appropriate moment. However, in the calculation in this paper, we find that this control strategy is not optimal for the solo duck WEC to capture the maximum power since the optimal declutching instance does not always coincide with the angular velocity zero-crossing point. In fact, the declutching control process can be explicitly defined by two parameters: the time that the PTO is reconnected to the duck, which we call the ’clutching start time’; and the time duration that the PTO is being connected to the duck, which we call the ’clutching duration’. Since the time history of the excitation moment is provided in advance in regular waves, the clutching start time is set with respect to the zero-crossing point of the excitation moment. In the calculation in this section, we find that, under declutching control, the power capture characteristic of the duck WEC for the linear load is more or less the same as that for the coulomb load, which was also observed for latching control. Hence, only the behavior for the coulomb load is described in detail in the first part of this section to avoid repetition.
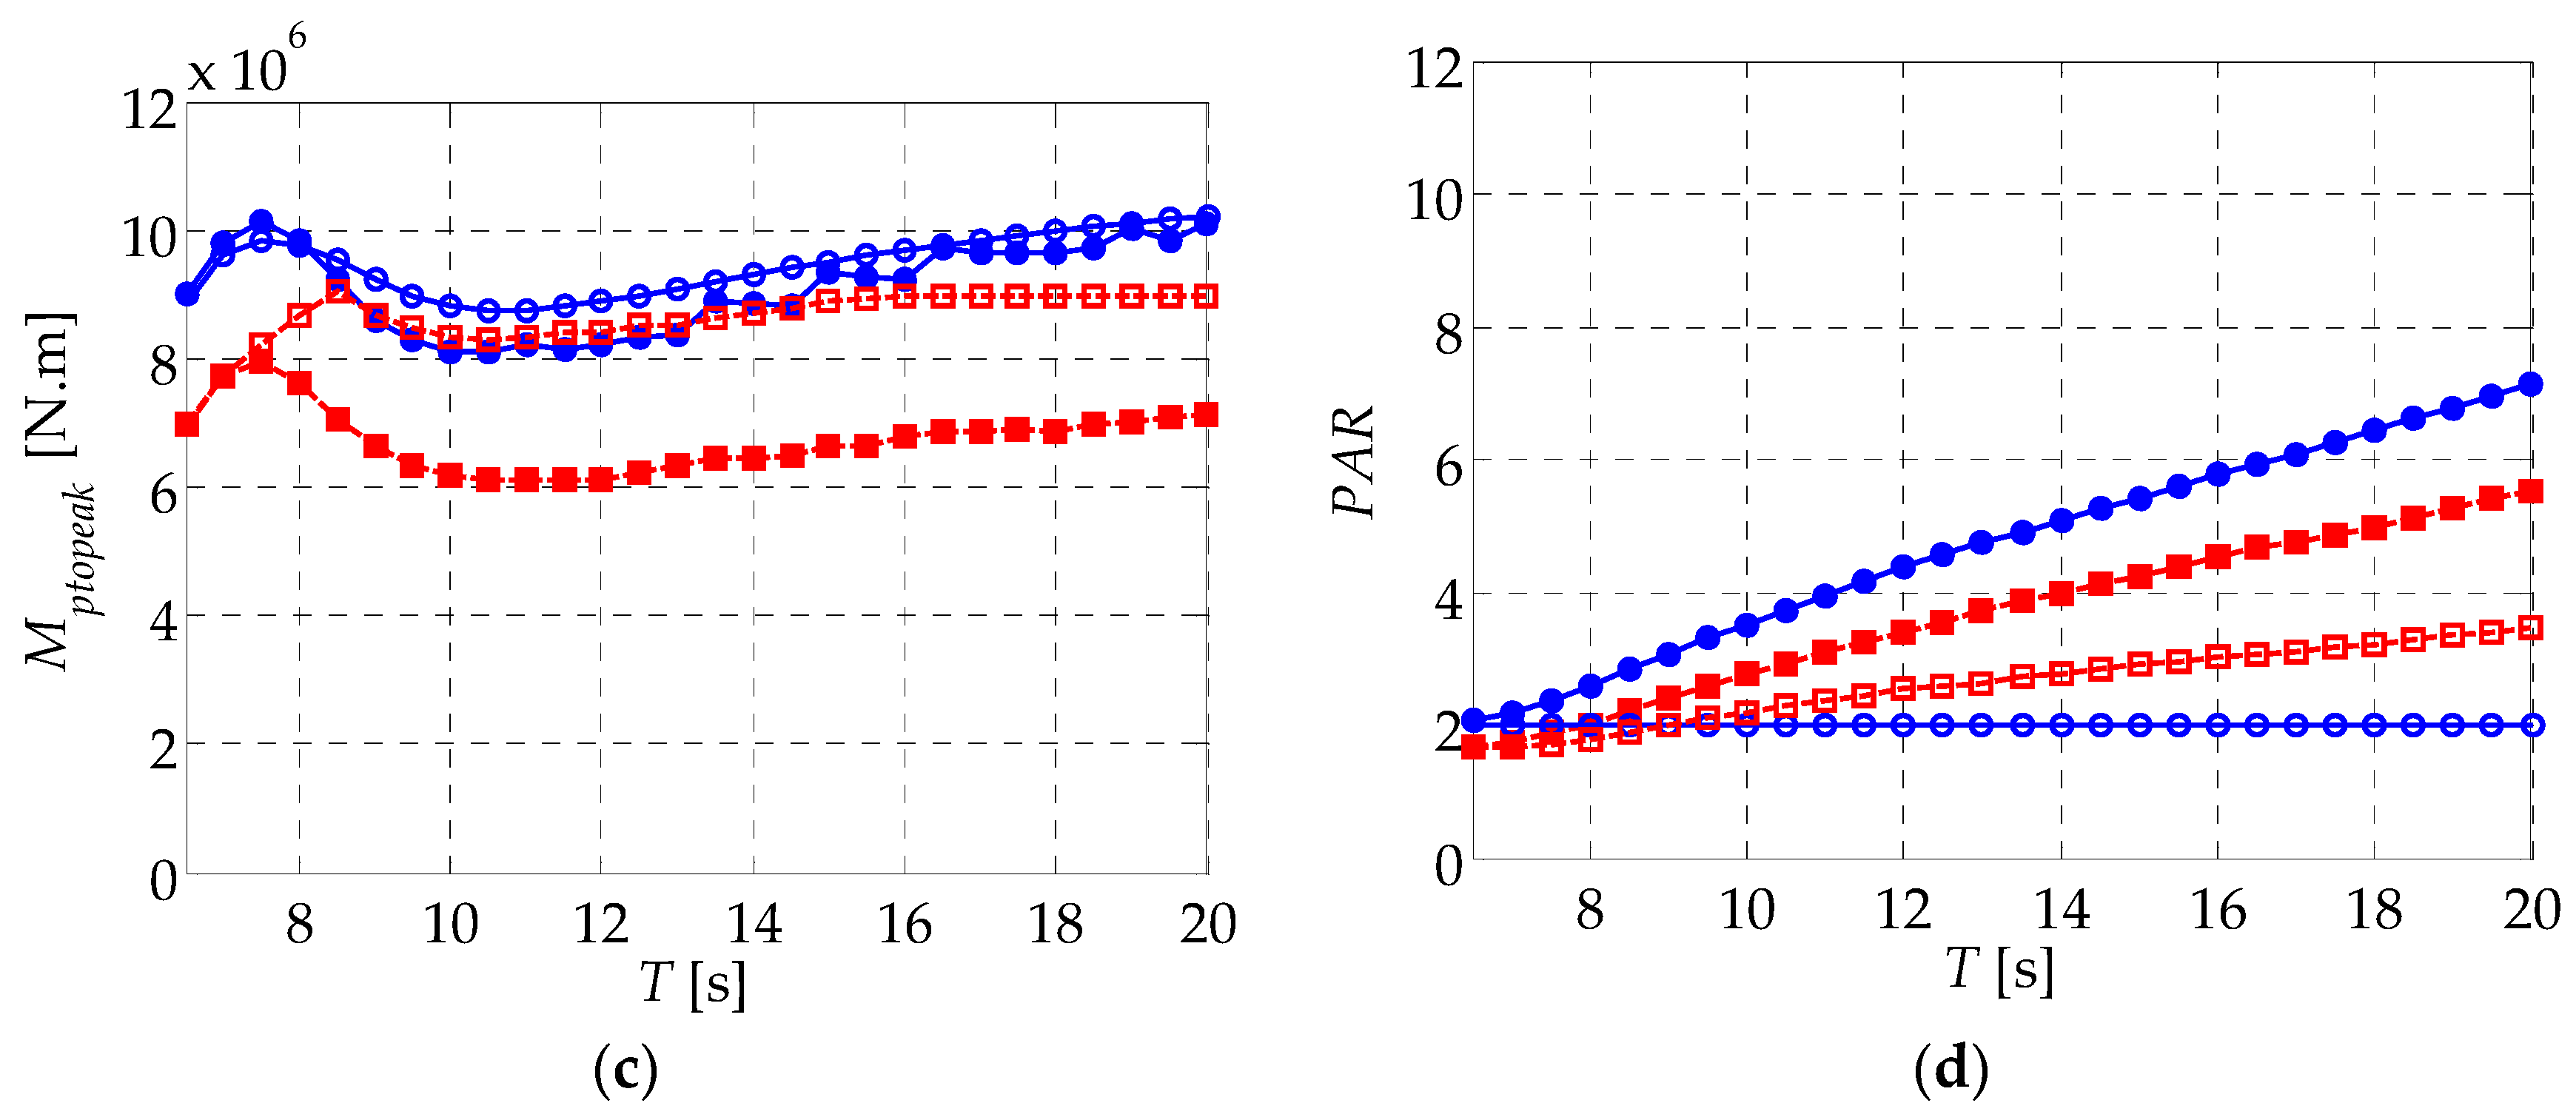
Figure 10 shows the relative capture width as a function of the clutching start time and clutching duration for the coulomb load at
Mp = 7 × 10
6 N·m and
T = 3 s. We find that near the optimal combination of the clutching start time and clutching duration that maximize the relative capture width, the relative capture width is a unimodal function. Thus, the maximum relative capture width and corresponding optimal clutching start time and clutching duration can be found by the method introduced in
Section 4.2.
We find from
Figure 10 that the optimal clutching start time and clutching duration is 0.86 s and 0.84 s, respectively.
Figure 11 shows the time history of the pitch angular velocity, PTO moment and excitation moment for the coulomb load at
Mp = 7 × 10
6 N·m and
T = 3.0 s when the maximum relative capture width is achieved under declutching and resistive control, respectively. When under declutching control, it can be clearly seen that, before the clutching start time, the duck is declutched from the PTO and speeds up rapidly. Then, within the clutching duration, the PTO is reconnected to the duck and works at a high-pitch angular velocity. The significant increase of the pitch angular velocity at the same PTO cylinder moment reveals that declutching control is quite effective at enhancing the solo duck WEC’s performance.
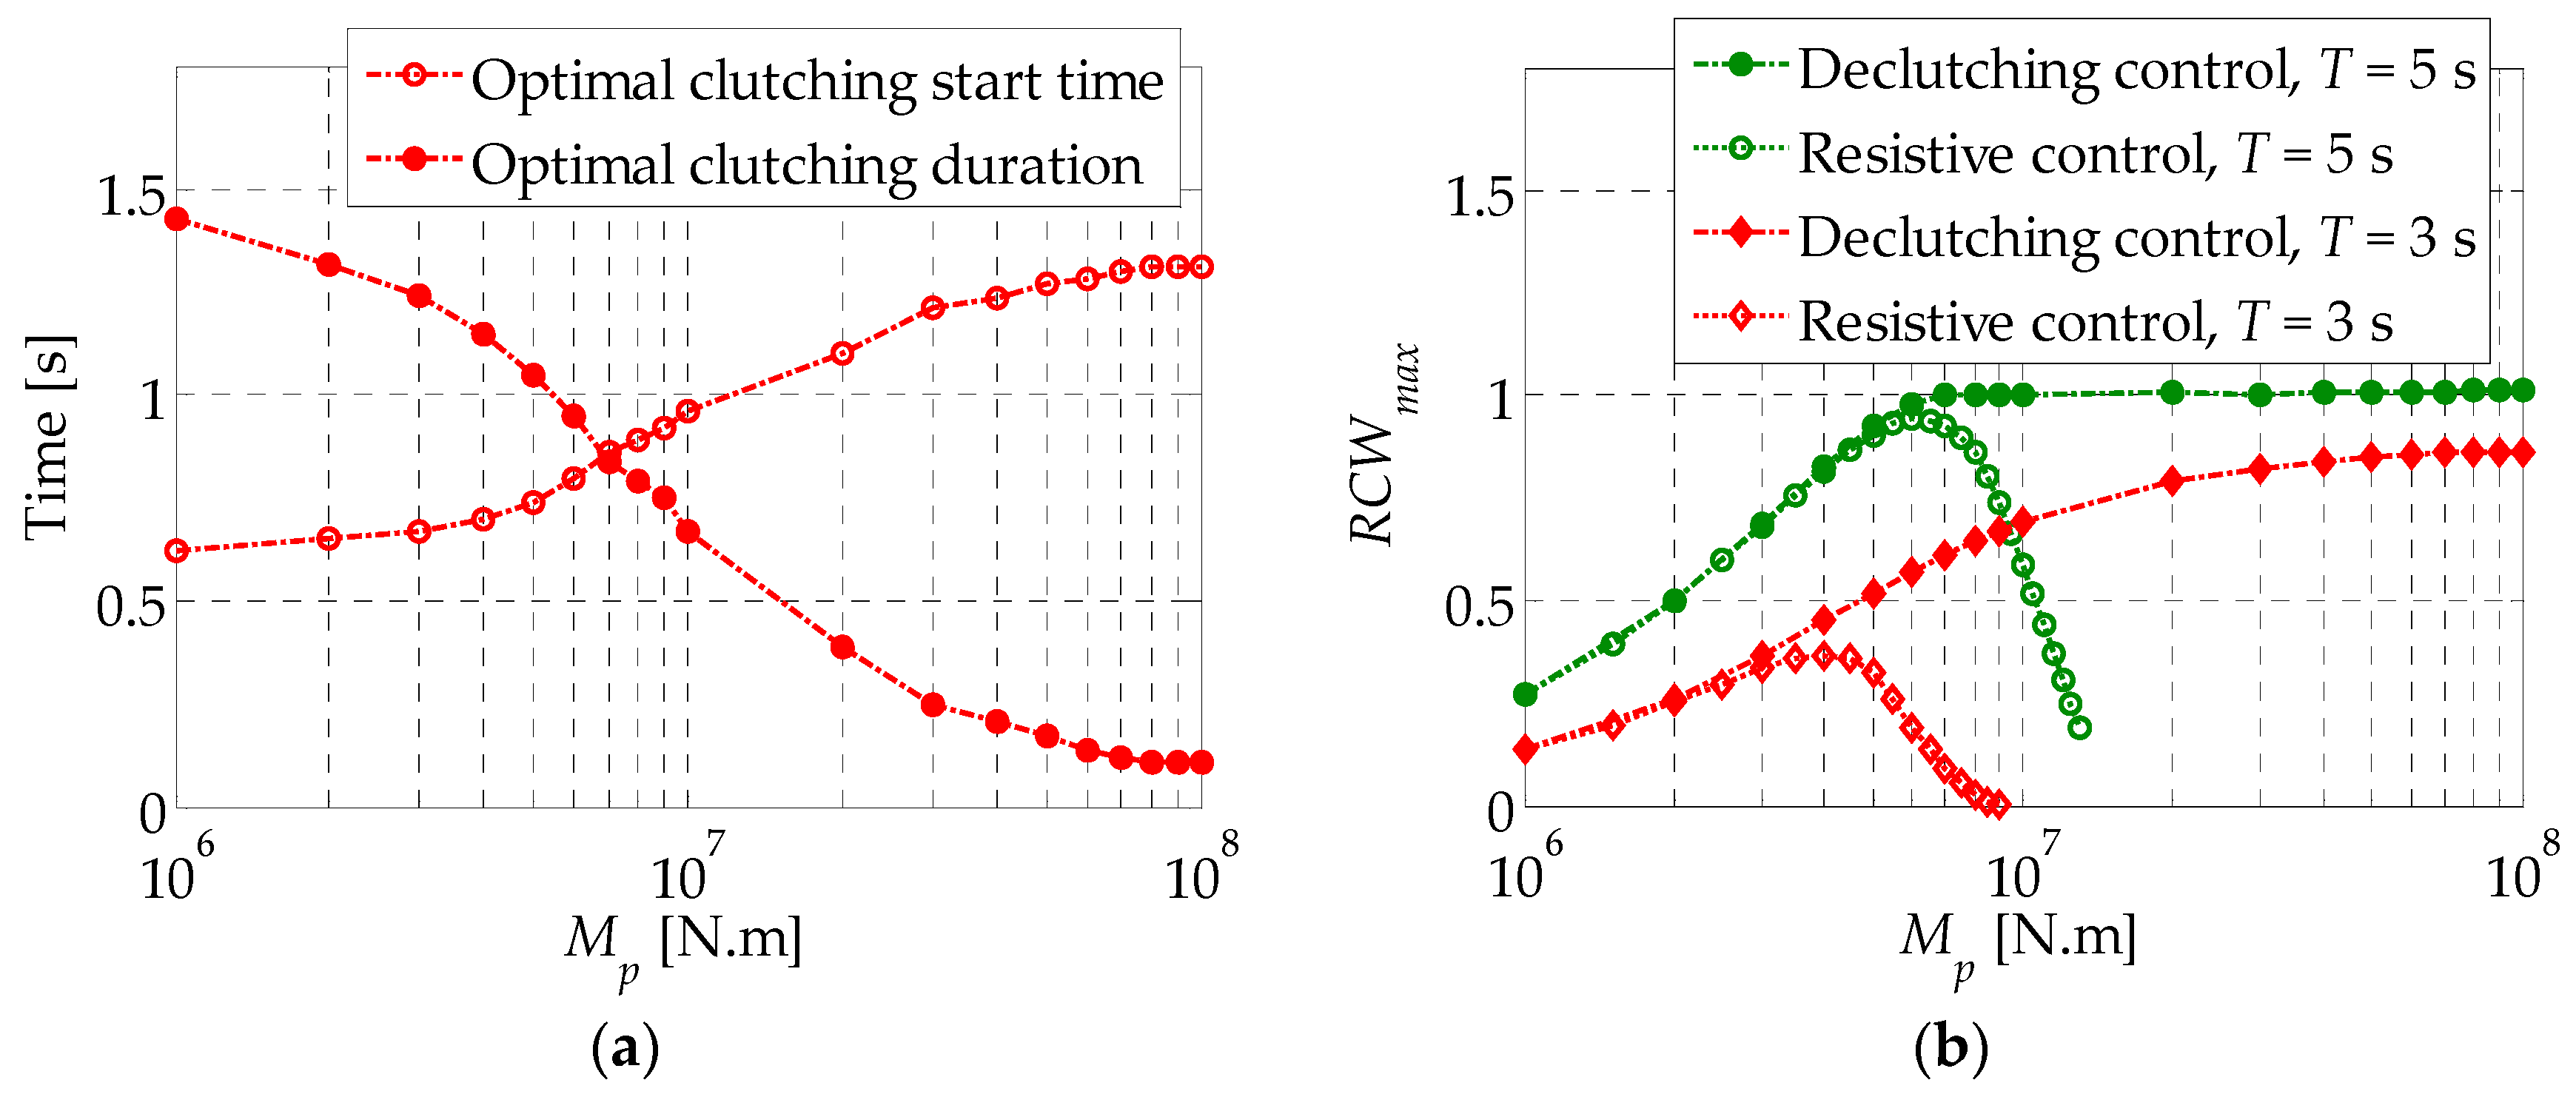
Figure 12a shows the optimal clutching start time and clutching duration that maximize the relative capture width as functions of the PTO cylinder moment for the coulomb load at
T = 3 s. When the PTO cylinder moment increases, the optimal clutching start time increases while the optimal clutching duration decreases. At small PTO cylinder moments, the optimal clutching duration approaches half the wave period, which is equivalent to the case under resistive control, indicating that performance improvement due to declutching control is not significant. This is confirmed in the low PTO cylinder moment range in
Figure 12b, which shows the maximum relative capture width as a function of the PTO cylinder moment for the coulomb load. At large PTO cylinder moments, declutching control leads to a significant captured power increment. The maximum relative capture width grows continuously with the PTO cylinder moment, and keeps at almost a fixed value when exceeding the critical PTO cylinder moment, and this is clearly shown for
T = 5 s in
Figure 12b. The critical PTO cylinder moment varies widely with the wave period, e.g., it is around 8 × 10
7 N·m at
T = 3 s while is around 7 × 10
6 N·m at
T = 5 s. Under declutching control, the maximum relative capture width at a given wave period can be found at the critical PTO cylinder moment. However, it should be noted that, in reality, the critical PTO cylinder moment at small wave periods is so large that the investment may not bring equivalent payback if the maximum relative capture width is required. Take
T = 3 s for example, the maximum relative capture width at
Mp = 8 × 10
7 N·m is only 1.24 times that at
Mp = 1 × 10
7 N·m but with an 8 times larger PTO cylinder moment. This makes it unreasonable to apply a PTO cylinder moment of the critical level so that the maximum power is captured. Therefore, in this paper we limit the PTO moment setup within 1 × 10
7 N·m for
Mp and 2 × 10
8 N·m·s/rad for
Bp so that the PTO system is kept cost effective.
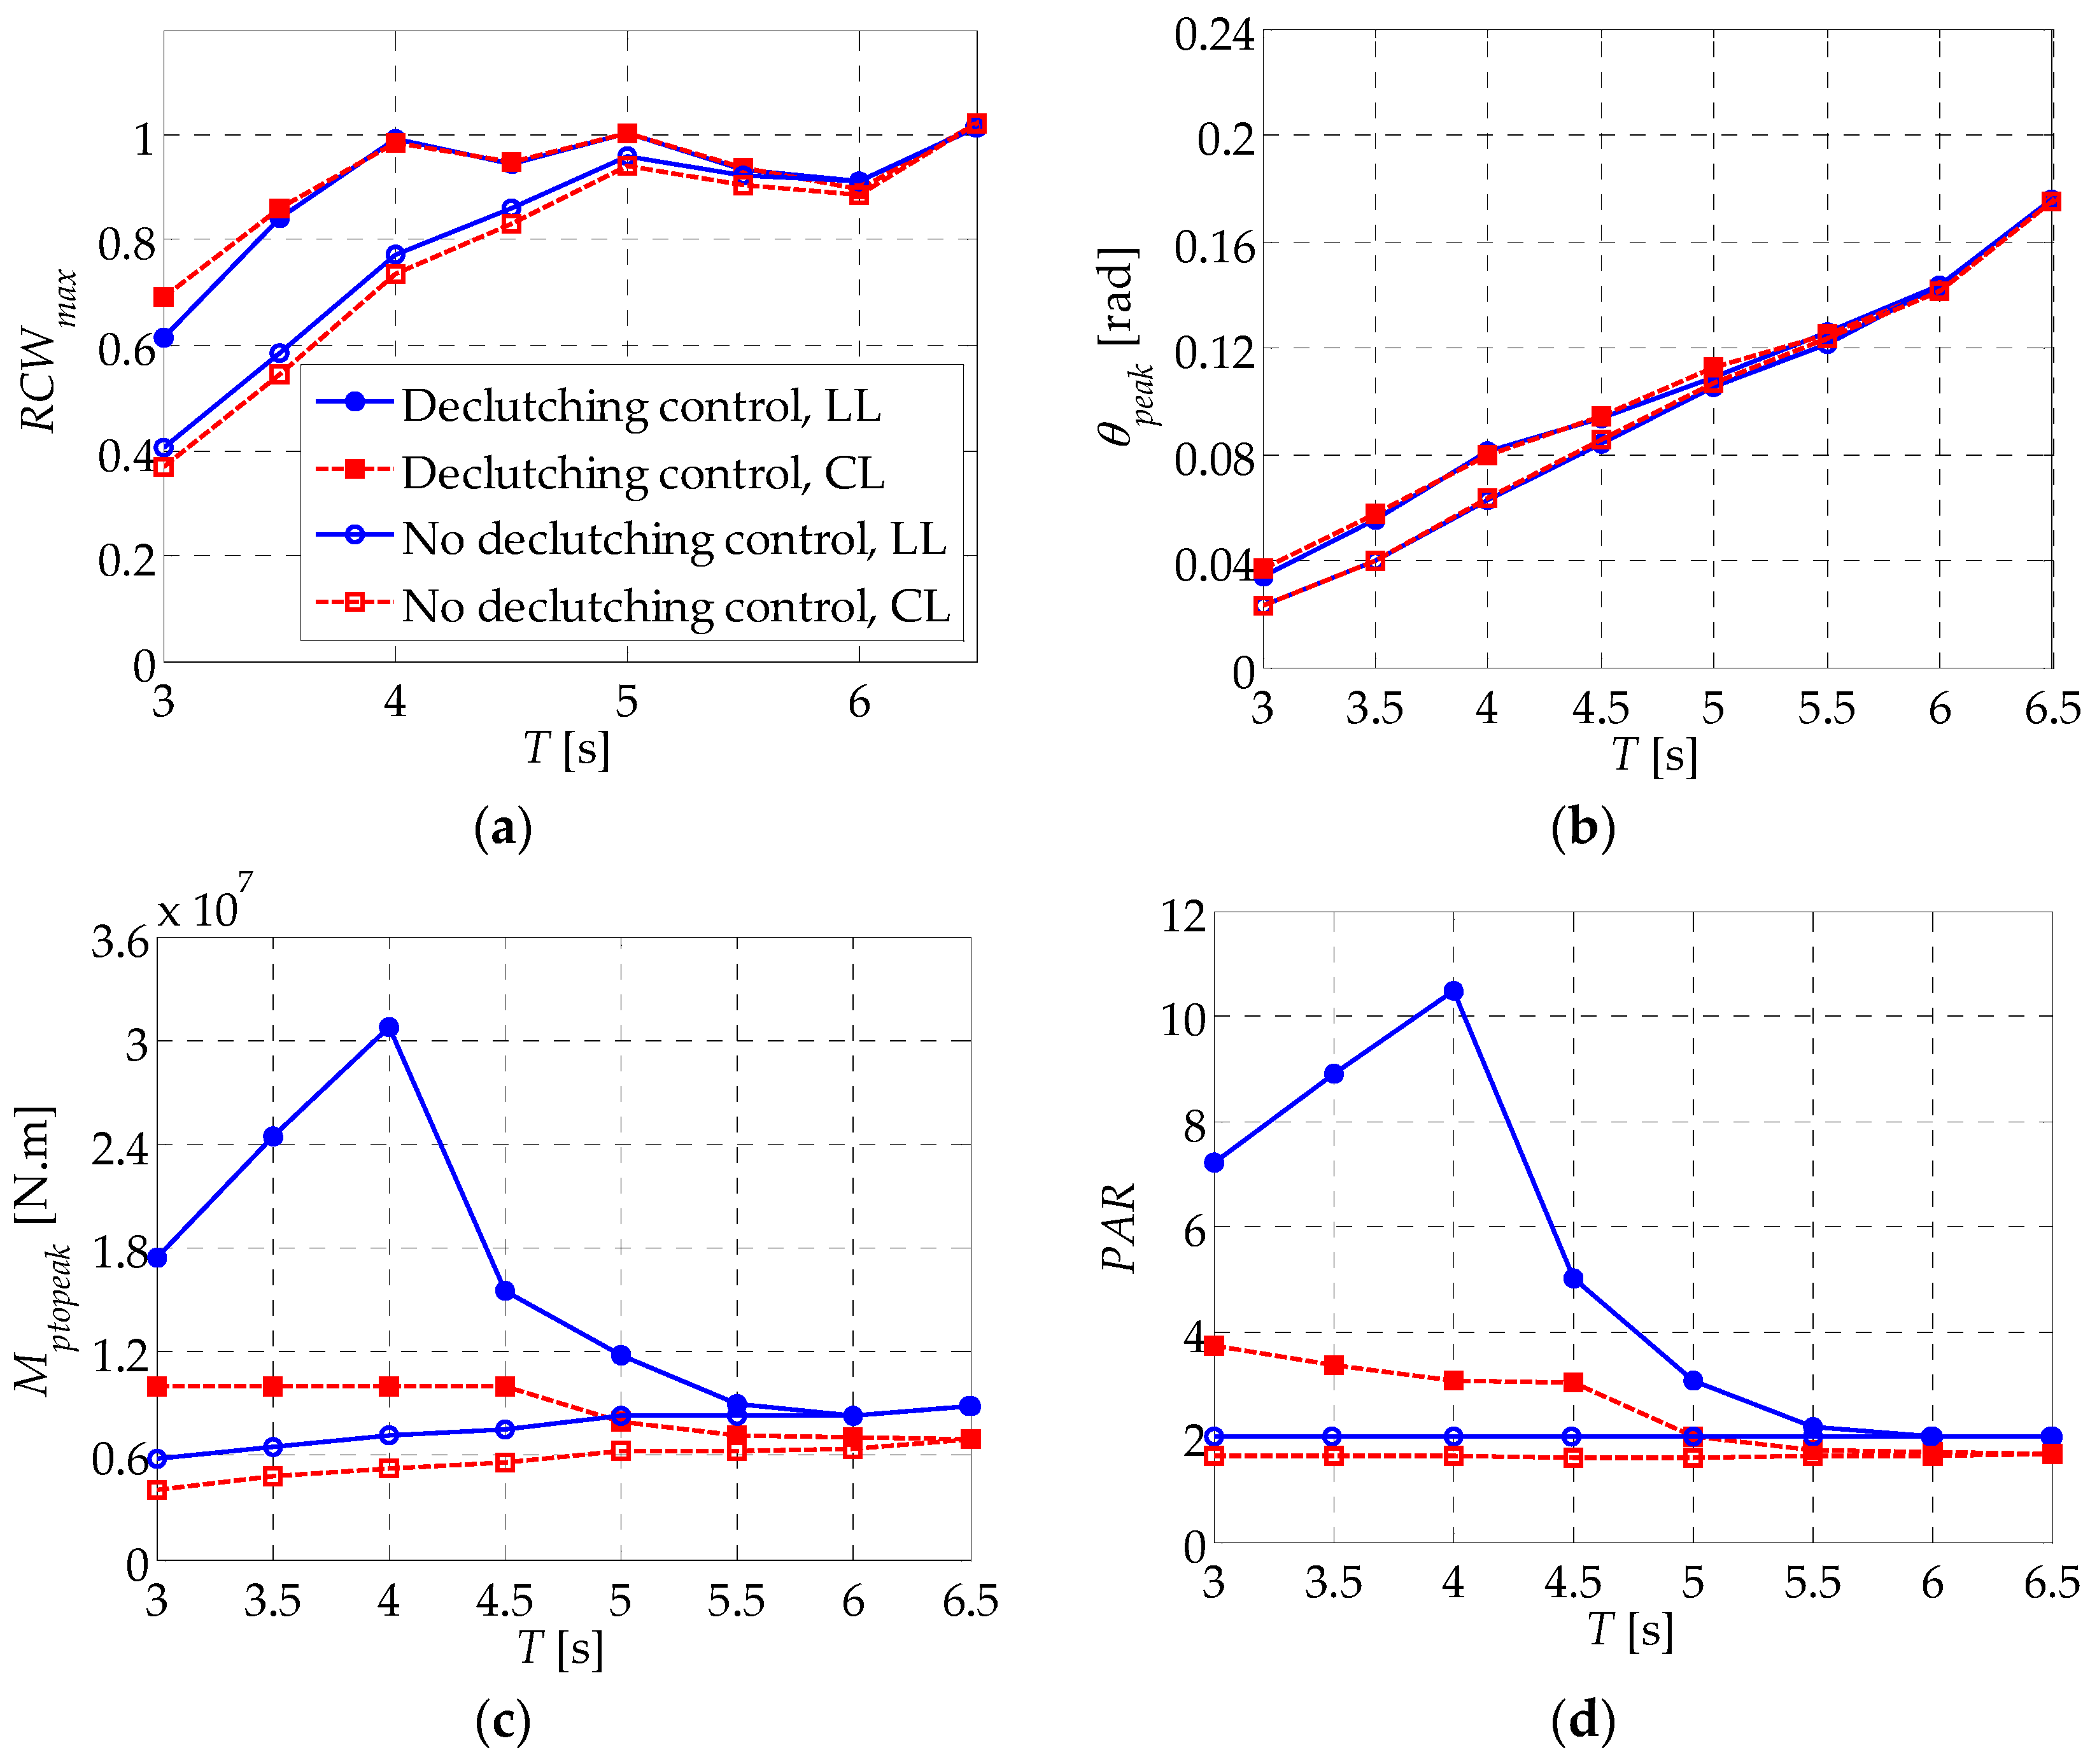
Figure 13 shows the duck WEC performance comparison between declutching and resistive and control when the relative capture width is maximized for different load types.
Table 2 lists the magnification factor of the duck WEC performance under declutching control compared to that under resistive control, averaged over the wave period set
Twd = {3, 3.5, 4, 4.5}, in which the performance change due to declutching control is obvious. Here, we should remind the reader that the maximum relative capture width at a given wave period is the maximum of the maximum relative capture width at different PTO moment setups. We find that declutching control leads to more or less the same control effect as latching control. Both the maximum relative capture width and peak motion excursion are effectively increased when declutching control is applied, and their deviations between different load types disappear except at
T = 3 s and 3.5 s, where the WEC performance improvement is limited by constraints on the maximum PTO moment setup. As for latching control, the peak-to-average power ratio is also increased, due to declutching control, and it is especially prominent for the linear load. As a result, when declutching control is applied, the average peak-to-average power ratio for the coulomb load is only 0.45 times that for the linear load. Among the four performance parameters listed in
Table 2, the peak PTO moment is the only one that differs in variation tendency between declutching and latching control. By contrast with the decreased peak PTO moment caused by latching control, declutching control leads to an increment of the peak PTO moment and is especially prominent for the linear load. When declutching control is applied, the averaged peak PTO moment for the coulomb load is only 0.49 times that for the linear load. To summarize from above analysis, we find that, in declutching control, the coulomb load may also be the better choice since it reduced the peak PTO moment and peak-to-average power ratio, but in the meantime shows the same captured power and peak motion excursion as the linear load.


