1. Introduction
Recovery of heavy (viscous) oil by gas or water injection may suffer from viscous fingering: a well-known instability phenomenon in porous media that results from adverse mobility ratio between the displaced fluid (oil) and the displacing fluid (gas or water). The consequence of this phenomenon is the bypassing of a significant amount of oil, which would cause the remaining oil to be divided in two forms, i.e., pore-scale residual oil and bypassed oil. When a one-dimensional (1D) model is used to simulate such displacement, the frontal instability cannot be captured, leading to the lumping of these two forms of remaining oil into one parameter, i.e., the residual oil saturation (
Sor). Therefore, an unrealistic evaluation of displacements would be obtained when a 1D model is used. Additionally, a relative permeability obtained from a stable displacement when used in the simulation of an unstable displacement may lead to erroneous result [
1,
2]. In such a case, an additional dimension would be required in the model to effectively capture the instability occurring in the front.
The effect of viscous fingering on heavy oil recovery by gas and water has been studied extensively at laboratory scales [
3,
4,
5,
6,
7] and at field scale [
8,
9]. Despite the predominant impact of the mobility ratio on viscous fingering, the stability of heavy oil displacement by gas can also be affected by capillary pressure, which can lead to an exacerbation or dampening of the viscous fingers [
10,
11,
12,
13,
14,
15].
To improve the conformance, and consequently the sweep efficiency, of such displacements, several techniques have been investigated, which often involve the simultaneous flow of three or more immiscible fluids, including oil, water and gas. Numerical simulation models are now increasingly being utilized to consolidate our understanding of the displacement patterns, due mainly to the recent enhancement in computer speed and memory. Hence, by employing a typical reservoir simulator, several recovery methods can be evaluated for feasibility and efficiency in order to determine the recovery method that is most efficient in terms economic, practicality and environmental impacts. For the recovery methods involving the simultaneous flow of three fluids, a three-phase relative permeability would be required to simulate the process. Inaccuracies in this important flow function have been identified as one of the major sources of uncertainty in reservoir performance prediction [
16].
Three-phase relative permeability has been widely investigated for immiscible gas injections [
17,
18] and for water alternating gas [
19,
20]. Two major experimental techniques are available for the estimation of three-phase relative permeability: the steady state and the unsteady state method [
21]. In the steady state displacement method, the two phases are injected at a fixed ratio continuously until the saturation in the core and the pressure drop across the sample becomes unchanged; an indication that the system has achieved steady-state. It is difficult to estimate relative permeability curves for heavy oil systems using this method because of the inherent experimental artefacts associated with the method, which is compounded by the high viscosity of the oil. The more common approach is the unsteady-state method, also known as the dynamic displacement method. In this case, the porous media is initially saturated with oil at connate water saturation and then displaced by a second fluid; the produced volume of the injected fluid and the produced volume of oil, as well as the pressure drop across the medium, are then used to calculate the relative permeability curves using analytical techniques that are based on methods developed by Welge [
22] and Johnson et al. [
23]. These include the Johnson–Bossler–Naumann [
23]—commonly known as the JBN—method and the Jones and Roszelle analytical method [
24]. Alternatively, history matching techniques can also be used to determine the relative permeability by representing the curves with a parametric equation and matching the production history data parameter [
25,
26,
27,
28,
29].
Although the importance of reliable experimental data in numerical analysis is well recognized, laboratory measurements of three-phase relative permeability for viscous systems are usually not attempted. The reason for this appears to be the time and expense involved, as well as the poor reliability of available experimental data [
18]. Quite often, relative permeability values are estimated from correlations such as Stone I and II models [
30,
31] and the Baker model [
32]. The Stone models make use of the probability model (probabilistic methods) which incorporates two sets of two-phase relative permeability data to predict the relative permeability of the intermediate wet phase in a three-phase system. The Baker model is a simplistic three-phase relative permeability correlation that is based on saturation-weighted interpolation (SWI) between two-phase relative permeability data in which the three-phase relative permeability of each phase in assumed to be a function of two saturations. Relative permeability has also been examined to strongly depend on saturation history in cyclic processes, otherwise known as hysteresis. This phenomenon has been extensively investigated experimentally and numerically [
14,
19,
33,
34,
35,
36]. A few three-phase relative permeability models have been proposed which incorporate hysteresis, compositional and interfacial tension (IFT) effects, these include the Jerauld model [
37] which attempts to predict three-phase, gas, oil and water hysteresis as well as relative permeability dependence on composition and gas/oil IFT. The Blunt empirical model [
38] also accounts for hysteresis, changes in hydrocarbon composition as well as trapping of gas, oil and water. Nevertheless, in three-phase displacements of viscous oils, the viscous forces would be dominant and hence, there is a need to investigate if the hysteresis (in conventional systems) pertinent to wettability may not be significant in heavy oil displacements. In other words, it can be conceivable that change in gas/oil/water relative permeabilities during WAG injection can be likened to variation of fluid viscosities rather than percolation type of fluid invasion. Also, the use of pore-network modelling, suggested for conventional light oil systems [
39], may not be applicable for systems under significant instabilities and bypassing due to violation of percolation theories.
Since all these correlations utilize two-phase relative permeability data as an input in the estimation of three-phase relative permeability, their inaccuracies can be compounded by uncertainty in the two-phase relative permeability data. More so, when the two-phase relative permeability for a heavy oil displacement by gas or water is determined by history matching technique, is it important to ensure that an appropriate model which mimics the instability in the system is utilized. It is therefore important for any numerical studies of heavy oil displacements with unstable fronts to reconstruct the development of the instabilities. The objective of this research is to numerically investigate three-phase relative permeability data in heavy oil systems in which the displacement of the viscous oil was unstable. A series of coreflood experiments, namely CO2 injections in secondary and tertiary, and water-alternating-gas injection scenarios, were considered for the numerical investigation. Here, it was attempted to demonstrate the necessity of employing a sophisticated method, i.e., 2D high resolution compositional model, for the estimation of relative permeability (if compared to conventional 1D simulation) for cases under unstable displacement and significant compositional interactions. The aim has been to examine the outcome of this new method of simulating laboratory experiments by incorporating the estimated relative permeabilities for forward simulation of a similar experiment. This would indicate that, for the displacement of viscous oils, changes of relative permeability in three-phase, which is conventionally named three-phase WAG hysteresis, would be dominantly controlled by changes in fluid viscosities.
2. Methodology
Our approach of estimating gas, oil and water, and three-phase relative permeability for heavy oil displacement, is based on history matching of the two-phase (gas/oil and oil/water) unsteady state displacement experiments in which instability and mass transfer simultaneously took place. A compositional simulator (CMG-GEM) was utilized to incorporate the fluid flow and compositional effects. The compositional effects need to be implemented due to drastic changes in oil viscosity as CO
2 was dissolved in the resident oil.
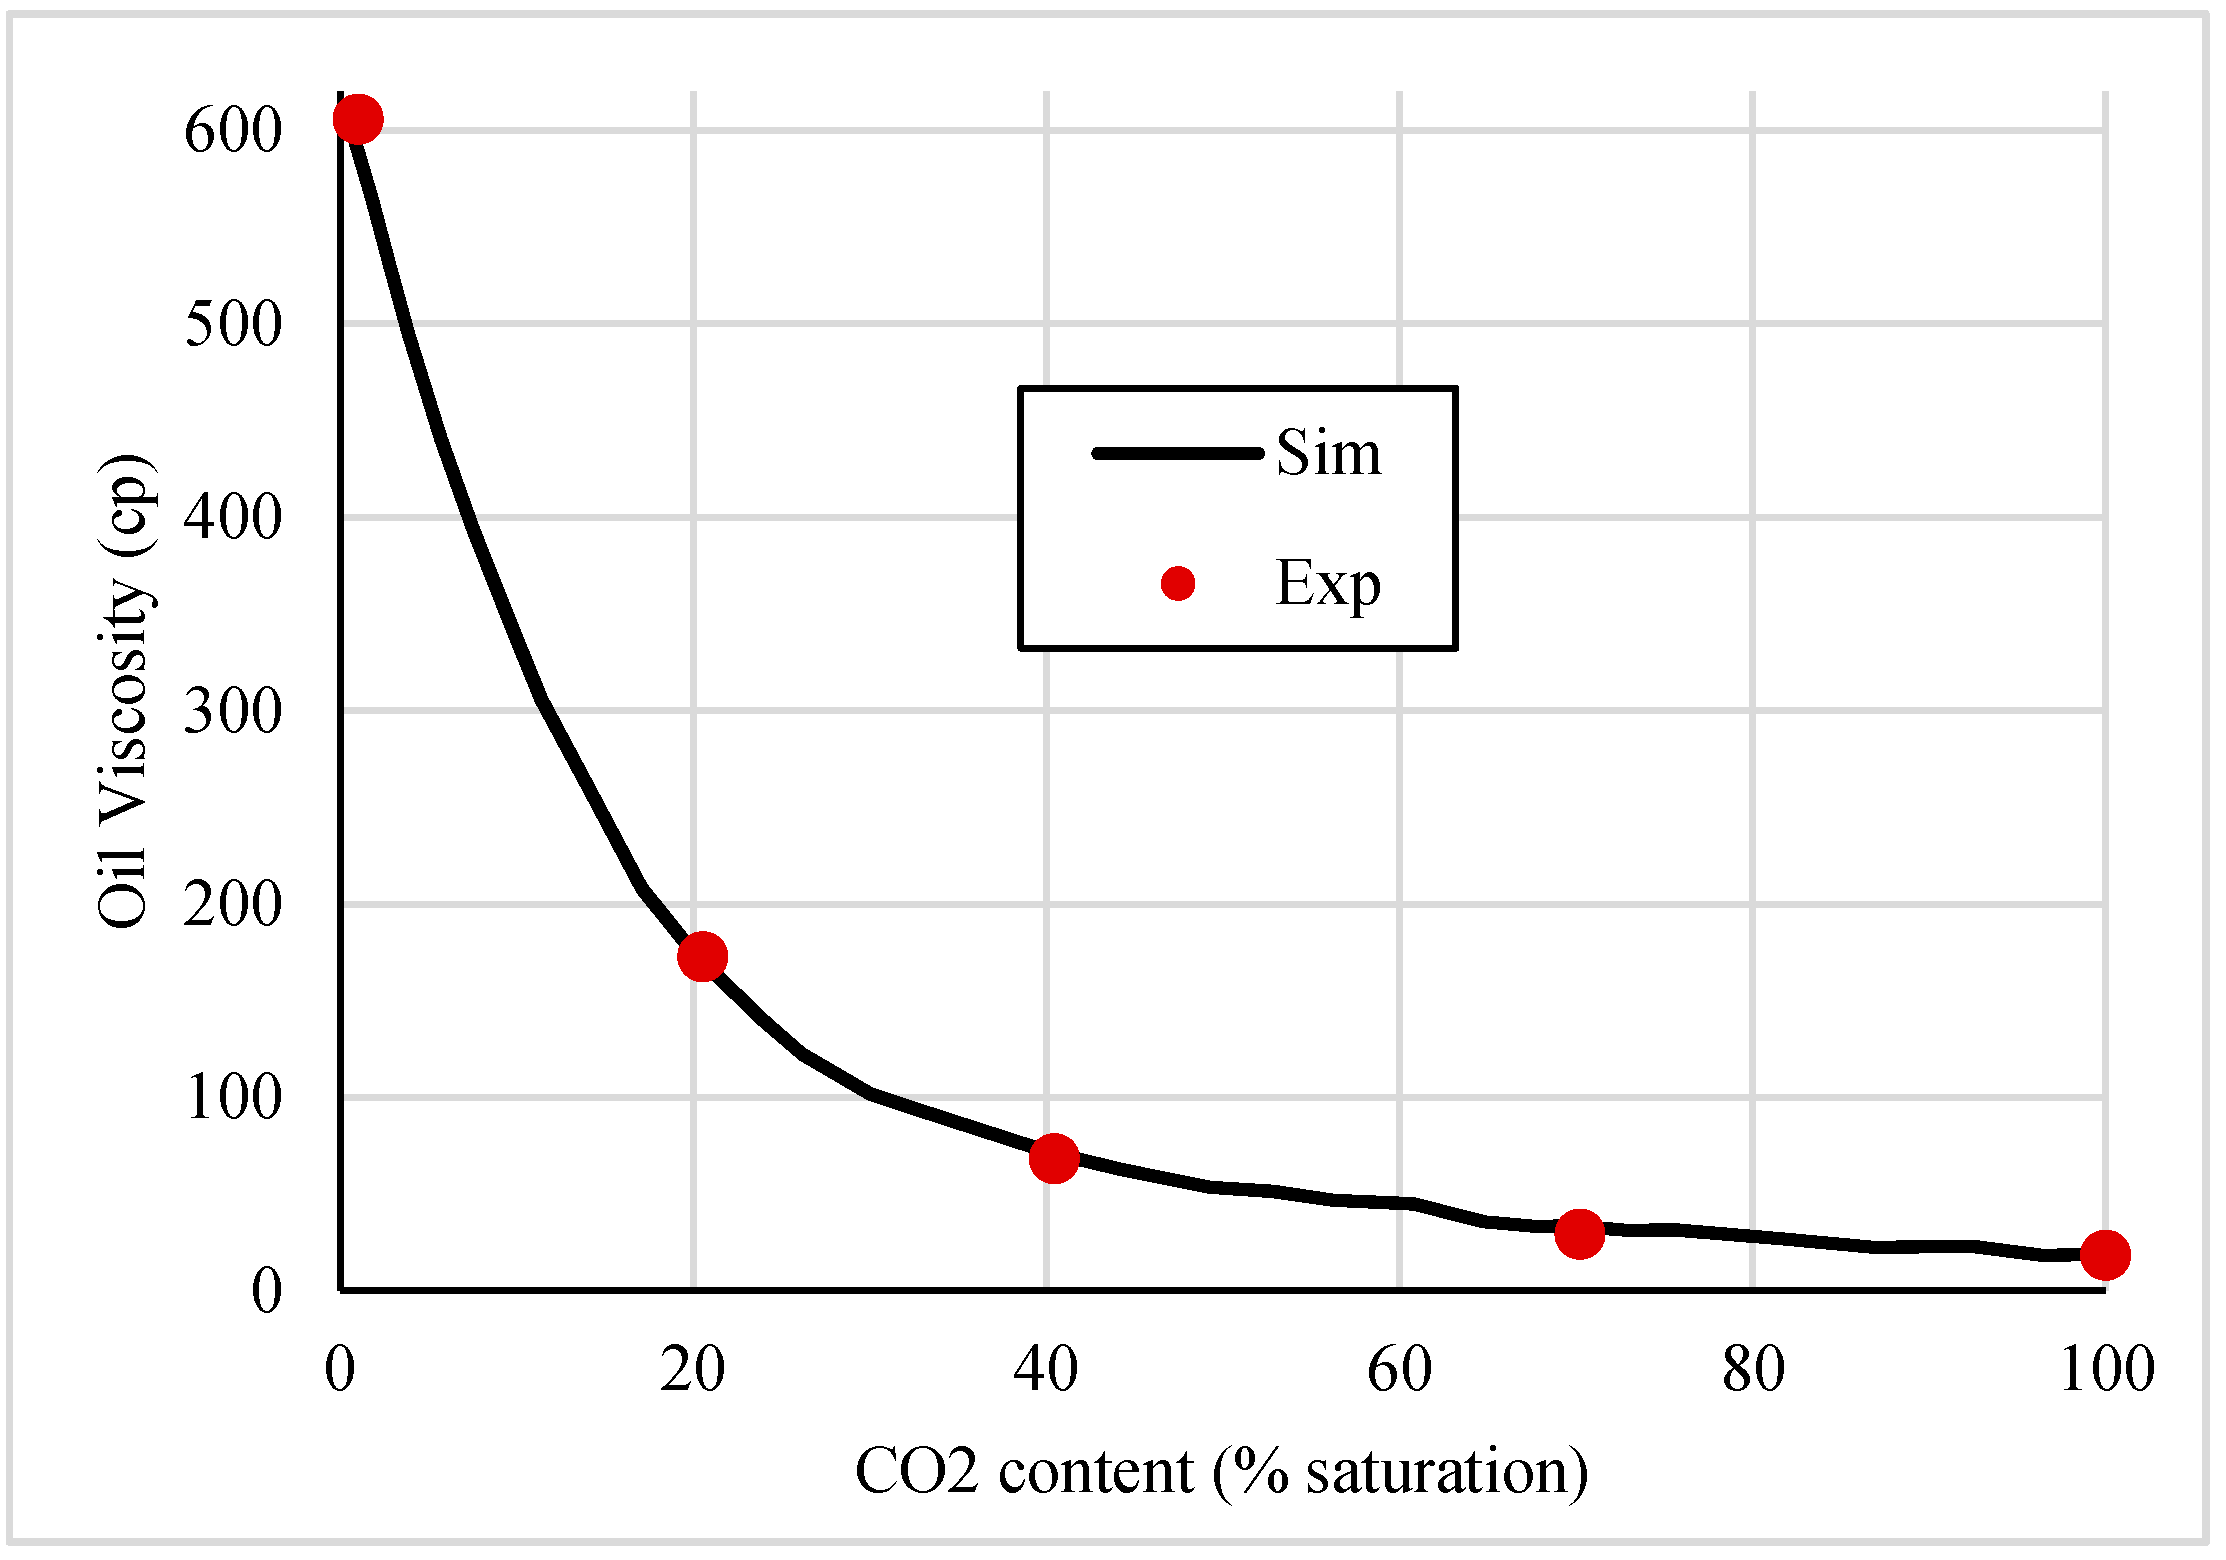
Figure 1 illustrates the relationship between oil viscosity and CO
2 dissolution. An equation of states (EOS) was tuned to capture the compositional effects based on composition of the oils produced from the coreflood experiment (rather than conventional PVT experiments). Details of the improved methodology for EOS modelling can be found in [
2]. A history matching methodology which incorporates instability and compositional effect proposed by [
2] was adopted. Using CMG-CMOST (this is CMG software for optimization purposes) with its CMG designed exploration and controlled evolution (CMG’s proprietary algorithm) algorithm for minimization of objective functions, a high-resolution two dimensional (2D) compositional model was used to simulate and history match coreflood experiments. This optimization algorithm is based on estimation posterior probability function of a parameter, which is expressed by the following equations:
where
is the posterior probability function,
is the prior probability function, and
L(
x) is the likelihood function using
Q(
x) as the objective function. The basis of this optimization method is the Bayesian type of minimization [
40].
For history matching, a tolerance limit of less than 1% of error was selected. It is also worth mentioning that different weight factors for each data point were assigned. The data points before breakthrough had a weight factor of zero because, before breakthrough, what is injected is produced and is not strongly dependent on relative permeability. This would enable more focusing on the matching of the curvatures after breakthrough. Also, if recorded data points were highly dense in some regions, a couple of points were chosen to have weight factor of 1 and the rest (in that region) were excluded. For instance, number of recorded data points of differential pressure (dP) in the in the early stages of the tests are highly dense, and they all have fairly similar values of dP. Therefore, two points of the existing 12 points were arbitrarily chosen with a weight factor of 1 and the rest (ten points of that region) had a weight factor of zero. This approach of “targeted history matching” would enable faster convergence of optimization.
The rationale for choosing 2D simulation over 3D is down to two main factors; firstly, the computation cost of each simulation, and secondly, our dimensionless analysis indicates that gravitational tongue would control the displacement pre-dominantly. For the computation time, adding another dimension in simulation (3D) would increase the run time exponentially. For 2D simulation, each run of the high resolution compositional model takes approximately a day, whereas (using eight CPUs of a desktop PC) a 3D model with the same gridding scheme (nx = 100, ny = 80, nz = 80) would take around a week using the same machine. It would therefore be impractical at this time to use 3D models for history matching of core scale experiments, which may require 1000 realizations of relative permeability.
Also, 3D models would be more representative for systems where viscous fingering dominates, which are best captured with more detailed 3D models. In the presence of an adverse mobility ratio and density contrast, the competition between the viscous and gravitational forces can bring about transitional behaviors between severe viscous fingering and a sharp gravitational tongue. To analyze the dominancy of the forces, Fayers extended Dietz theory [
41] and proposed a dimensionless viscous-to-gravity parameter (NG) as expressed by Equation (3);
NG = 1 can be regarded as the point where transition between gravity and viscous force becomes important, i.e., gravitational instabilities (tongue) are dominant below
NG = 1. Conversely,
NG > 20 has been reported as the region where viscous fingering is much stronger than gravitational tongue, which may occur if our coreflood experiments were performed in vertically oriented cores. Using the relevant parameters, CO
2 injection in horizontal results in
NG ≈ 0.05, which is well below the threshold value of
NG = 1, and hence gravitational instabilities overtake the viscous fingering. This result implies that the injected CO
2 would override the resident oil, creating a tongue. In contrast with the uncertainty involved in the simulation of viscous fingering such as number of fingers and different behavior of each finger [
42], formation of a gravitational tongue would mainly depend on the thickness of a single tongue and speed of its advancement. In other words, when the displacement is controlled by a sharp finger, 2D representation of the core would adequately capture the displacement patterns.
The procedure in Taura et al. [
2] also suggested an empirical method for verifying the simulated in-situ saturation distribution for a case where an experimental saturation data is not available. This is important because relative permeability is a strong function of saturation distribution, and for a case with instability, infinite saturation paths are possible, and hence there is a need to verify the saturation distribution.
Table 1 presents the experiments considered in the studies.
Table 2 shows the basic properties of the core (Clashach sandstone) used in the experiments. The API gravity of the oil used in the experiment is 16. The experiments were performed at pressure of 1500 psig and 28 °C. Under these conditions, CO
2 is in a liquid state. This state of CO
2 would favor CO
2 dissolution into the oil, which would bring about significant reduction in oil viscosity. The injection rate was set at 7 cc/h, which is close to conventional reservoir advance rate of 1 ft/day. During the experiments, production of different fluids and differential pressure across the core were measured. Details of experimental procedure and information acquired from each experiment can be found in [
43].
3. Relative Permeability Correlation
Two different relative permeability functions were used to represent the two sets of two-phase flows. The gas/oil relative permeability was represented by a flexible three-parameter correlation known as the LET-type correlation [
44]. This type of correlation was used due to its versatility in honoring the so-called “S-behavior” of gas relative permeability (Equations (4)–(6)). For water/oil relative permeability, a simple power-law model (traditionally referred to as Corey correlations) was used (Equations (7) and (8)). Alternatively, the Stone II model [
31] (Equation (9)) was chosen for the three-phase relative permeability correlation because of its simplicity and its bivariate nature, since the computed oil relative permeability depends on two saturation values: gas and water relative permeabilities. For history matching, the coreflood experiments,
,
,
,
,
,
,
were considered for CO
2-oil relative permeability curves and
,
,
,
were used for oil-water cases.
It should be noted that the objective of this work is not to examine the results of different three-phase oil relative models. The main focus of this work is to develop a methodology for estimating relative permeability based on displacement patterns in three-phase flow. Since the systems under study are heavily affected by viscous ratios and mass transfer, the objective is to demonstrate that, when two phase relative permeabilities are tuned based on a physical process taking place in one experiment (tertiary waterflood after CO2 injection), the resultant krs can be used for another experiment with a similar displacement pattern (SWAG with CO2). In other words, three-phase oil relative permeability models may affect the outcome of the simulations, but the tuned two-phase relative permeability would capture the flow behavior for the systems under study. Therefore, the approach is not purely predictive and is based on tuning the flow functions on one experiment to capture the displacement patterns, which would lead to an improved prediction of similar experiments.
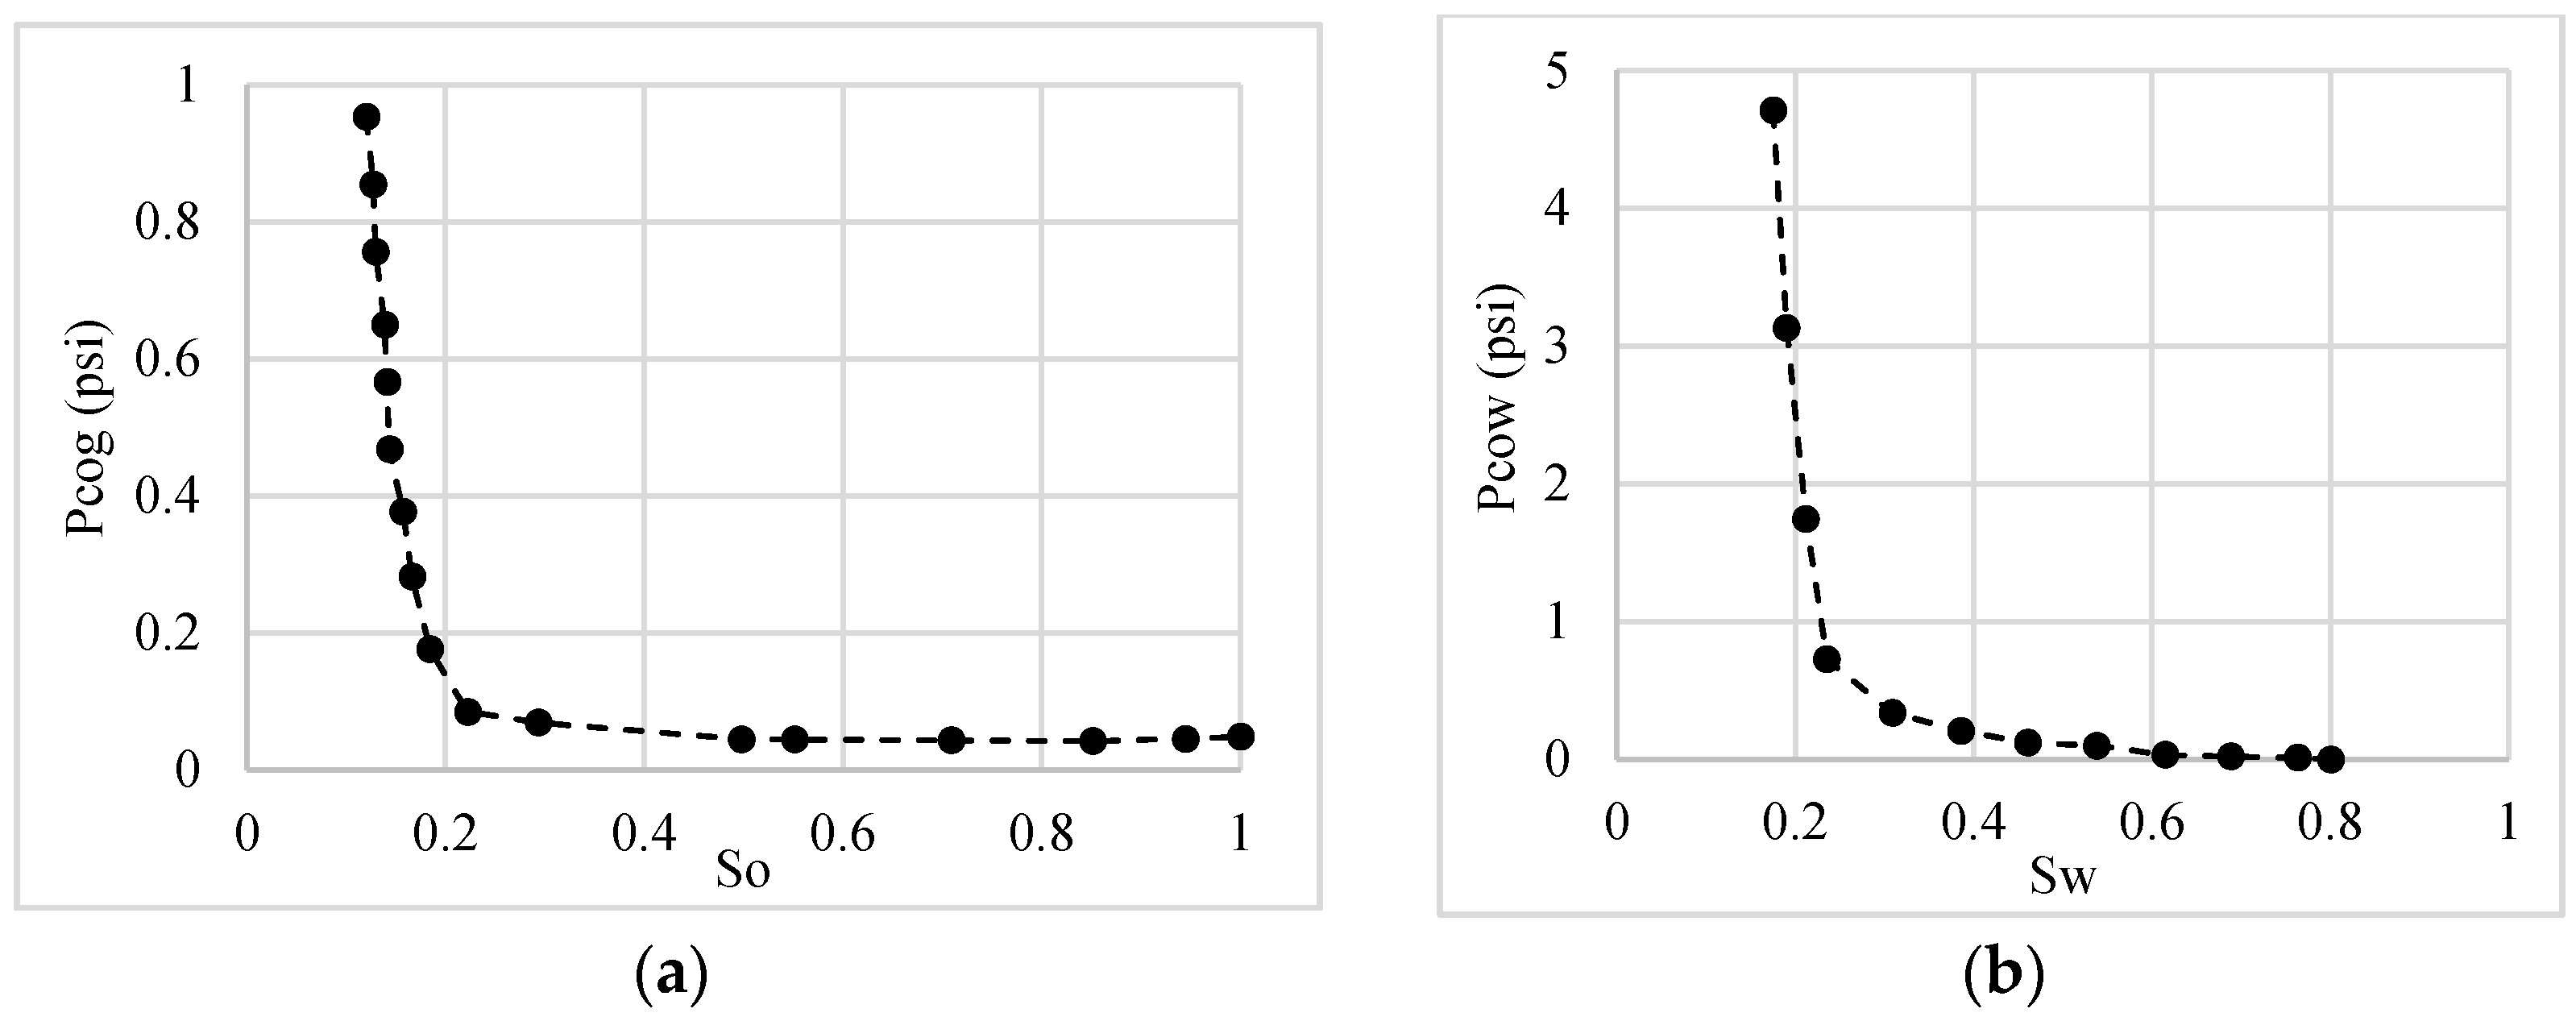
For capillary pressure information, there is one centrifuge experiment performed using an air-brine system on this core [
45]. The air–brine capillary pressure can be modified for the systems used in this study, i.e., CO
2-oil and oil-water. Utilizing the famous Leverett formula [
46], the capillary pressure of CO
2-oil and oil-water can be estimated;
Provided that air–brine interfacial tension (IFT) is 72 dyne/cm and their contact angle is assumed to be zero, the capillary pressure of oil-water can be calculated with aid of measured IFT (i.e., 30.84 dyne/cm). It should be pointed that the contact angle of oil-water system using quartz substrate was measured and it was 25°. Since the core was not aged during the coreflood experiment, it would be fair assumption to use the measured contact angle for conversion of capillary pressure. For the CO
2–oil system, no measured value of IFT and contact angle was available. Hence, for converting the air-brine capillary pressure, the IFT of CO
2–oil was estimated using the tuned EOS, which was 1.33 dyne/cm. The CO
2–oil contact angle was assumed to be zero like air-brine system. In other words, CO
2–oil capillary pressure was obtained using the ratio of the CO
2–oil IFT to that of air-brine.
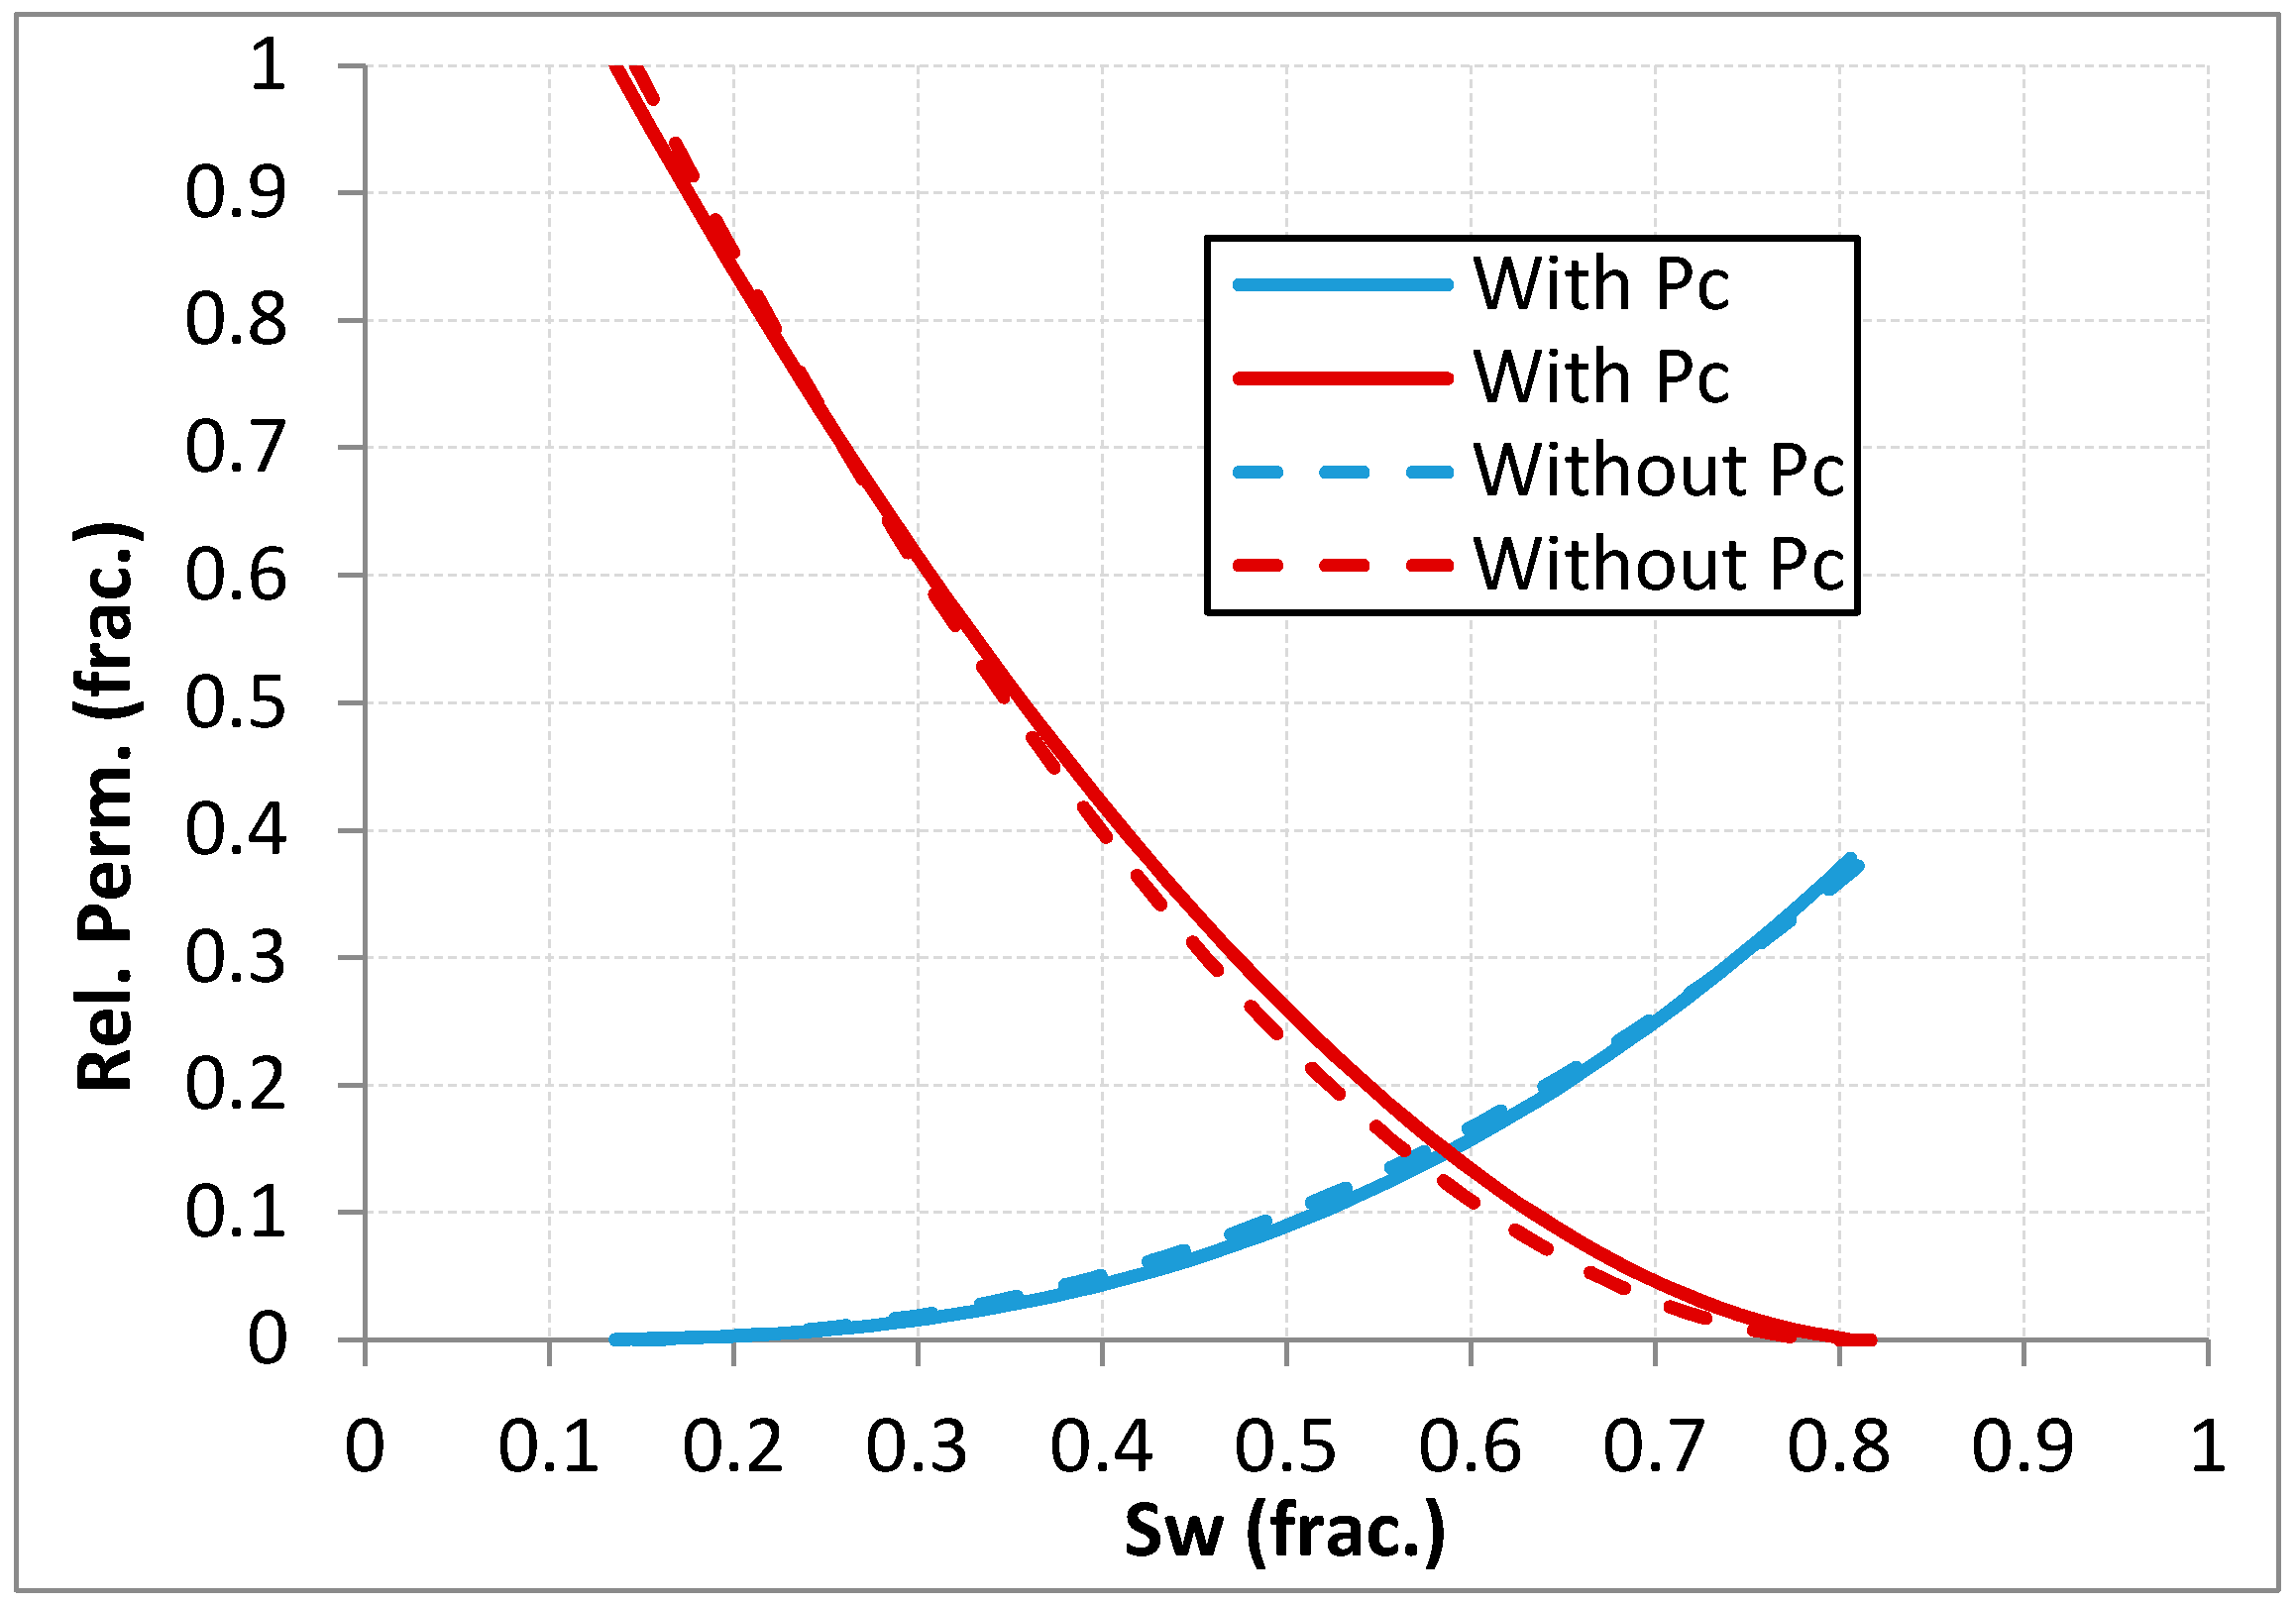
Figure 2 depicts the estimated capillary pressure curves used in the process of history matching. CO
2 would not be miscible with the dead crude oil used in this study. As we reported the IFT between CO
2 and crude oil as 1.33 dyne/cm. CO
2 is partially dissolvable in the dead crude oil. After contacting CO
2 and this crude oil, 82 cc CO
2 per cc of oil was dissolved in the oil, which indicates dissolution of CO
2 in the oil but not miscibility. Also, CO
2 was injected in vertical orientation (gravity stable CO
2 injection) and recovery factor was poor, which may indicate that CO
2 would not be miscible with this heavy oil [
2]. Furthermore, it was demonstrated that same relative permeability curves can simulate vertical CO
2 injection and residual oil saturation to gravity-stable CO
2 injection would be 30%, which again indicates immiscibility of CO
2 and this crude oil [
2].
5. Estimation of Three-Phase Gas/Oil/Water Relative Permeability from Tertiary Water Injection (Experiment 3)
The coreflood in Experiment 3 was conducted as a chase waterflood to the secondary CO
2 injection in Experiment 1 above. Unlike conventional WAG process in light oils, the chase waterflood in viscous oils would encounter two regions of remaining oil after CO
2 (gas) injection: (i) the residual oil due to capillarity (which is expressed in
Sorg) in the swept area in which CO
2 dissolution occurred and has significantly reduced the oil viscosity and (ii) oil remained in bypassed regions whose oil still has the original viscosity value. Based on experimental findings acquired from several coreflood studies, water-alternating-CO
2 is potentially the most efficient cold displacement process compared to only water or CO
2 injections [
6,
49]. This is due to its benefiting from both better pore-scale and sweep efficiencies of CO
2 and water, respectively. Current knowledge of WAG modelling is based on the hysteresis formulations in which relative permeability functions of water/oil/gas are adjusted in successive injections of water and gas.
Therefore, because of the influential CO2–oil interactions, there are several crucial factors in tertiary water injection that need to be taken care of in the simulation. These are listed as follows:
Viscosity and density of the oil in the swept region;
Viscosity and density of the bypassed oil;
Viscosity of the remaining CO2 in the core at the end of the secondary CO2 injection.
To estimate the three-phase relative permeability, LET and Corey correlations were used to represent gas/liquid and oil/water relative permeabilities, respectively, in the history matching process. The Stone II model, in which gas and water relative permeabilities can affect three phase oil relative permeabilities, was employed for the three-phase flow of gas, oil and water [
31]. Having compositionally established the oil viscosities of swept and bypassed regions as 16 cp and 617 cp, respectively, the three-phase relative permeabilities were estimated. In this approach, the results of simulation of the secondary CO
2 injection (zero Pc case), i.e., distributions of fluids saturation and compositions in each grid block, which was history matched in
Section 3 were used to initialize the model for tertiary water injection. Therefore, for history matching of water injection, the compositional variations in the core was considered to estimate oil viscosity in each grid block, which would produce the oil viscosity distribution between 16 cp and 617 cp depending on the amount of CO
2 dissolved in the oil. For the history matching runs, two dimensional optimizations were set up with compositional initialization of the model as described above.
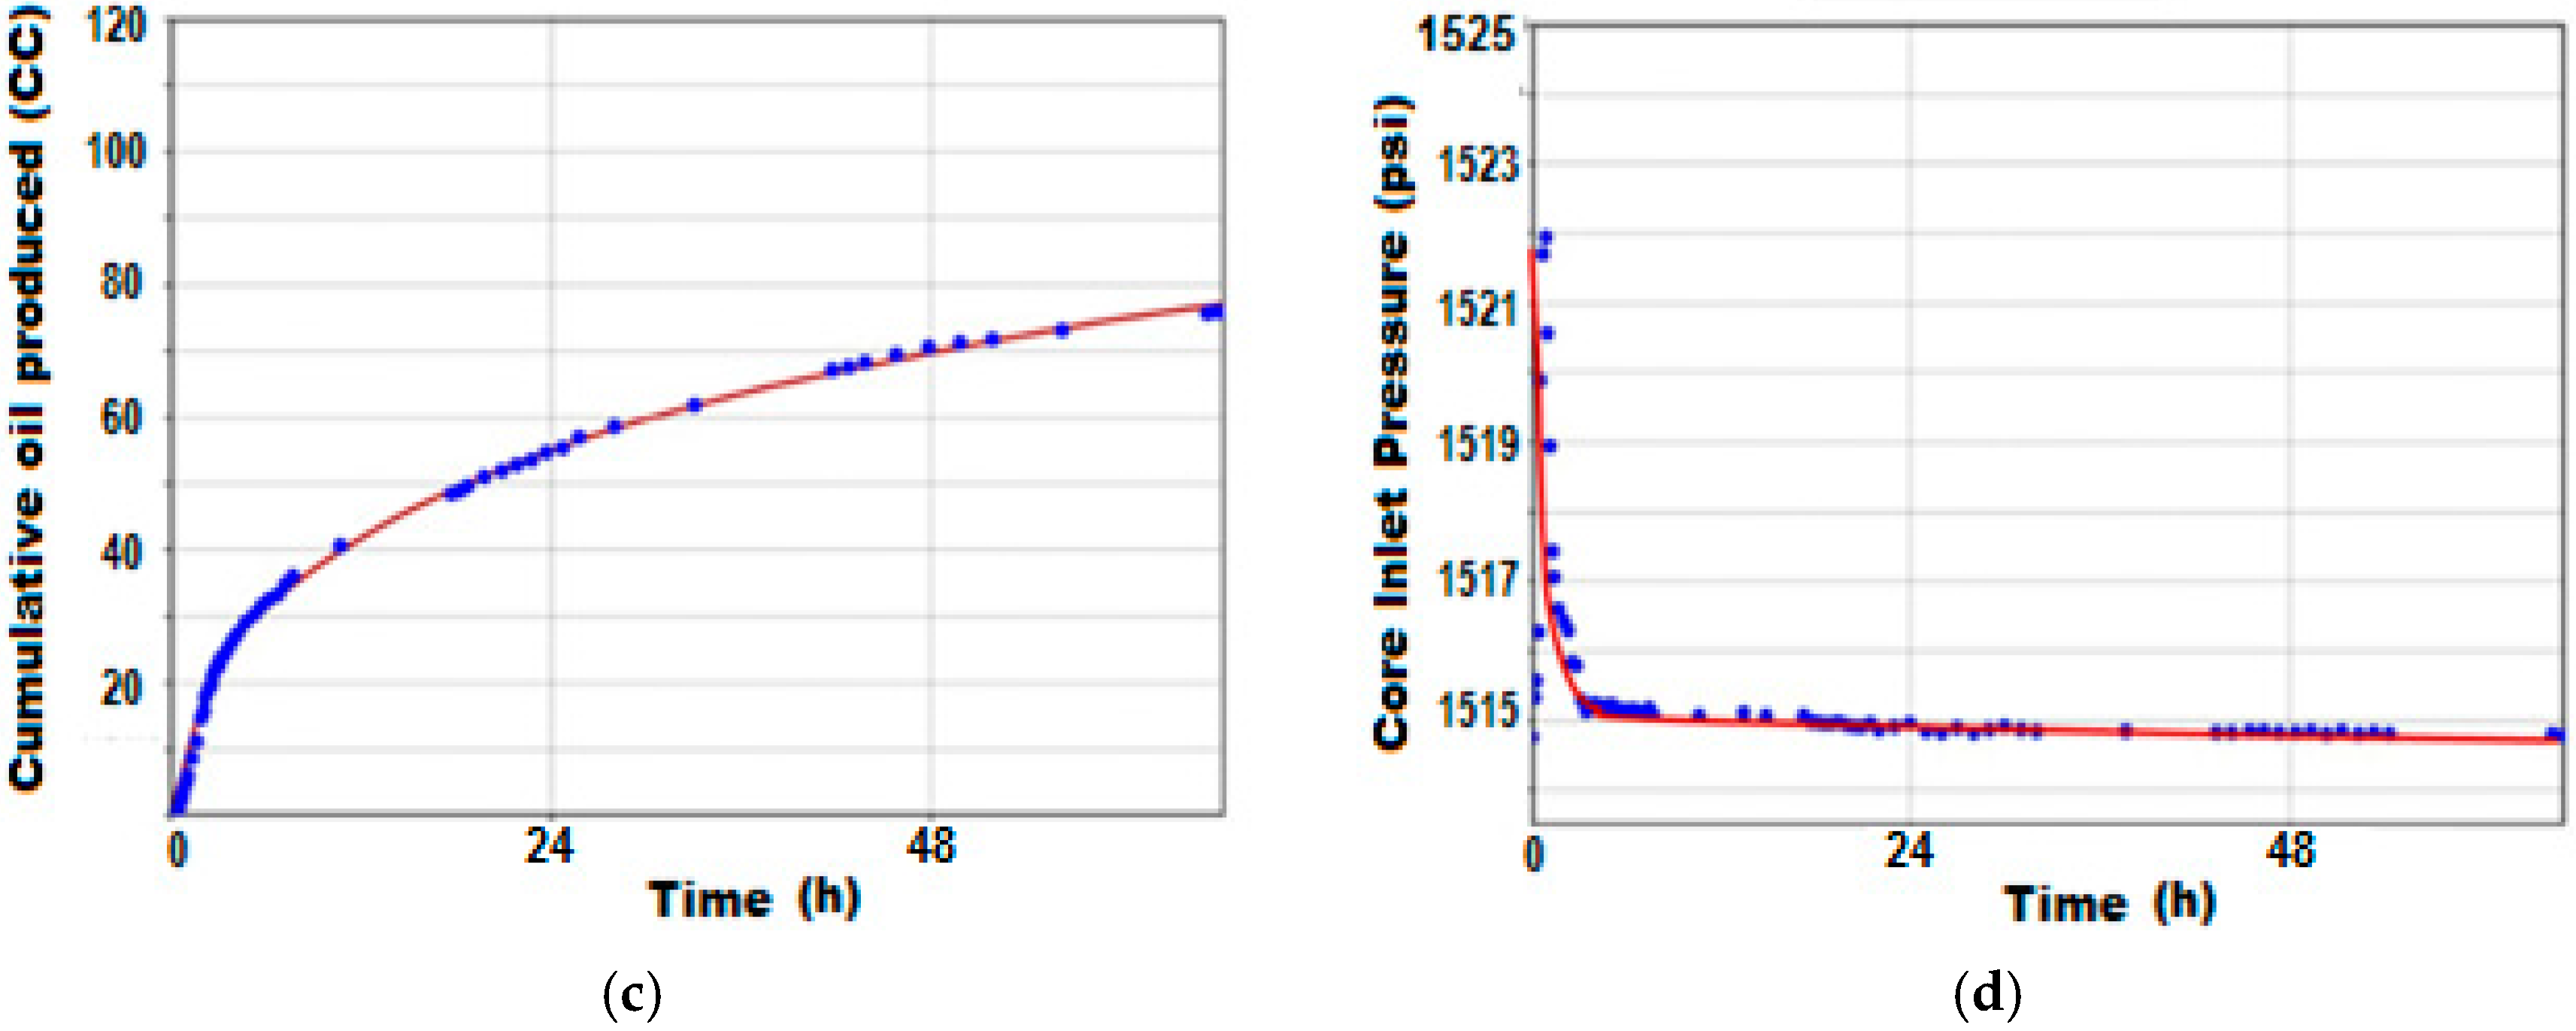
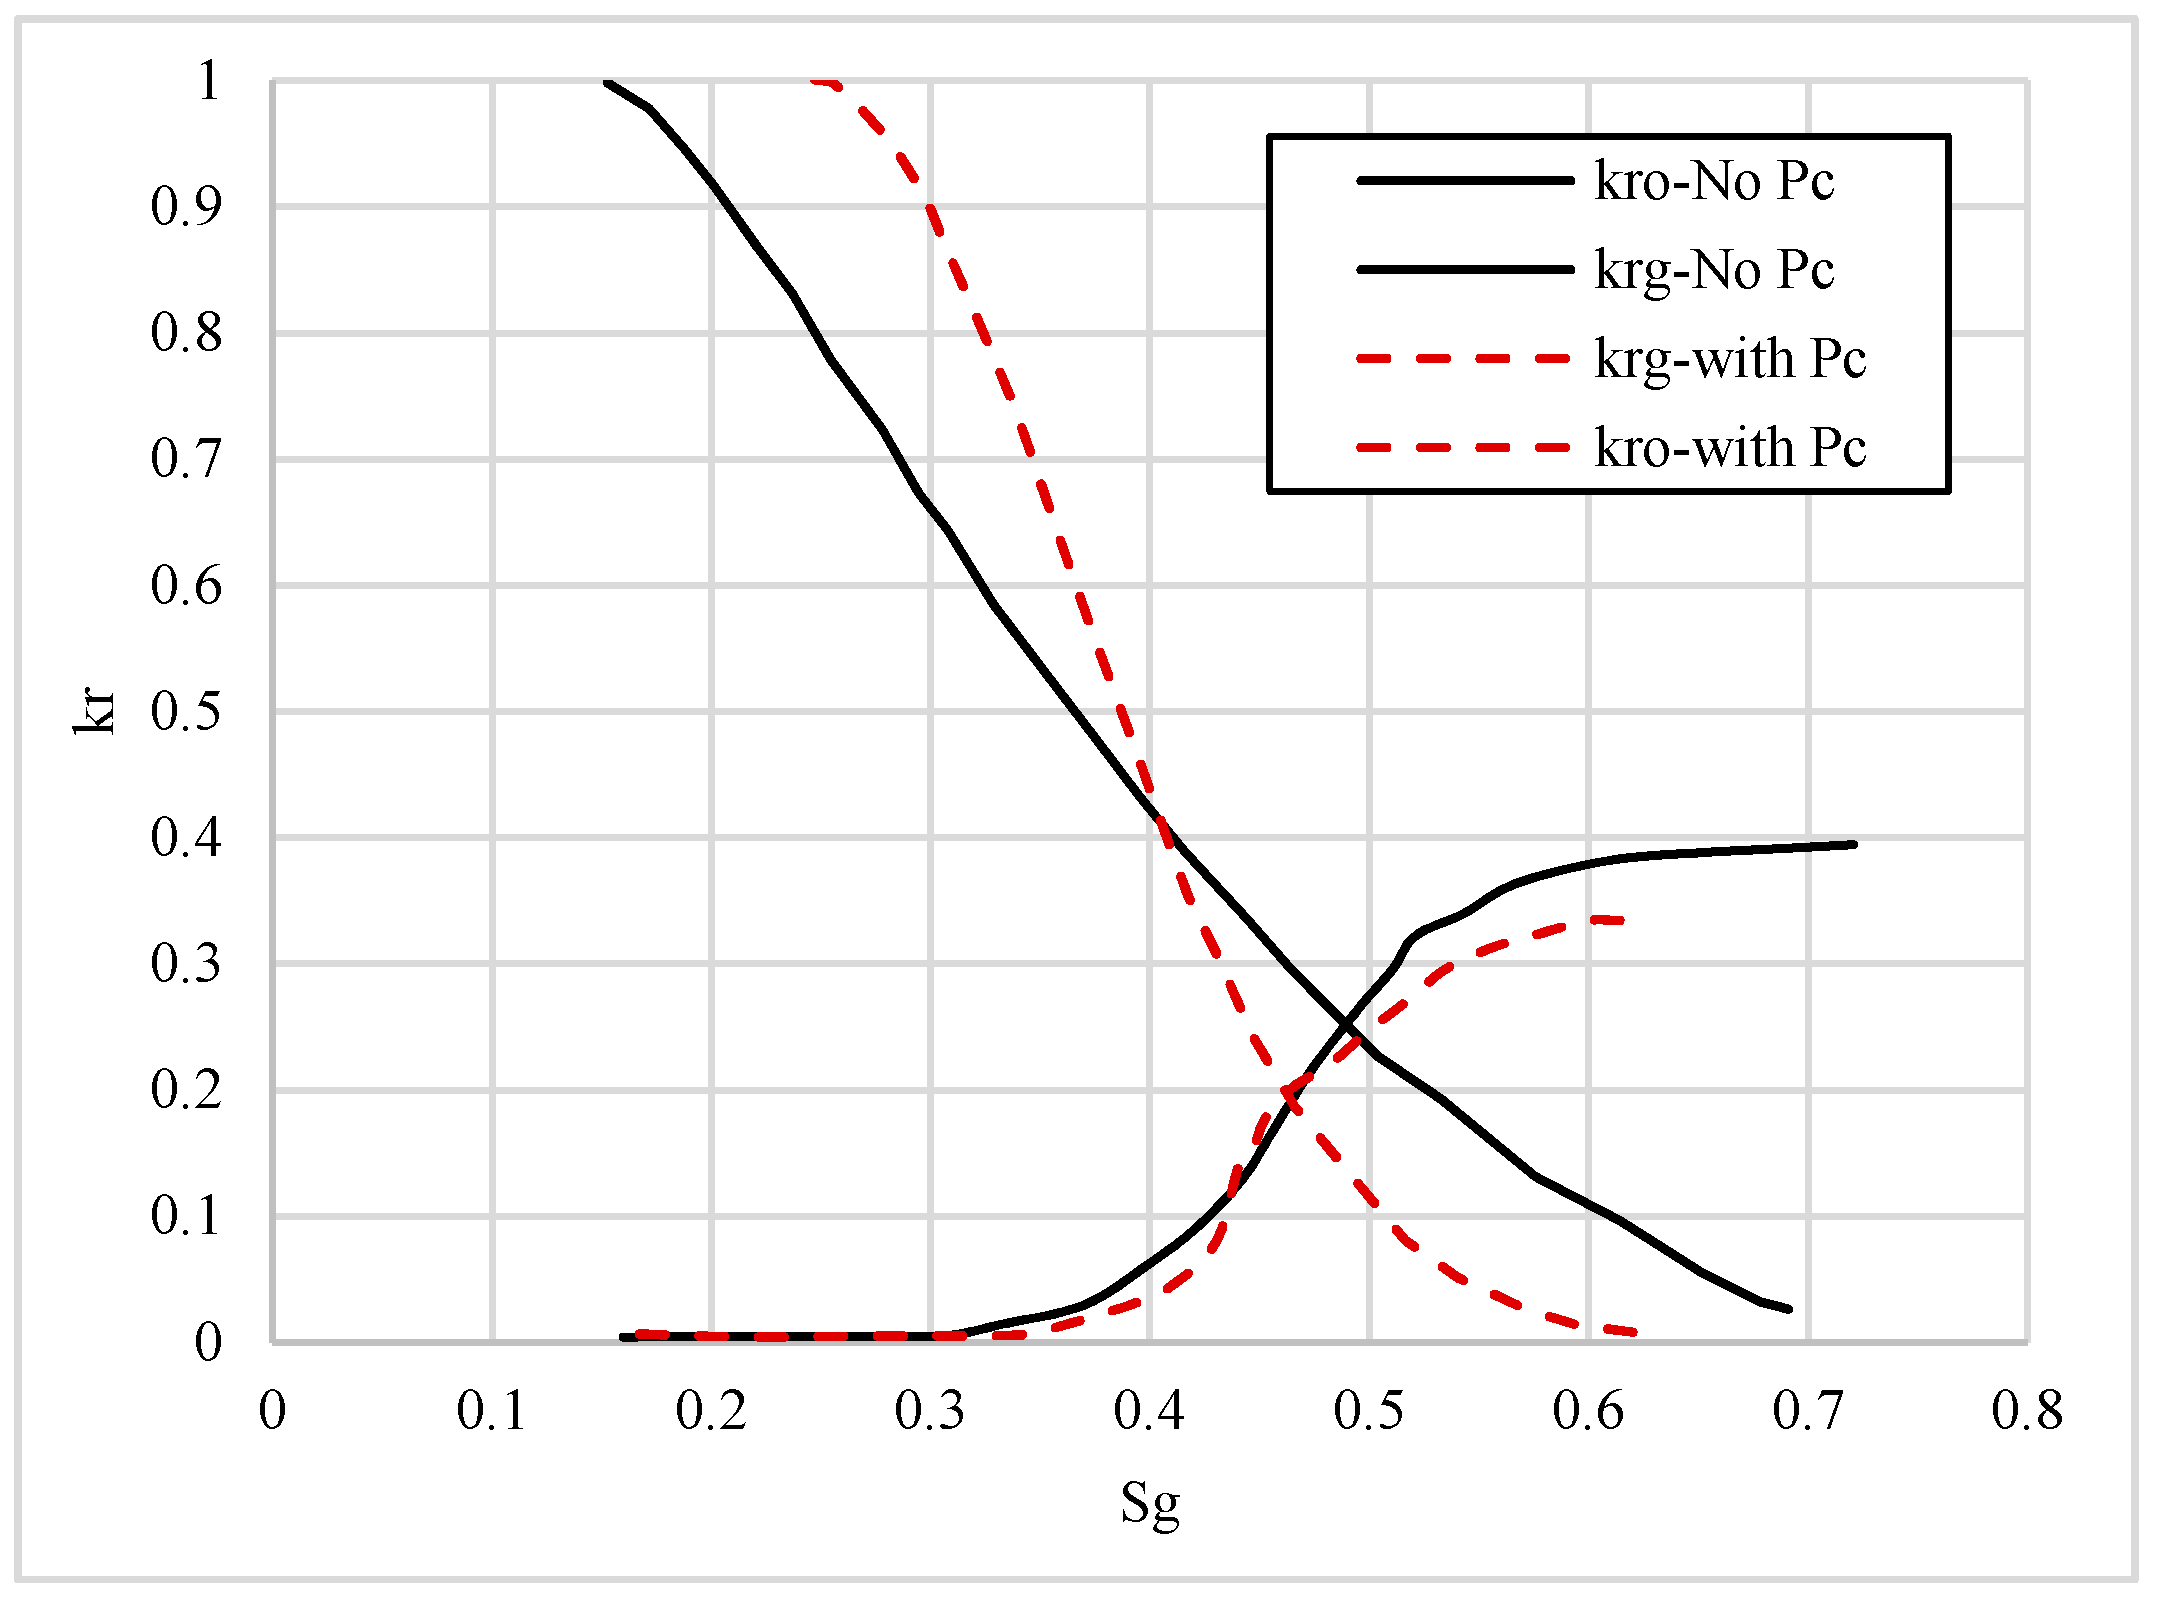
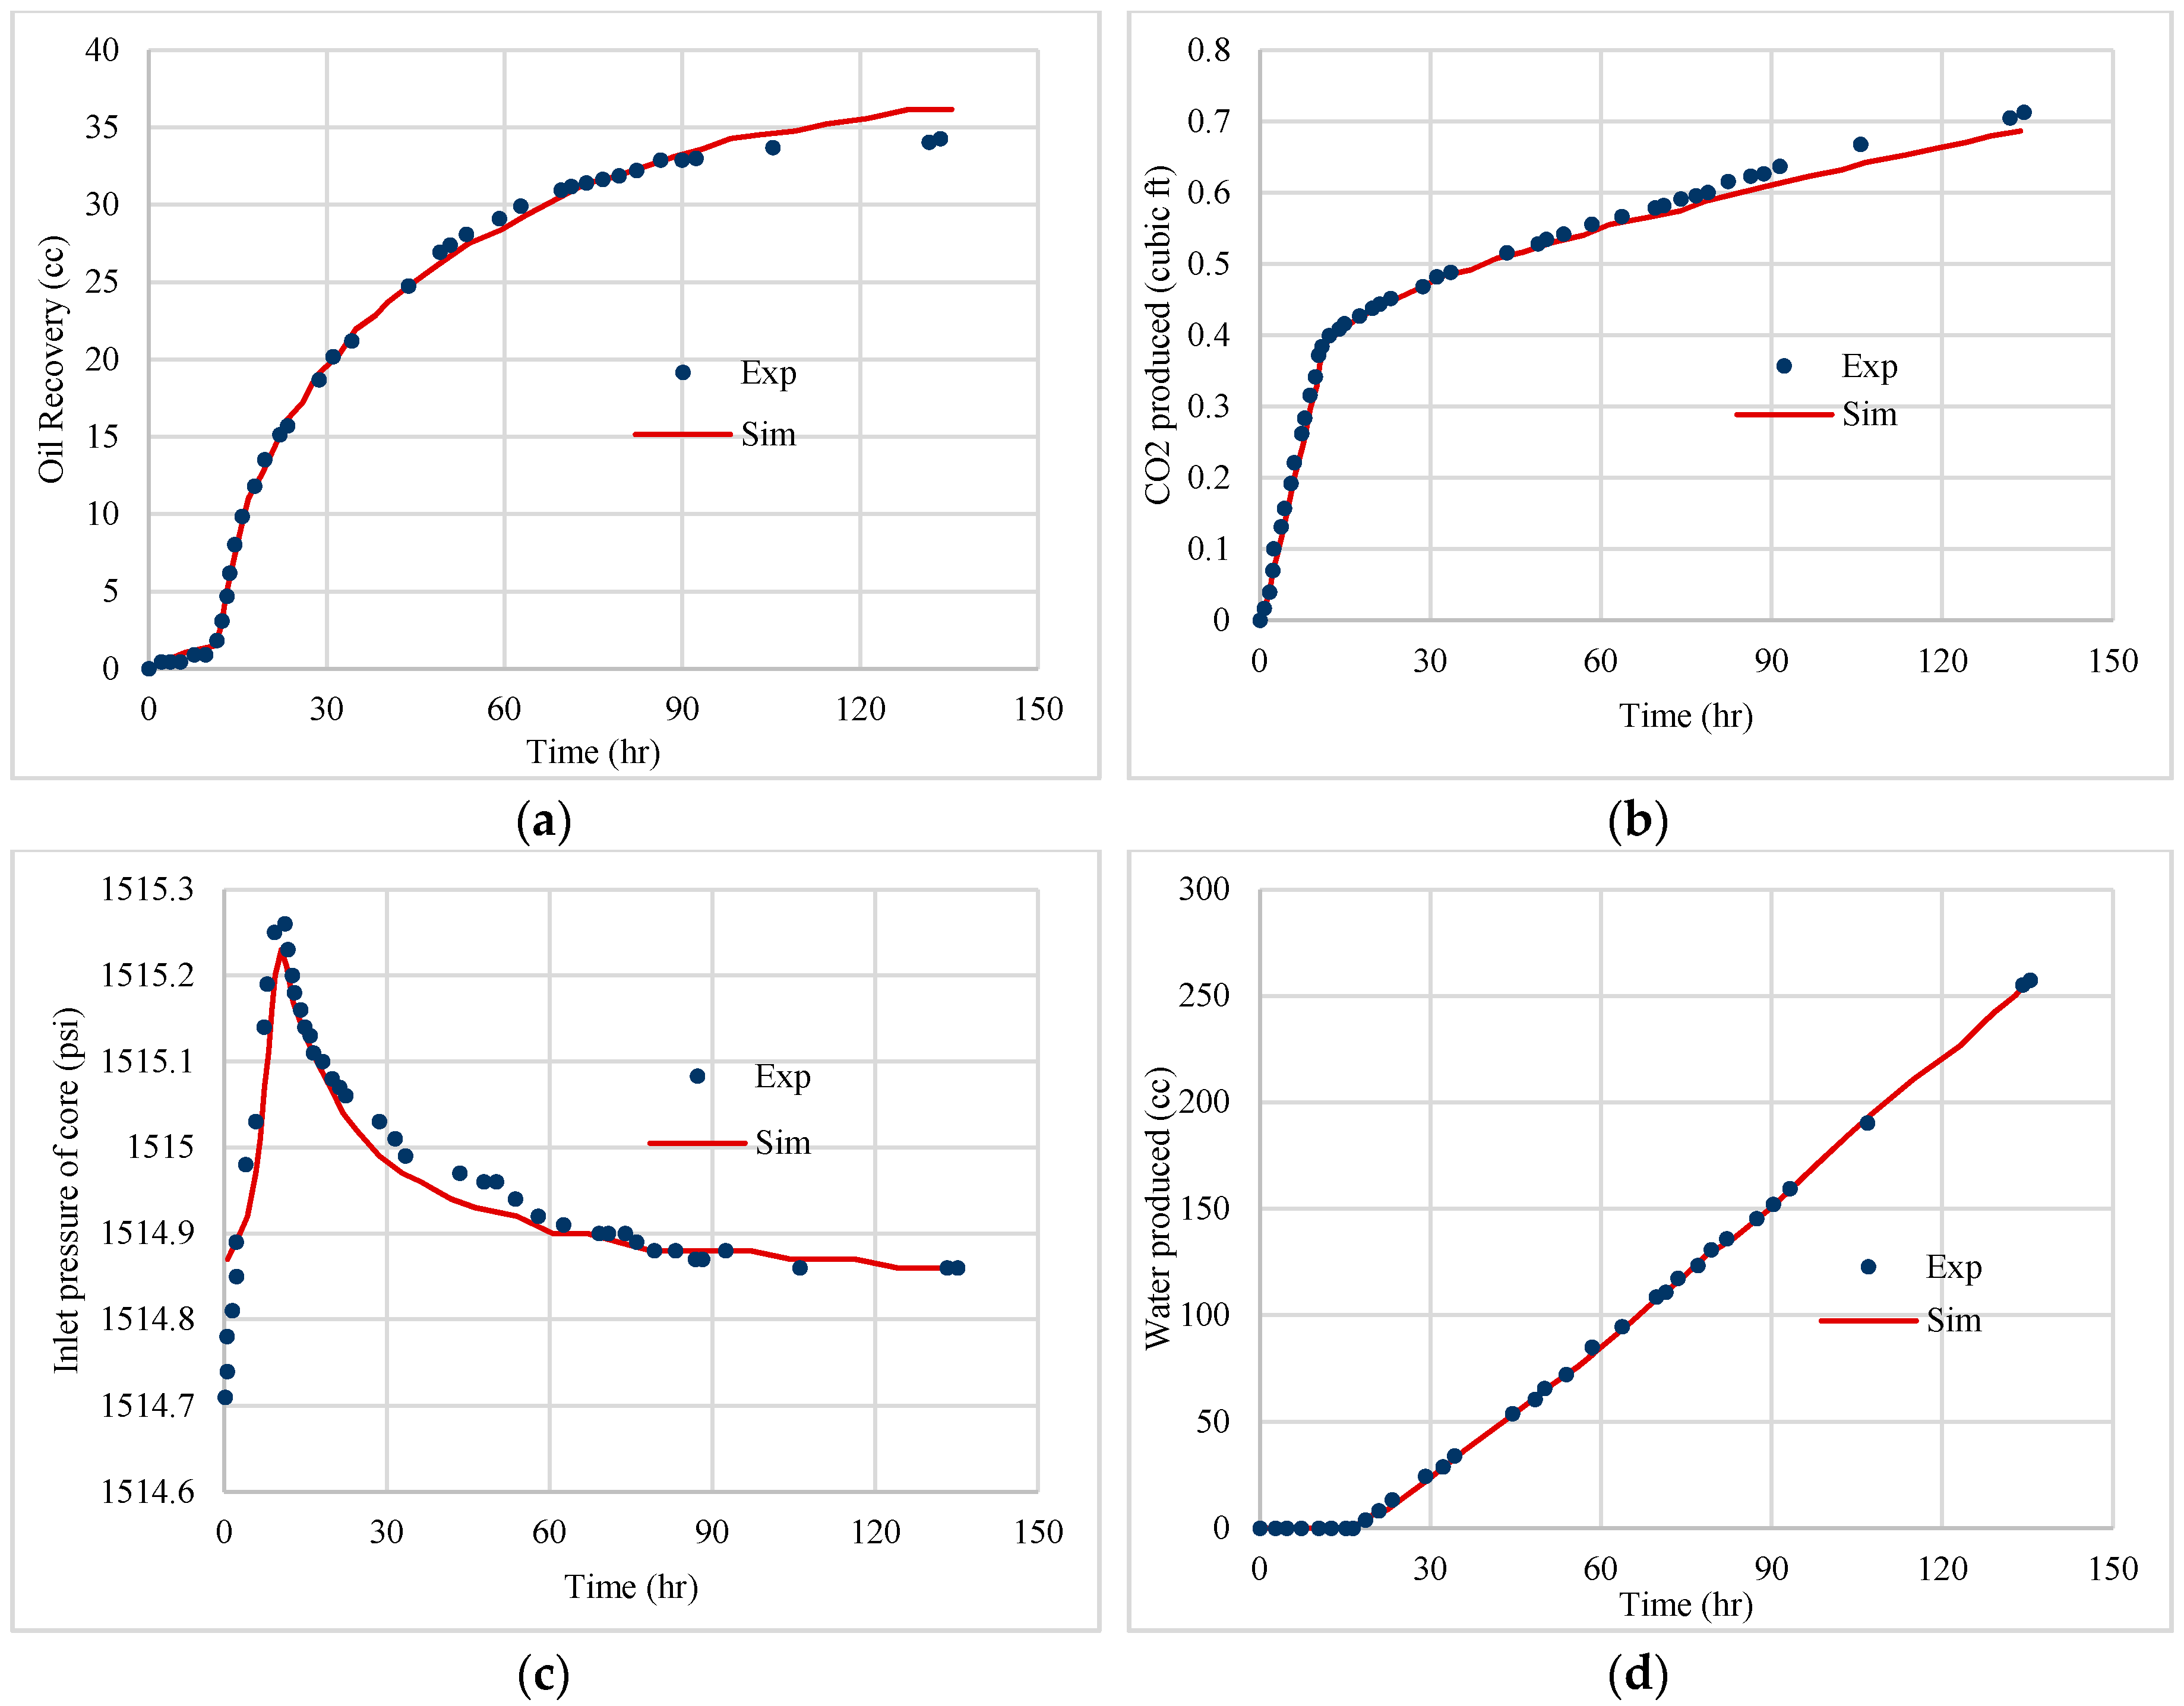
Figure 11 demonstrates the simulation results in comparison with experimental data for oil recovered, gas produced, differential pressure and water production. The estimated tertiary relative permeability is shown in
Figure 12. It can be observed that not only the end-point saturations were affected by tertiary water injection, but also the relative permeabilities changed. The changes (between secondary and tertiary injection scenarios) in oil/water relative permeability are much smaller compared to those of gas/liquid relative permeability. This can be due to the large variation in the viscosity ratios at the different cycles. For instance, in the secondary CO
2 injection, liquid CO
2 with a viscosity of 0.072 cp displaced the resident oil with a viscosity of 617 cp, whereas in the tertiary water injection, CO
2 in place with a viscosity of 0.8 cp (as estimated by a tuned equation of state) was displaced by water with a viscosity of 0.9 cp, which is more viscous than CO
2. Therefore, viscosity pairs are critical in the estimation of relative permeabilities, which in turn can be linked to the occurrence of frontal instabilities.
In the case of the oil/water relative permeabilities, a notable change in end-point saturation can be identified, with only a slight change in the shape of relative permeabilities. In other words, the residual oil saturation in the waterflooding has been considerably improved. This improvement in end-point saturations can be attributed to a physical phenomenon, which is the better oil viscosity in the area previously swept by CO2 (oil with viscosity of 16 cp due to CO2 dissolution), which makes the oil more recoverable. Additionally, based on this simulation result, we can conclude that CO2-WAG can perform efficiently in the case where CO2 initially dissolves in the oil, reduces its viscosity, and is consequently followed by water injection, which then readily recovers more mobile oil.
The outcome of history matching performed for the tertiary water injection has exhibited a meaningful displacement efficiency that can be supported by the fact that the waterflood invasion would be controlled by the viscosity upgrading introduced by CO
2 dissolution.
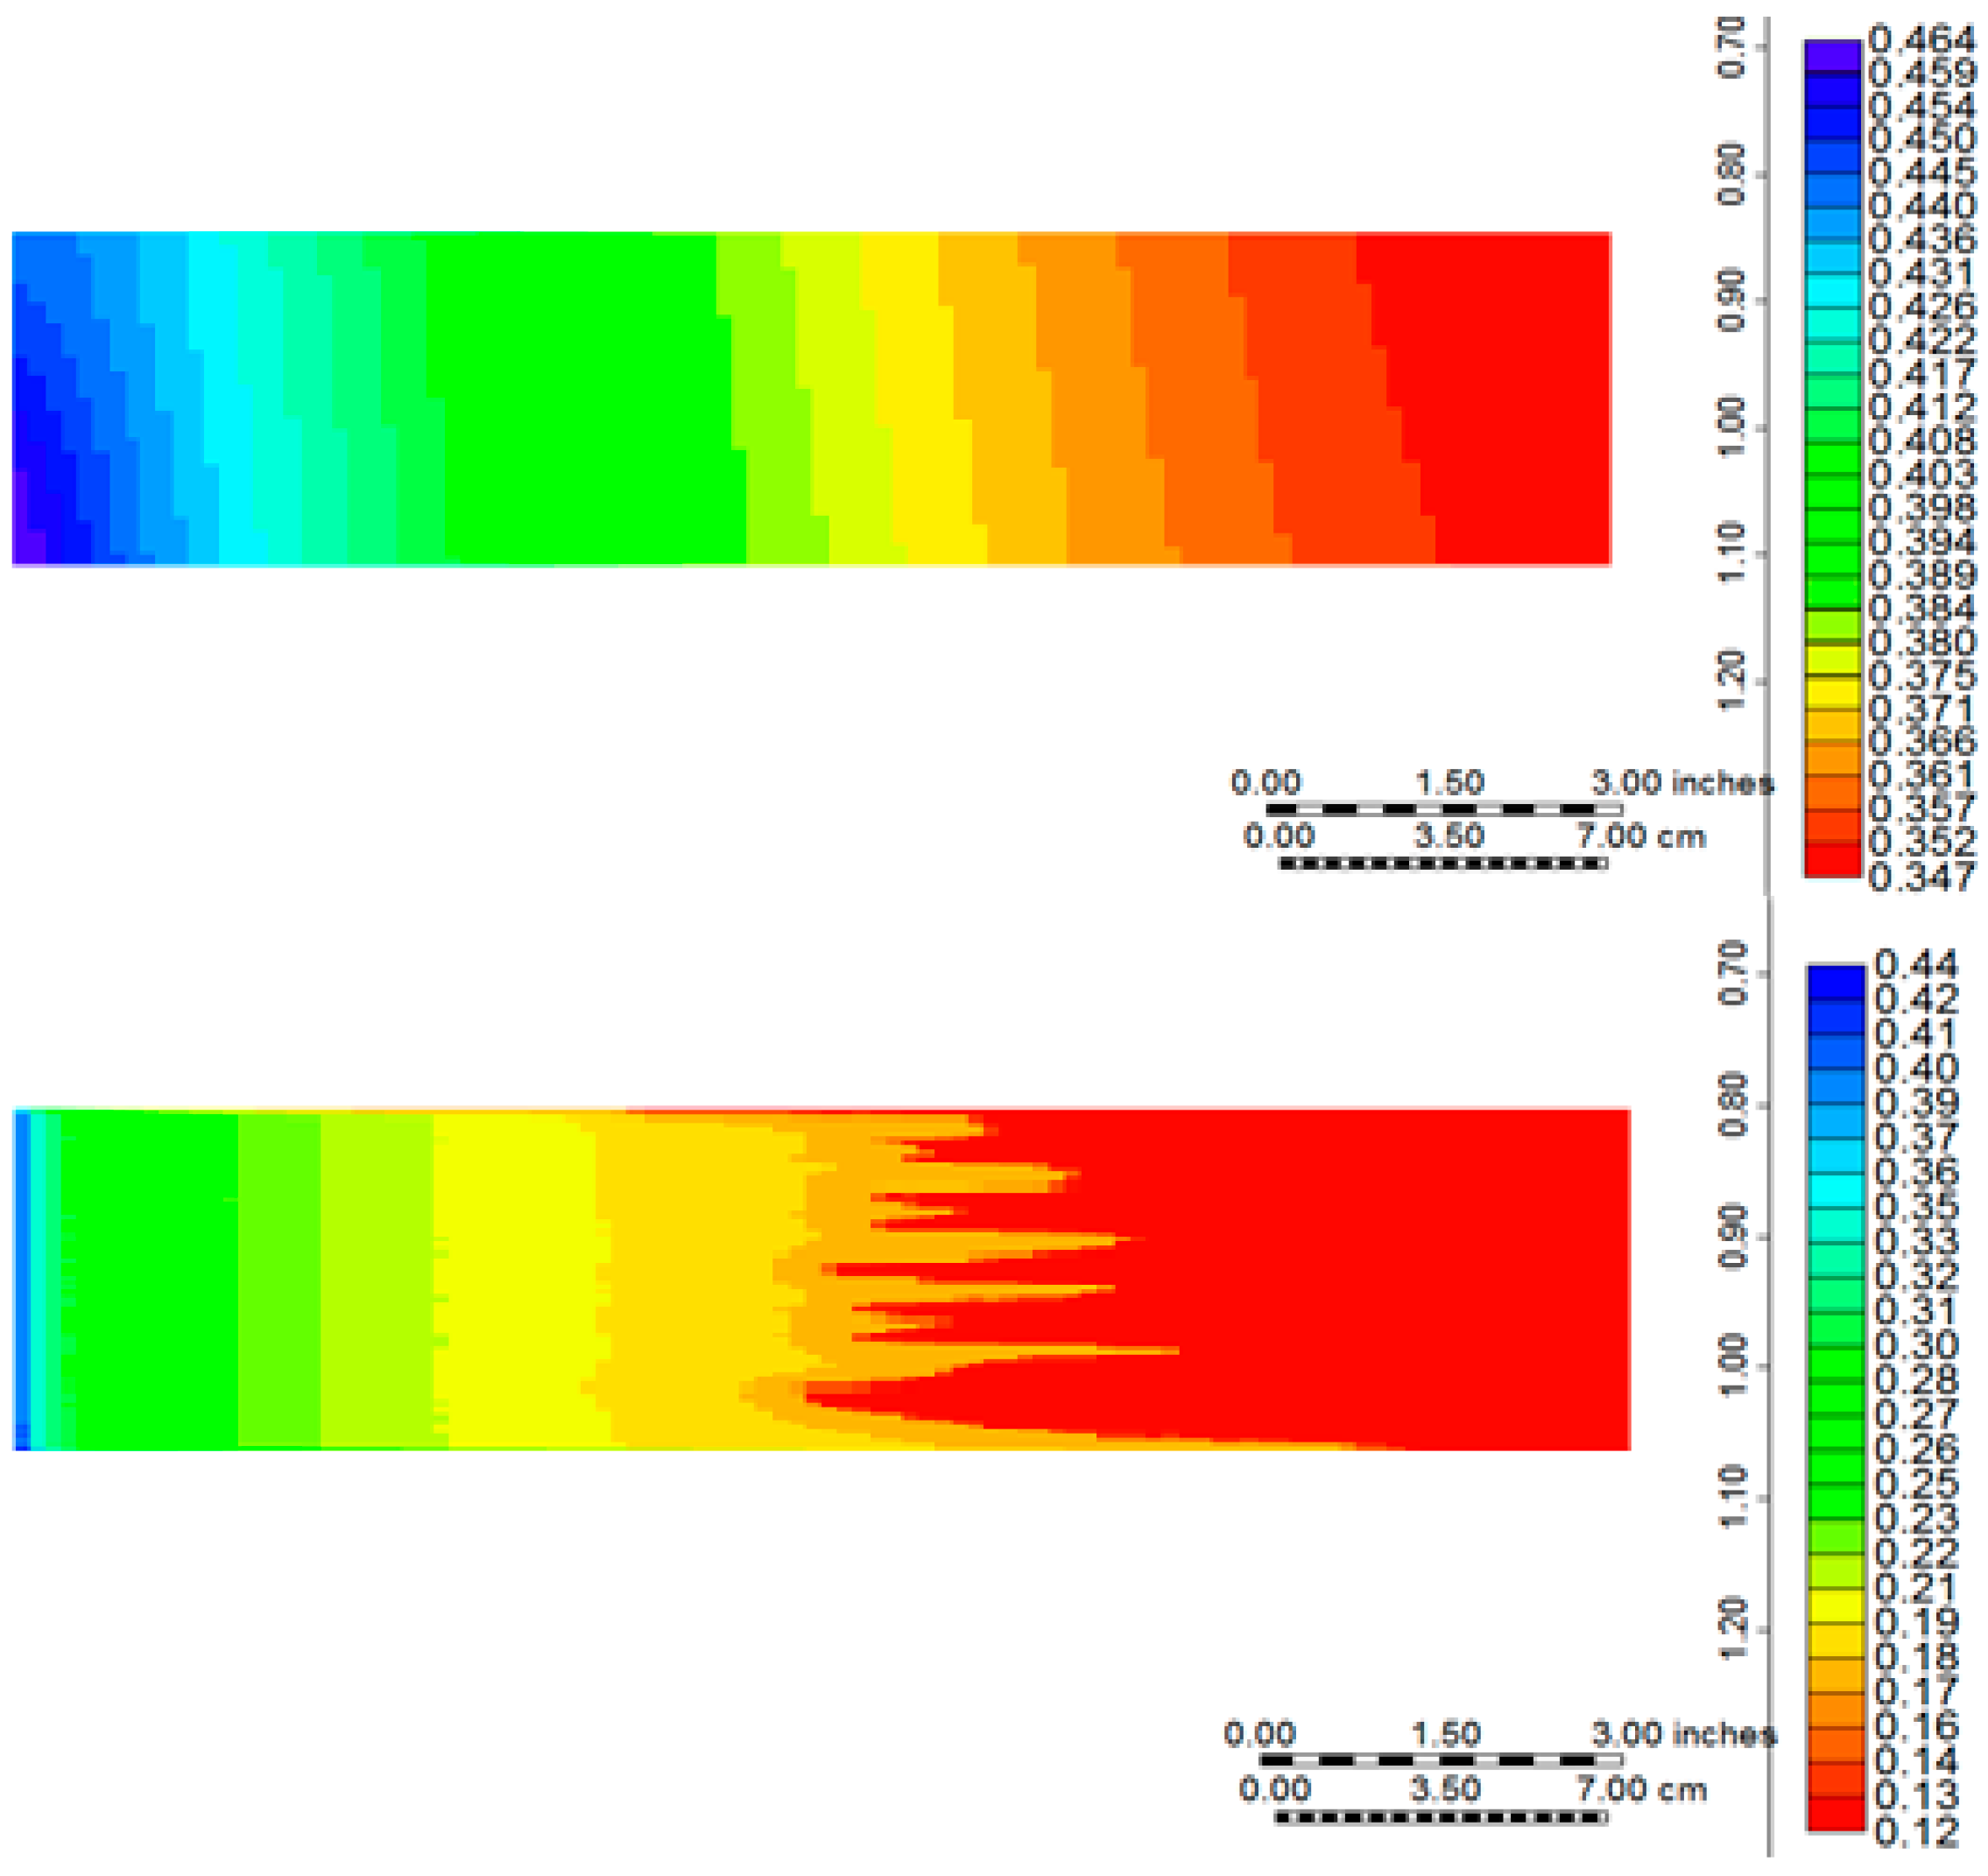
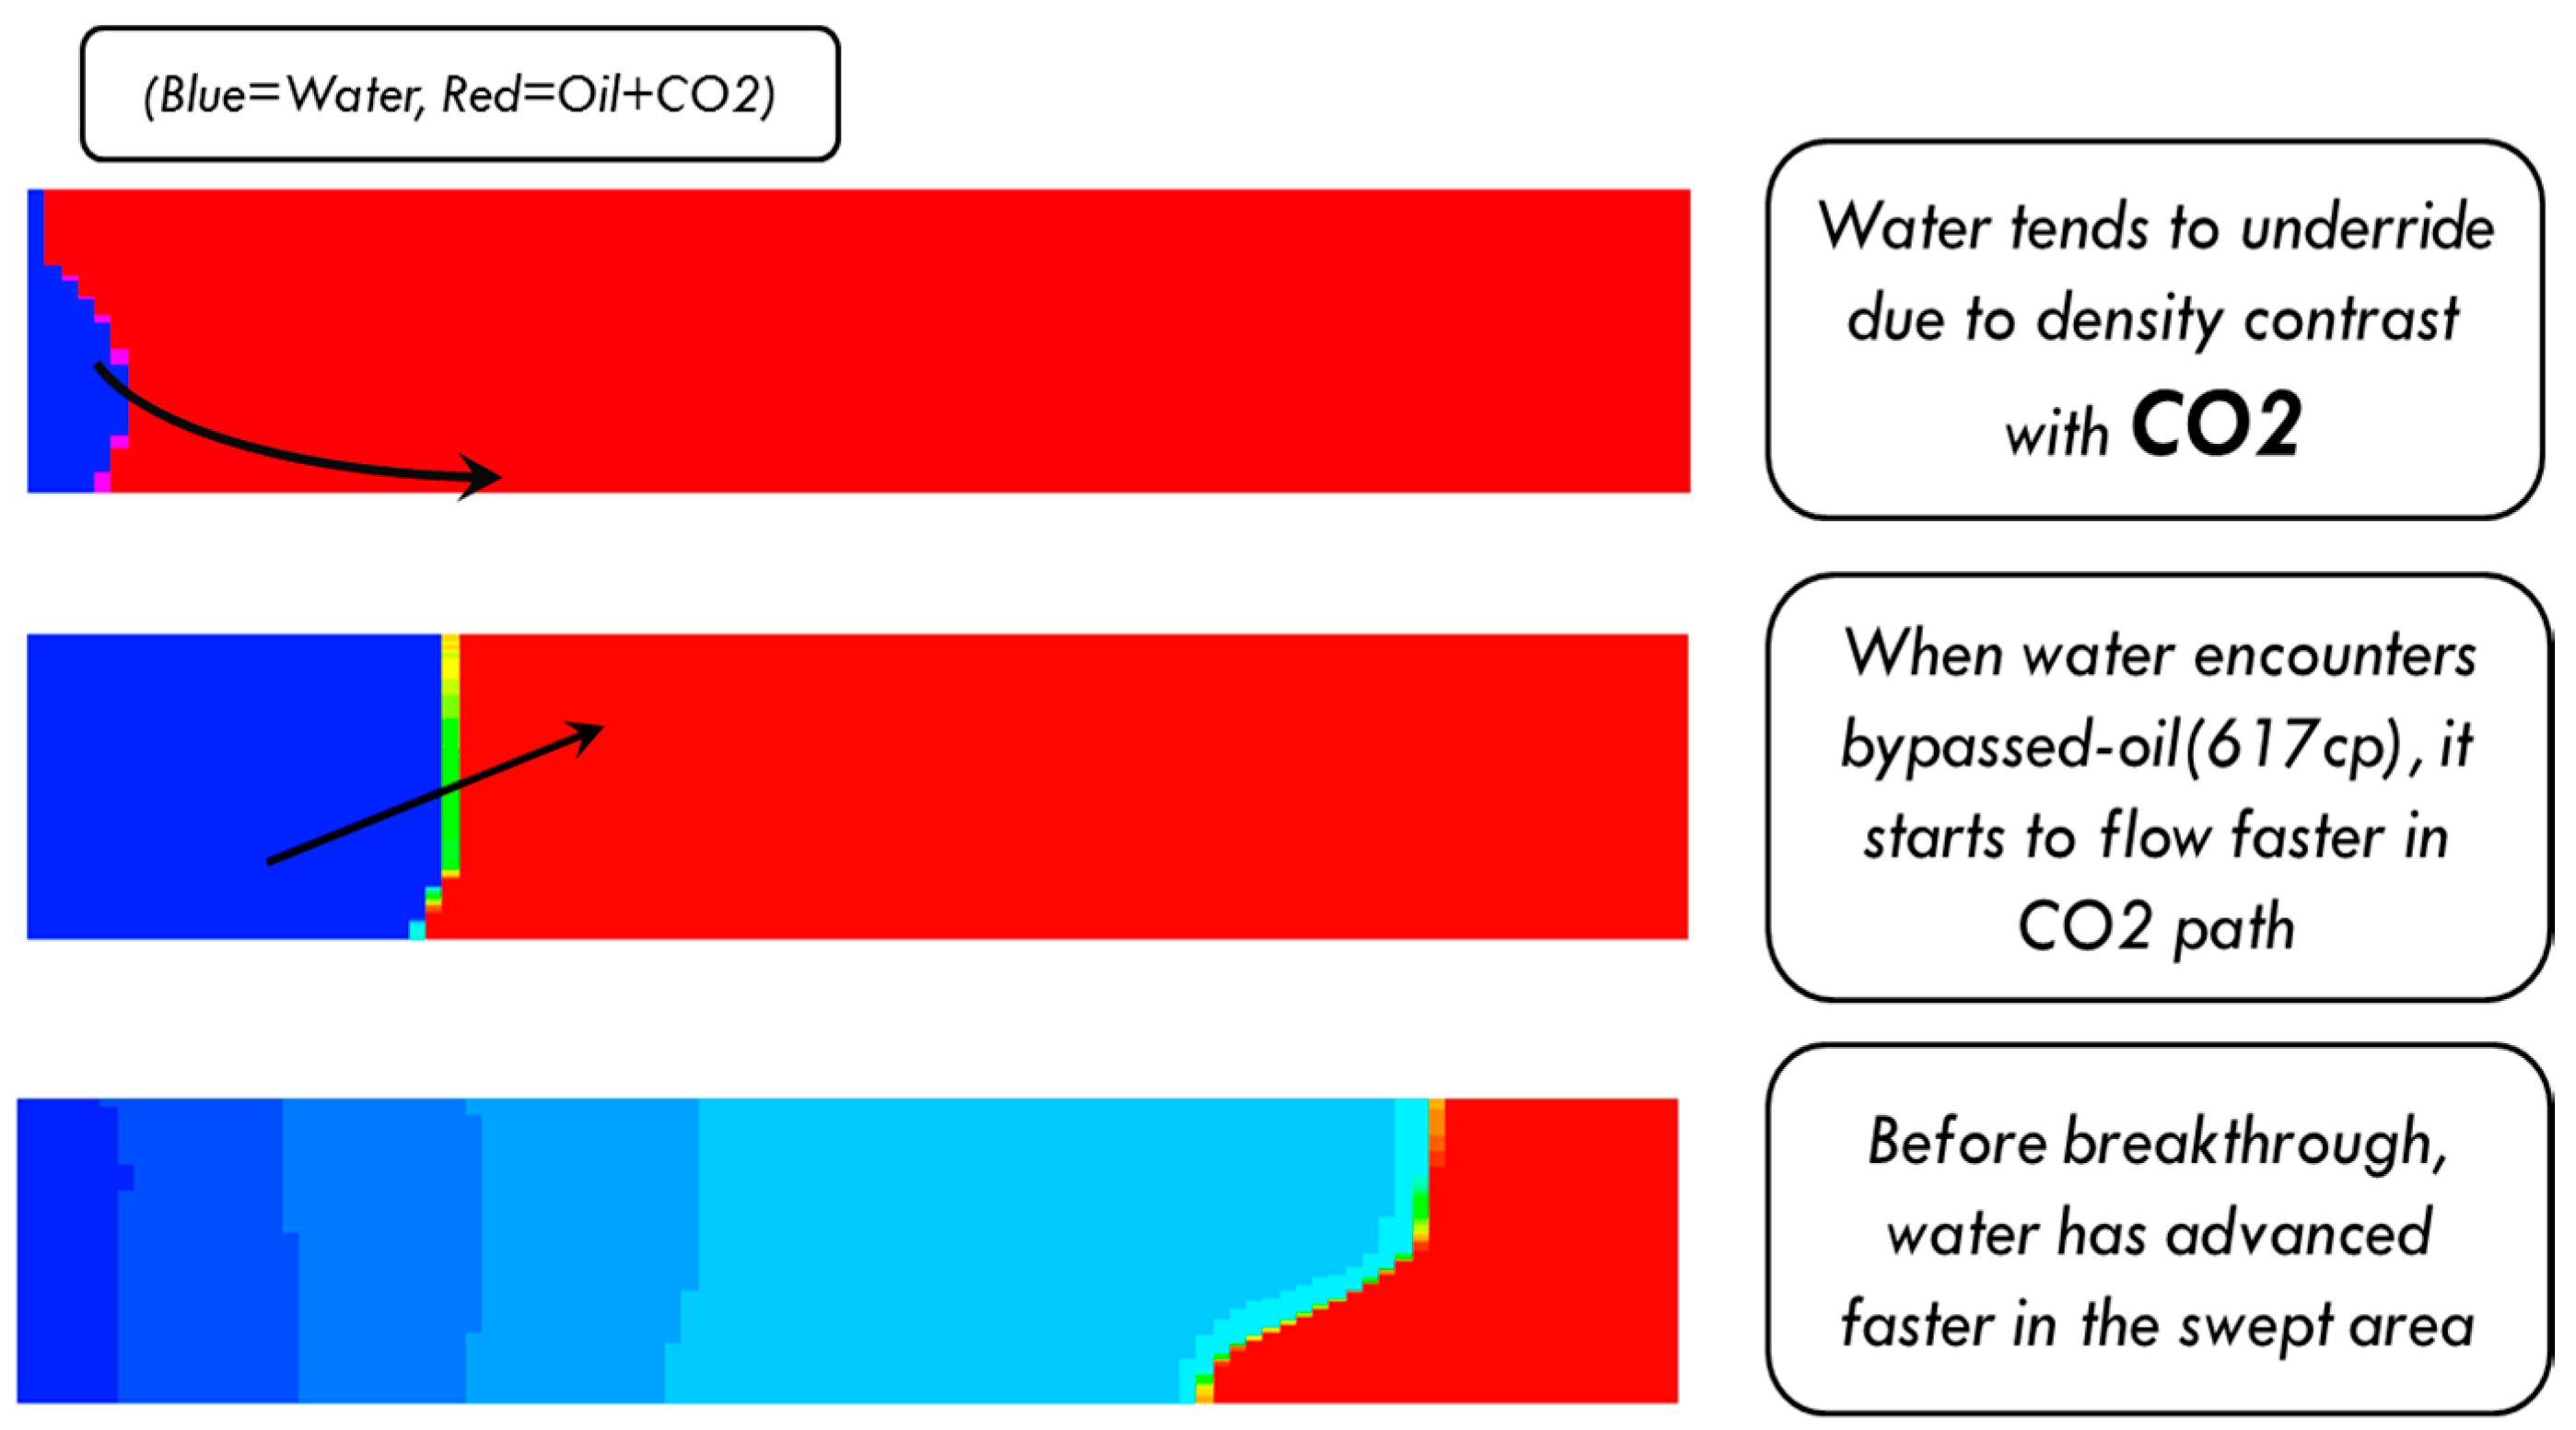
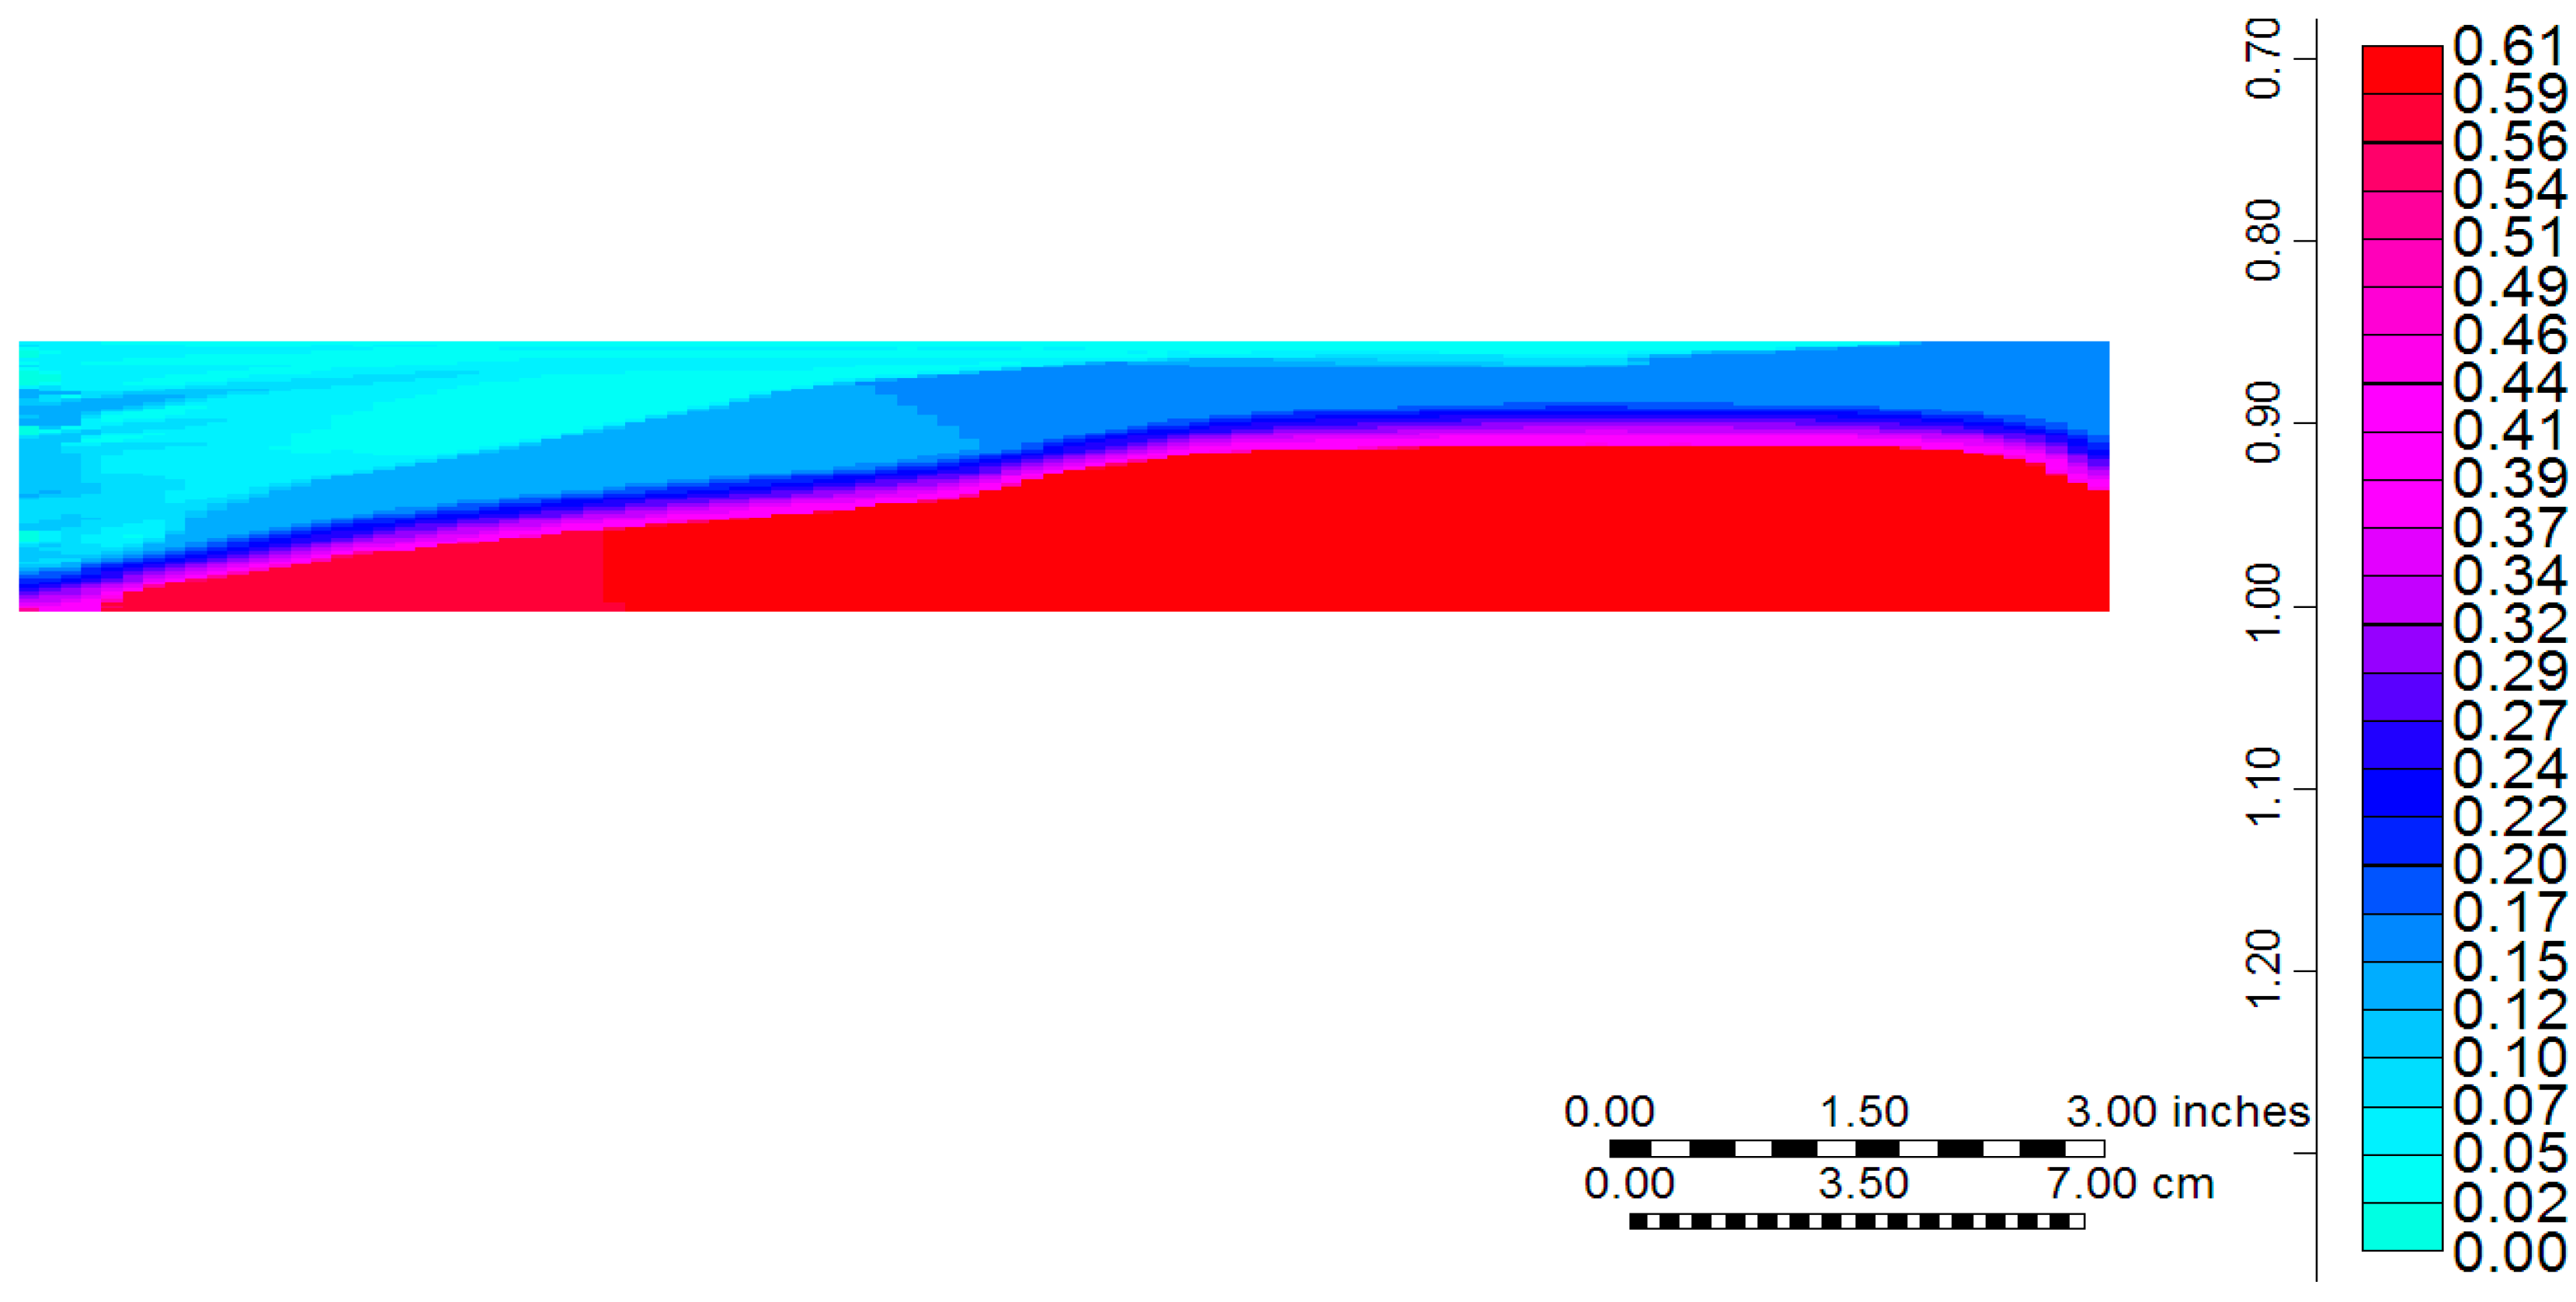
Figure 13 shows the water saturation distribution extracted from the simulation results, which highlights the sweeping pattern of the tertiary water advancement. In the early stage of water injection, water tended to underride the resident CO
2 and oil. However, the water-front became more stable when it encountered the bypassed oil at the bottom of the core with high viscosity (617 cp) as shown in the middle image. Later on, as the water advanced, the front flowed through the pre-swept area easier than the bypassed oil, which brought about another type of instability controlled by the contrast in viscosities of oil in two different regions. The main finding here was the preference of water to displace the resident gas compared to the residual oil in the bypassed region. In conventional WAG injection (light to medium oils), it is believed that water and gas would invade different paths based on the competition of capillary forces (or, in other words, wettability) [
50]. Also, trapped gas saturation would contribute to oil recovery in water injection cycles by diverting the invading water to remaining oil saturations. However, as seen in the simulation of this experiment (post CO
2 injection in viscous oil systems), the large contrast in viscosities of displacing and displaced fluids would form a selection criterion for the water and gas paths. This process would have another implication: most of the hysteresis models have been derived based on the fluid trapping and wettability regimes, e.g. Land’s [
19] and Larsen and Skauge [
51] models. However, here, the viscosity ratio would change both pore-scale and sweep efficiencies, which would necessitate a thorough investigation on the validity of hysteresis models in adverse mobility conditions.
Simulations and history matching performed on two and three-phase displacements have indicated several findings. From the relative permeability curves estimated from high resolution history matching, it can be seen that tertiary waterflood would exhibit a lower residual oil saturation, which can be attributed to less viscosity of the resident oil after CO
2 injection. Therefore, it can be postulated that changes in oil viscosity would outperform hysteresis effects in water-alternating- CO
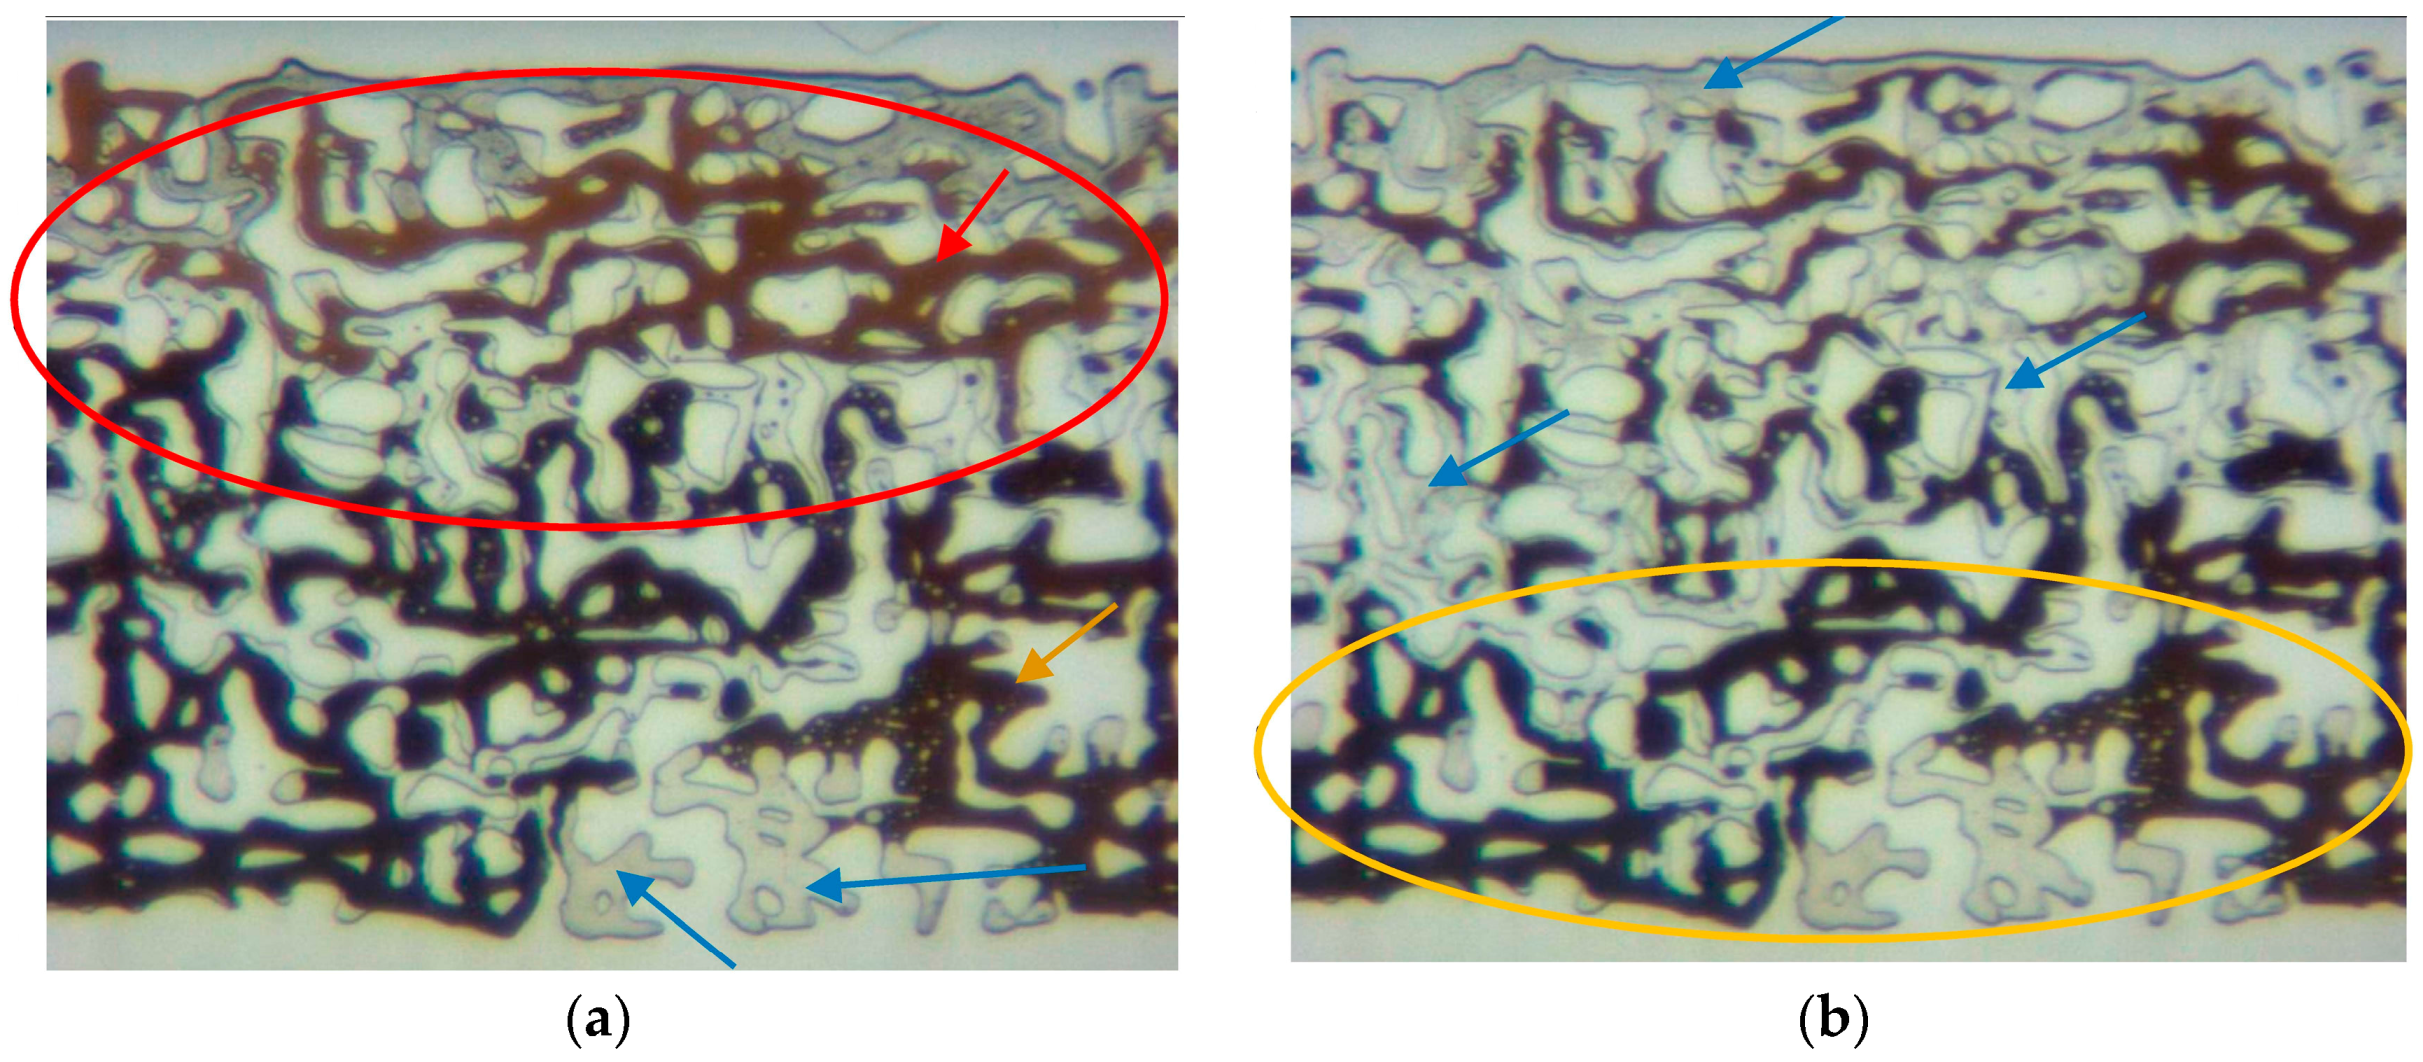
2 injection scenarios for viscous oils. In simulations of WAG injection, employing WAG-hysteresis models would impose considerable computation cost and convergence issues. Hence, provided that hysteresis effects would not be dominant in viscous oils, excluding this option in the commercial simulators would facilitate simulation runs. However, this interpretation of the simulation results needs to be verified from experimental evidence. Emadi et al. performed a series of visualization experiments in which CO
2 and water injection scenarios had been investigated for a similar viscous oil [
52].
Figure 14 depicts two snapshots of micromodel experiments where water injection was carried out after CO
2 injection, which is closely similar to the coreflood experiments analyzed in this simulation work. After CO
2 injection (
Figure 14a), the remaining oil contacted with the CO
2 has a completely different color, which reflects lower viscosity of the oil due to CO
2 dissolution. When water was injected (
Figure 14b), the invading water has demonstrated more efficiency to displace the oil with lower viscosity. This can be directly identified from comparison of pore-scale efficiencies at top (better displacement) and bottom (higher oil viscosity and poorer pore-scale efficiency) of the porous medium. Therefore, the interpretations from simulation results can be supported from micromodel observations.
6. Simulation of Simultaneous Water and Gas Injection into Heavy Oil (Experiment 4)
In Experiment 4, water and CO
2 were simultaneously injected at equal rates (each one at 3.5 cc/h) in a process known as simultaneous water and gas (SWAG). In conventional light oil displacement using this method, capillary forces play a crucial part in the preference for pore occupancy by the fluids. However, in heavy oil displacement using SWAG, where the gas is partially dissolvable in the oil, which leads to a significant viscosity reduction, viscous forces are dominant over capillary forces in preference for pore occupancy by the fluids. Consequently, from flow functions point of view, a reliable set of relative permeability functions coupled with a consistent viscosity reduction correlation would suffice to simulate the coreflood experiments. Here, an attempt was made to perform a forward simulation (not history matching) where the SWAG coreflood experiment was simulated by using directly the relative permeability obtained in the previous history matching since the experimental condition (as well as the rock and fluid properties) are similar. Because CO
2 has a notably higher mobility compared to water during the simultaneous injection, it is plausible that the injected CO
2 would move ahead of the water. This is also evident from the different breakthrough times of secondary CO
2 (Experiment 1) and water (Experiment 2) injections, where the breakthrough time of CO
2 was significantly earlier. In other words, it would be a reasonable assumption that CO
2 flow can be controlled by the relative permeabilities obtained from the secondary CO
2 injection process. However, two choices exist for the water relative permeability based on the water injection modes; either secondary or tertiary relative permeability. Therefore, two simulations were run in a 2D compositional model.
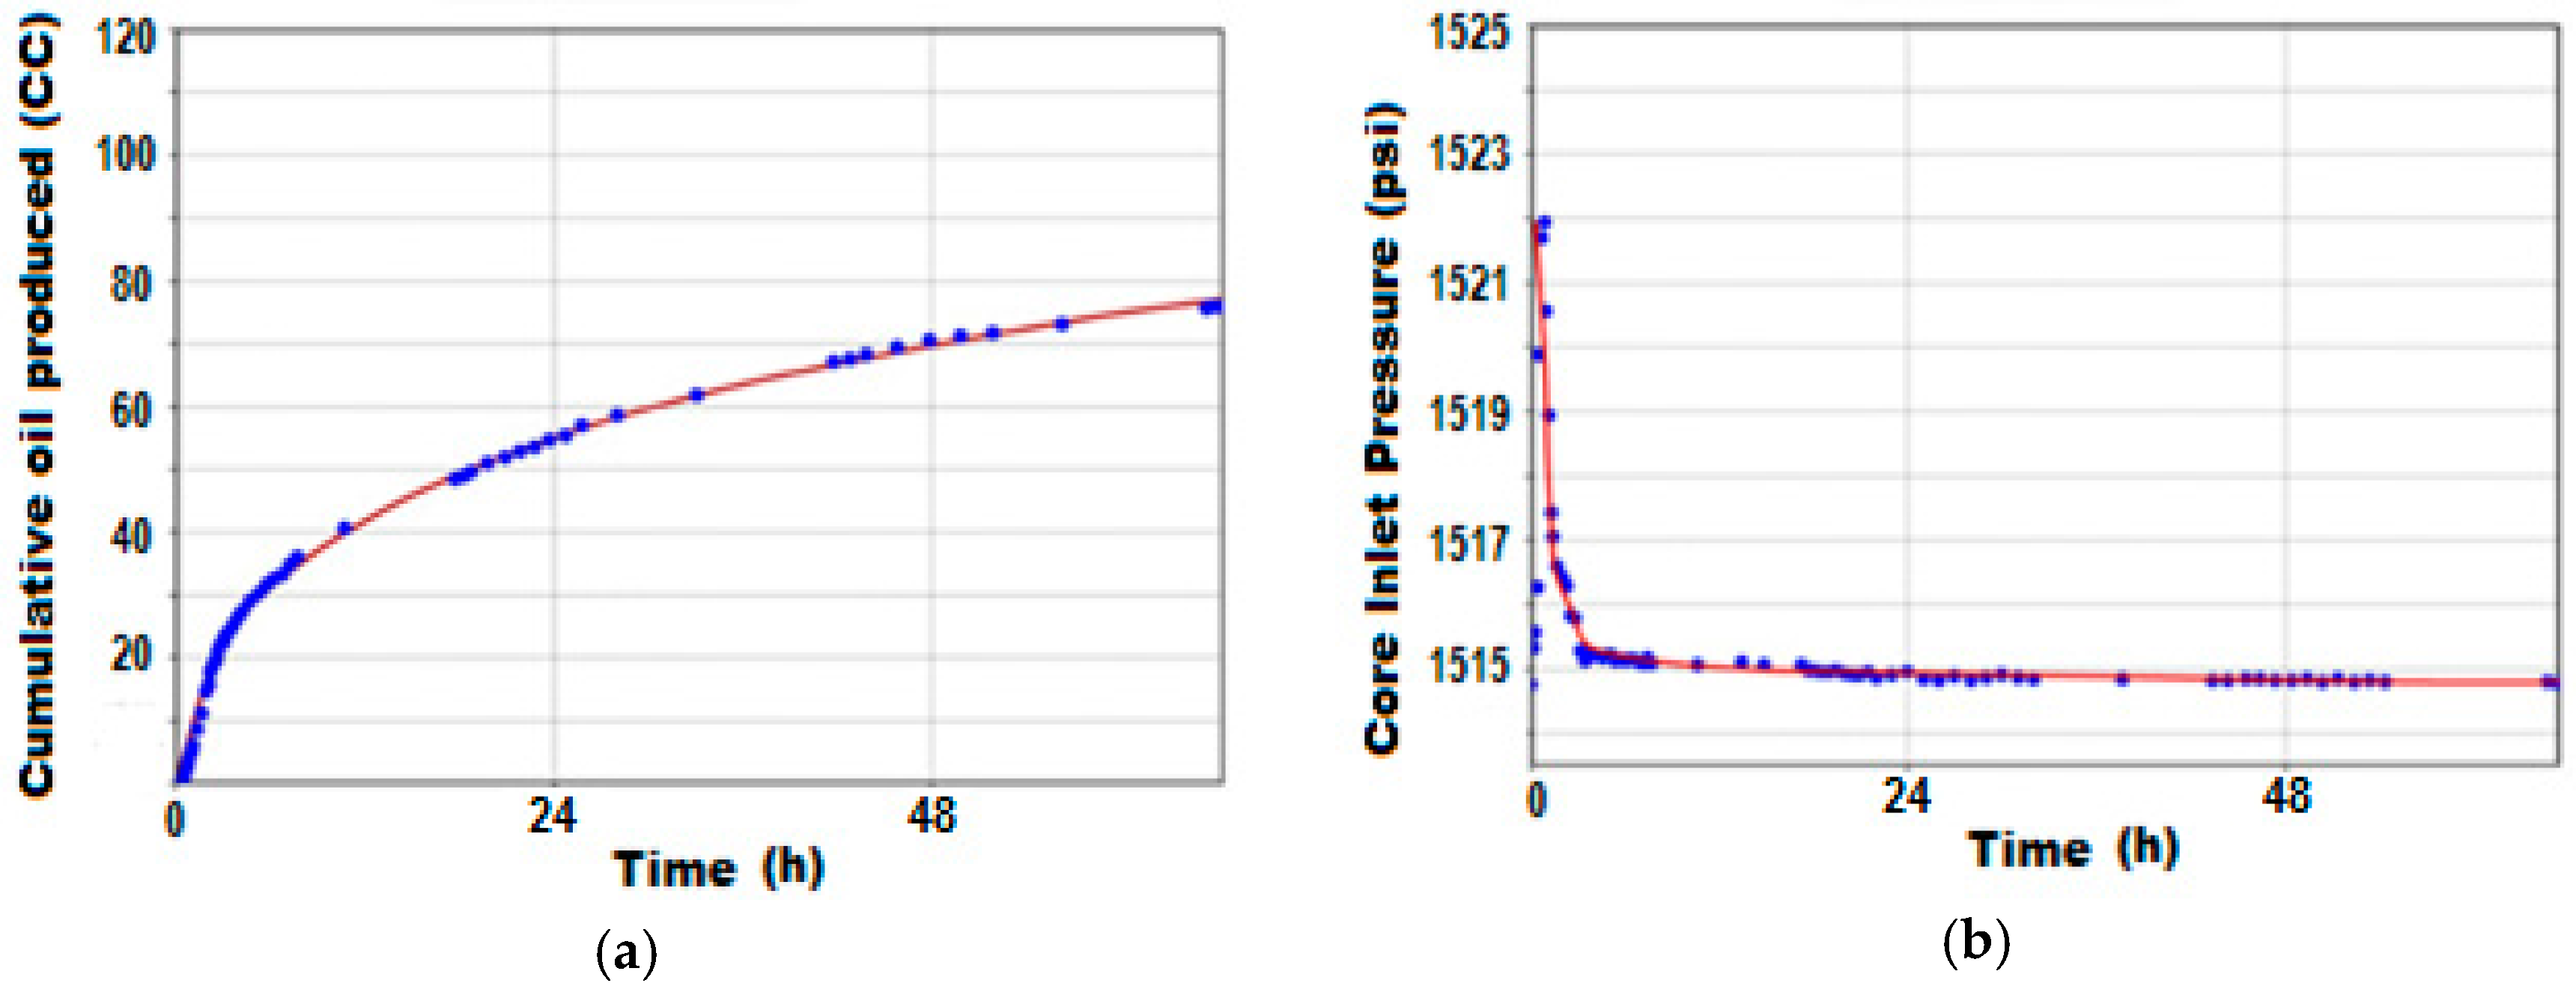
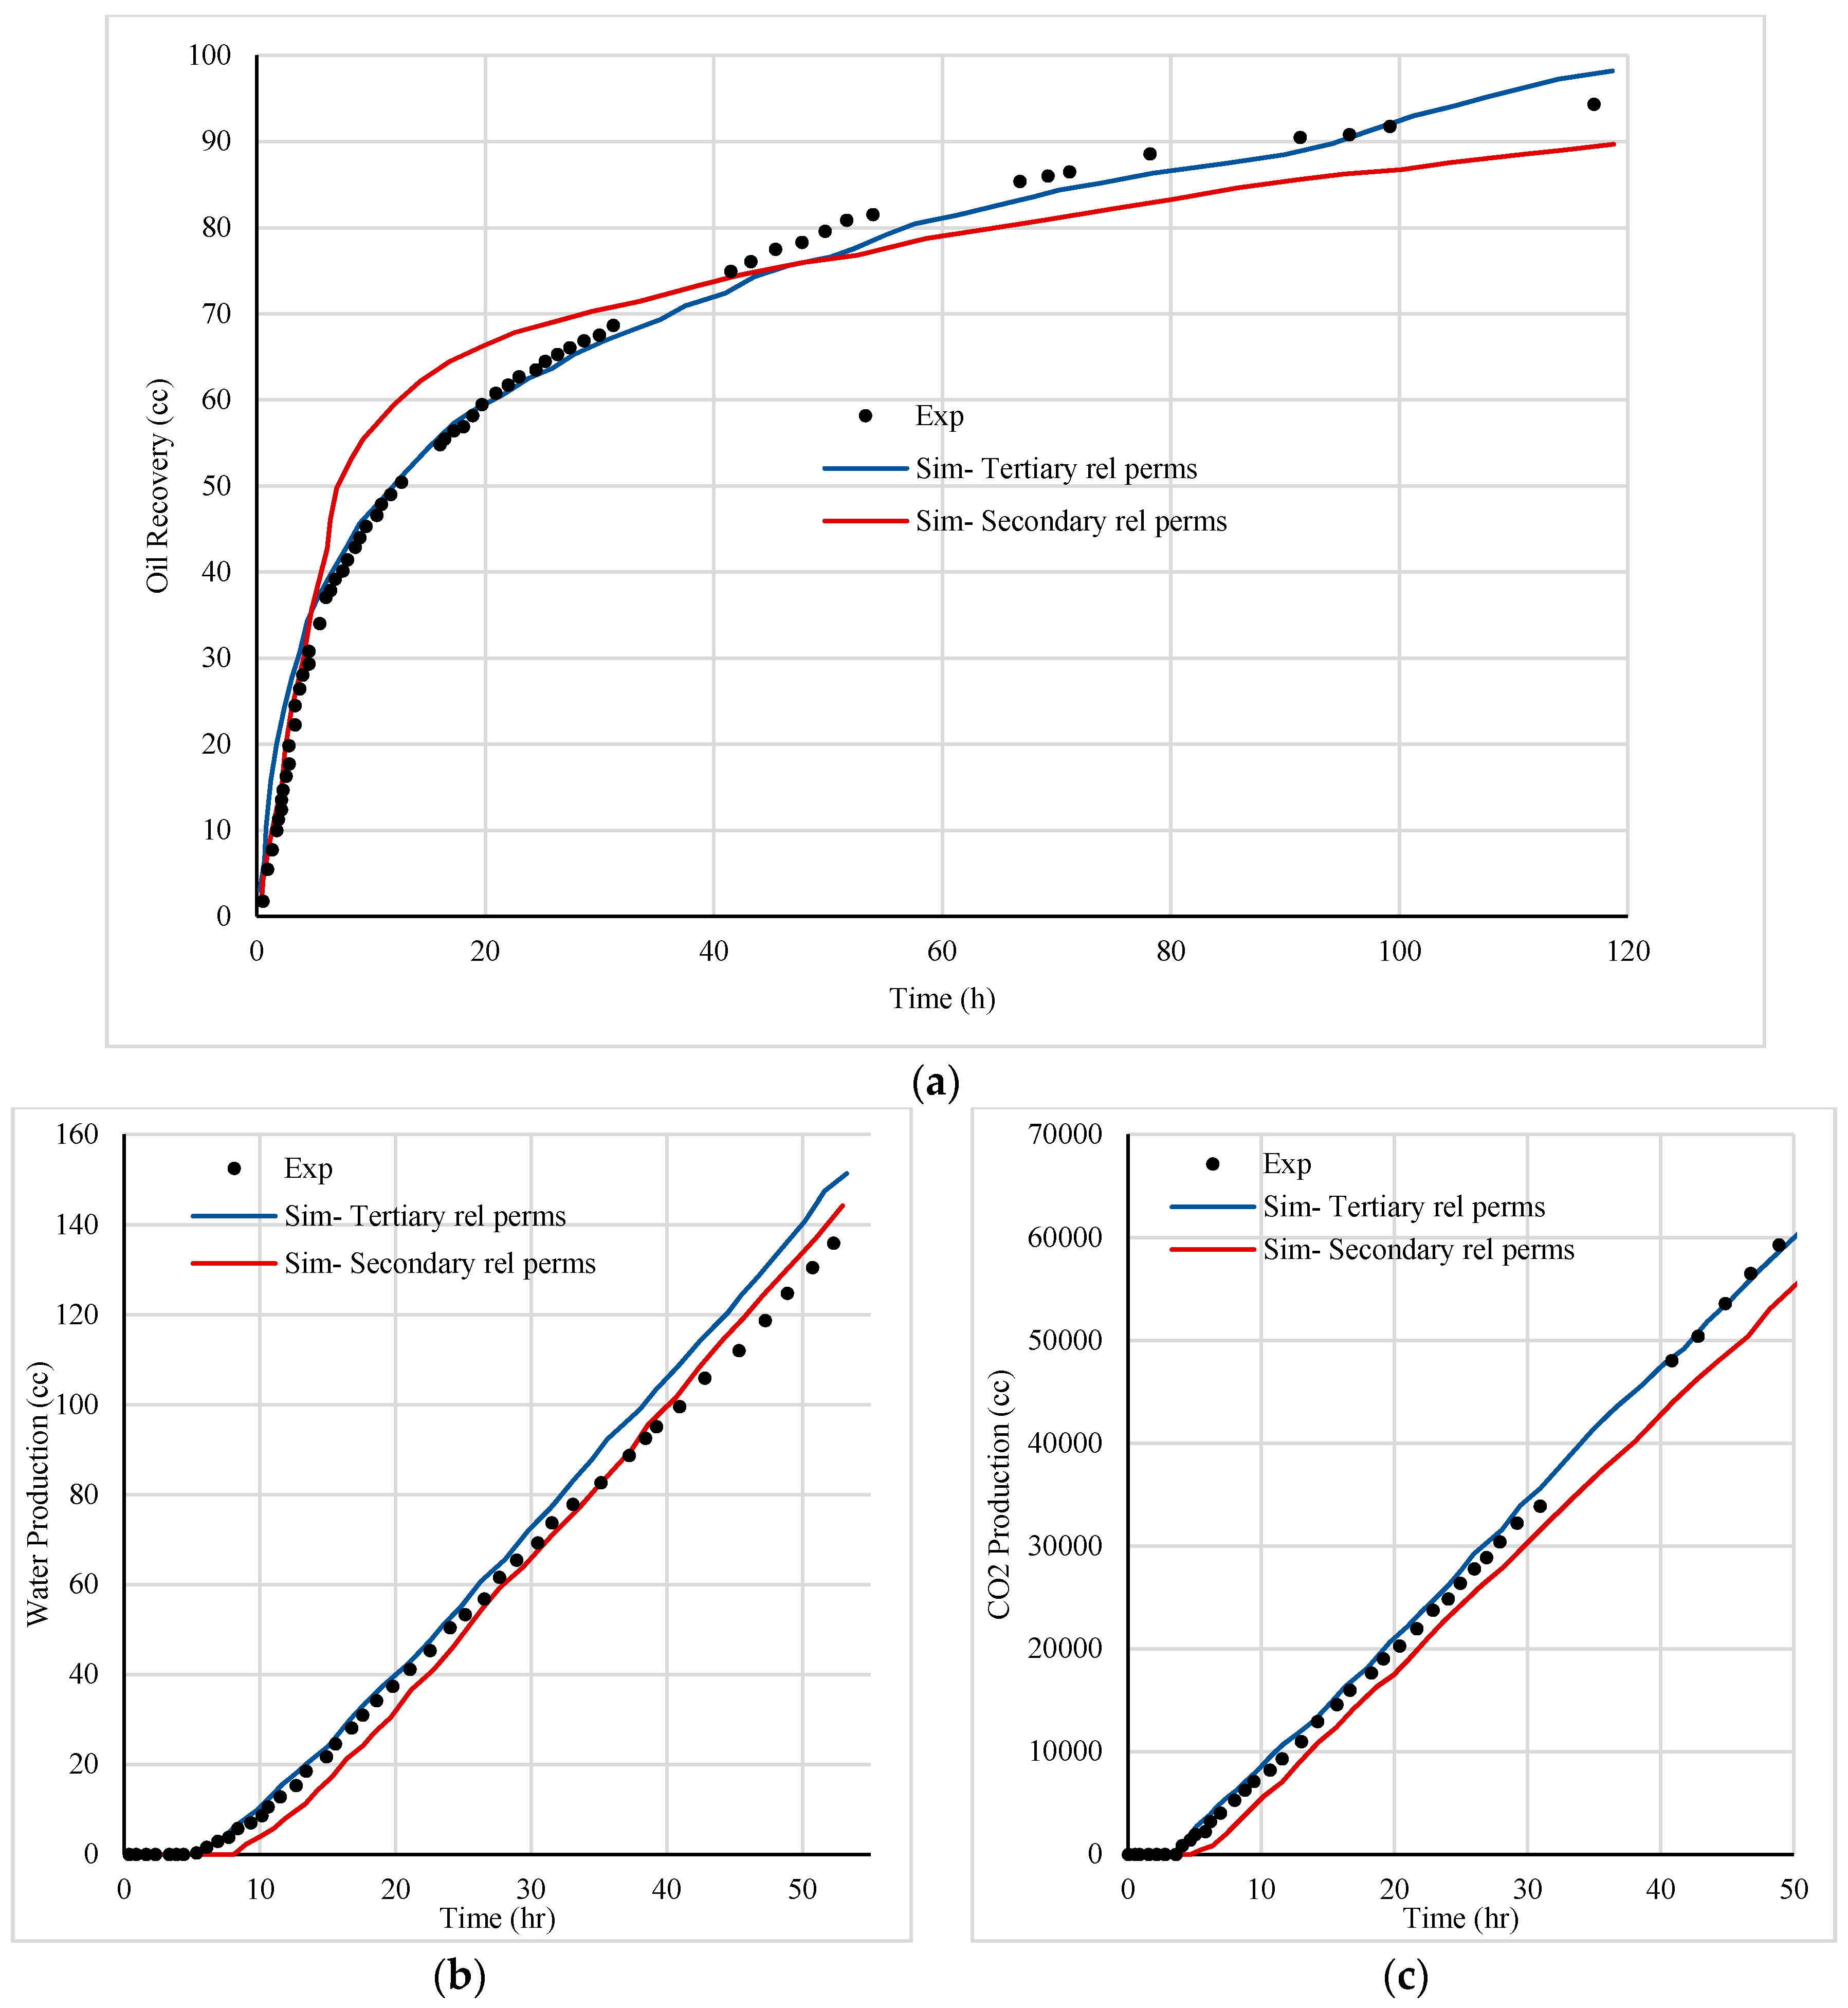
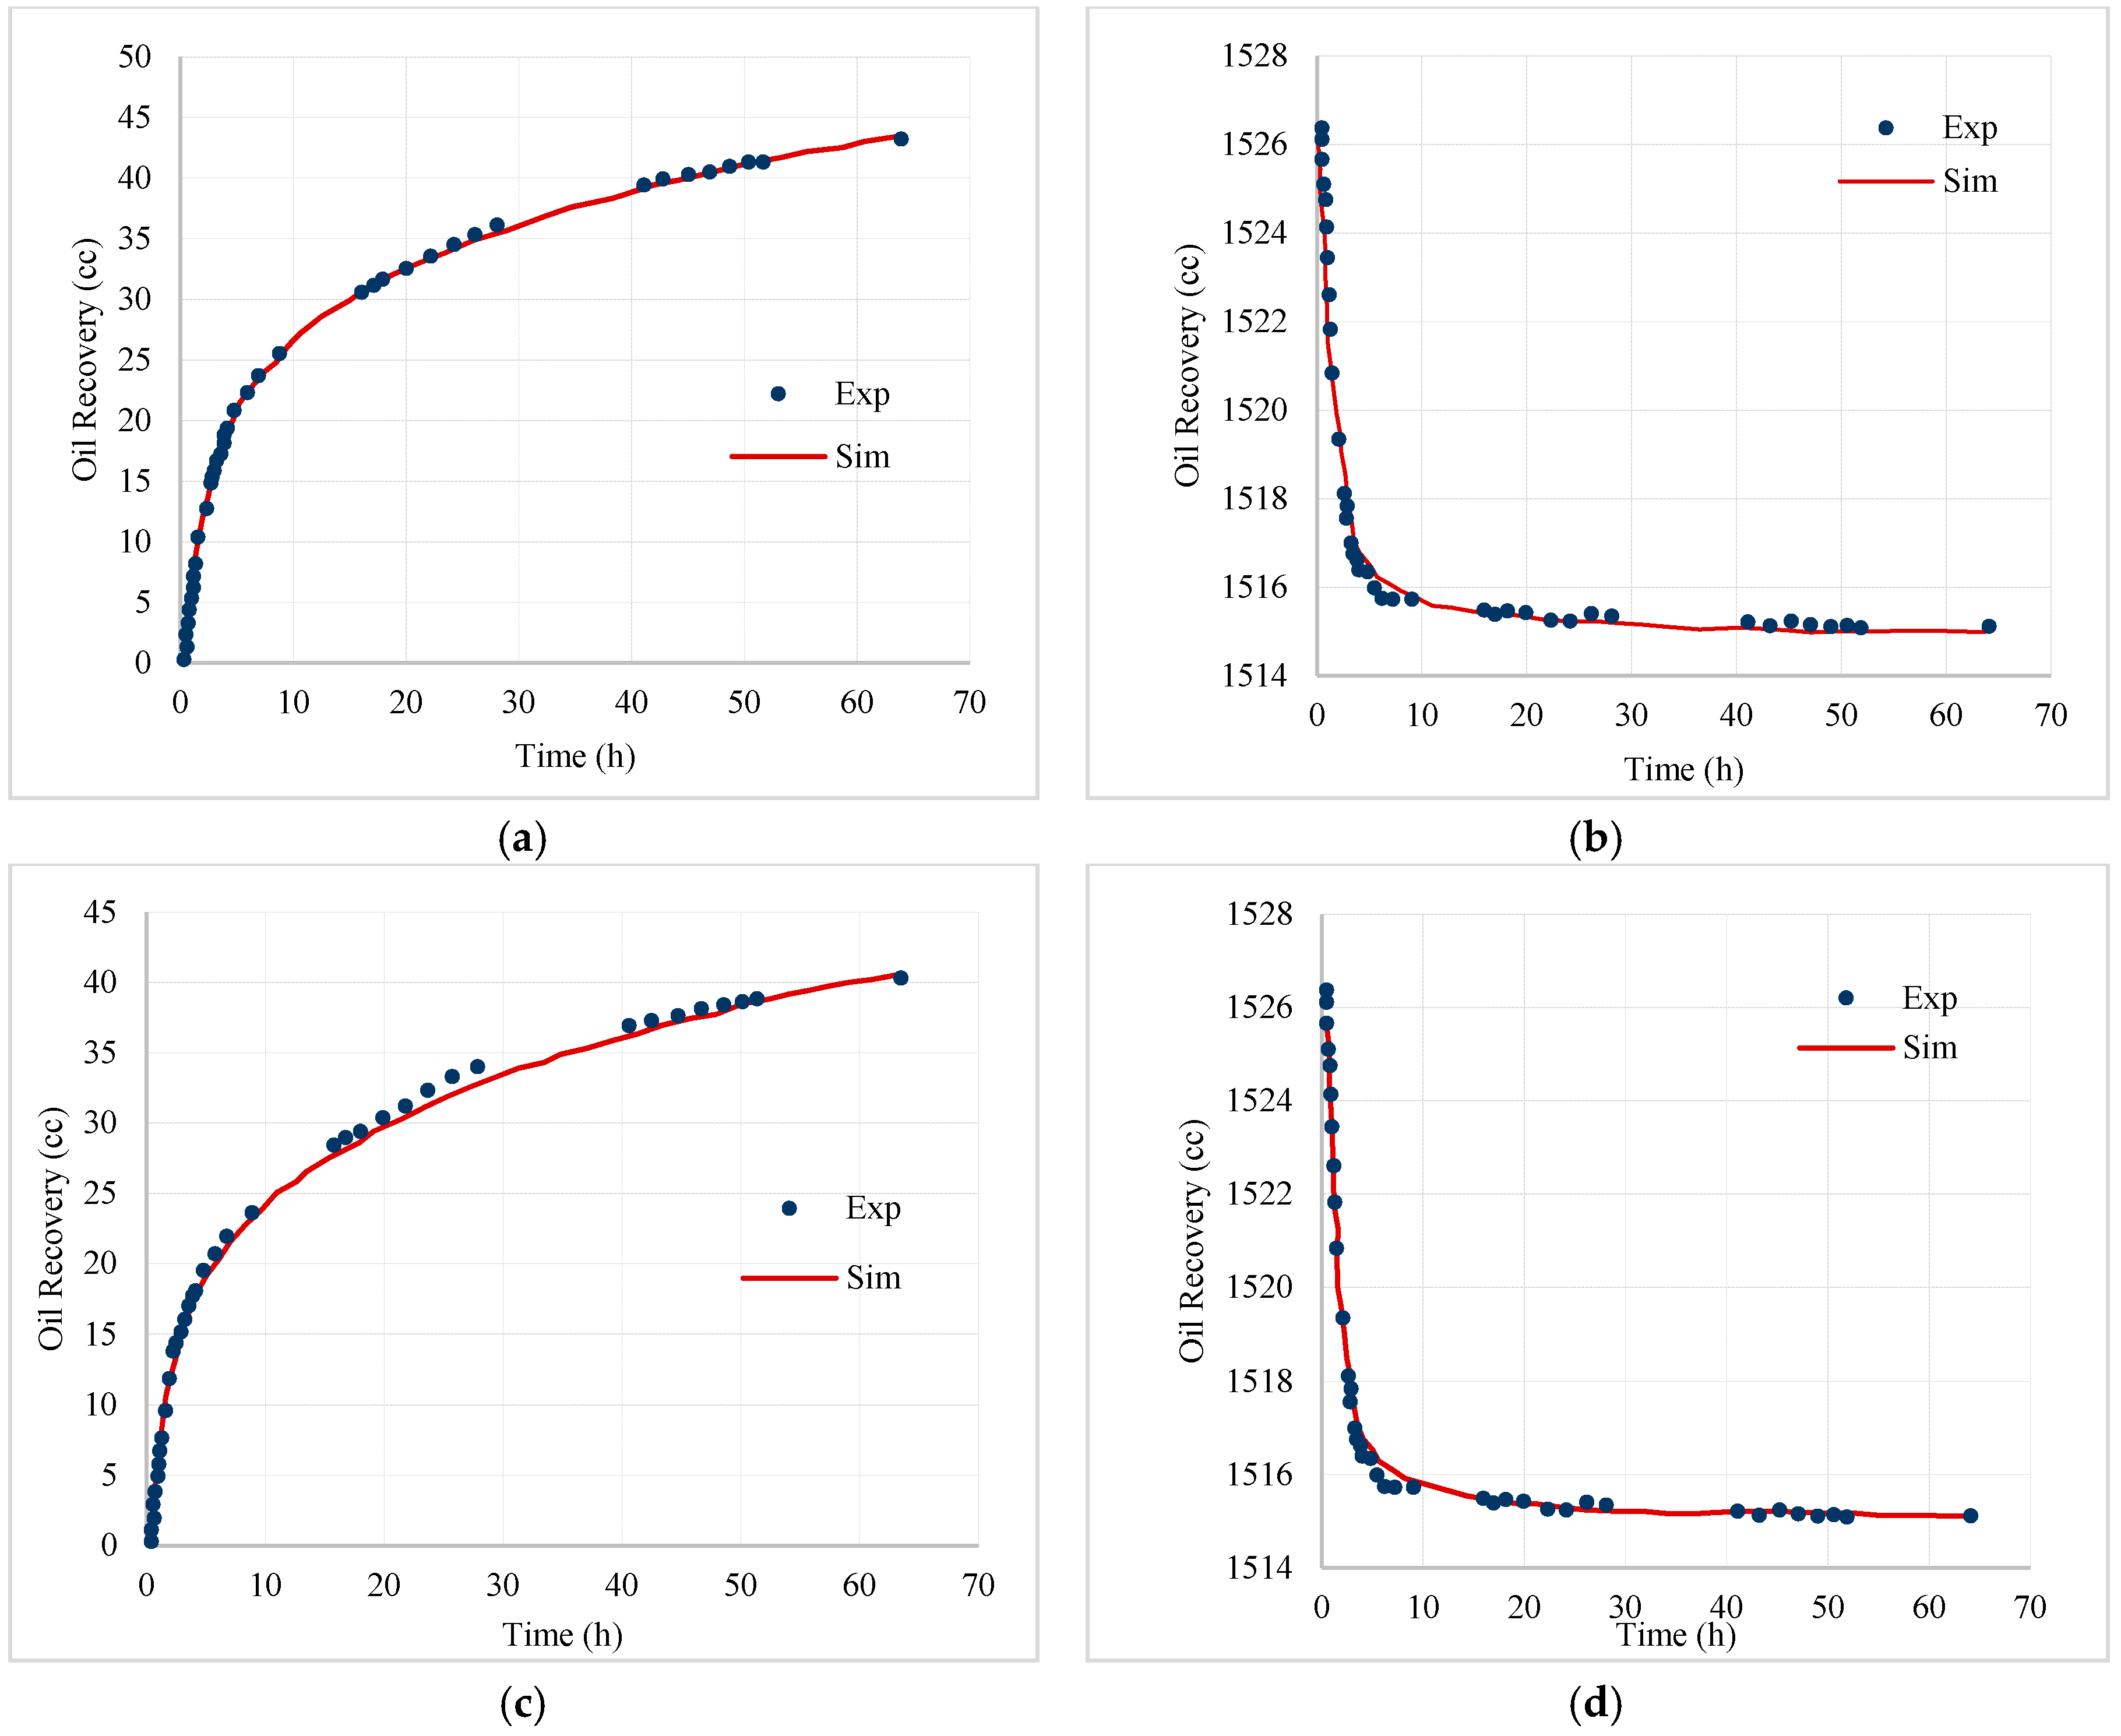
Figure 15 shows the results of the simulation runs compared against the experimental data. The fluid production profiles highlighted that a reasonably good match can be achieved when a tertiary water-oil and secondary oil–CO
2 relative permeabilities were employed. The mean squared errors (expressed in percentage) for blue and red curves in
Figure 15 are 5.15% and 19.88% respectively. However, it should be noted that the error of prediction by the blue curve is much lesser in first 40 h (1 PV injected) of the experiment, which is 1.56%.
Although the simulations have not matched the experimental data perfectly, the mismatch is reasonably low and is acceptable for this highly complex system. In particular, the blue curve in
Figure 15 (tertiary water–oil relative permeability case) has demonstrated an encouraging outcome in the early stages in which viscous forces were dominant.
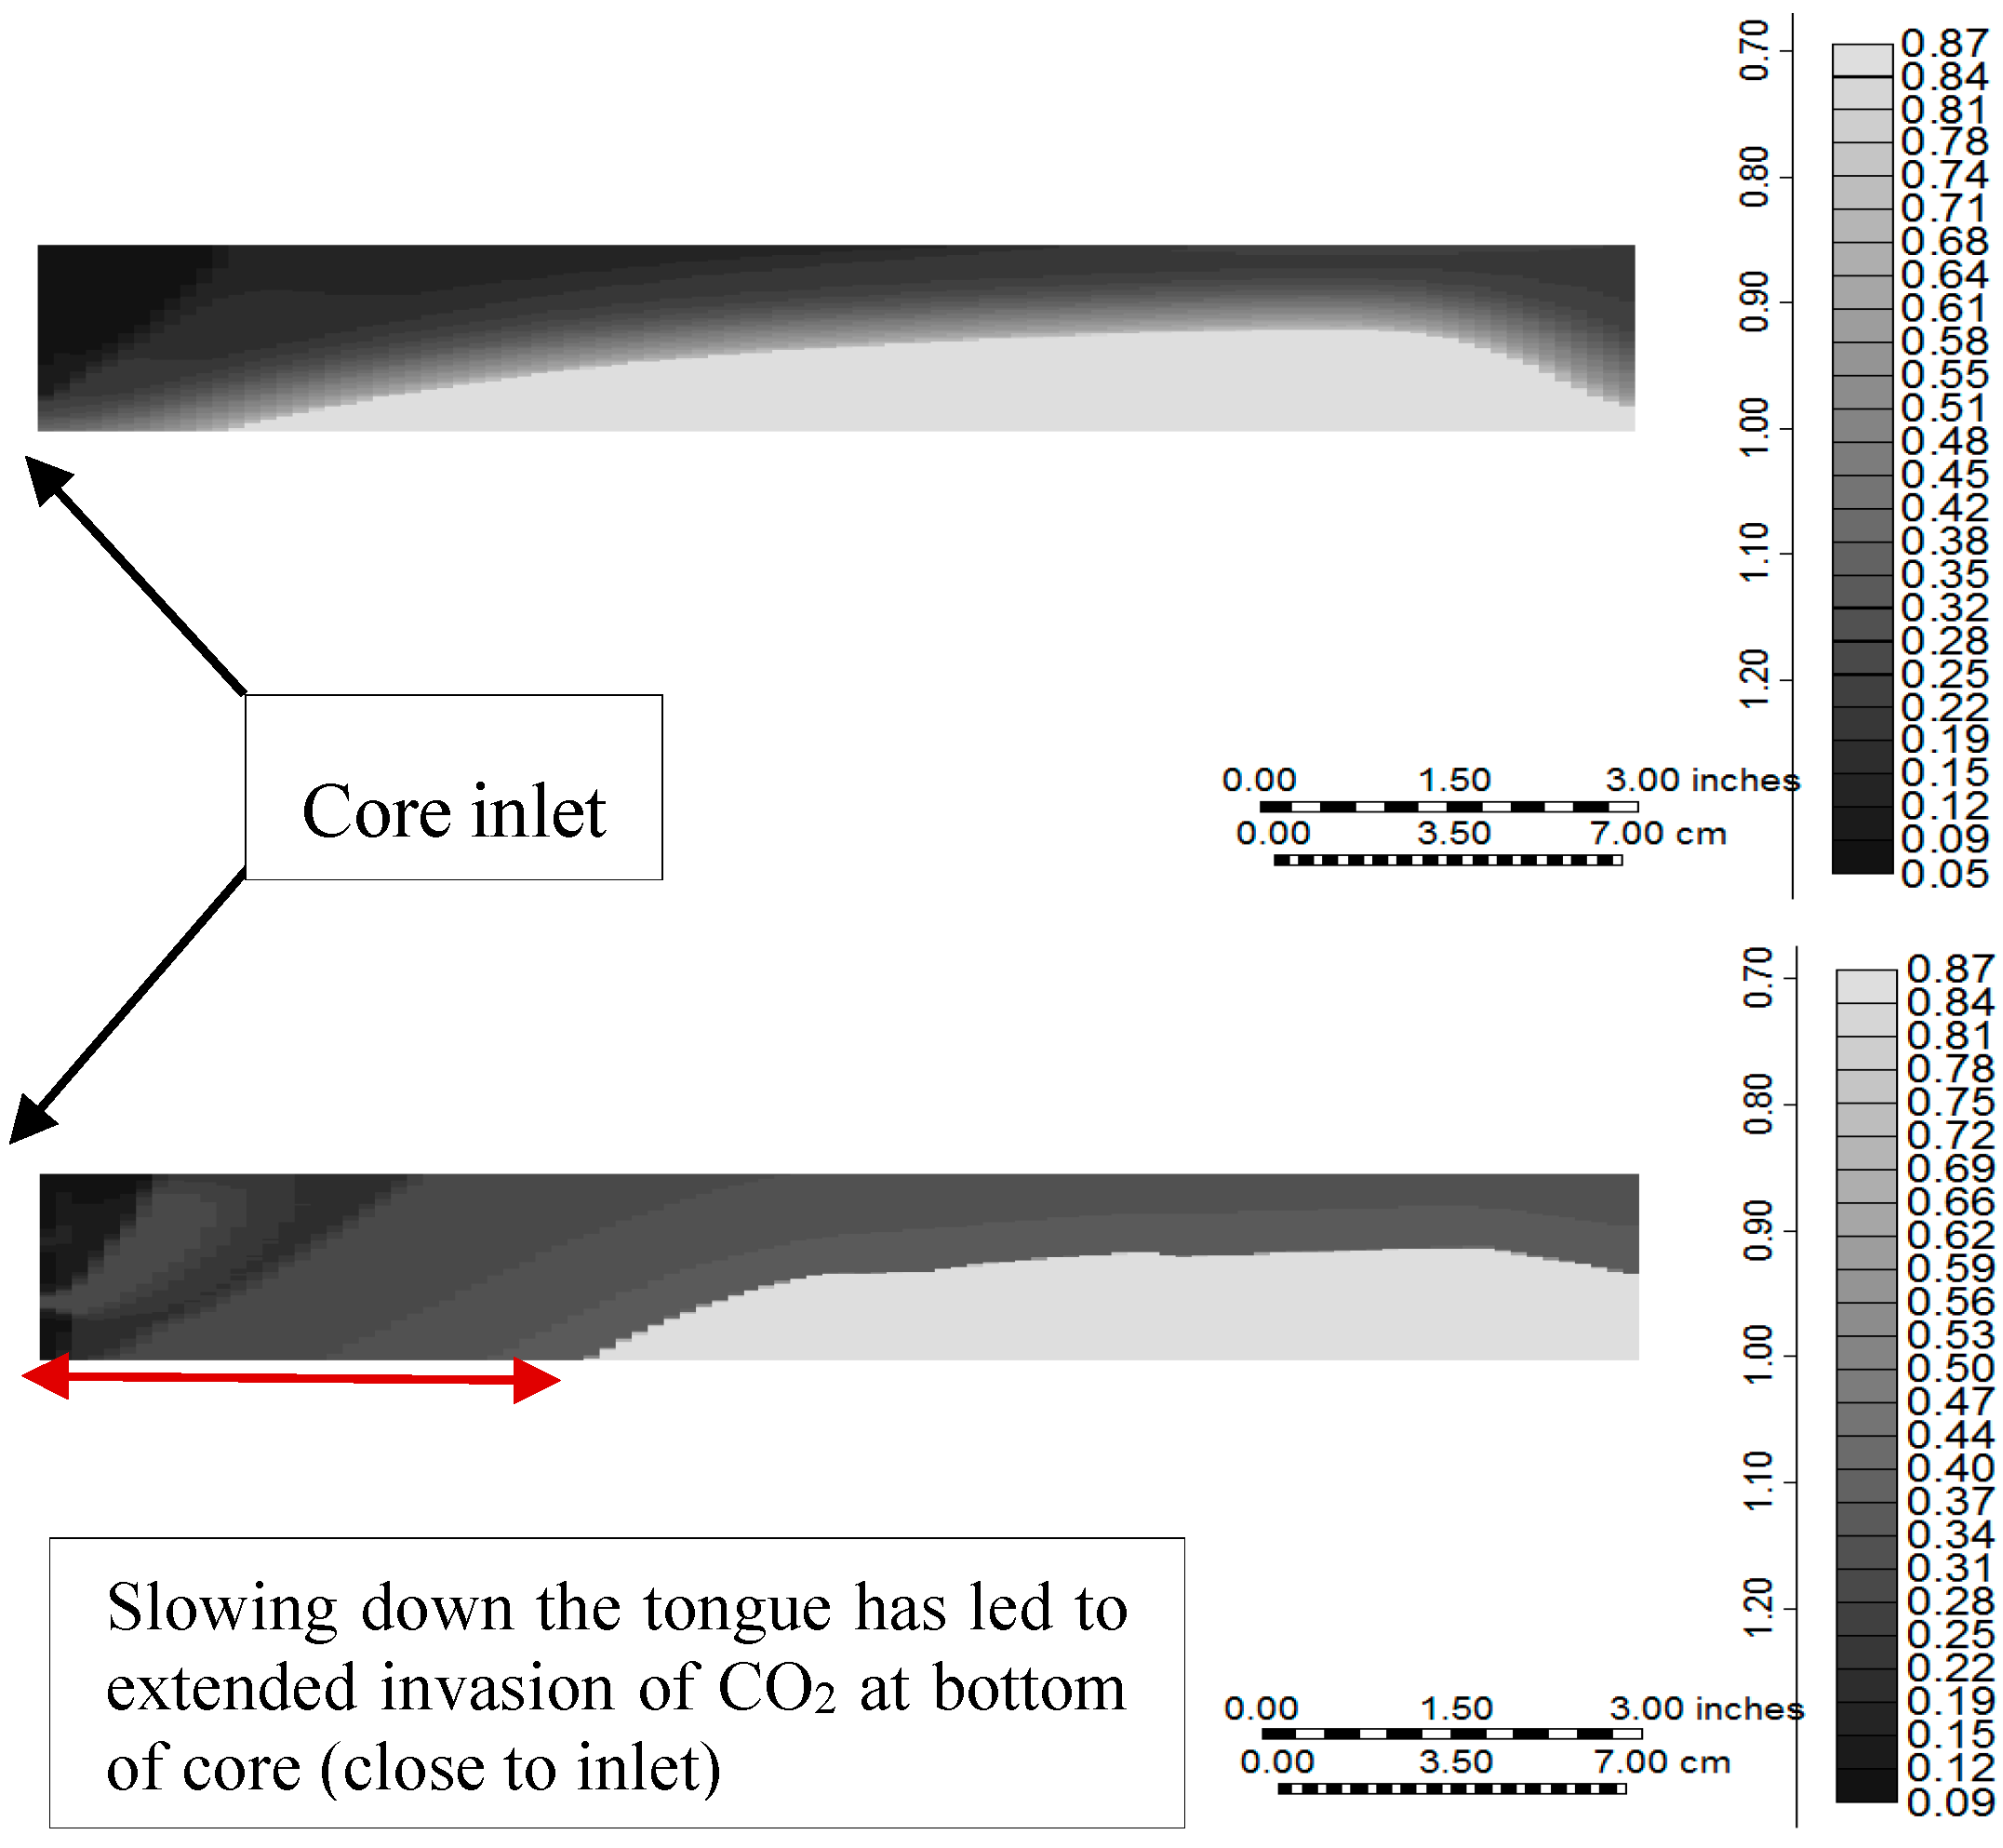
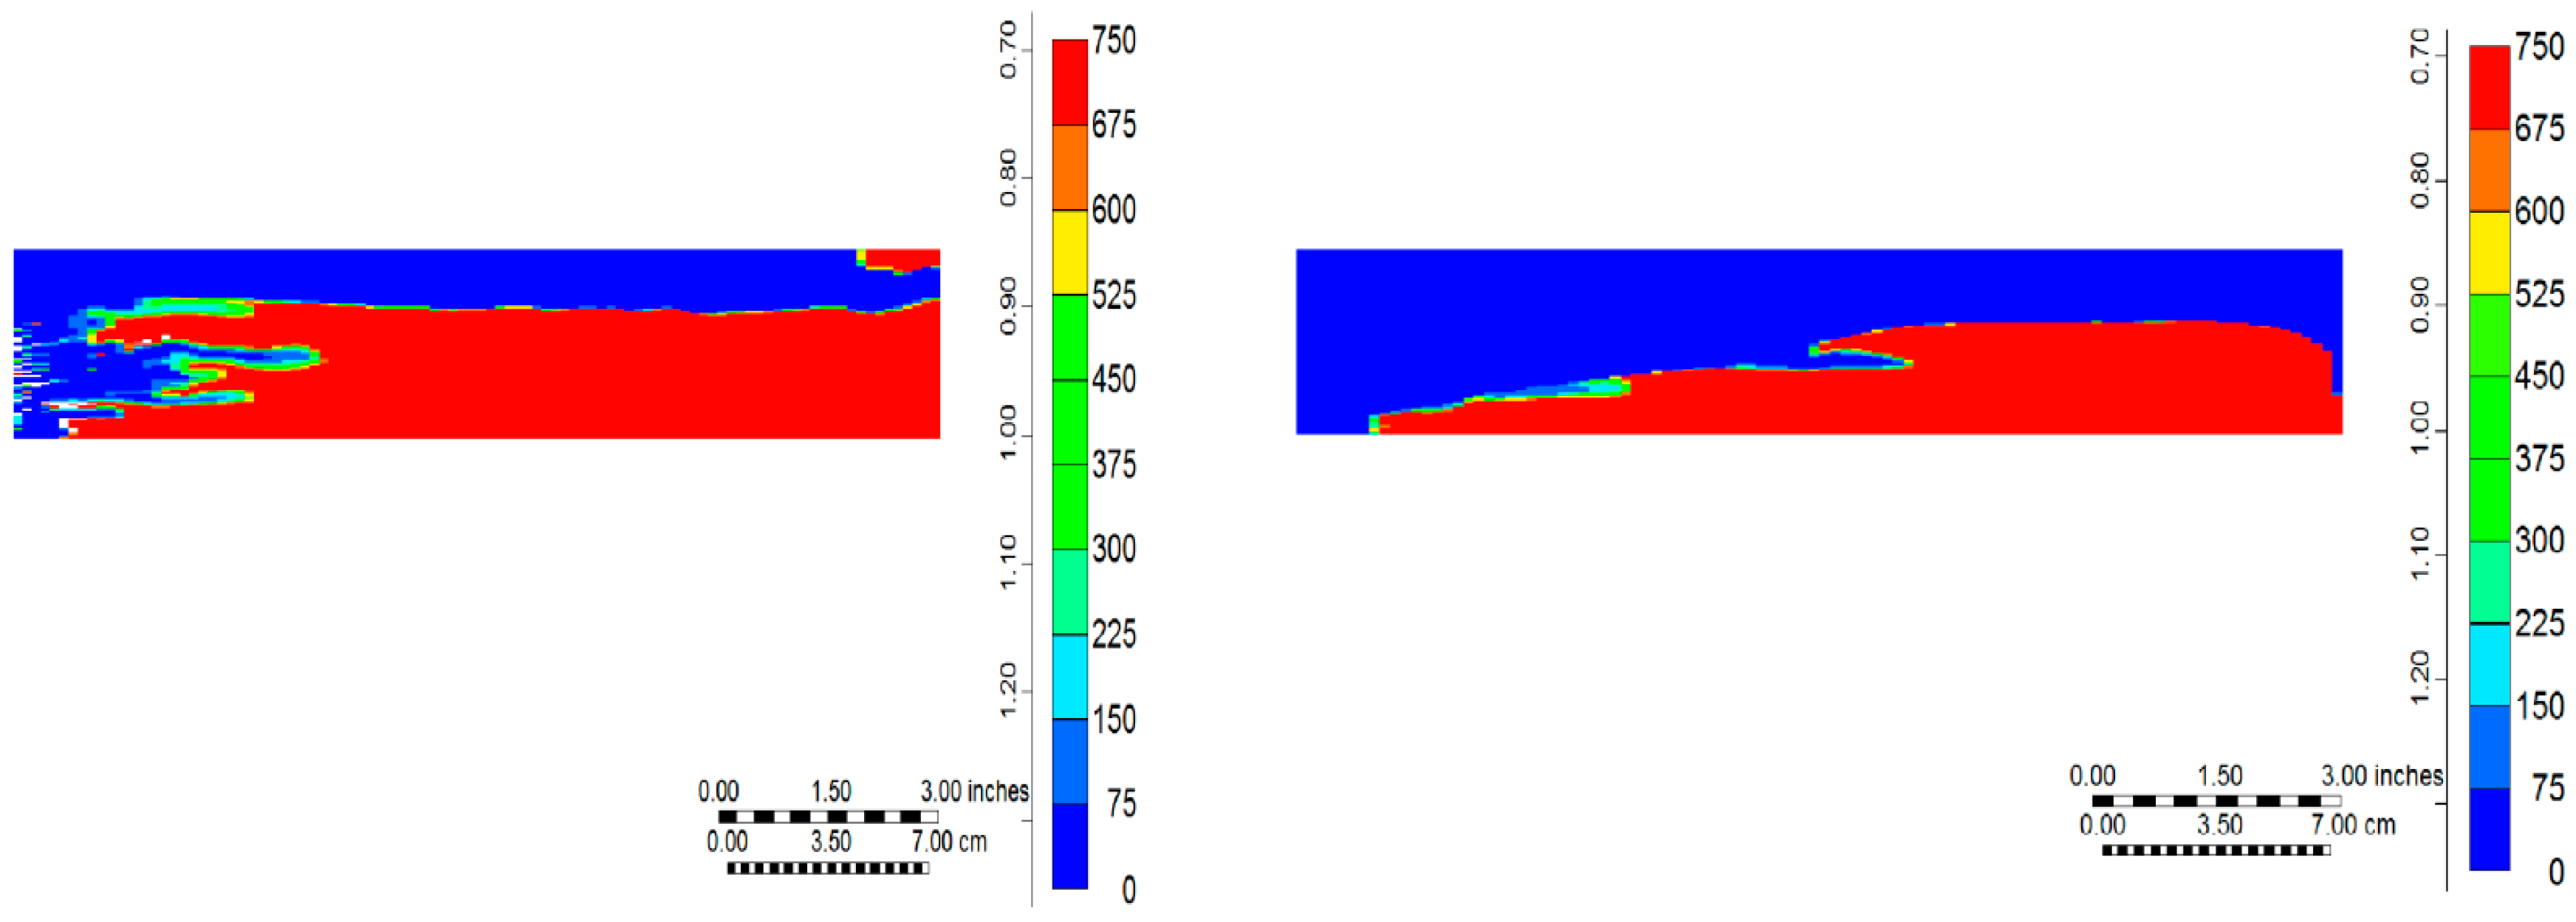
Figure 16 shows the result of simulation of the gas saturation distribution before the breakthrough, indicating the tendency of injected CO
2 to segregate gravitationally. This implies that CO
2 injection would be more efficient if injected in gravitationally stable scenarios. On the other hand,
Figure 17 illustrates the pattern of water frontal advancement indicating that water initially flowed downward near the inlet in the early stage of the injection but later, it advanced upward and followed the CO
2 path because it had significantly lower resistance due to its oil having lower viscosity. Therefore, the efficiency of the SWAG displacement is mainly controlled by the extent of CO
2 invasion, which reduces the oil viscosity.
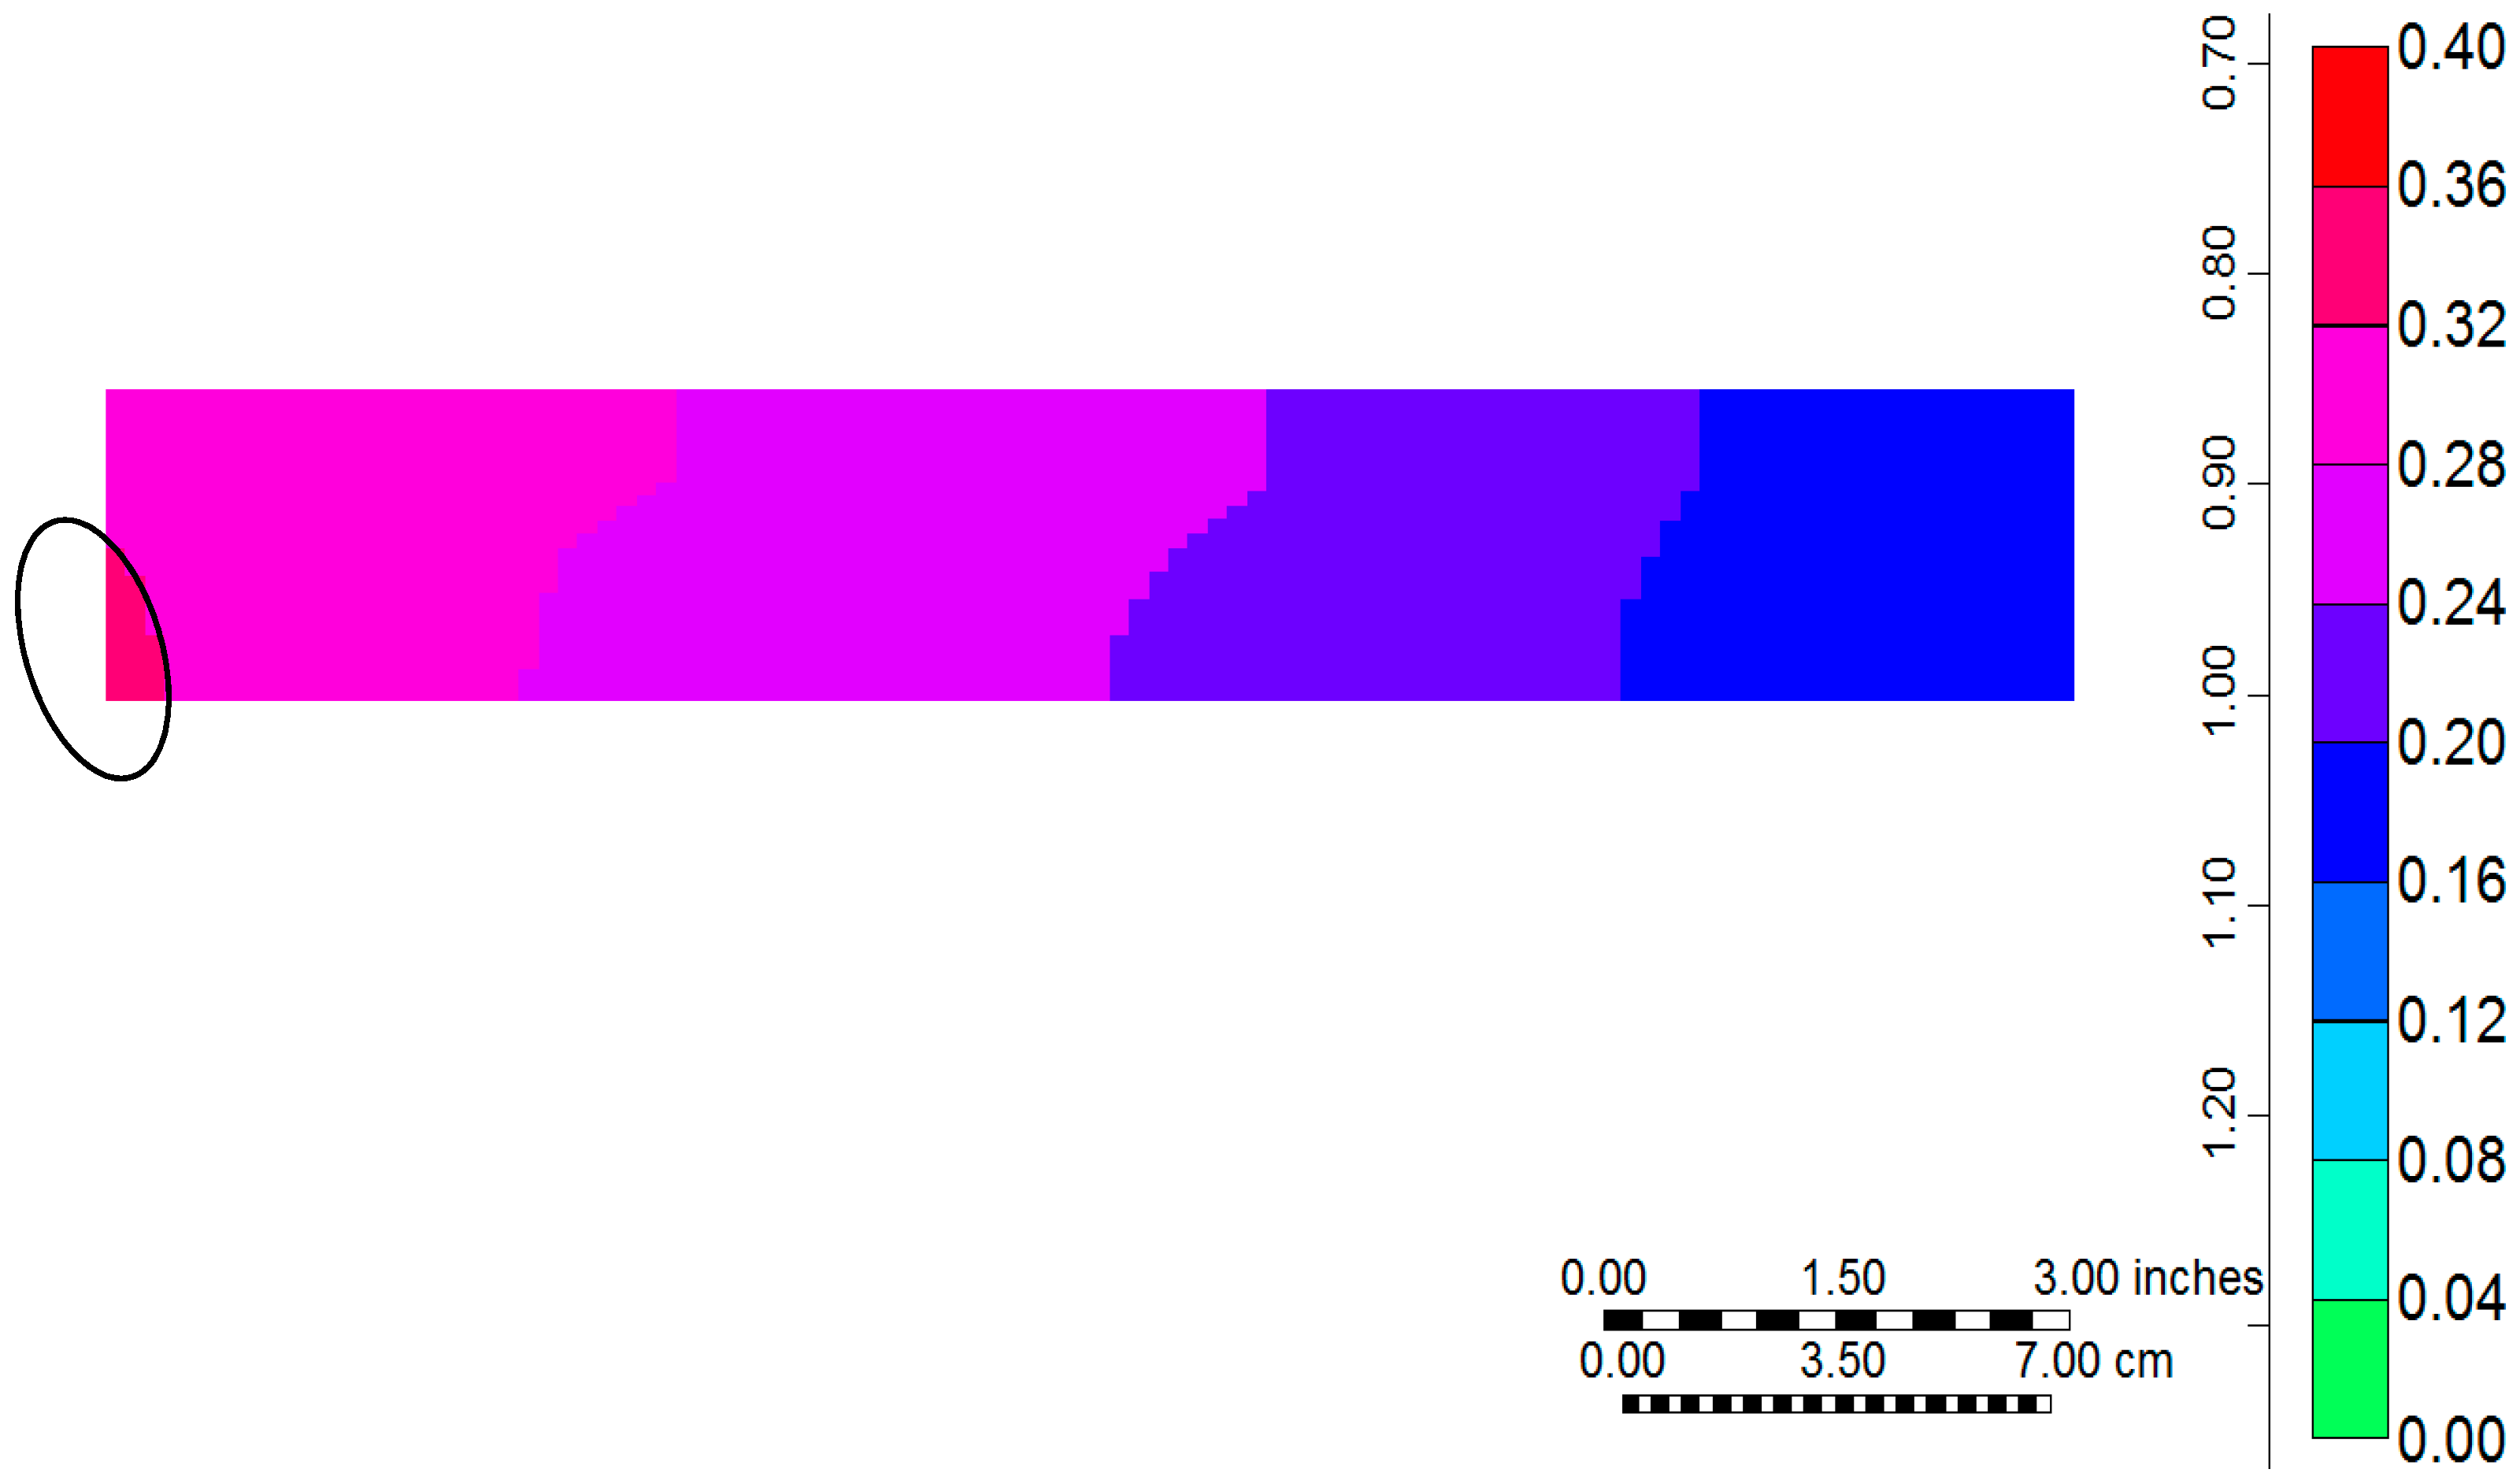
Figure 18 shows the viscosity of the resident oil at two stages, namely the CO
2 breakthrough and the end of SWAG injection. The poor CO
2 sweep efficiency has resulted in leaving a relatively large volume of oil untouched (red area).
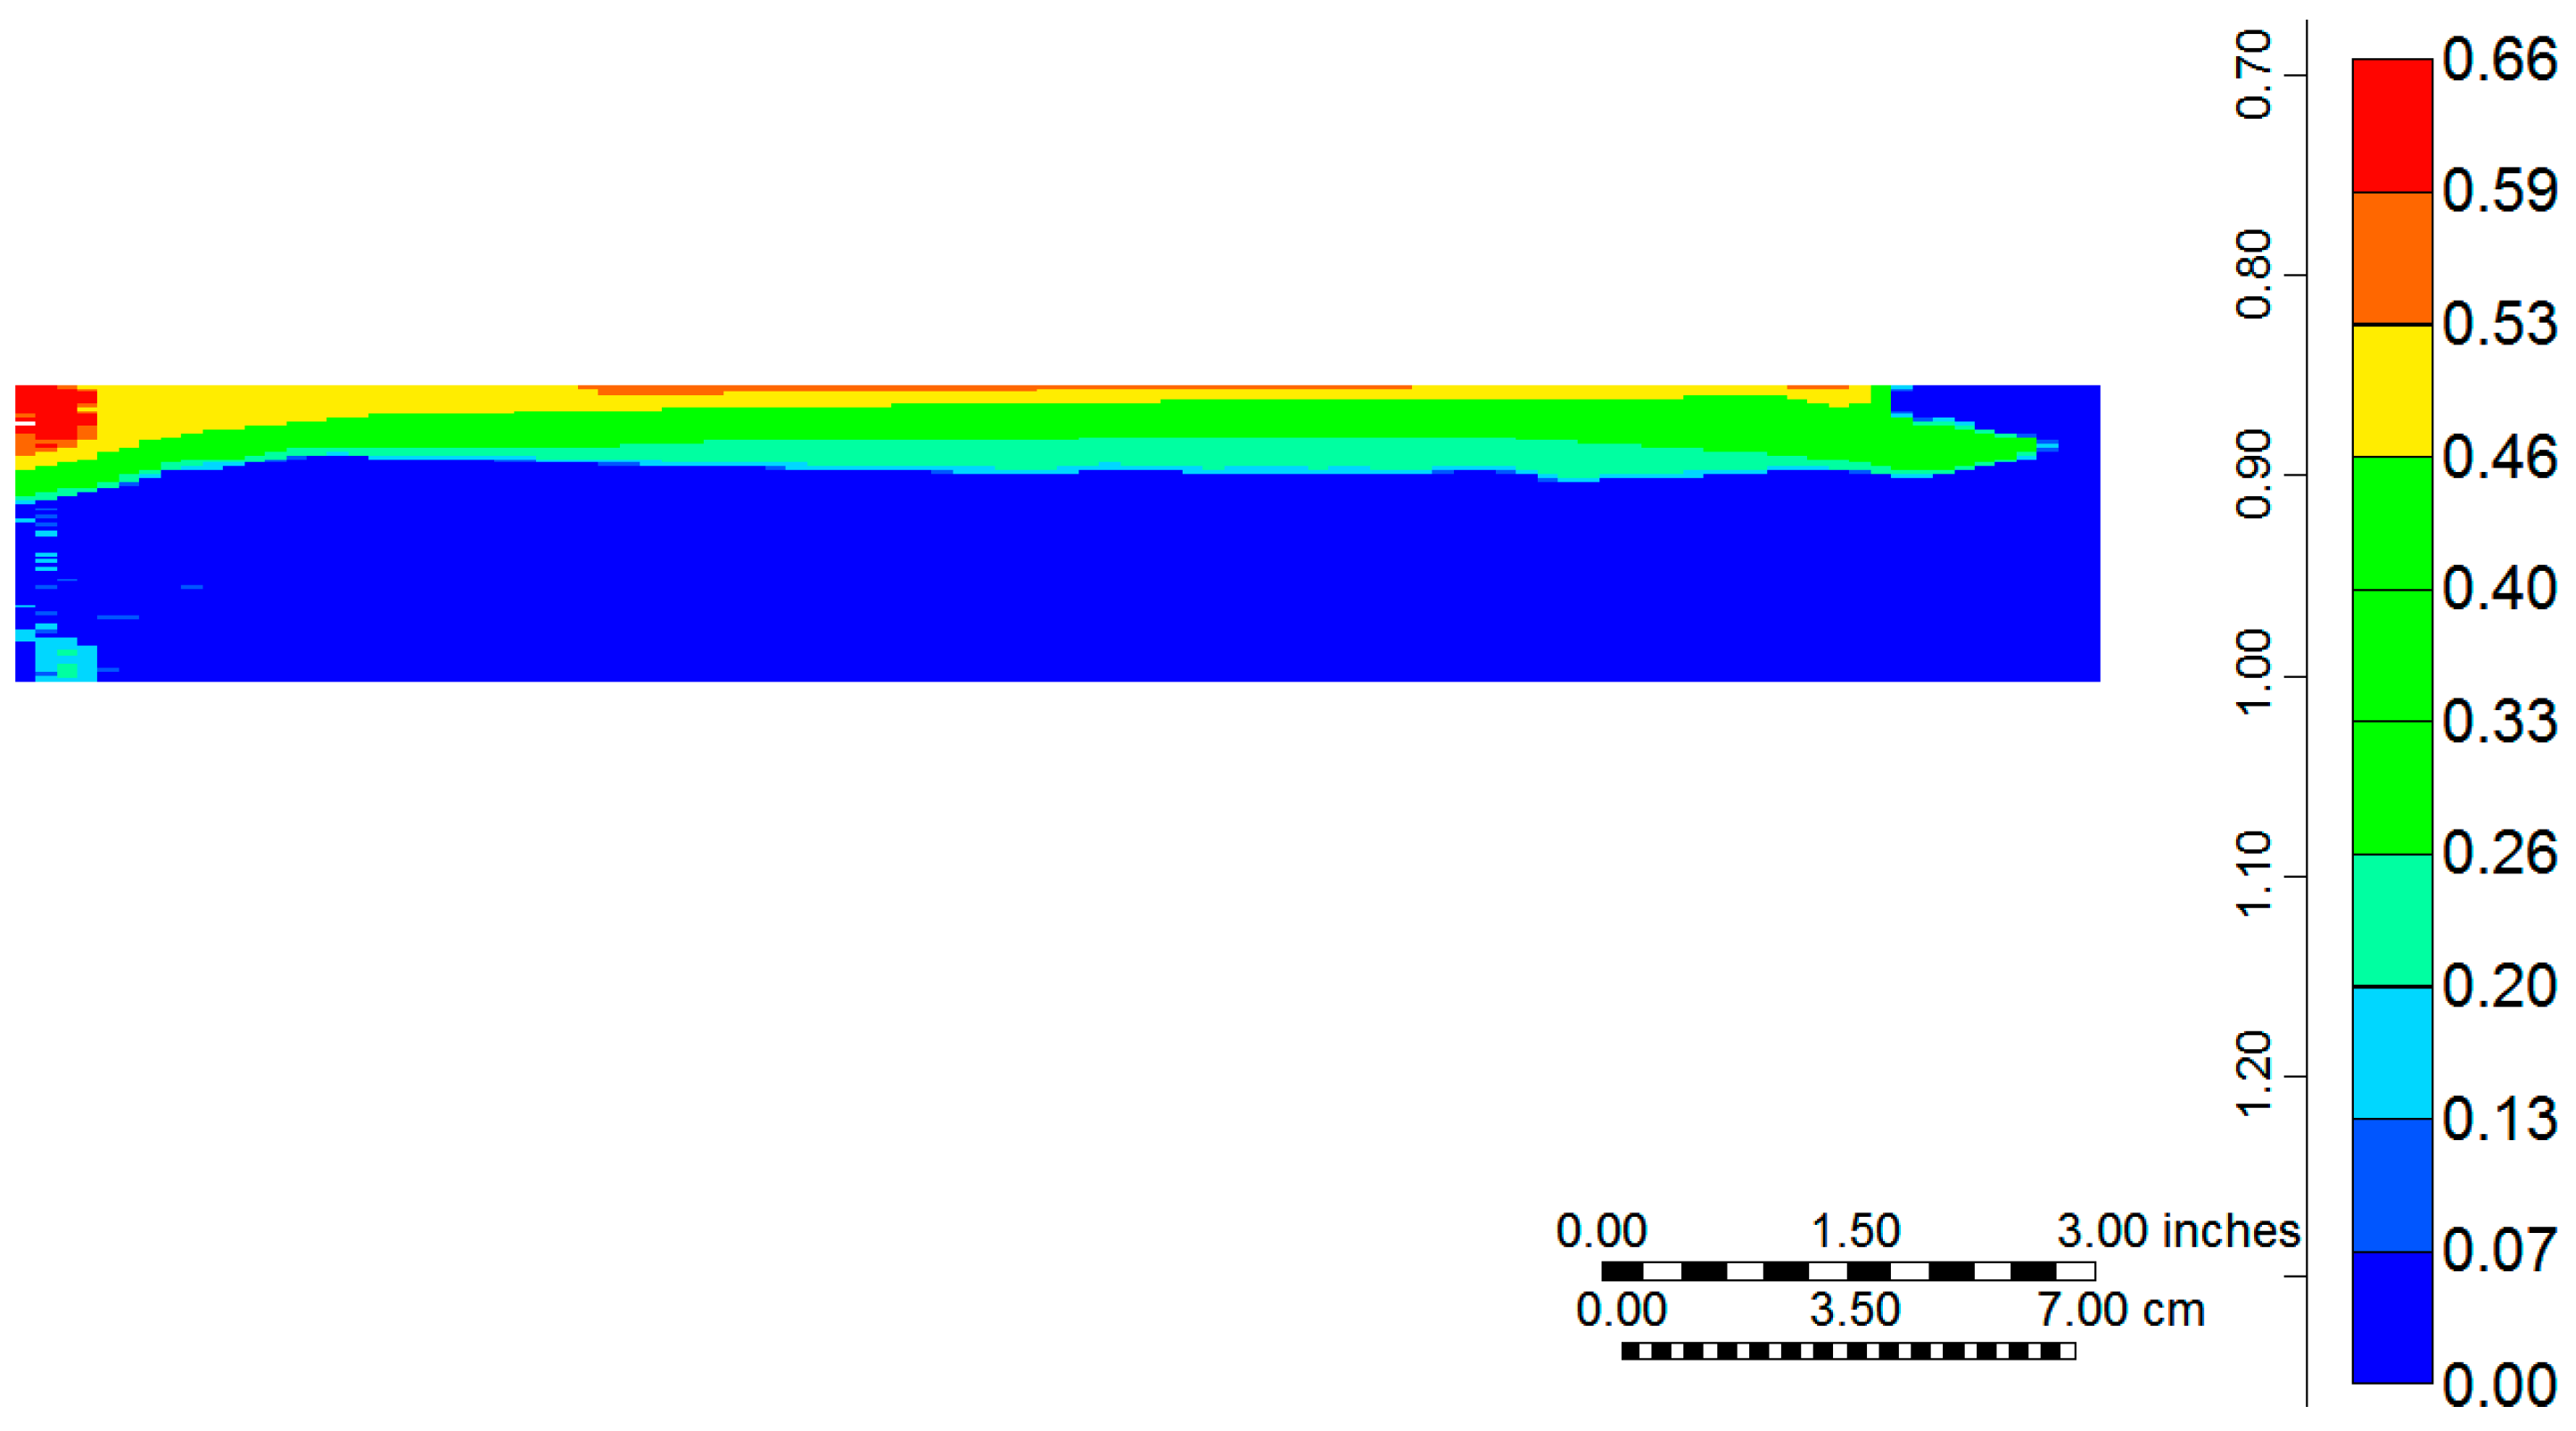
Figure 19 also illustrates the oil saturation distribution at the end of the simulation; it shows a distinct characteristic of the displacement, which is that the residual oil saturation approached up to less than 5% at the top of the core where CO
2 and water flowed together, while the bottom of the core, which had only been partly swept by water, had relatively high residual oil saturation that is up to about 60 percent. Therefore, the SWAG type of CO
2 injection would efficiently reduce the oil saturation if CO
2 is injected in a gravity stable strategy.
The improvements attained in the simulation of the SWAG experiment would indicate that the methodology proposed here for laboratory experiments (i.e., 2D high resolution models using a trained compositional simulator) would lead to obtain flow functions with predictive capabilities. As mentioned earlier in
Section 4.2, this set of experimental data was used in another investigation using 1D modelling [
45]. The outcome of that study demonstrated that, the relative permeability curves from 1D model would not be representative and cannot reproduce similar experiments. Also, it can be identified from that work that, for each particular experiment, history matching needs to be performed, and hence different sets of relative permeabilities would be obtained. If water-alternating-CO
2 injection is to be implemented at large scales (e.g., field scales), different regions of reservoir would under different CO
2, water, and SWAG invasion types. When using these relative permeabilities at larger scales, it would not be feasible to use different relative permeabilities for different regions of the reservoir under different CO
2 and water flow behavior. Therefore, the new approach proposed in this work to estimate flow functions for systems under very complex processes would lead to a set of relative permeabilities that would enable a capturing mechanism and reproduce similar experiments, which may make them suitable for large scale simulations.
7. Summary and Conclusions
An improved methodology was developed to simulate three-phase flow in core scales where significant mass transfer and frontal instability existed. Secondary and tertiary oil/water relative permeability was estimated by history matching the experiment in which water was used to chase a CO2 flood. The following conclusions were drawn from the simulations performed on the coreflood experiments:
The simulation of the tertiary water injection shows that water preferred to follow the path already opened by the previously-injected CO2. However, this mechanism is different from the conventional water alternating gas Injection (WAG), where water is expected to open up a new path different from that of the gas. Here, the water prefers to follow the path of the CO2 because the dissolution of the gas in the oil has significantly reduced the viscosity of the trapped oil in the path of the CO2. Hence, the lower resistance in the CO2 path compared to that in the bypassed oil makes it more preferable for the tertiary water to follow.
Two simulation runs were performed to reproduce a three-phase flow experiment in which CO2 and water were injected simultaneously (SWAG). The results showed that the experimental fluid production data could be adequately matched using the secondary gas–oil and tertiary water–oil relative permeability curves. This can be explained by the notably higher tendency of CO2 to flow ahead of water, creating a situation where the secondary CO2 injection was replicated with the injected water chasing the CO2. It could be concluded the conventional hysteresis analyses applicable to light oils cannot be utilized for viscous oils, since the flow characteristics are mainly controlled by viscosity variations. Therefore, a simulation model well-defined on an unstable system (high-resolution 2D model with tuned EOS) would be able to predict different scenarios of CO2 and water injection where significant mass transfer can bring about effective viscosity reductions. It should be pointed out that this work did not focus on the performance of three-phase relative permeability function (such as Stone I, Stone II, Baker, and etc.), which may affect the results. Herein, the improved methodology has been proposed to model WAG scenarios in heavy oil displacements based on the physics of CO2 and water preferential paths.


