Article

Predictions of Surface Solar Radiation on Tilted Solar Panels using Machine Learning Models: A Case Study of Tainan City, Taiwan

Department of Marine Environmental Informatics, National Taiwan Ocean University, No. 2, Beining Rd., Jhongjheng District, Keelung City 20224, Taiwan
Energies 2017, 10(10), 1660; https://doi.org/10.3390/en10101660
Submission received: 27 September 2017 / Revised: 17 October 2017 / Accepted: 18 October 2017 / Published: 20 October 2017
(This article belongs to the Special Issue Data Science and Big Data in Energy Forecasting)

Abstract

:
In this paper, forecasting models were constructed to estimate surface solar radiation on an hourly basis and the solar irradiance received by solar panels at different tilt angles, to enhance the capability of photovoltaic systems by estimating the amount of electricity they generate, thereby improving the reliability of the power they supply. The study site was Tainan in southern Taiwan, which receives abundant sunlight because of its location at a latitude of approximately 23°. Four forecasting models of surface solar irradiance were constructed, using the multilayer perceptron (MLP), random forests (RF), k-nearest neighbors (kNN), and linear regression (LR), algorithms, respectively. The forecast horizon ranged from 1 to 12 h. The findings are as follows: first, solar irradiance was effectively estimated when a combination of ground weather data and solar position data was applied. Second, the mean absolute error was higher in MLP than in RF and kNN, and LR had the worst predictive performance. Third, the observed total solar irradiance was 1.562 million w/m2 per year when the solar-panel tilt angle was 0° (i.e., the non-tilted position) and peaked at 1.655 million w/m2 per year when the angle was 20–22°. The level of the irradiance was almost the same when the solar-panel tilt angle was 0° as when the angle was 41°. In summary, the optimal solar-panel tilt angle in Tainan was 20–22°.

1. Introduction

The sun is one of the main sources of energy on Earth. As nonrenewable energy resources on the planet are being depleted and renewable ones are increasingly in demand, the development potential of solar energy warrants attention. Solar energy provides an environmentally friendly solution to generating electricity. Located at the latitude 22–25° N, Taiwan receives a long duration of sunshine and stands at a small sunlight deflection angle. Currently the world’s second largest producer of silicon-wafer solar cells, it is well-positioned to develop solar-energy technologies. Taiwanese’s Bureau of Energy has launched a nationwide initiative—Million Rooftop PVs—to promote the installation of solar photovoltaic (PV) on the rooftops of residential buildings. Public demand for PV systems remains robust; the total installed capacity of solar PV power generation units was 847 MW, and projected to be 2120 MW by 2020 and 3100 MW by 2030.
Solar power generation is safe, sustainable, environmentally friendly, and helps to reduce air pollution. However, it has several limitations, including high production costs, a low capacity of electricity production, uncertain and sporadic electricity supply, susceptibility to region-specific characteristics, the requirement for a large installation area, and high initial investment costs. Therefore, while making considerable efforts to advance solar PV technology, Taiwan should investigate methods to accurately forecast the amount of solar irradiation, so that the power production of solar PV systems can be maximized. In this paper, surface solar irradiation forecasting models (SSIFMs) were constructed to generate data on hourly surface solar irradiance and estimate the solar irradiance received by solar panels installed at different tilt angles. The findings are expected to optimize the use of solar in a grid system by forecasting the amount of power they generate in subsequent hours, thereby stabilizing their ability to supply electricity.
Concerning the literature on surface solar irradiation estimations, López et al. [1] developed artificial neural networks (ANN) to predict solar irradiation, and found ANNs require significant computational time, processing power and memory. Gomez and Casanovas [2] formulated a fuzzy model of solar irradiance on inclined surfaces. Reda and Andreas [3] presented solar position algorithms for solar radiation applications. Shen et al. [4] employed the Simulink programming language to estimate the horizontal and tilted solar radiation data for any time interval. Yeom and Han [5] calculated solar surface irradiance from the Multifunction Transport Satellite-1R (MTSAT-1R) satellite data using a neural network model to obtain more accurate results than empirical and physical methods. Chen et al. [6] developed a solar radiation forecast technique based on fuzzy and neural networks that remains accurate under different weather conditions. Inman et al. [7] reviewed the theory behind solar forecasting methodologies, and a number of successful applications of solar forecasting methods for both the solar resource and the power output of solar plants. Bode et al. [8] estimated the ground solar radiation model and stream surface level solar radiation using Geographic Information System models. Li et al. [9] evaluated ANN and support vector regression, for forecasting energy productions from a solar PV system. Persson et al. [10] presented a nonparametric machine learning approach used for the multisite prediction of solar power generation on a forecast horizon of 1–6 h. Yousif et al. [11] proposed a mathematical model for forecasting energy production in PV panels based on a self-organizing feature map model and compared it with multi-layer perceptron (MLP) and support vector machine. Moreover, clouds play a substantial role in the Earth's climate system [12,13,14]); the amount of liquid water droplets, their particle size, and the vertical cloud extent characterize the scattering and absorption features of a cloud, which in turn affect the shortwave radiation budget [15]. The possibility of obtaining information about cloud properties and their spatial distribution on a global scale can be achieved by satellite remote sensing. Over the past decades, various algorithms have been developed [16,17,18] to retrieve optical and microphysical cloud properties. Moreover, Shafiullah [19] proposed a hybrid renewable energy integration system comprises a prediction model that forecasts solar and wind generation and a techno-economic model that analyses the techno-economic and environmental prospects of renewable energy. The aforementioned studies have successfully applied in either forecasting future solar resource or estimating solar resource on titled surfaces. However, both two topics: (1) forecasting future solar resource, and (2) estimating solar resource on titled surfaces have seldom been investigated simultaneously.
The purpose of this paper is to forecast surface solar radiation using machine learning models on an hourly basis and the solar irradiance received by solar panels at different tilt angles, to enhance the capability of photovoltaic systems by estimating the amount of electricity they generate, thereby improving the reliability of the power they supply. That is to say, this paper has two major objectives: (1) forecasting future solar radiation levels using machine learning techniques, and (2) estimating the solar resource reaching a tilted surface and then demonstrating these tilted surface estimates can be used to forecast in the future. Because machine learning algorithms enable computers to automatically generate predictions on unknown data by having the computers analyze and learn from existing data, this study employed the most widely used machine learning models: MLP, random forests (RF), k-nearest neighbors (kNN), and linear regression (LR). ANNs are created to simulate the nervous system and brain activity. An ANN-based MLP network is extensively used to model an unknown system with observable inputs and outputs, and widely employed because of its simplicity, flexibility, and ease of use [20]. In recent years, RF [21] has received increasing interest. This ensemble classification and regression technique is based on the assumption that a whole set of trees produce a more accurate prediction than does a single tree [22]. The nearest neighbor search (NNS) classifier is a non-parametric classifier, and widely used because of its simplicity and good performance [23]. Regarding NNS, the typical kNN method involves using neighbor search algorithms to achieve computational tractability [24,25]. In addition, LR was selected to compare with the aforementioned models because LR is a traditional regression analysis modeling technique. Moreover, studies (e.g., [5,16]) have also indicated that satellite remote-sensing data can be used to analyze the atmosphere and calculate solar irradiance accordingly. Thus, in this study, satellite remote-sensing data and ground weather data were collected to establish SSIFMs. The study site was in Tainan, a city in southern Taiwan whose low latitude grants it more sunlight than any other regions in the nation, with an annual sunshine duration of 2598 h and a solar power generation capacity of 1343 kWh. This highlights the drive to harness the sheer amount of sunlight with which the city is endowed.
The remainder of this paper is organized as follows: Section 2 describes the data patterns obtained from study site. Section 3 describes the procedures of the proposed methodology, and introduces the solar radiation forecasting techniques based on the machine learning algorithms. Section 4 presents the forecast modeling process, including parameter calibration and the performance levels of the studied case. Section 5 derives the equations of solar radiation estimation on tilted solar planes. Section 6 provides an evaluation of solar radiation prediction on tilted solar planes. Finally, Section 7 presents the conclusion.

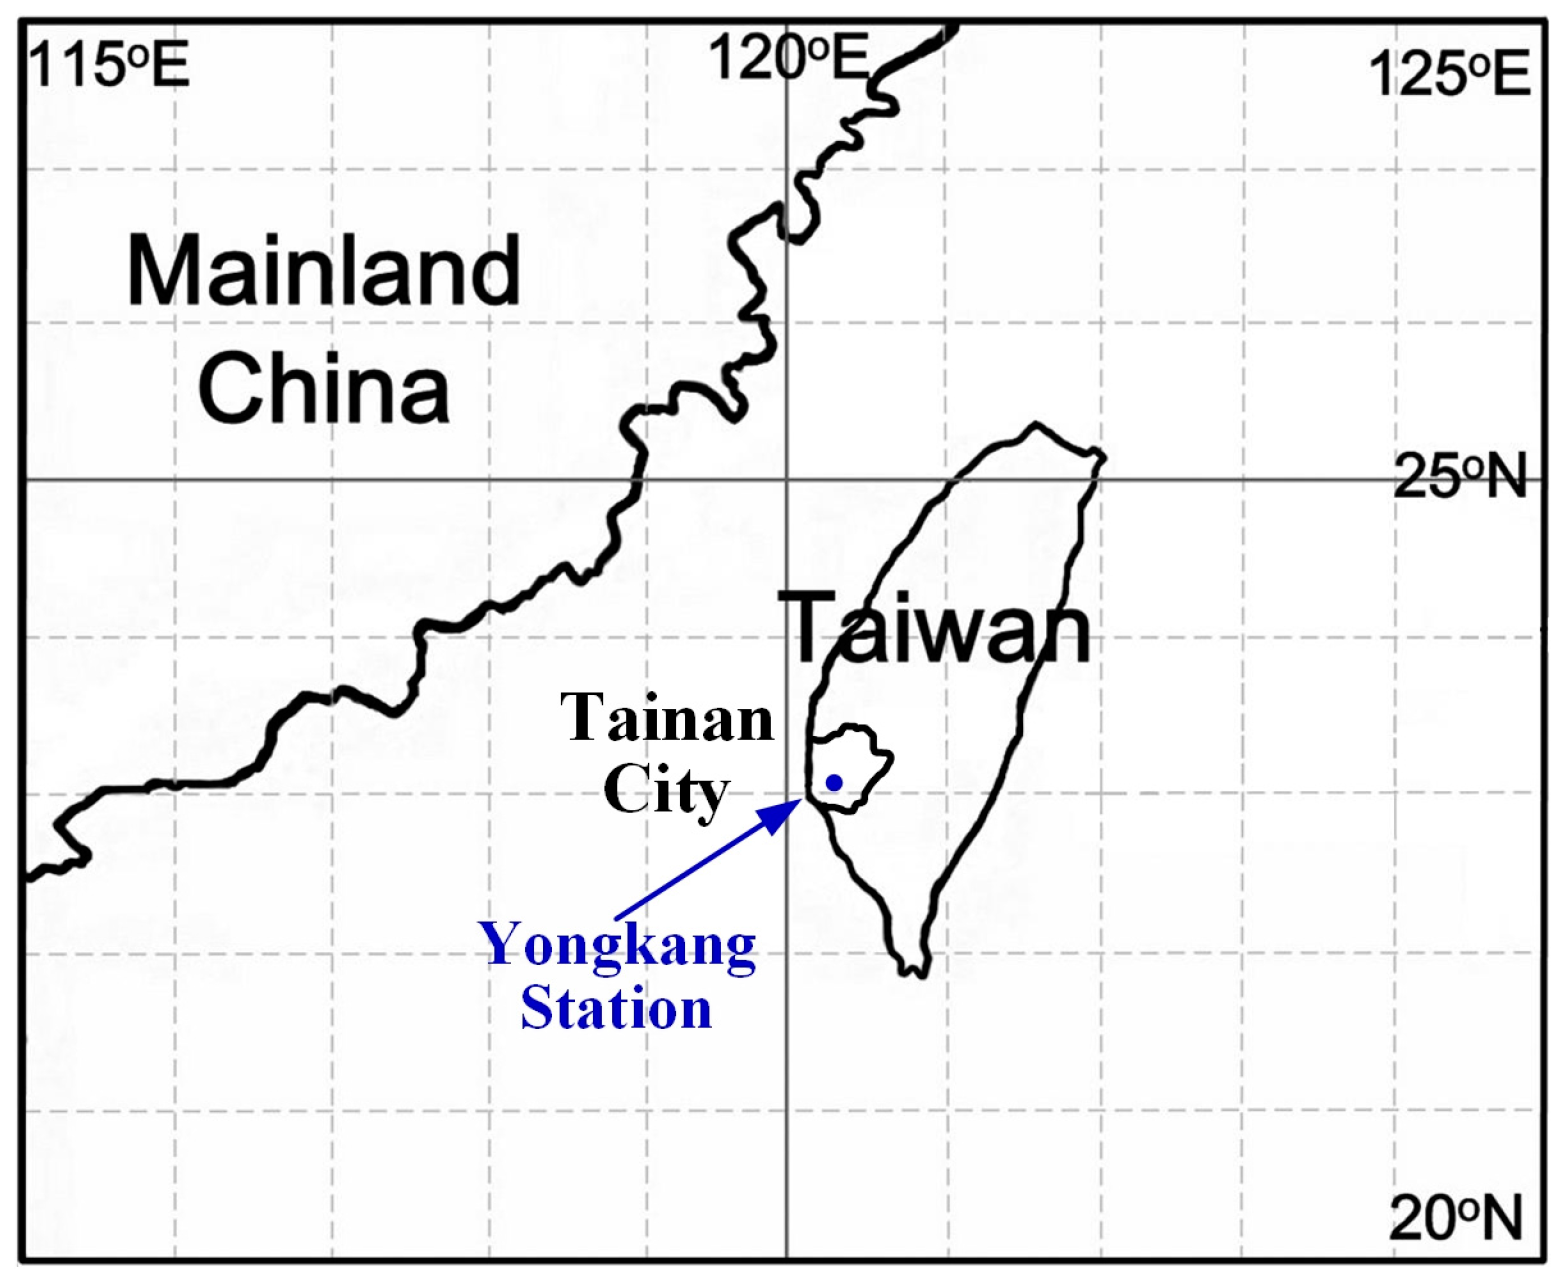
2. Study Site and Data

The study site is in Tainan City, Taiwan (Figure 1). This study collected hourly data for 7 years (2010–2016). Complete ground weather, remote-sensing, and solar position data were collected. Table 1 presents the per-unit descriptive statistics of all the parameters, namely their maximum value, minimum value, mean value, and standard deviation.

2.1. Ground Weather Data Set {A}

Approximately 61,400 records of ground weather data were acquired on an hourly basis from Yungkang Weather Station, which is administered by the Central Weather Bureau (CWB). Six ground weather parameters related to solar irradiance were selected: atmospheric pressure, wind speed, precipitation, temperature, relative humidity, and radiation. Radiation was an objective variable in SSIFMs.

2.2. Satellite Remote-Sensing Data Set {B}

Approximately 5200 records of satellite remote-sensing data spanning the 2010–2016 period were collected from the Moderate Resolution Imaging Spectroradiometer (MODIS) website (https://modis.gsfc.nasa.gov/). The MODIS was launched into orbit on board the Terra satellite in 1999 to observe the Earth’s atmosphere, oceans, and land surfaces. The Terra satellite orbits the planet in a descending fashion to cross the equator from the north to south [26]. This study used four MODIS parameters for solar irradiance: aerosol optical depth, water vapor, cirrus reflectance, and cloud fraction. The word “aerosol” in the parameter “aerosol optical depth” refers to a colloid of solid or liquid 0.01–10 µm particles suspended in a gaseous medium. Aerosol absorbs or diffuses atmospheric radiation to reduce the amount of radiation that reaches the Earth’s surface; therefore, the total concentration of aerosol in the atmospheric column can be determined according to the aerosol optical depth.

2.3. Sun Position Data Set {C}

A theoretical equation for the solar position was used to calculate the hourly solar position for Yungkang Weather Station during the 2010–2016 period. Five parameters for the solar position were used: the declination angle, the hour angle, the zenith angle, the elevation angle, and the azimuth angle. The parameters can be estimated from Equations (1)–(5), which are presented as follows [3,27,28,29].

2.3.1. Declination Angle

The Earth travels around the sun in an elliptical orbit known as the ecliptic. The plane of the equator and a line drawn from the center of the Earth to the center of the sun forms an angle called the declination angle, which is denoted by δ. The declination angle is 0° at the spring equinox (which falls on 20 or 21 March). The solar irradiance received by solar panels is related to direct and diffuse solar radiation, which corresponds to δ, and can be estimated by:
δ = 23.45 ° sin ( 360 ( n d 80 ) 365 )
where nd is the day as numbered within a solar year (ending with 365 on 31 December).

2.3.2. Hour Angle

The hour angle (ω) refers to the angle formed on an hourly basis by the sun’s apparent movement from the east to the west on the celestial sphere of the Earth. The Earth takes approximately 24 h to rotate once on its axis; therefore, the sun’s position changes by 15° per hour from the east to the west. ω is defined as 0° at noon and −180° at midnight, and can be estimated by:
ω = 15 ° ( H 12 )
where H is the time in 24-h format.

2.3.3. Zenith Angle

The zenith angle (θ) is the angle between the sun and the point directly overhead at a place of interest. It can be estimated by:
θ = cos 1 ( sin λ sin δ + cos λ cos δ cos ω )
where λ is the latitude of a place of interest (set to 23.0384° in this study, which is the latitude of Yungkang Weather Station).

2.3.4. Elevation Angle

The elevation angle (α) is the angle from the sun to the point of observation and the horizontal ground plane. It is complementary to the zenith angle, and can be estimated by:
α = 90 θ

2.3.5. Azimuth Angle

The solar azimuth angle (ξ) is the angle between the Earth’s orbit around the sun and its horizon. It can be estimated by:
ξ = sin 1 ( cos δ sin ω / sin θ )

3. Methodology and Models

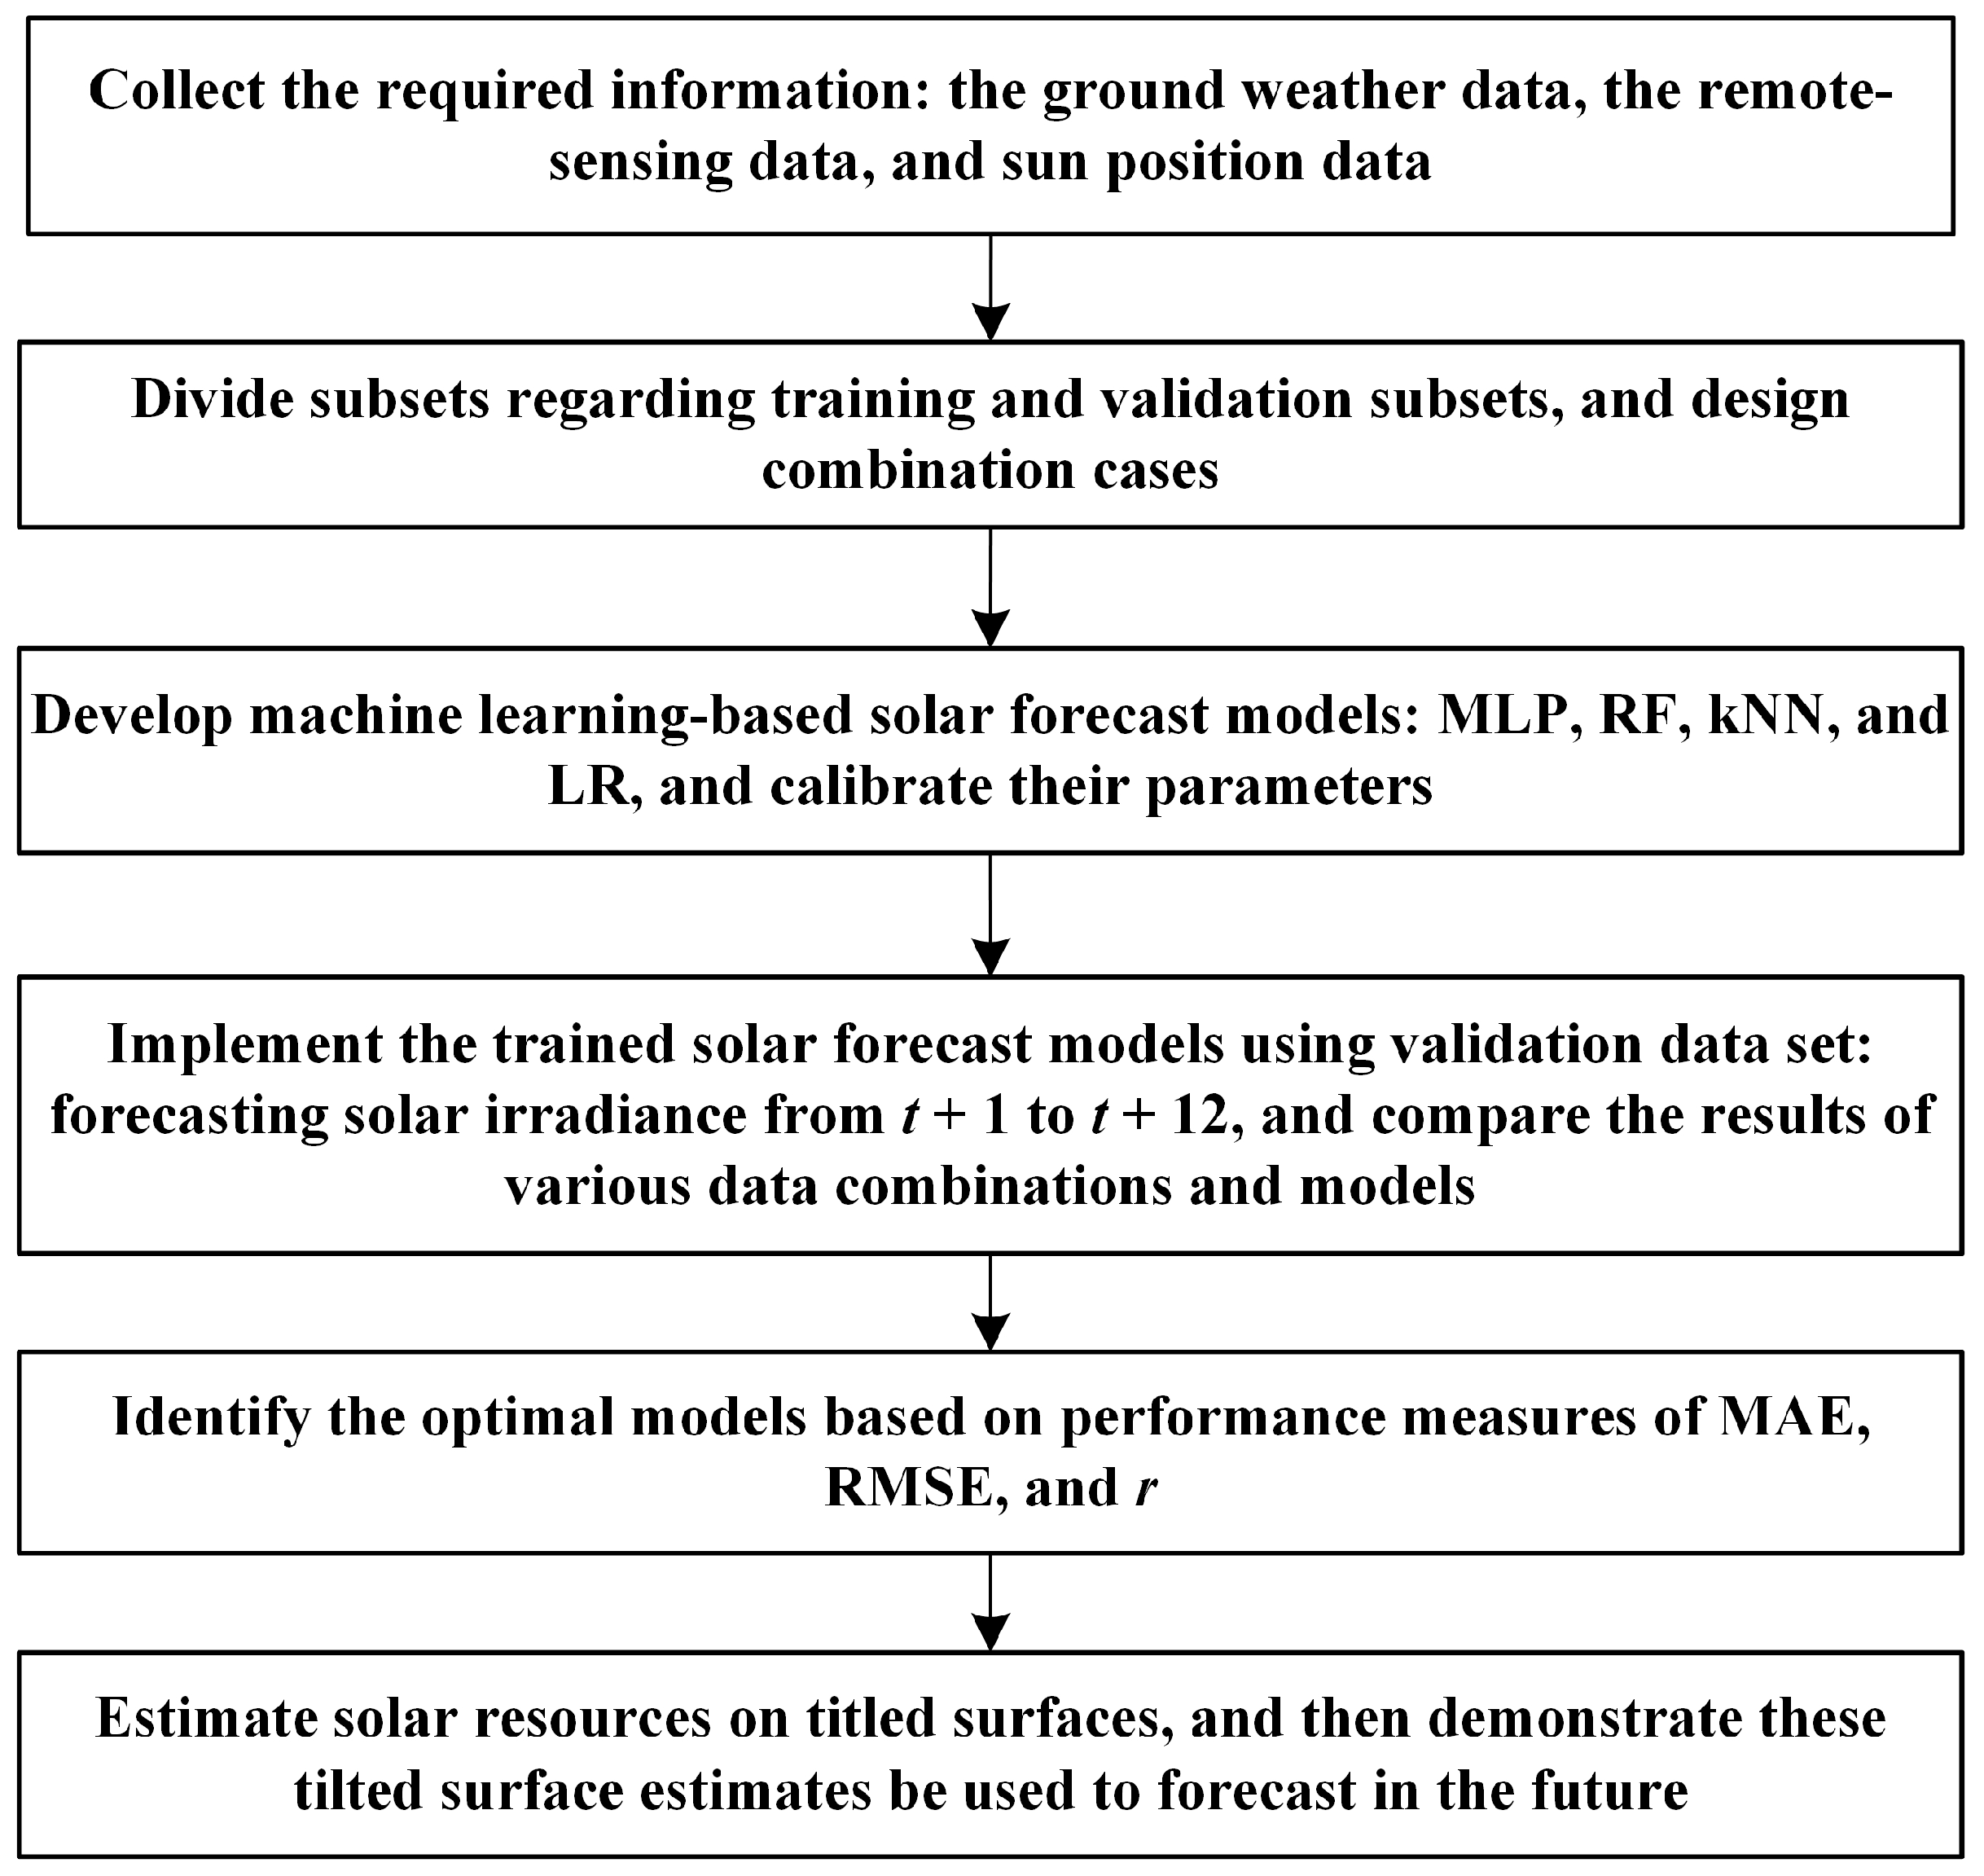
3.1. Procedures of the Methodology

Figure 2 shows a flowchart of the proposed methodology for formulating machine learning-based solar radiation forecasting models on a tilted surface.
The forecasting horizon is 1 to 12 h. For the first topic regarding forecasting future solar irradiance, the required information is as follows: (1) the ground weather data; (2) the remote-sensing data; and (3) sun position data (as described in Section 2). In the data preprocessing stage, the various dataset combinations were designed (Section 4.1). In the modeling procedure, the MLP, RF, kNN, and LR were used as the forecasting techniques. Subsequently, these prediction models were trained, and the model parameters were calibrated using the training subset. Finally, the optimal models were compared and verified based on various levels of performance. In the second topic regarding estimating solar irradiance on titled surfaces, this study estimate solar resources on titled surfaces, and then demonstrate these tilted surface estimates be used to forecast in the future. This part of flowchart and its procedures can be referred to Figure 3 and Section 5, respectively.

3.2. Machine Learning

This section describes the use of machine learning algorithms to construct SSIFMs. These algorithms were MLP, RF, kNN, and LR; as a conventional statistical model, LR was used as the benchmark model. Details about the LR algorithm are excluded from this paper and can be found in statistics books. The MLP, RF, and kNN algorithms are introduced as follows.

3.2.1. Multilayer Perceptron Neural Networks

ANN is a mathematical forecasting model patterned after the structure and functionality of neurons in the human brain. It uses computational resources to perform a nonlinear statistical analysis and establish complex input/output relationships. The hidden layer of the network consists of numerous nodes that connect input and output layers and represent different weights. Furthermore, the hidden layer performs complex computations and derives target outputs through machine learning. In this paper, the backpropagation network (BPN), a widely used NN, was adopted to establish SSIFMs. The BPN uses an MLP, learns through error backpropagation, and is a multilayer feedforward network that applies supervised learning to process the mapping relations between inputs and outputs [30]. The framework of the network comprises three layers. The first layer is the input layer, which transmits, rather than processes, external information. The second and third layers, respectively referred to as the hidden and output layer, perform simulations by multiplying weights, adjusting biases, and applying the activation function. Mapping equations for both input and output layers are described as follows:
n e t j n = i w j i n y i n 1 + b j n
y j n = F ( n e t j n )
where n e t j n is the computed value of the neuron j in the n-th layer, w j i n is the connection weight between the j-th neuron in the n-th layer and the i-th neuron in the n − 1-th layer, y i n 1 is the output value of the i-th neuron in the n − 1-th layer, y j n is the output value of the j-th neuron in the n-th layer, and F ( ) is the activation function in the hidden layer.
Supervised learning involves training NNs on the basis of target outputs and their corresponding inputs. Specifically, in this learning task, an NN estimates the error between the network output value and the target output value and corrects it to the minimum. The error is estimated as follows:
E = 1 2 k ( d k y k ) 2
where d k is the target value for the k-th neuron in the output layer and y k is the network output value for the k-th neuron in the hidden layer.
The BPN applies the method of steepest descent to minimize errors through iteration. At the learning stage, it uses known inputs and outputs to train data and derive a set of weights connected to the hidden layer. Accordingly, input data are estimated on the basis of these weights to yield target outputs. At the recall stage, the network uses a new output, as well as weights derived at the learning stage, to yield new outputs (or predictive values).

3.2.2. Random Forests

An RF is a machine learning process and a modified algorithm based on a decision tree. The RF algorithm was created by Breiman and Culter in 2001 on the basis of random decision forests, which were proposed by [31,32]. This algorithm uses Breiman’s bootstrap aggregating method and Ho’s random subspace method to establish sets of decision trees [21]. Moreover, it randomizes data and variables to generate decision trees for computation and organize the trees into the final result. Therefore, the algorithm can improve its prediction accuracy even if its computational capacity does not indicate any noticeable increase. However, being insensitive to multicollinearity, the algorithm yields robust results for unbalanced and missing data. The algorithm also generates high-precision classifiers for many types of data.
In brief, the RF algorithm is an ensemble method that constructs numerous decision trees (which collectively constitute an RF) to perform analytical or predictive tasks. The establishment of an RF model comprises the following steps [32,33]:
Step 1:
Determine the number of decision trees required to construct RFs.
Step 2:
Use bootstrapping to generate new training data in existing ones. Both new and existing training data are equivalent in volume.
Step 3:
Use the data derived through bootstrapping to generate classification and regression trees. If the number of independent variables is P during the generation of the trees, then branching is performed on randomly selected nodes whose number of independent variables is lower than P .
Step 4:
Repeat Steps 2 and 3 until the number of decision trees as determined in Step 1 is reached.
Step 5:
Analyses are performed using all decision trees. If the dependent variables are categorical, and the variable that appears the most frequently in the decision trees is deemed to be the output. If dependent variables are continuous, then the average of the prediction results from all the trees is used as the output.

3.2.3. k-Nearest Neighbor

kNN is a common method for classifying data and an unsupervised machine learning algorithm. The rationale behind kNN is intuitive. That is, each datum represents a coordinate position in a vector-space model, and the data of a given category should have similar attributes and be close to each other in the model. Accordingly, data that are classified into the same categories should appear in clusters.
The kNN algorithm determines (1) the number of neighbors, k, to be taken as reference values and (2) the manner in which the distances between the neighbors are calculated. Generally, k is crucial to the kNN algorithm, and the accuracy of kNN classification is subject to the volume of classified training data. If k is set too small, then neighbors that are not clearly classified can undermine the accuracy of classification results. If k is set too large, then excessive computation occurs and other similar classification results can be accidentally accounted for. Moreover, the distances between neighbors can be estimated using different geometric methods. The Euclidean distance, a common measure of distance, was employed in this paper. The Euclidean distance assumes two points, x = [x1, x2, …, xk] and y = [y1, y2, …, yk], in a k-dimensional space, and the distance between x and y is expressed as follows:
d ( x , y ) = i = 1 k ( y i y i ) 2

4. Experiments and Modeling

In this paper, four SSIFMs were constructed using MLP, RF, kNN, and LR, respectively, and their prediction capacities were evaluated subsequently. Historical data derived from the CWB suggest that July has the longest sunshine duration of the year (approximately 12 h per day, 06:00–18:00). Therefore, the forecasting horizon in this study was set to be 12 h, which was adequate for calculating solar irradiance during the day. Four different combinations of the datasets were prepared and integrated with the four models to yield 16 model cases. Prediction results from the model cases were assessed to identify the optimal model case.

4.1. Data Partition and Combination Cases

While the models were being trained, the 2010–2015 data were used as the training set whereas the 2016 data the validation set. The four dataset combinations, on which the prediction results were evaluated to determine the optimal model case, are described as follows:
  • Dataset combination 1: ground weather dataset, denoted by {A}.
  • Dataset combination 2: ground weather dataset and satellite remote-sensing dataset ({A,B}).
  • Dataset combination 3: ground weather dataset and solar position dataset ({A,C}).
  • Dataset combination 4: ground weather dataset, satellite remote-sensing dataset, and solar position dataset ({A,B,C}).
Here, the subset {A} includes parameters of atmospheric pressure, wind speed, precipitation, temperature, relative humidity, and radiation. The subset {B} includes aerosol optical depth, water vapor, cirrus reflectance, and cloud fraction. The subset {C} includes declination angle, hour angle, zenith angle, elevation angle, and azimuth angle.

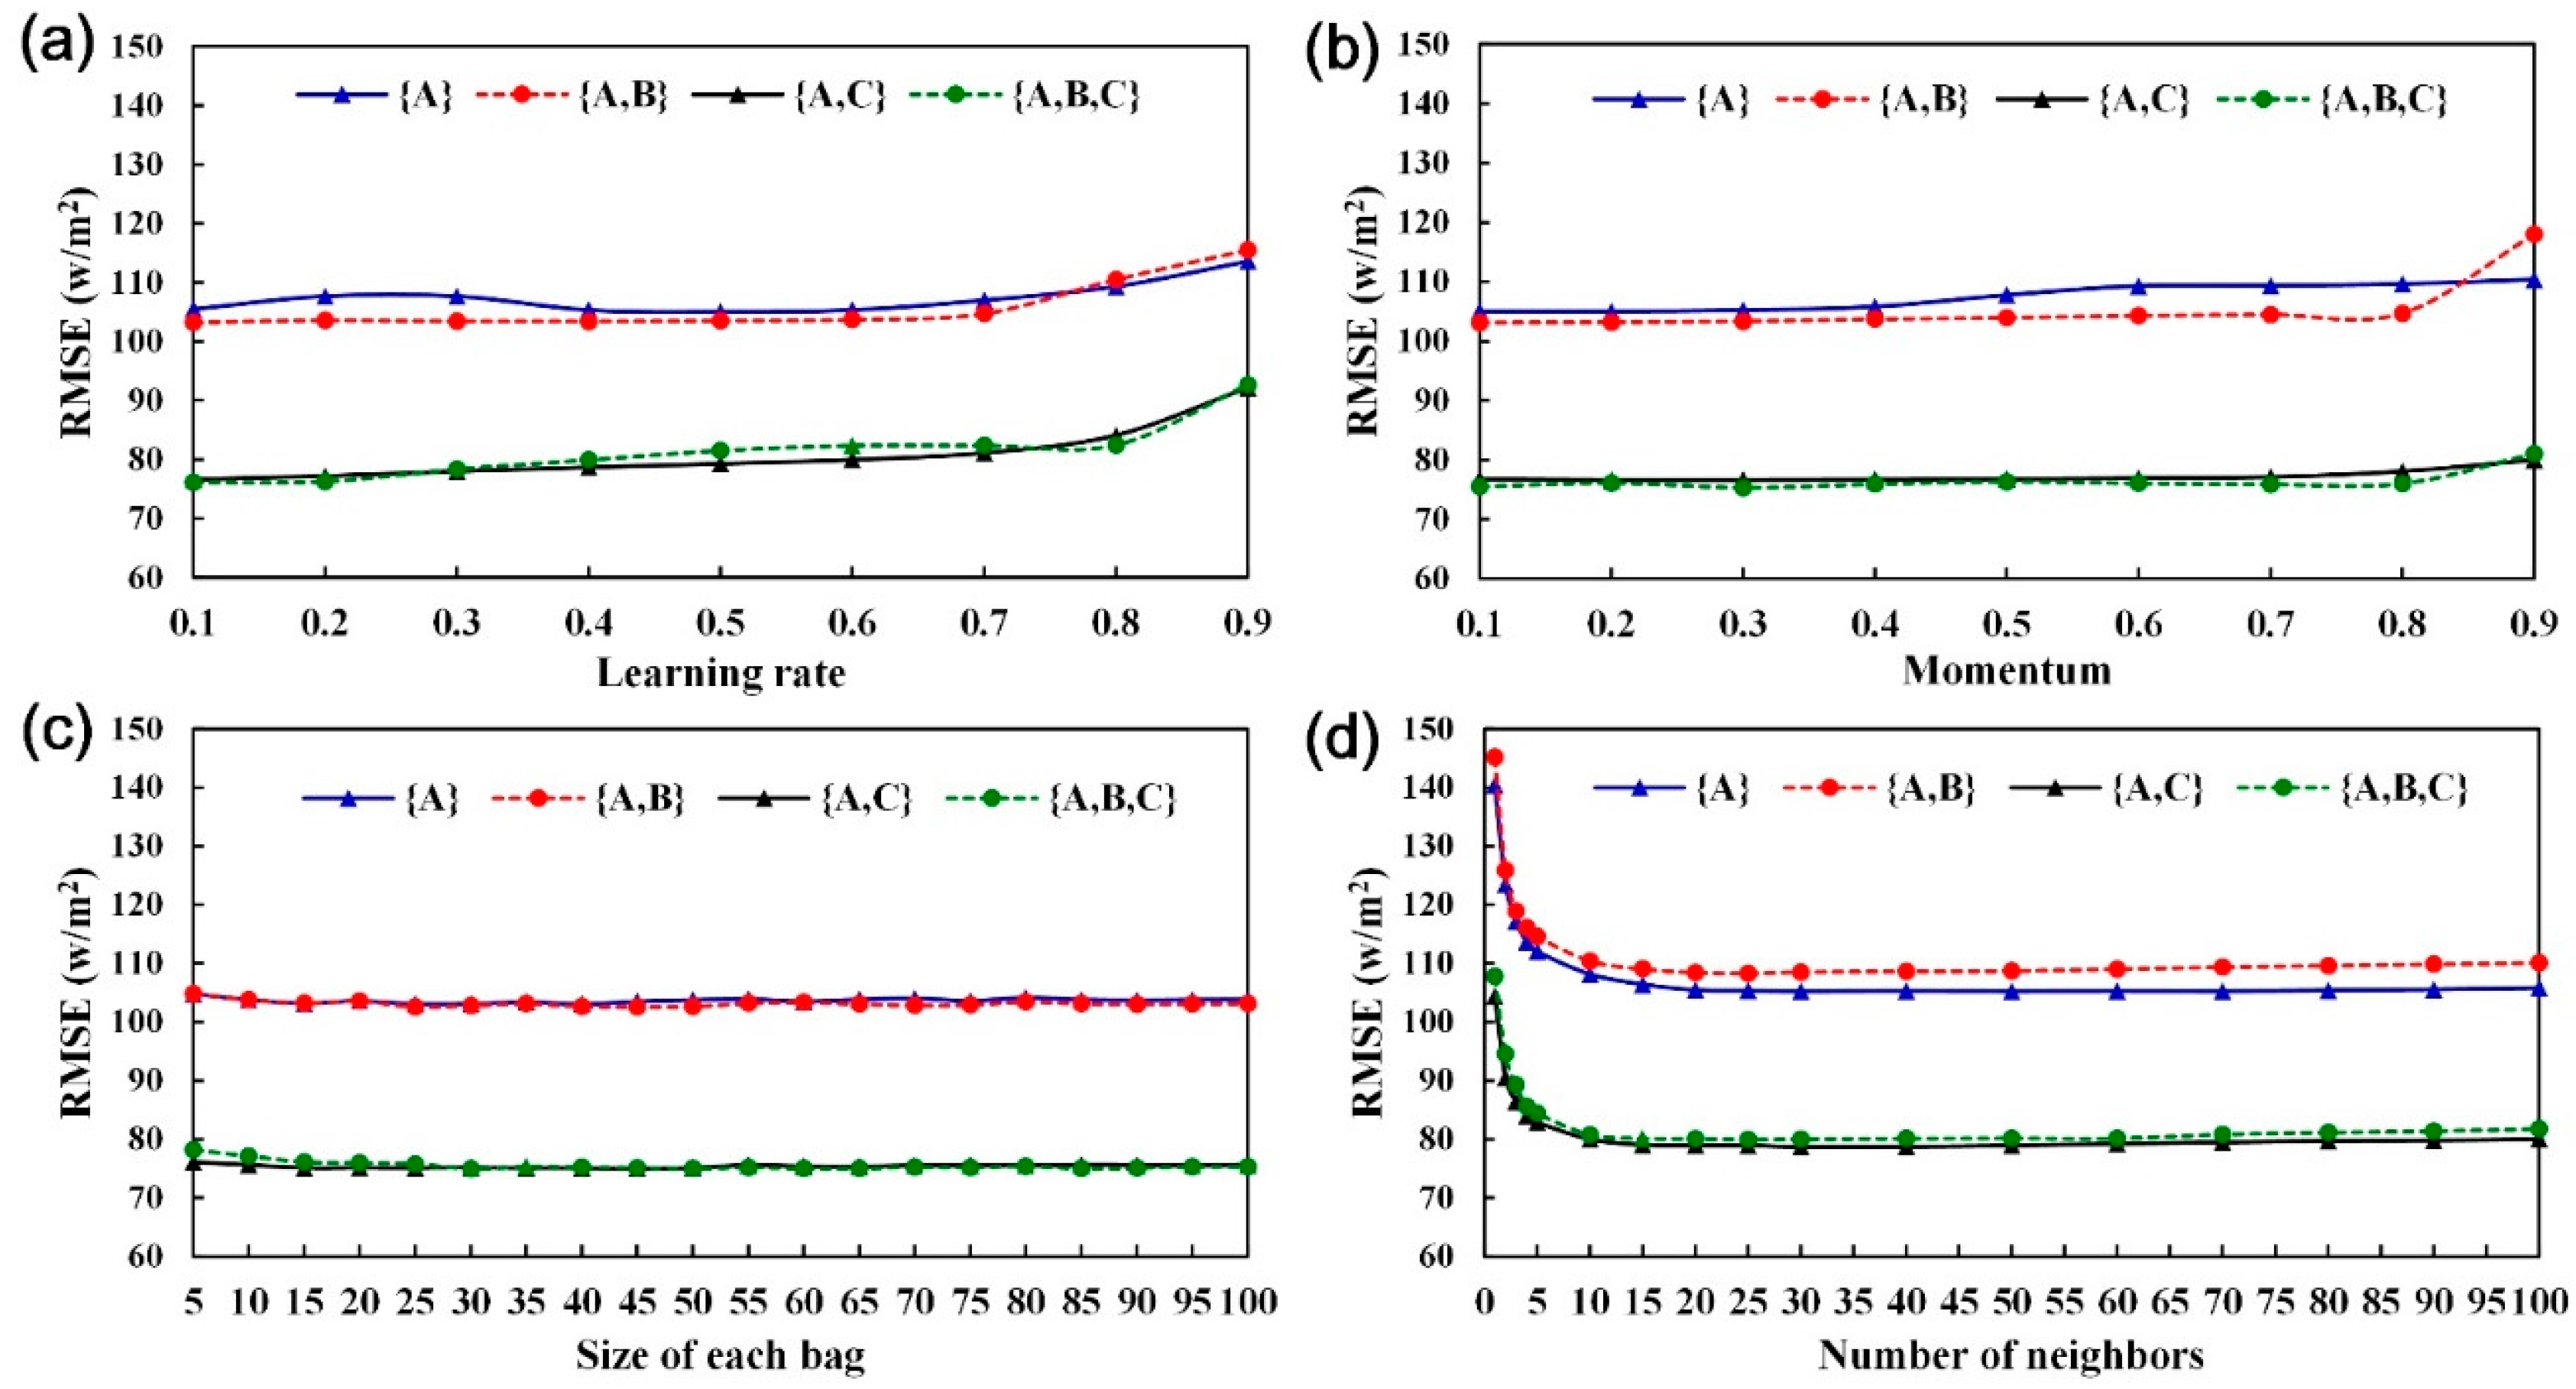
4.2. Model Parameter Setup and Calibration

This section takes the solar irradiance over the next hour (t + 1) as an example of prediction targets to explain how to assess model parameters. Model parameters of the next 2 h (t + 2) and the next 12 h (t + 12) can be assessed using the same method. The training set was used during parametric training, and the validation set was subsequently employed to generate results on which the parameters were assessed. Table 2 details the optimal parameters for all model cases yielded from the calibration process.
An MLP model was constructed with three NN layers (the input, hidden, and output layers). The activation function of the hidden layer was a sigmoid function, which is the most commonly used type. The parameters specified in the MLP model were the number of neurons in the hidden layer, the learning rate, and the momentum correction coefficient. The number of neurons in the hidden layer was determined according to the method proposed by [34], namely adding up the number of neurons in the input and output payers, minusing the sum by 1, and dividing this number by 2. The learning rate and the momentum correction coefficient were estimated using the trial-and-error method; specifically, the default momentum correction coefficient was set to 0.2 and a sensitivity analysis was subsequently conducted to determine the optimal learning rate. The learning rate was estimated on a ten-interval scale ranging from 0 to 1, and the root-mean-square error (RMSE), which represents the differences between values predicted and those observed, was estimated at each interval. The RMSE is defined as follows:
RMSE = 1 N j = 1 N ( O j pre O j obs ) 2
where O j pre is the predicted value for record j, O j obs is the observed value for record j, and N is the total number of records.
Figure 4a presents the RMSE for the learning rate at each interval. Generally, smaller RMSEs indicate smaller errors; thus, the smallest RMSE result was defined in this study as the optimal solution. The optimal learning rates were 0.5 for {A} and 0.1 for {A,B}, {A,C}, and {A,B,C} (Figure 4a). After the optimal learning rate was determined for all the dataset combinations, the momentum correction coefficient was estimated on a ten-interval scale ranging from 0 to 1 (Figure 4b). The optimal momentum correction coefficients were 0.2 for {A} and {A,C}, 0.1 for {A,B}, and 0.3 for {A,B,C}.
While an RF model was being constructed, the major parameter in the model, the size of each bag (ranging from 5 to 100 decision trees) was calibrated. A sensitivity analysis indicated nonsignificant changes in the RMSE for the size of each bag (Figure 4c), with the optimal size of each bag being 40 for {A}, 25 for {A,B}, 45 for {A,C}, and 30 for {A,B,C}.
While the kNN model was being established, one parameter in the model, the number of neighbors (ranging from 1 to 100), was calibrated. A sensitivity analysis suggested that when the RMSE for the number of neighbors for all the dataset combinations reached 20, it declined gradually and converged (Figure 4d). The optimal number of neighbors was 30 for {A} and {A,C}, and 25 for {A,B} and {A,B,C}.

4.3. Forecasting Solar Irradiance in t + 1 through the Four Dataset Combinations

All the optimal parameters obtained in the previous subsection were used to construct solar-irradiance forecasting models. The prediction results were presented through comparisons among (1) all dataset combinations and (2) the machine learning models. In addition to the RMSE, the mean absolute error (MAE) and the correlation coefficient (r) were used. The two measures are defined separately as follows:
MAE = 1 N j = 1 N | O j pre O j obs |
r = j = 1 N ( O j obs O ¯ obs ) ( O j pre O ¯ pre ) j = 1 N ( O j obs O ¯ obs ) 2 j = 1 N ( O j pre O ¯ pre ) 2
where O ¯ pre is the mean of all predicted values and O ¯ obs is the mean of all observed values.

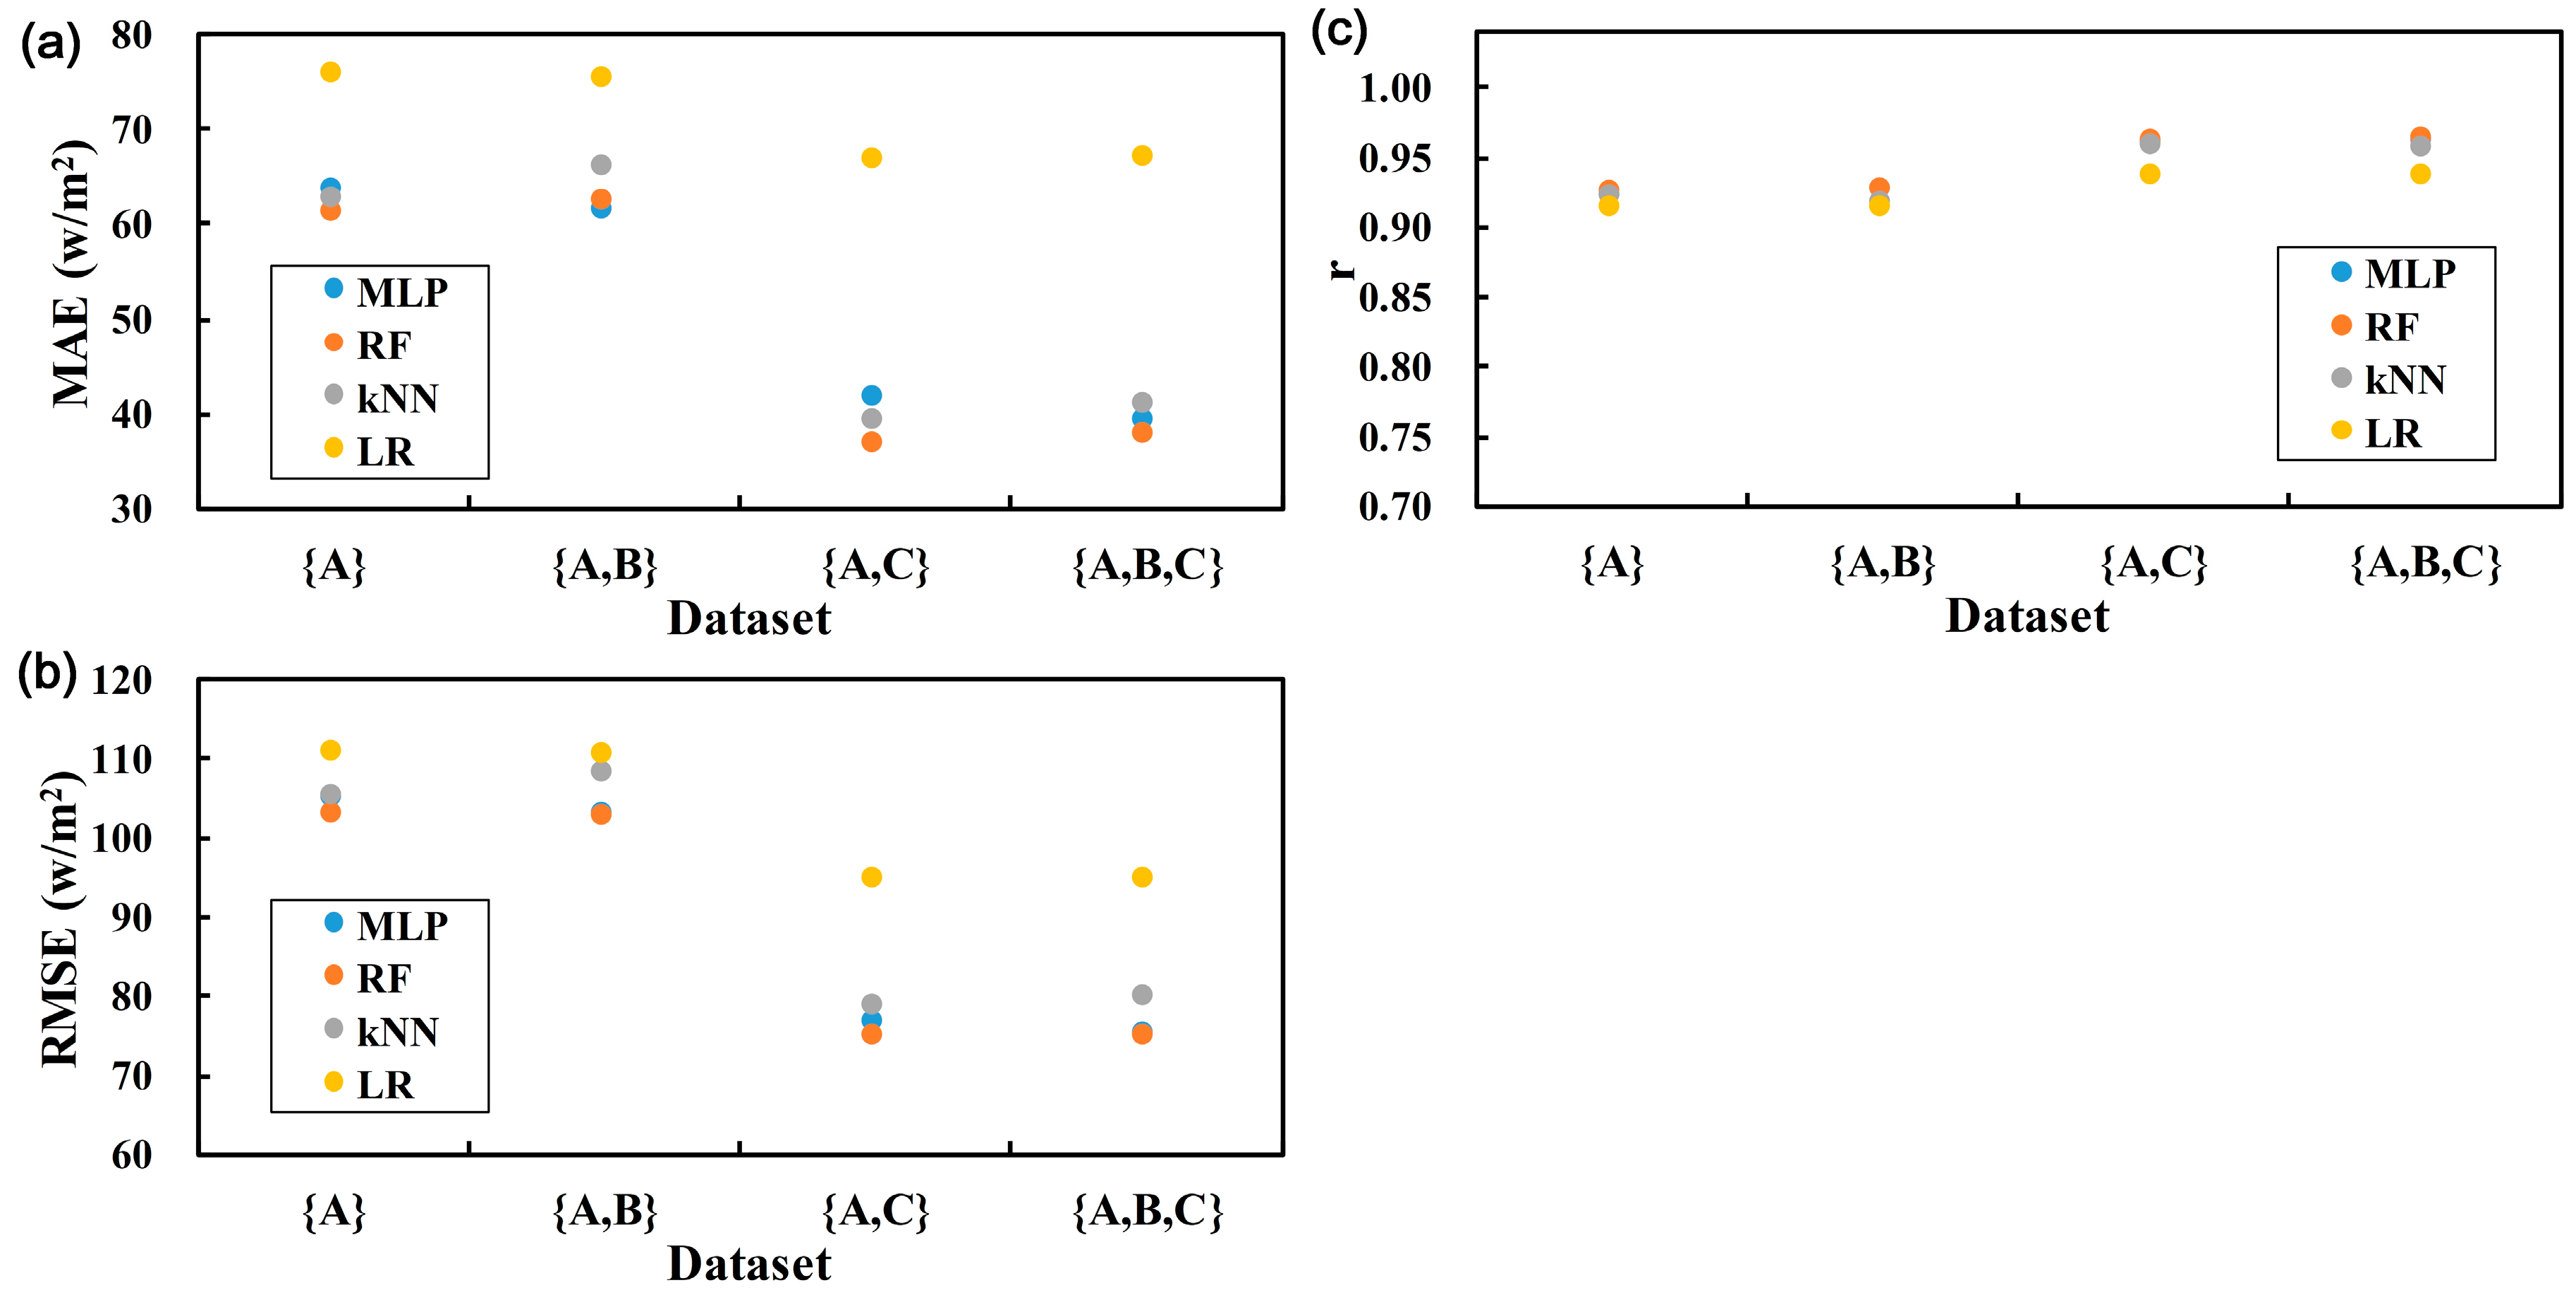
4.3.1. Results of Dataset Combinations
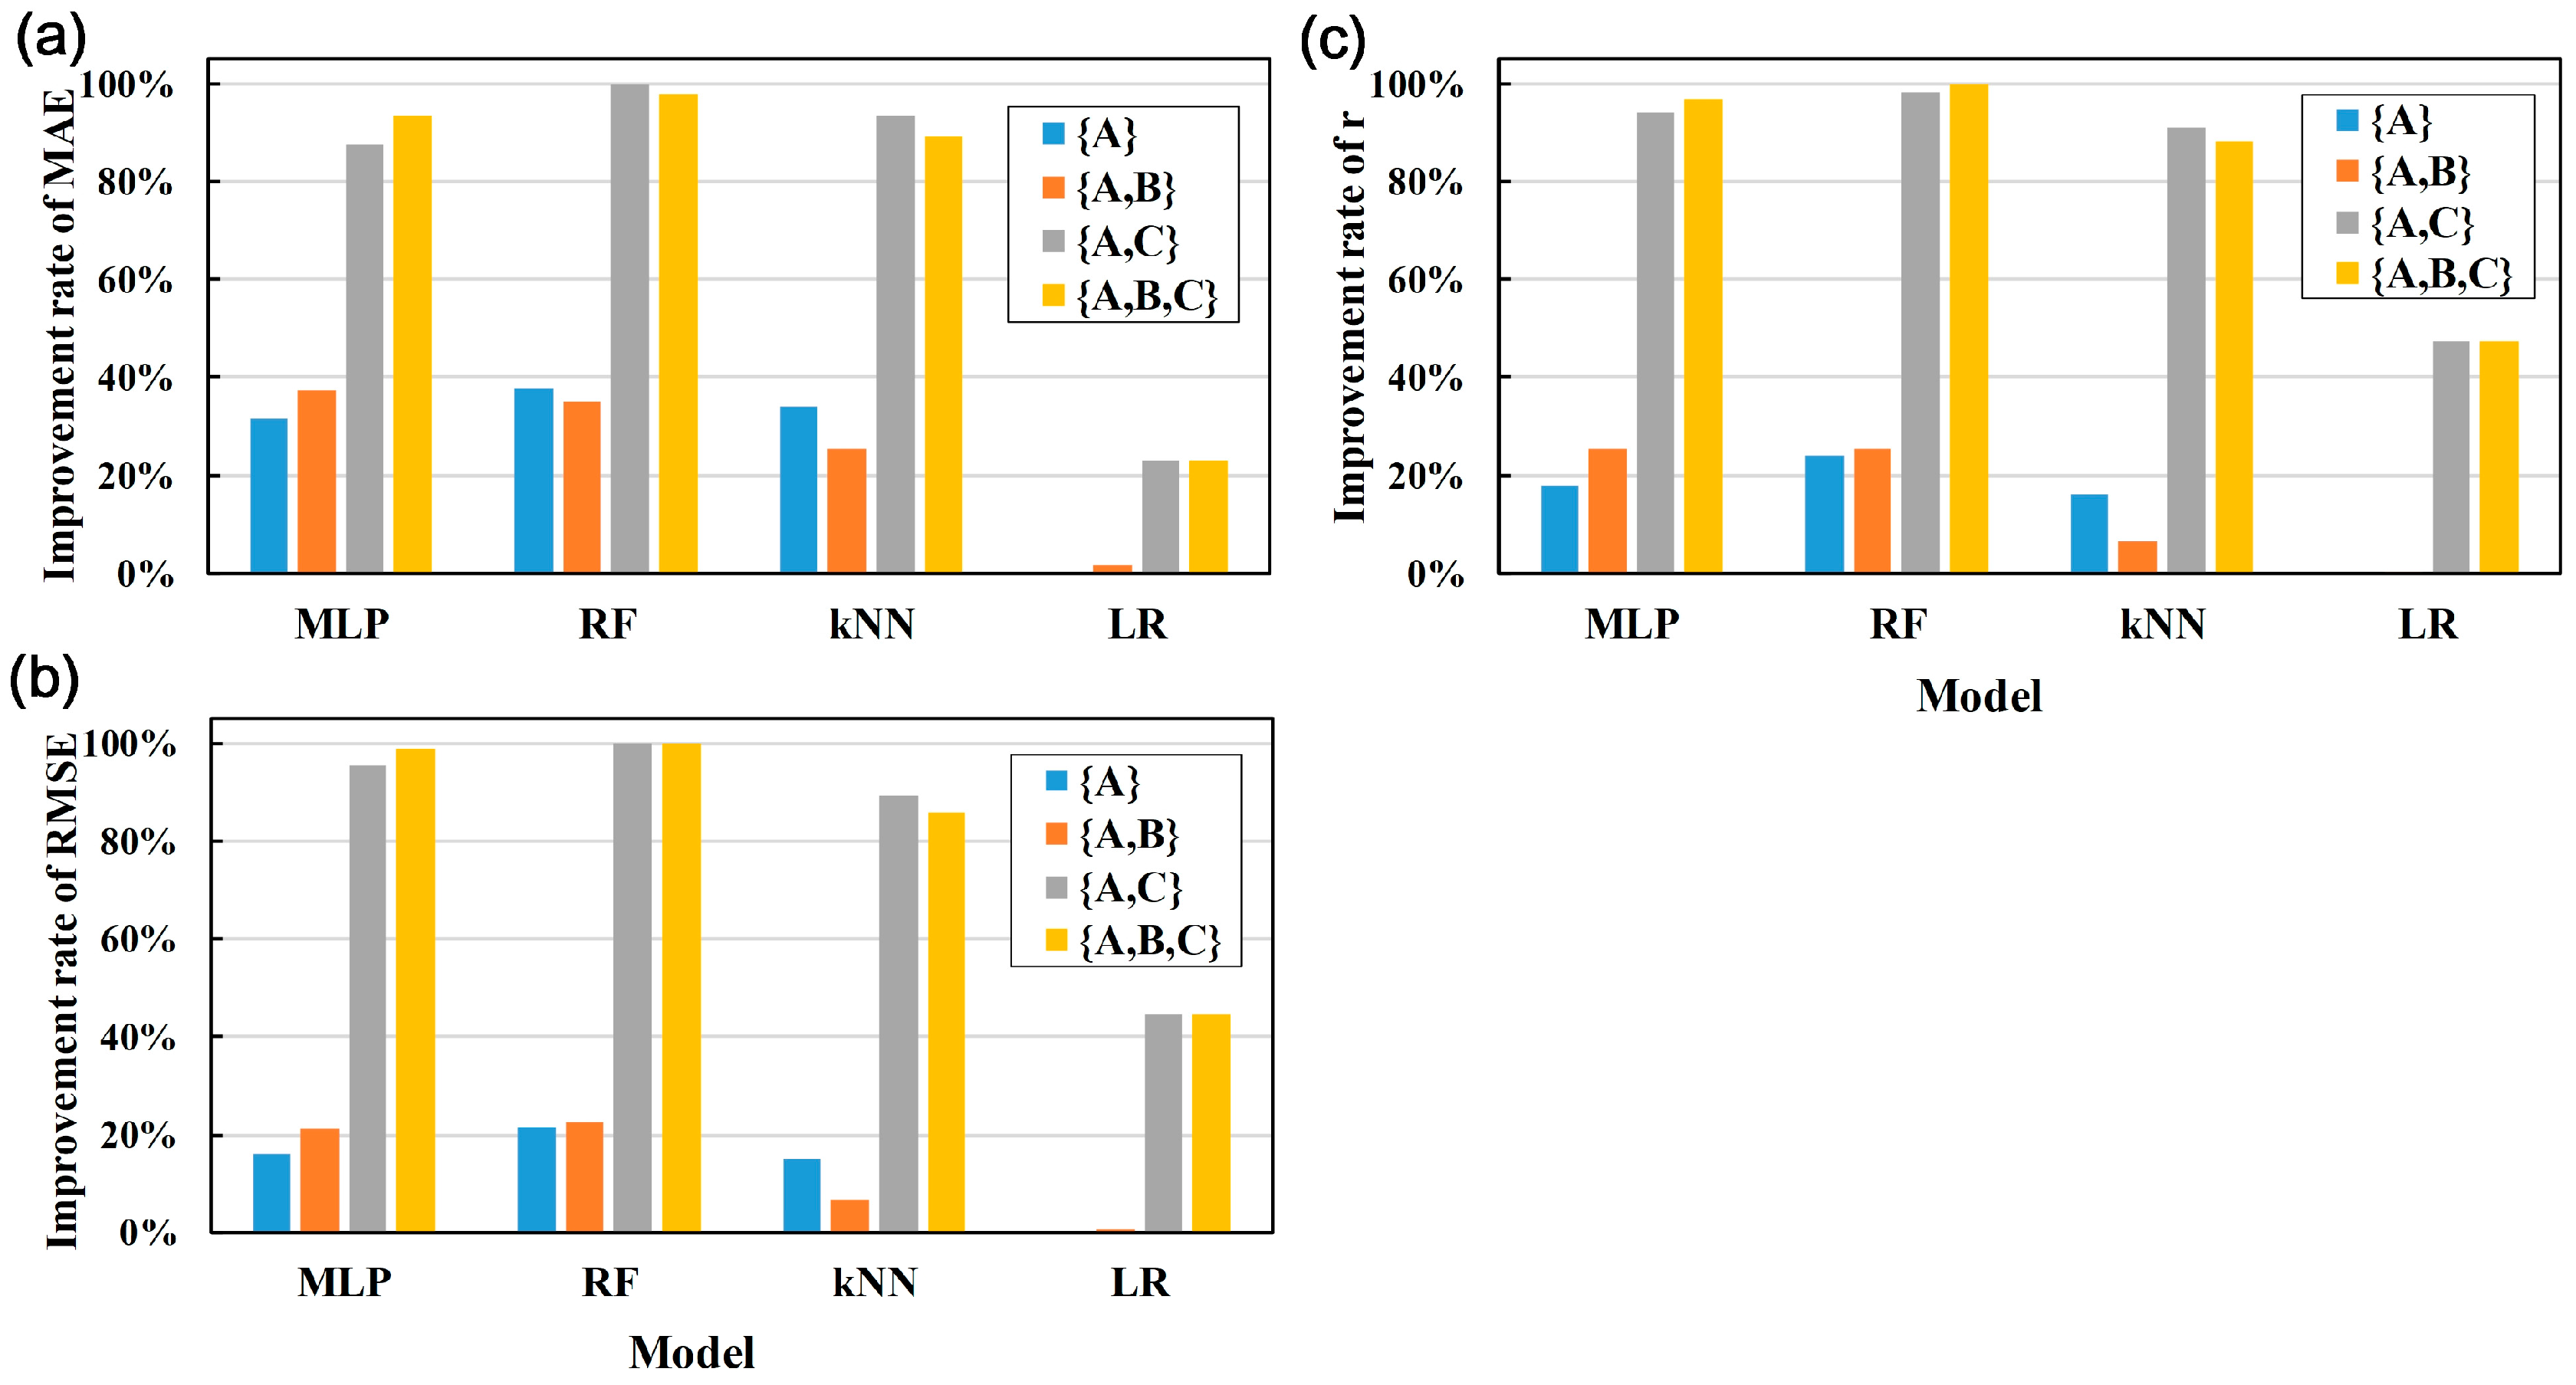
Figure 5 shows the MAE, RMSE, and r for solar irradiance at t + 1, as predicted through the four dataset combinations. MLP, RF, and kNN were comparable in all the measures, suggesting that the prediction error was higher in LR than in the other models. The values of MAE, RMSE, and r for LR were eliminated, and those for MLP, RF, and kNN were averaged to compare all the dataset combinations. Table 3 indicates that {A,C} outperformed the other dataset combinations in the MAE (and was comparable to {A,B,C}), and that {A,B,C} outperformed the other dataset combinations in the RMSE and r (and was comparable to {A,C}). Accordingly, errors in the prediction results of the models decreased more significantly when {A} as input data was combined with {C} than with {B}; and prediction results from {A,B,C} showed no noticeable improvement in comparison with {A,C}.
The nonsignificant improvement in prediction results was probably due to the limited size of the satellite remote-sensing dataset {B}, which can be attributed to the fact that the MODIS is nonsynchronous, delivering atmospheric data only on a daily basis. Thus, the instrument does not observe changes in the Earth’s atmosphere (e.g., cloud shading) on an hourly basis.

4.3.2. Evaluation

Here, the improvement rates were defined in order to compare the various data combinations and models. First, the improvement rate of MAE, I i , j MAE , is given as:
I i , j MAE ( % ) = ( MAE i , j MAE M A X ) / ( MAE M I N MAE M A X ) × 100
where MAEi,j is the MAE for model j in dataset i, MAEMAX is the maximum MAE (the negative ideal solution) for all models in all dataset combinations, MAEMIN is the minimum MAE (the positive ideal solution) for all models in all dataset combinations.
Likewise, the improvement rates of the measures RMSE and r—denoted respectively by I i , j RMSE and I i , j r —are defined as follows:
I i , j RMSE ( % ) = ( RMSE i , j RMSE M A X ) / ( RMSE M I N RMSE M A X ) × 100
I i , j r ( % ) = ( r i , j r M I N ) / ( r M A X r M I N ) × 100
where RMSEi,j is the RMSE for model j in dataset i, RMSEMAX is the maximum RMSE for all models in all dataset combinations, RMSEMIN is the minimum RMSE for all models in all dataset combinations, ri,j is the r for model j in dataset i, rMAX is the maximum r for all models in all dataset combinations, and rMIN is the maximum r for all models in all dataset combinations.
On the basis of this definition, I i , j MAE , I i , j RMSE , and I i , j r ranged from 0% to 100%, and the higher they were, the higher the improvement rates were. Figure 6 depicts the improvement rates for MLP, RF, kNN, and LR with all dataset combinations. Because {A,C} was previously determined as the optimal dataset, the improvement rates for the four models with {A,C} (which is represented by gray histograms in Figure 6) were analyzed, and the following conclusions were reached.
  • Regarding I i , j MAE (Figure 6a), the improvement rate was the highest in RF (100%), followed by kNN (93.6%), MLP (87.7%), and LR (23.1%).
  • Regarding I i , j RMSE (Figure 6b), the improvement rate was the highest in RF (99.9%), followed by MLP (95.4%), kNN (89.4%), and LR (44.6%).
  • Regarding I i , j r (Figure 6c), the improvement rate was the highest in RF (98.4%), followed by MLP (94.3%), kNN (91%), and LR (47.3%).
Overall, RF exhibited the highest prediction performance, MLP the second highest, and LR the worst.

4.4. Forecasting Solar Irradiance across Different Forecast Horizons

This subsection focuses on error diffusion with a forecast horizon from 1 to 12 h. The optimal dataset {A,C} was used to establish all forecasting models. The training set was applied for model training, and the validation set was used to verify the training results. Prediction results are described as follows.

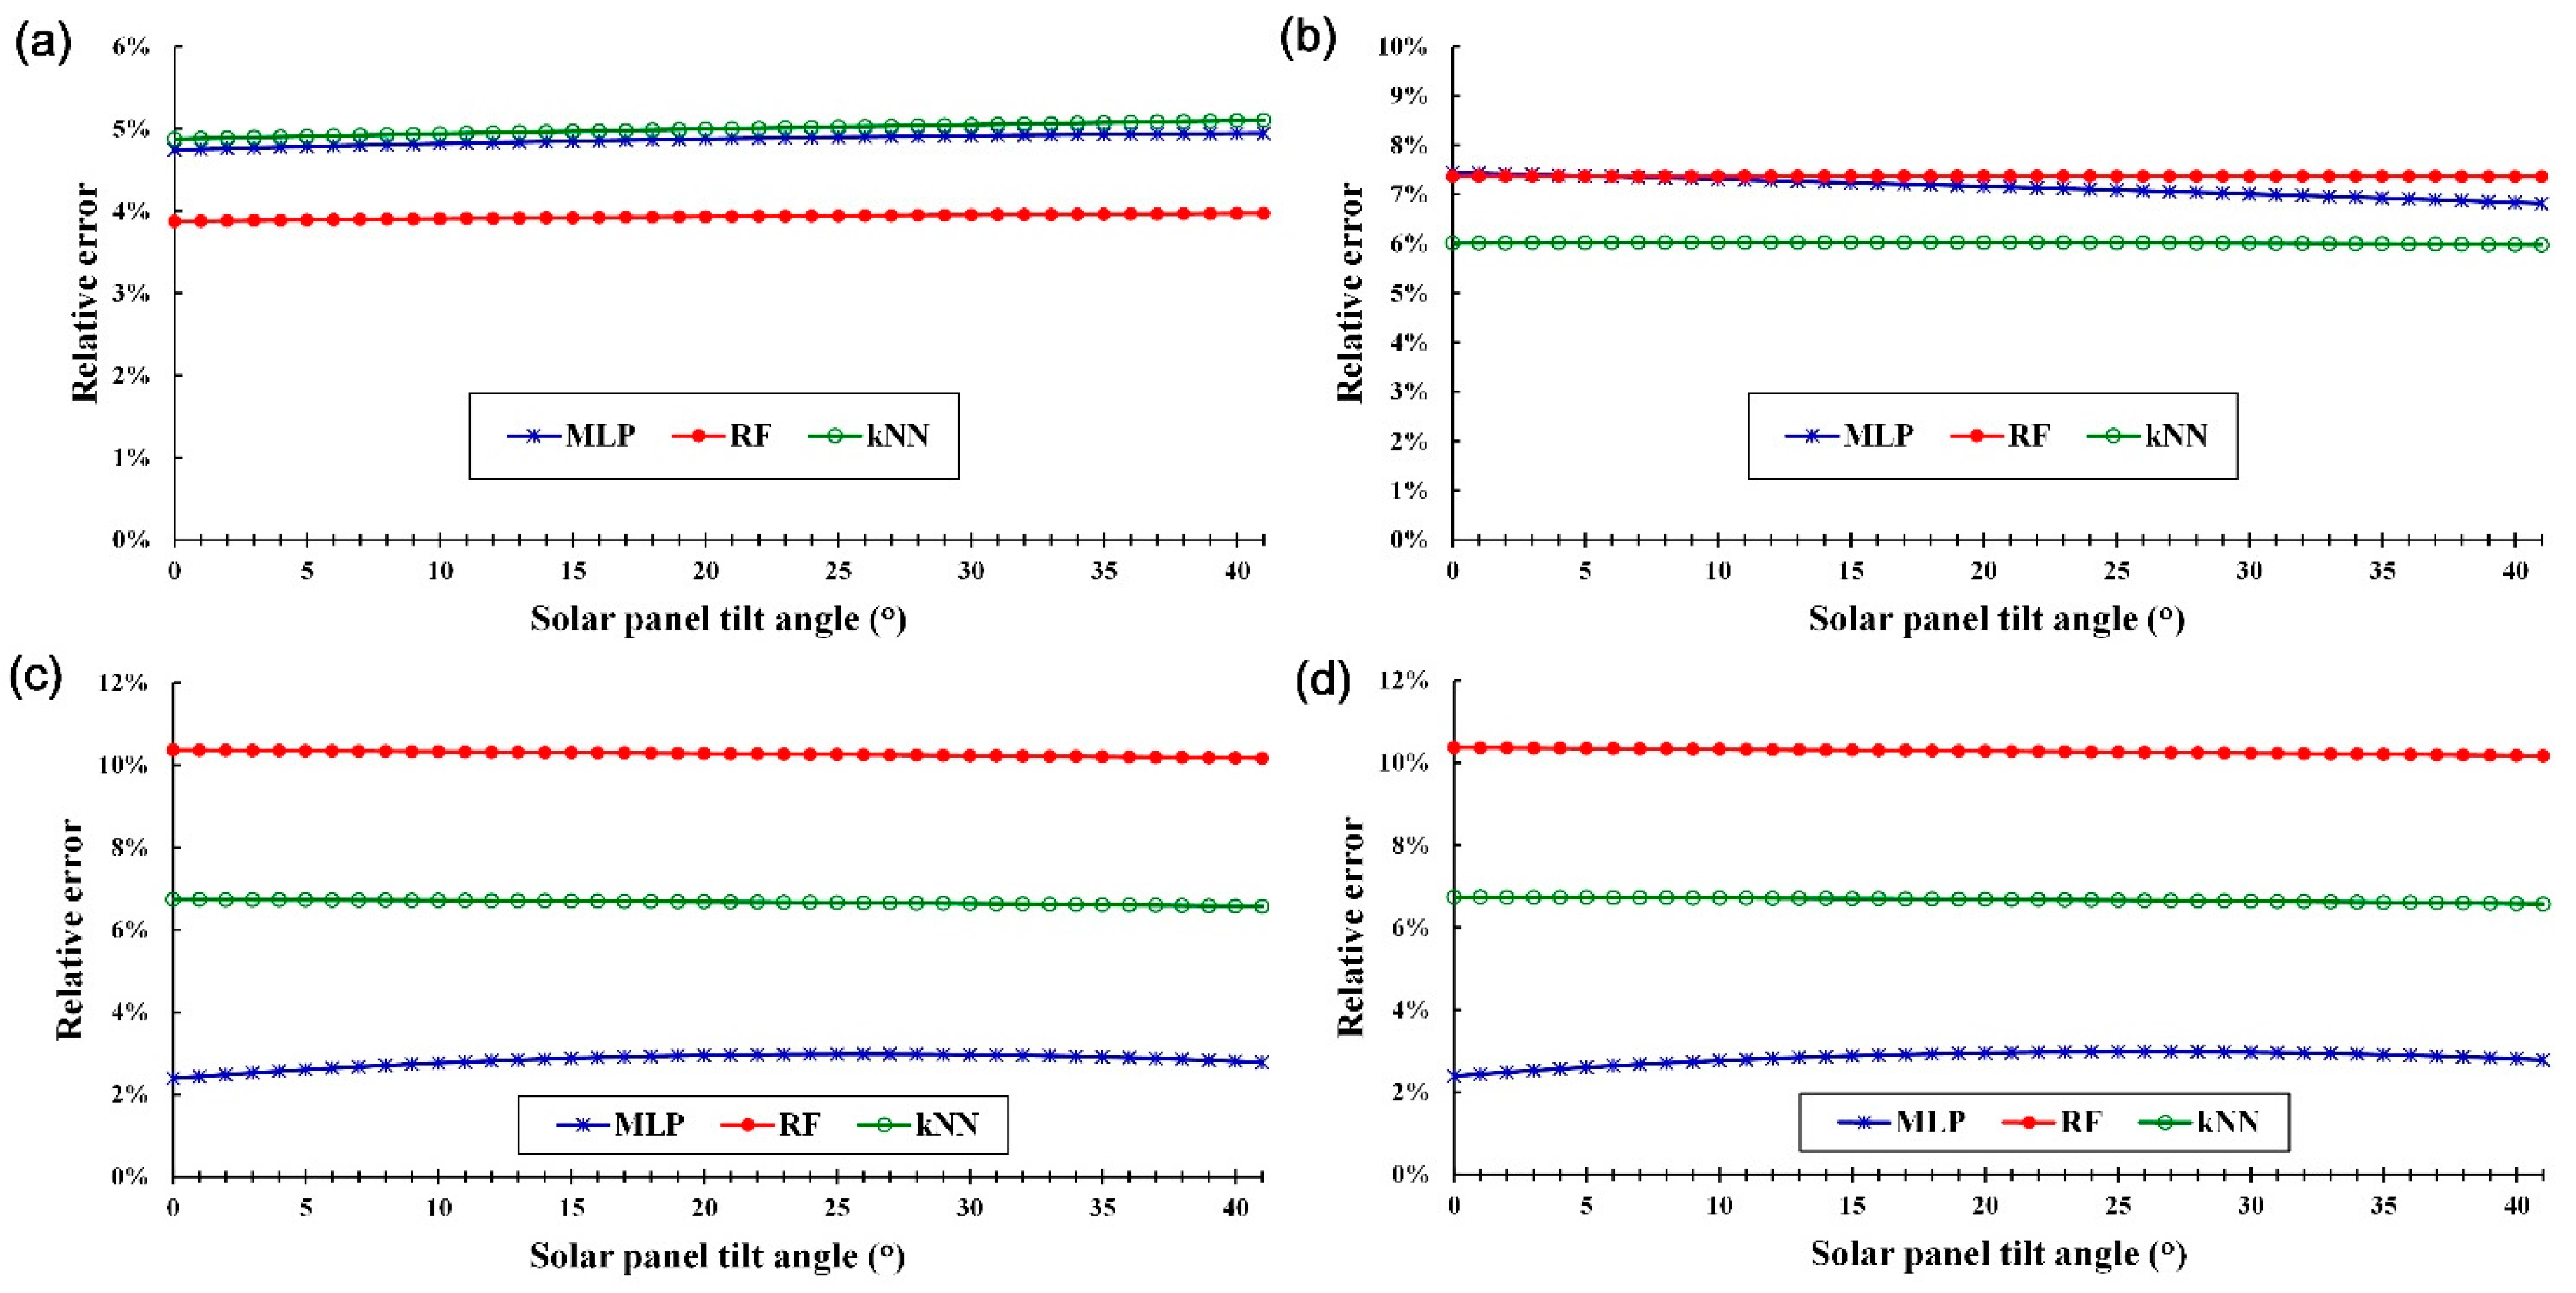
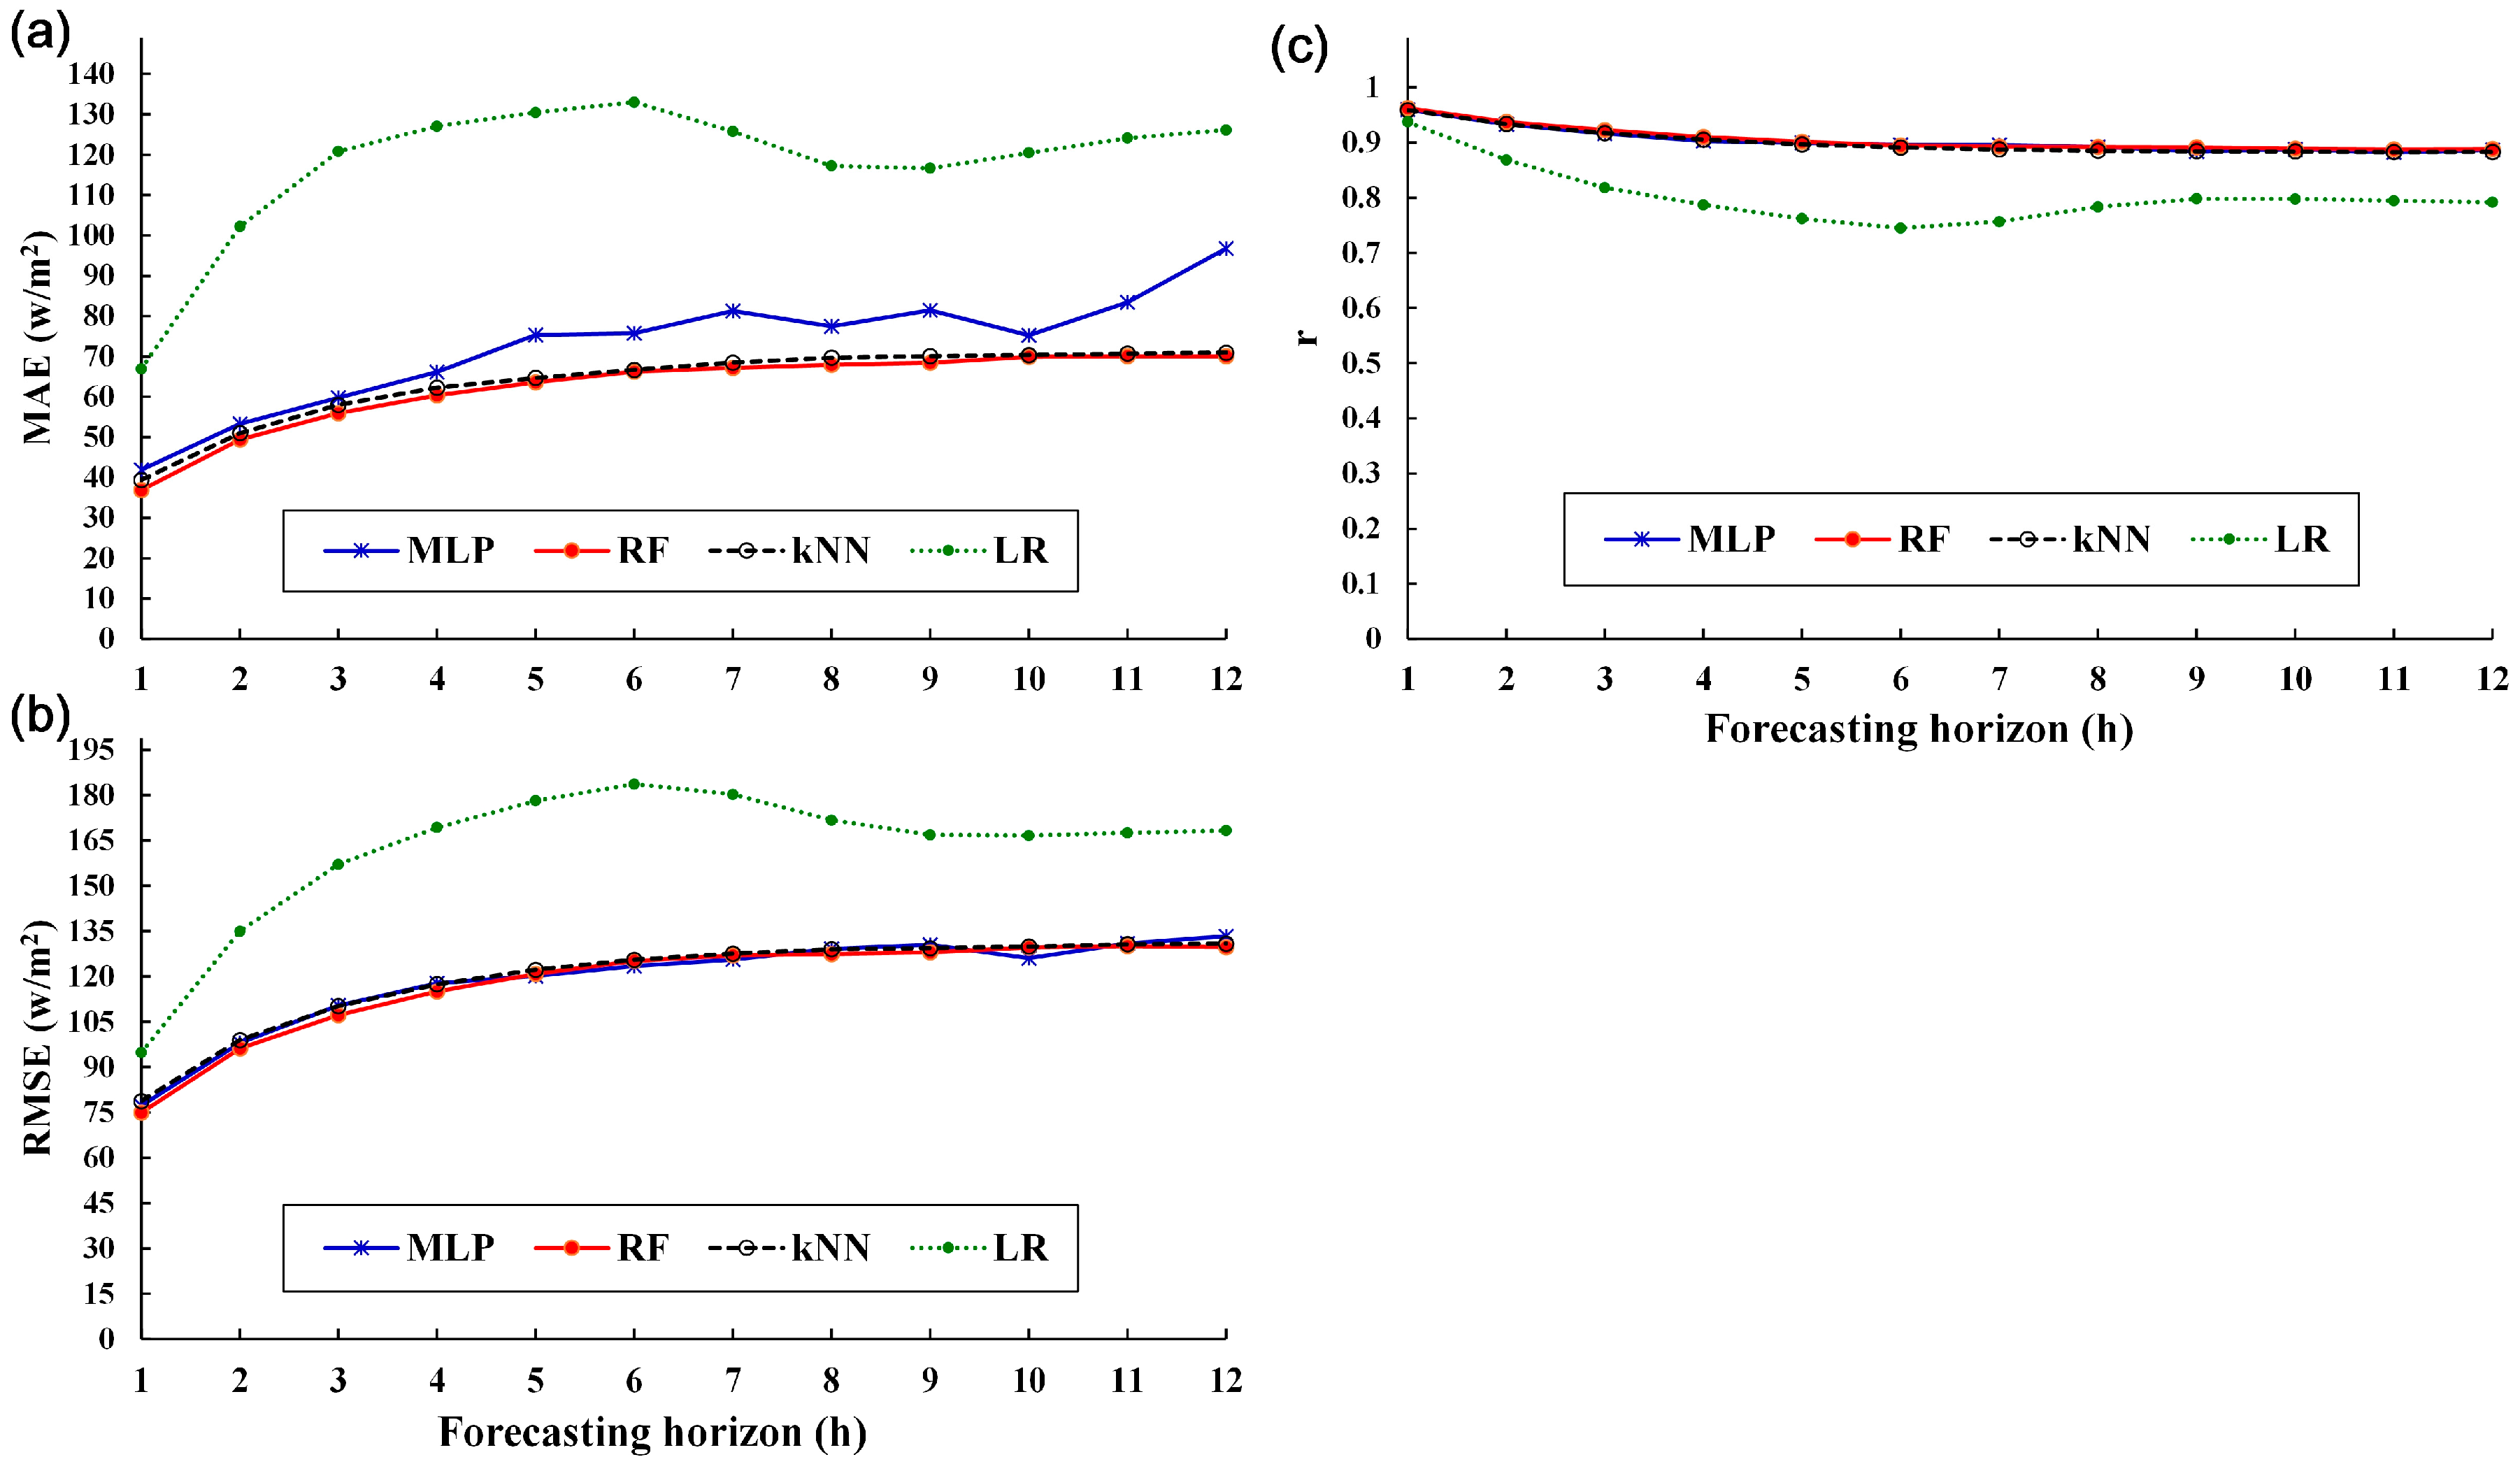
4.4.1. Prediction Results as Represented by MAE, RMSE, and r

Figure 7 presents the results of MAE (a), RMSE (b), and r (c) for all models with a forecast horizon from 1 to 12 h. The prediction error increased with the forecast horizon, suggesting that predicting solar irradiance accurately from existing weather data is difficult at longer forecast horizons. Furthermore, a comparison among the models indicated that (1) the MAE exhibited almost the same pattern of variation in RF and kNN, where it rose steadily as the forecast horizon lengthened; (2) the MAE was higher in MLP than in RF and kNN and increased substantially with the forecast horizon (therefore, MLP yielded the most unstable prediction results); and (3) LR delivered the poorest prediction performance and did not apply to this study because linear models cause considerable errors when predicting nonlinear problems.

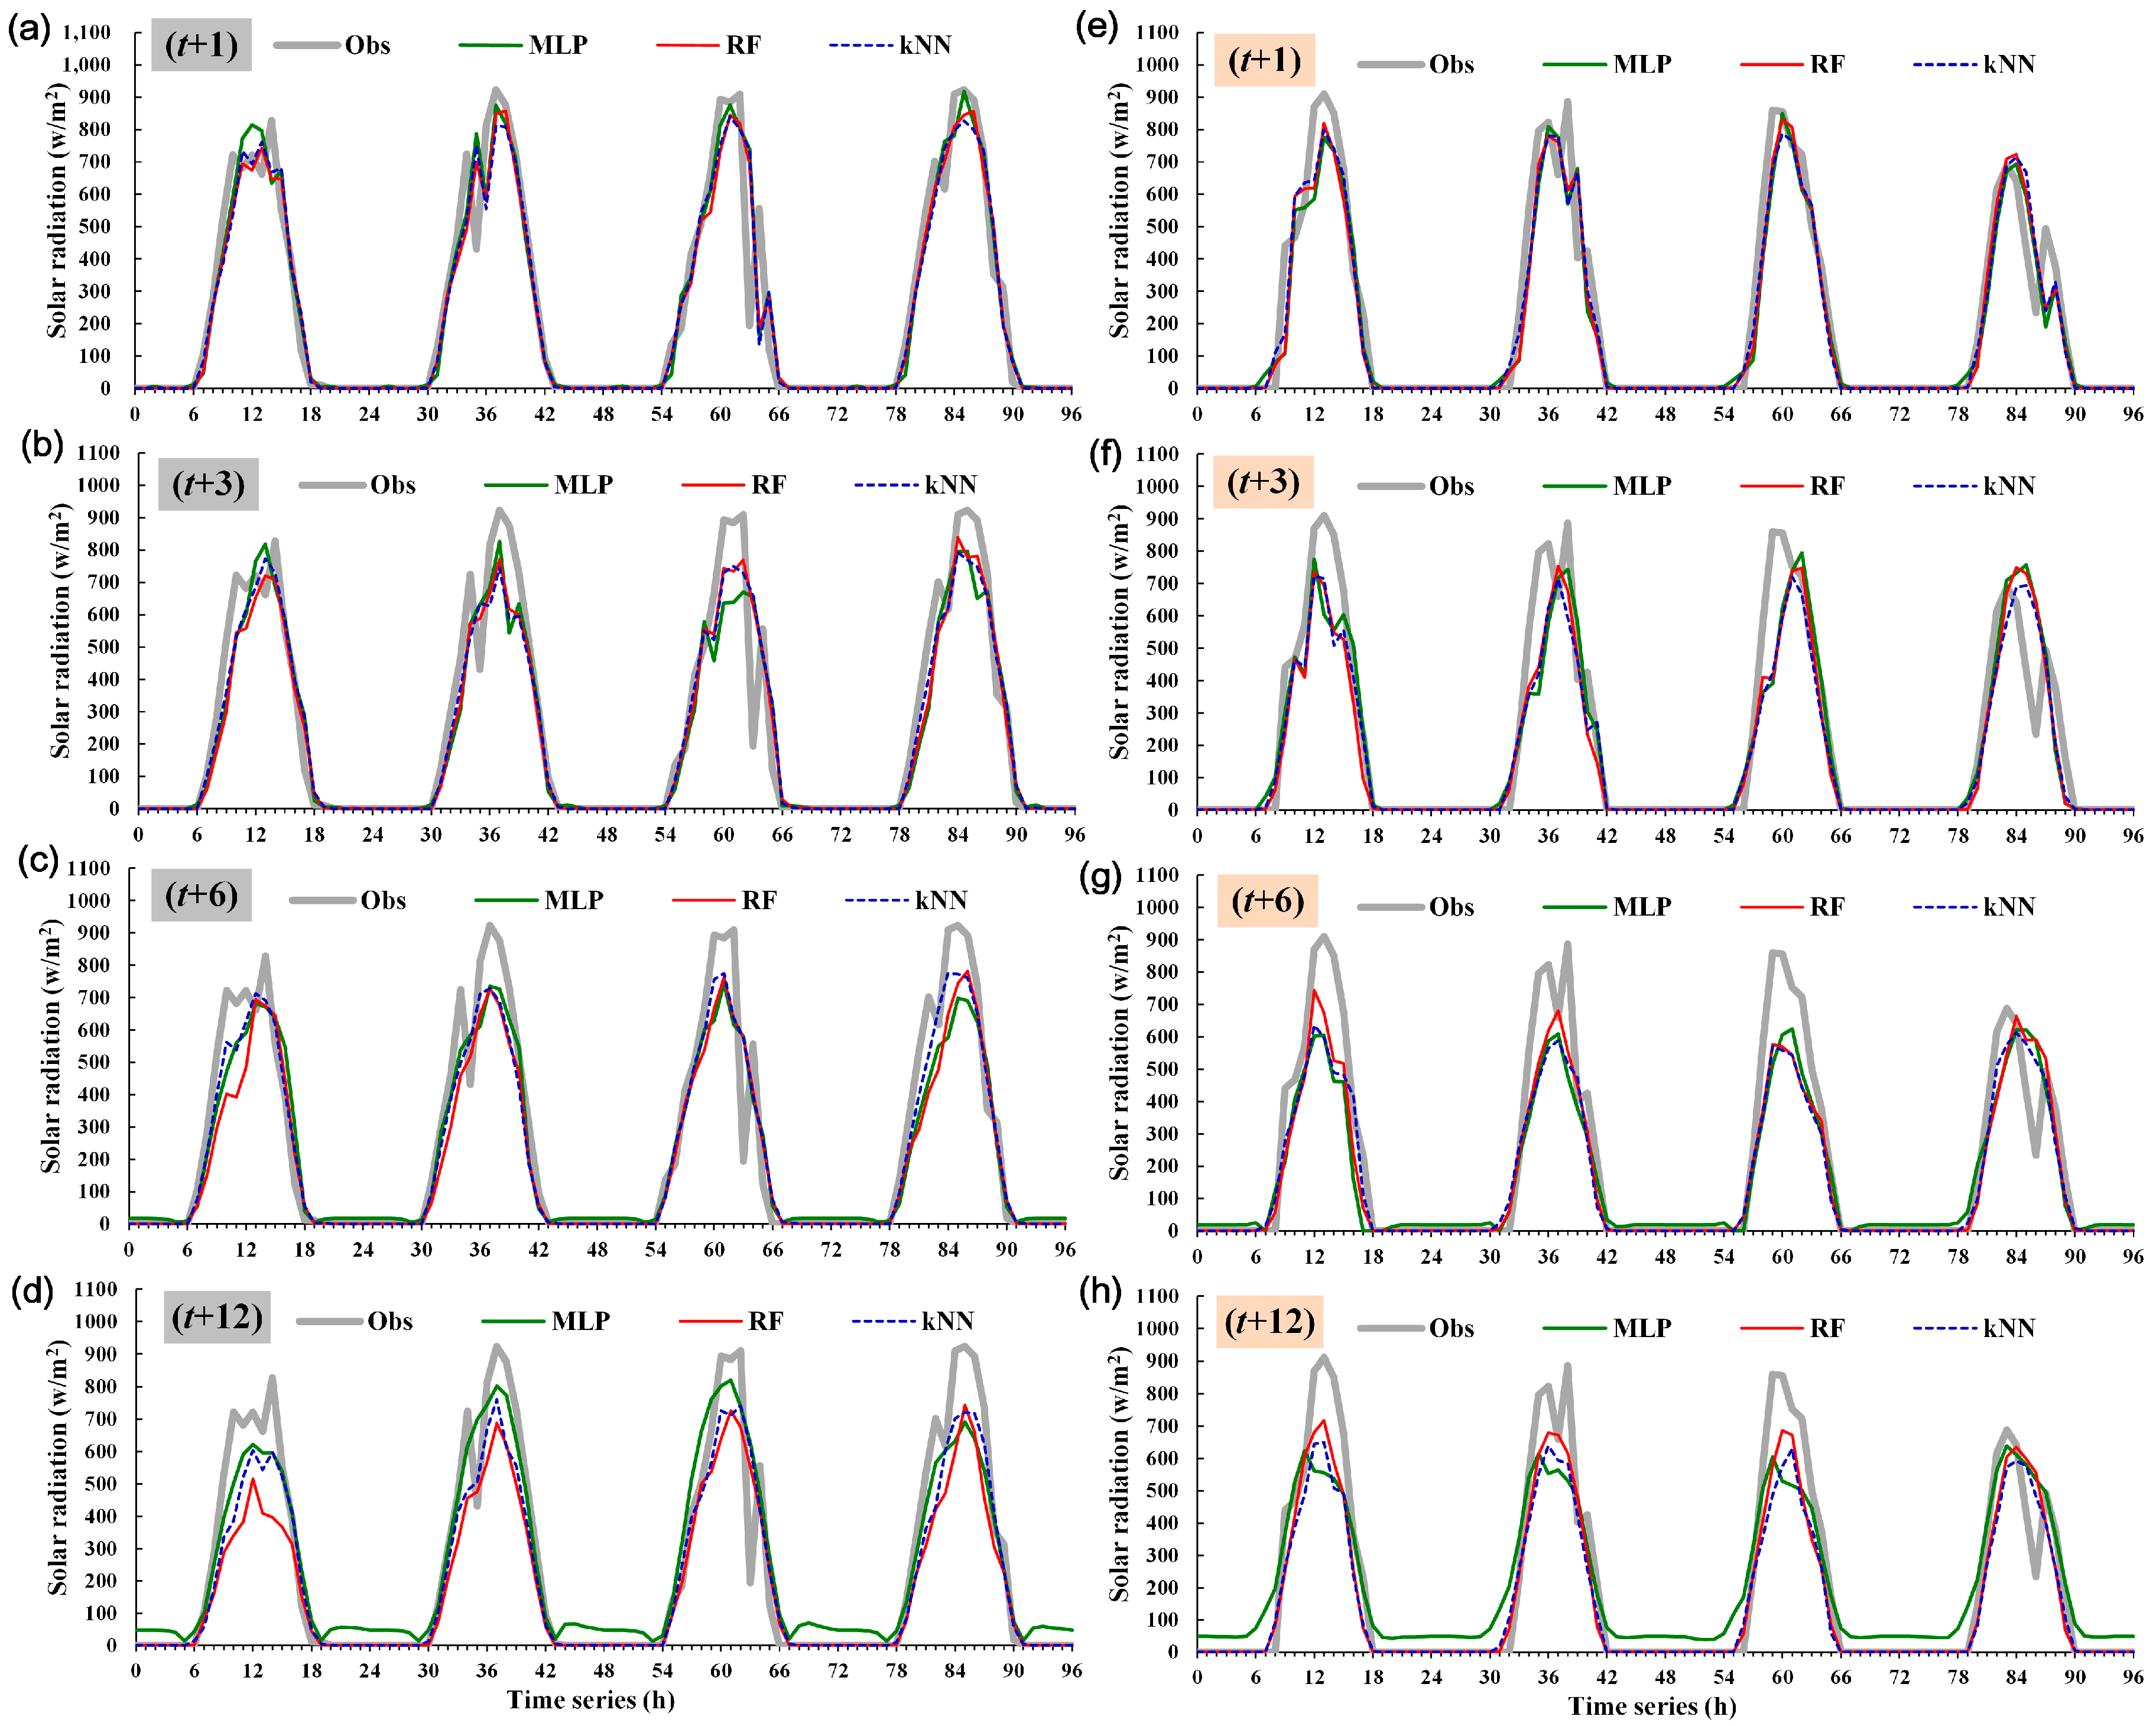
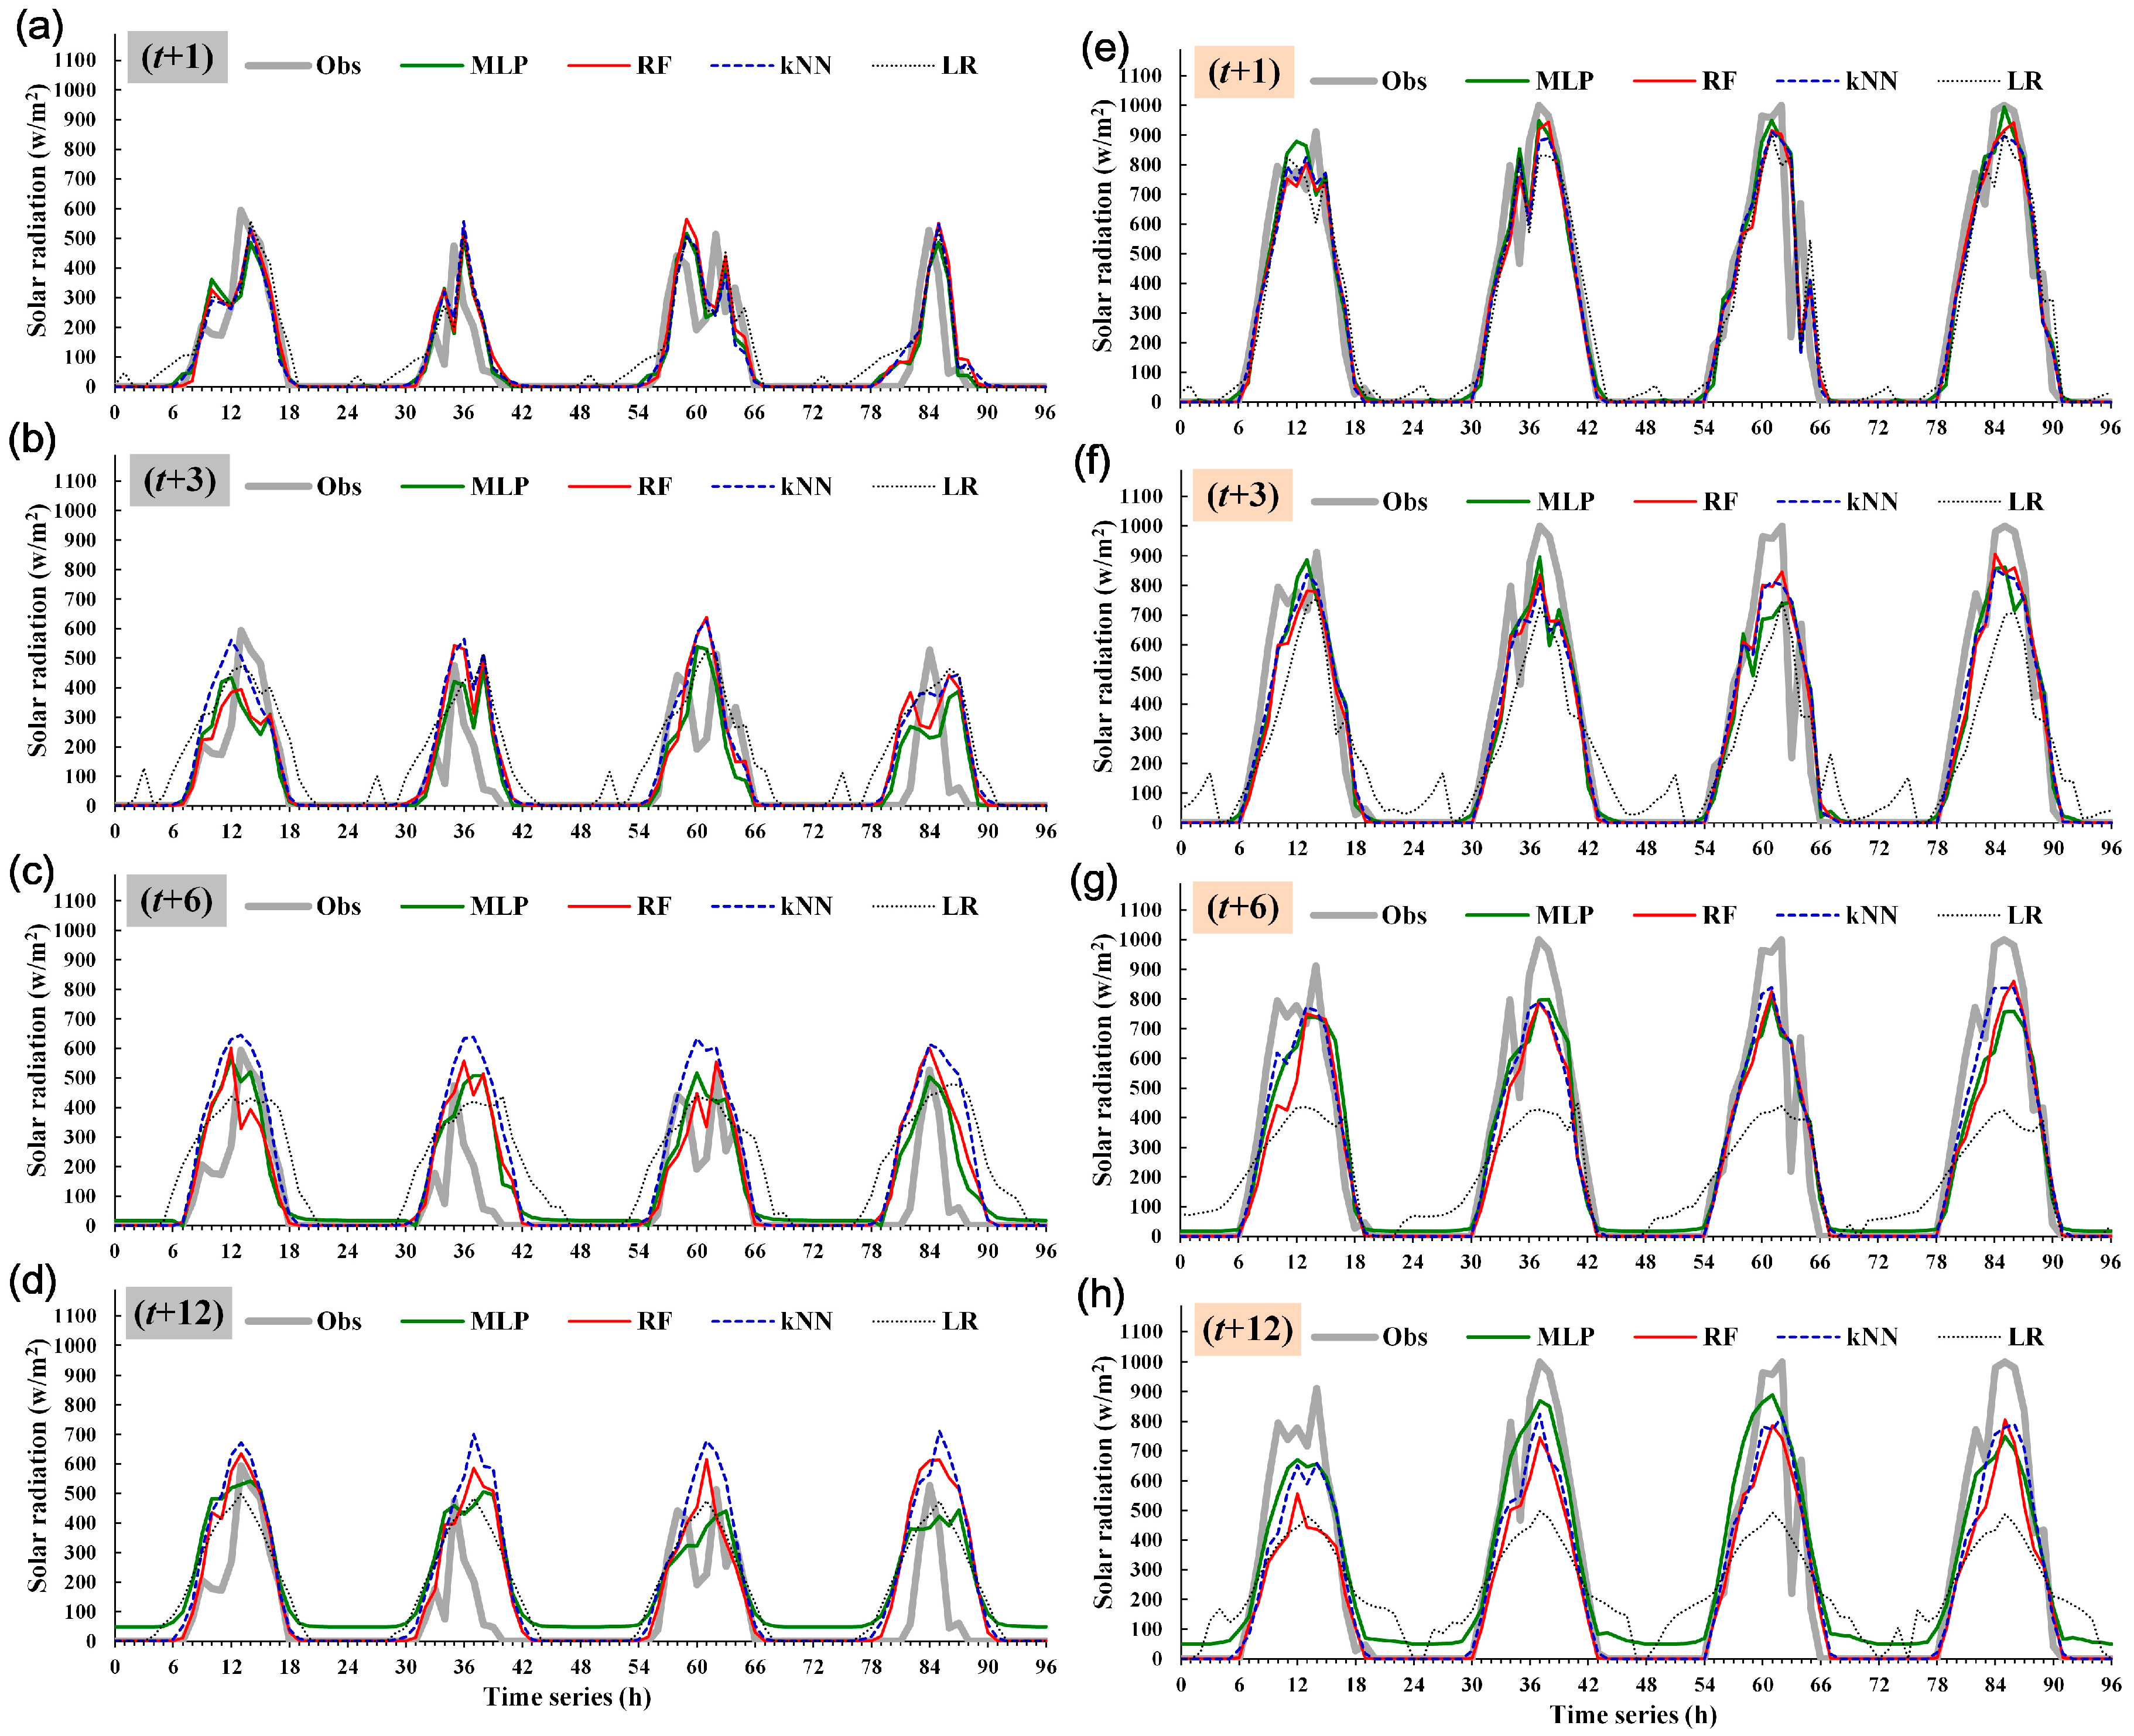
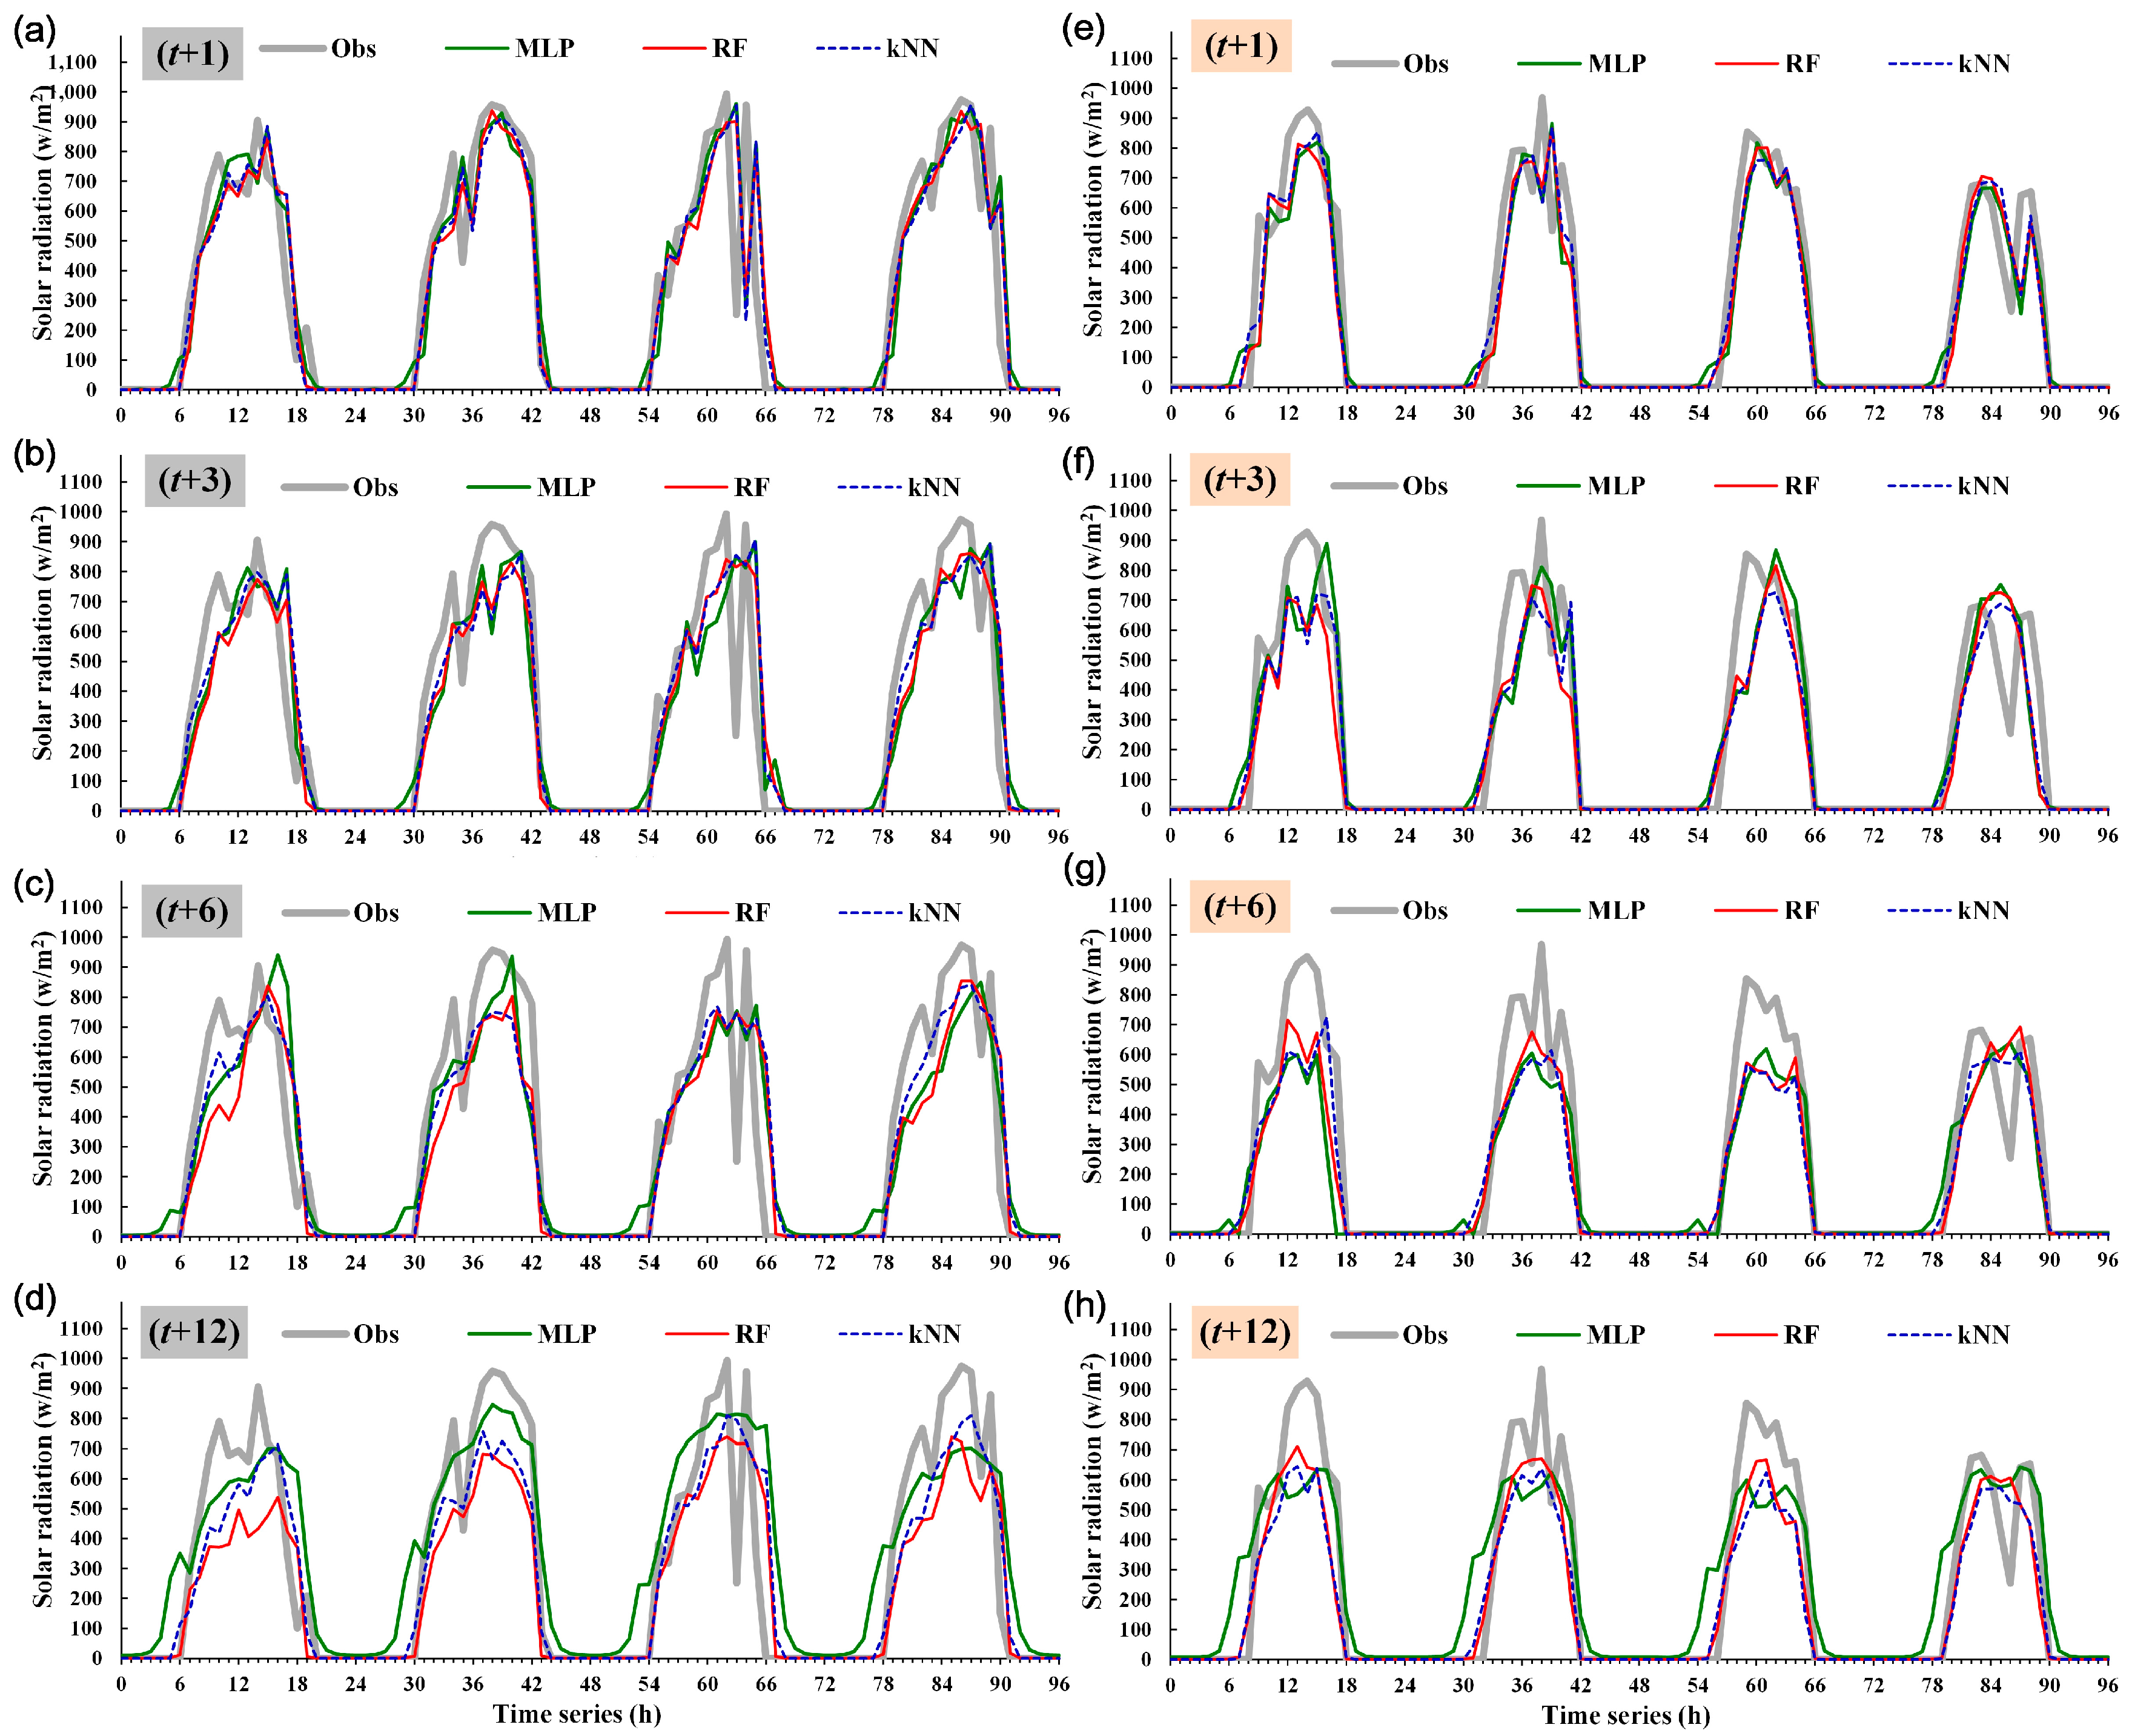
4.4.2. Predicted vs. Observed Changes in Solar Irradiance

As depicted in Figure 8 and Figure 9, the predicted and observed changes in solar irradiance were compared on an hourly basis on 20 March (the vernal equinox), 21 June (the summer solstice), 22 September (the autumnal equinox), and 21 December (the winter solstice) of 2016, as well as on the three consecutive days following each of the astronomical events. Each of the figures shows changes over t + 1, 3, 6, and 12 h. The figures indicate that predicted values were closer to observed ones when the forecast horizon was shorter. Since the figures indicate prediction errors only over a four-day period, the next subsection presents the prediction errors in all seasons over a 120-day period.

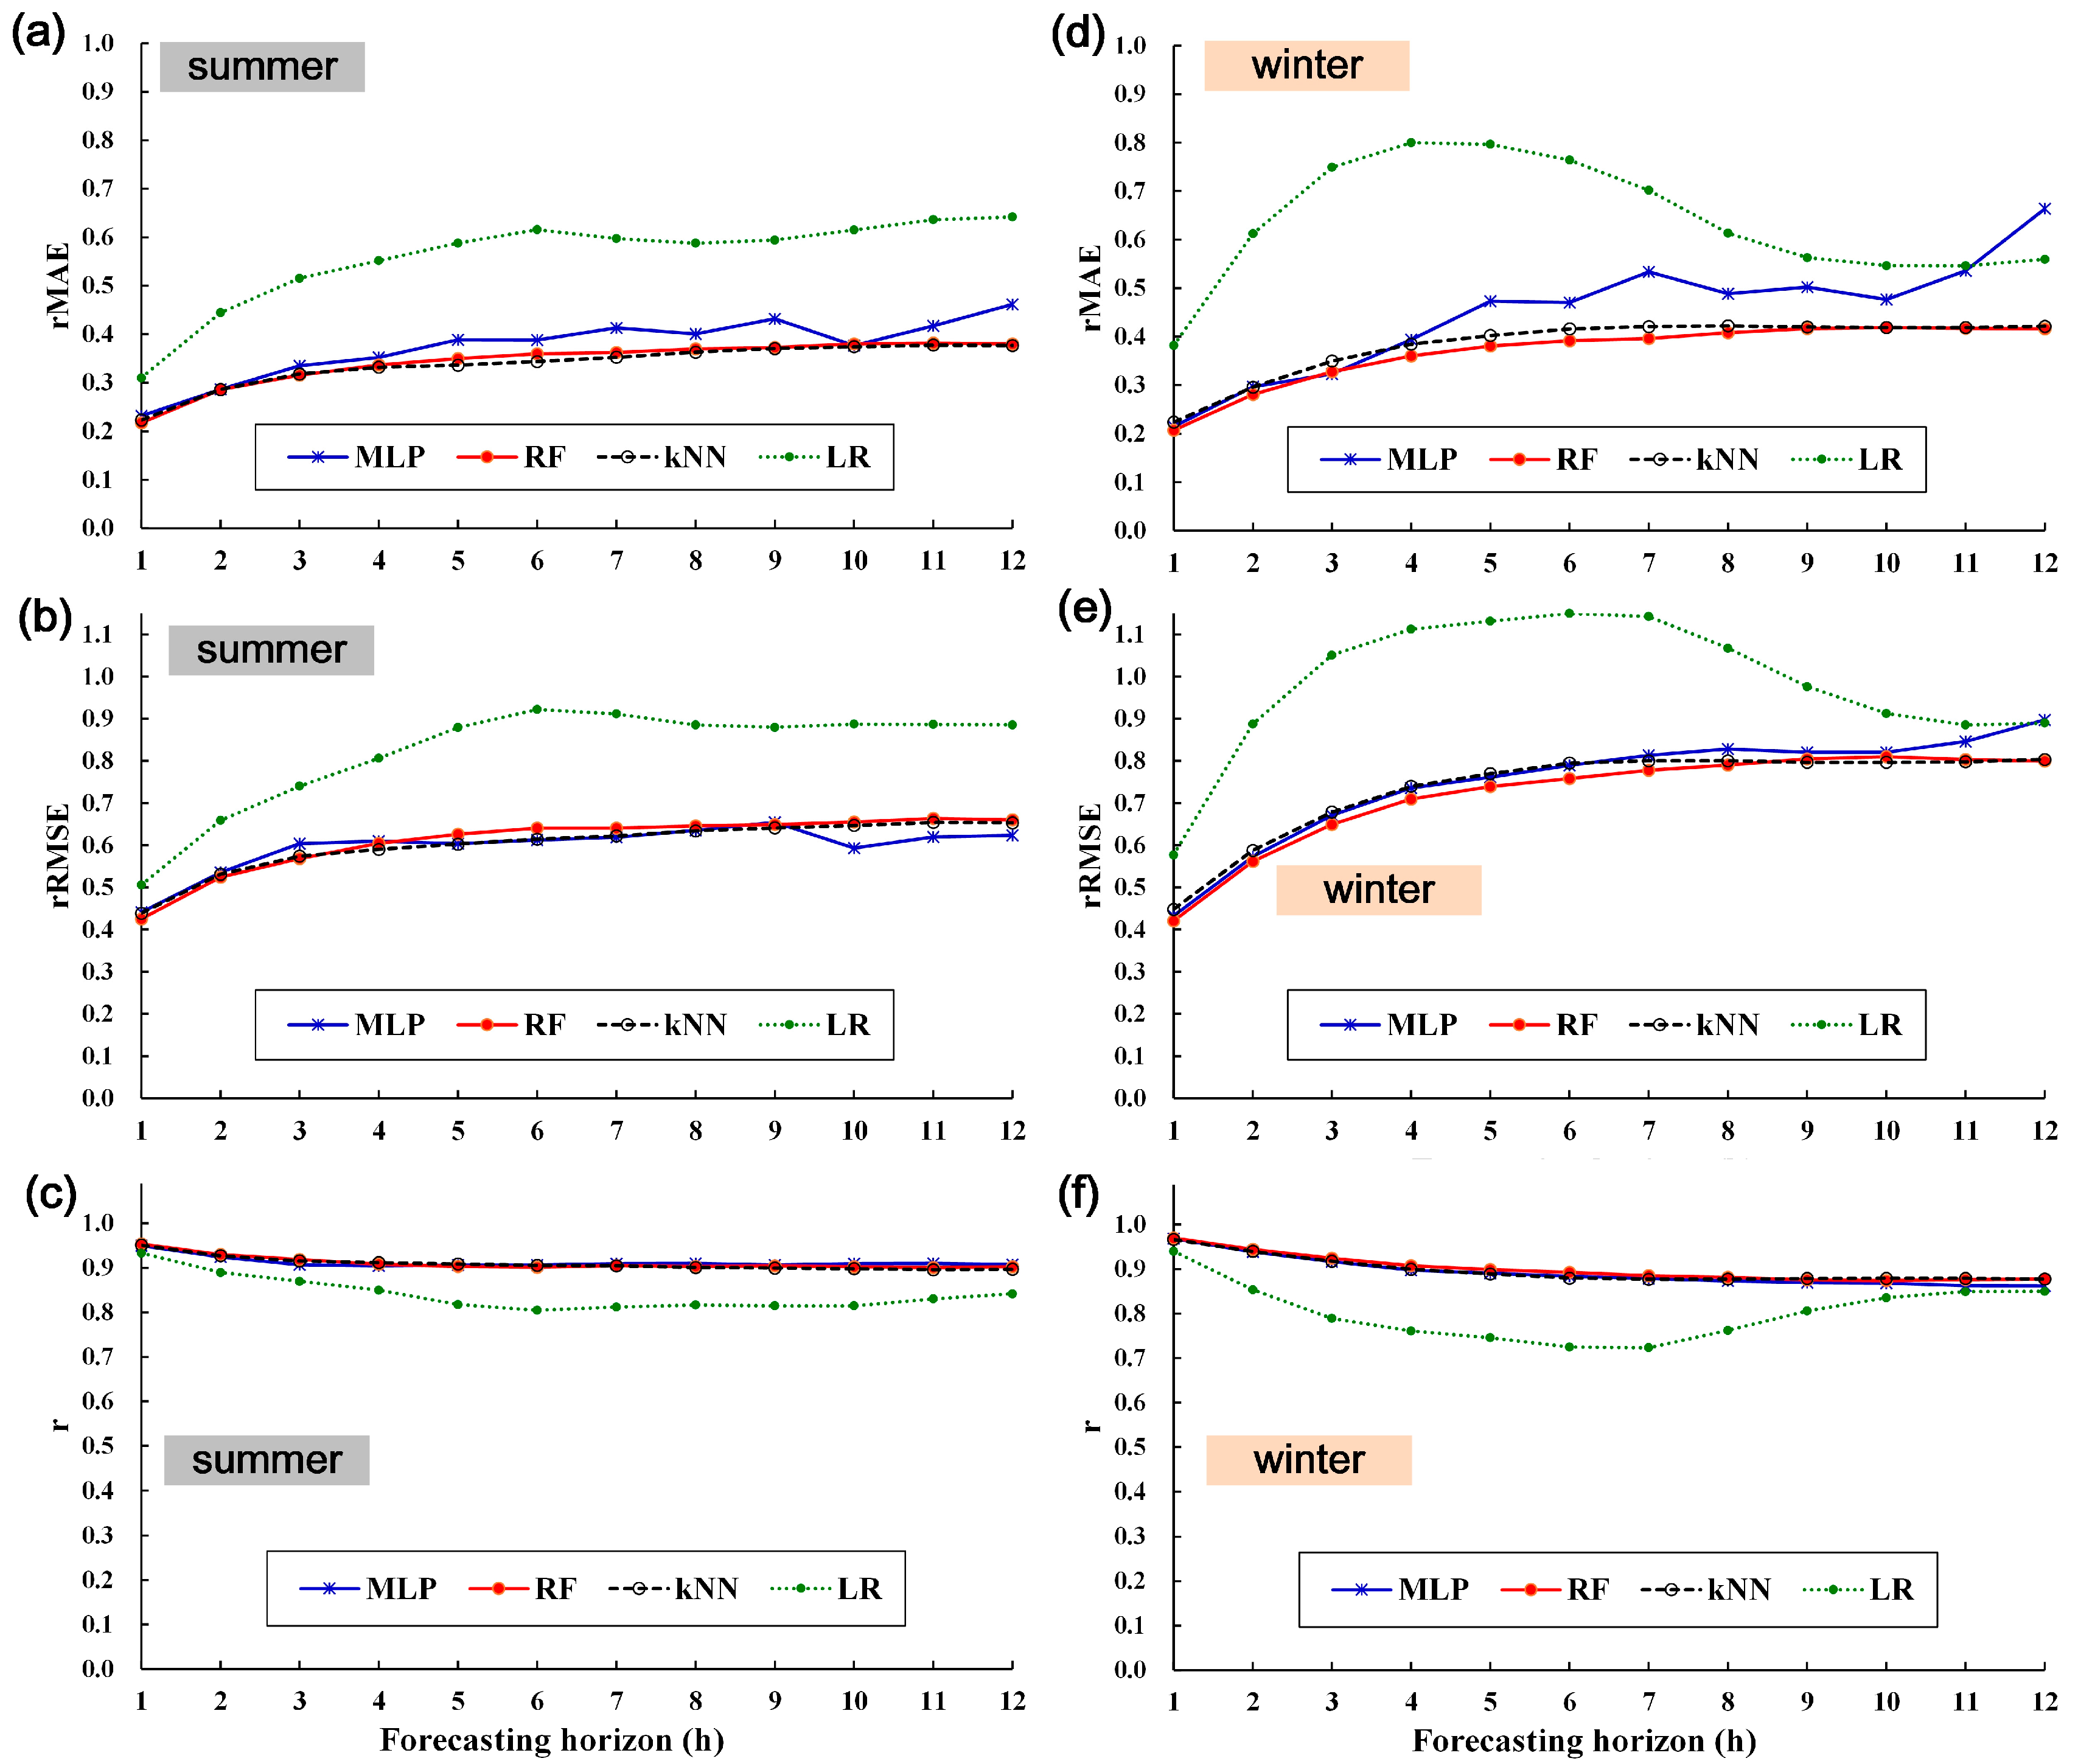
4.4.3. Prediction Errors across Seasons

To estimate the prediction errors across the seasons, the duration of the spring (March to May), summer (June to August), autumn (September to November), and winter (December to February) was first specified on the basis of the latitude of the study site. Next, because solar irradiance in different seasons varies depending on the solar position (generally, solar irradiance is higher in summer than in winter), the prediction errors across seasons were estimated in relative terms. Thus, the relative mean absolute error (rMAE) and the relative root- mean-square error (rRMSE) were proposed. Both measures are defined as follows:
rMAE = M A E / O ¯ obs
rRMSE = RMSE / O ¯ obs
where O ¯ obs is the mean of all observed values.
Table 4 tabulates prediction performance (as indicated respectively by MAE, rMAE, RMSE, rRMSE, and r) of all models within t + 1 across all seasons. Overall, slight differences were found in the MAE, rMAE, RMSE, rRMSE, and r among all the models across all seasons. The MAE and RMSE were the lowest in winter and the highest in summer. For example, the MAE and RMSE in RF were 28.5 w/m2 and 57.8 w/m2 in winter, 34.1 w/m2 and 70.8 w/m2 in autumn, 37.4 w/m2 and 73.8 w/m2 in spring, and 47.6 w/m2 and 93.1 w/m2 in summer. In the same model, the rMAE and rRMSE were the lowest in spring (0.198 and 0.391, respectively), relatively low in autumn (0.205 and 0.426) and winter (0.207 and 0.421), and highest in summer (0.217 and 0.426). Overall, the MAE and rMAE were the highest in summer, indicating changes in cloud thickness or in the atmosphere (e.g., the occurrence of typhoons or convective rains).
The prediction performance of the models within t + 6 across seasons was also evaluated (Table 4). Similarly, to the values within t + 1, the MAE and RMSE within t + 6 were the lowest in winter and the highest in summer.
For example, in increasing order, the MAE and RMSE in RF were 53.8 w/m2 and 104.1 w/m2 in winter, 63.7 w/m2 and 123.7 w/m2 in autumn, 68.5 w/m2 and 129.7 w/m2 in spring, and 78.7 w/m2 and 140.1 w/m2 in summer. Furthermore, the rMAE and rRMSE within t + 6 were the lowest in summer and the highest in winter. In RF, they were 0.360 and 0.640 respectively in summer; 0.363 and 0.687 in spring; 0.384 and 0.745 in autumn; and 0.392 and 0.758 in winter. Overall, the respective values of the MAE and RMSE within t + 1 were ranked in the same order across seasons as those within t + 6 (that is, they peaked in summer, became lower in spring and autumn, and reached their lowest in winter). However, the respective values of the rMAE and rRMSE within t + 1 (peaked in summer, became lower in winter and autumn, and reached their lowest in spring) were ranked in a different order across seasons than those within t + 6 (peaked in winter, became lower in autumn and spring, and reached their lowest in summer).
Accordingly, when the forecast horizon lengthened, the rMAE and rRMSE were the lowest in summer. The MAE and RMSE values increased rapidly within t + 6 across seasons, compared with those within t + 1. Notably, the MAE and RMSE were high within t + 1 in summer but increased only slightly within t + 6; therefore, in the latter time span, they were the lowest in the season. Changes in the rMAE, rRMSE, and r in all models over a 12-h forecast horizon were also charted (Figure 10).

5. Deriving Equations for Solar Irradiance Received by a Tilted Solar Panel

The term “solar irradiance” used in the previous section refers specifically to global horizontal irradiance. Weather data acquired from the CWB included data on global horizontal irradiance, but not on the solar azimuth angle and the solar irradiance on the tilted surface. In this paper, the solar irradiance received by a tilted solar panel was estimated using theoretical equations, which are introduced later, followed by an illustration of how the global irradiance received by a tilted solar panel was estimated.

5.1. Estimating Theoretical Clear-Sky Solar Irradiance

5.1.1. Theoretical Values of GC, IC, and DC

Estimating the global horizontal irradiance received by solar panels necessitates calculating clear-sky global horizontal irradiance (GC). Solar irradiance is higher outside the atmosphere, because within the atmosphere radiation is diffused by clouds, water vapor, and particulate matter. GC is the sum of clear-sky direct irradiance (IC·cosθ) and diffuse horizontal irradiance (DC) [28]. The respective equations for GC, IC, and DC are as follows:
G C = p s = 0 6 Q s y 2 s
I C = p s = 0 6 R s y 2 s
D C = G C I C cos θ
p = 1 0.0335 sin ( 360 ( n d 94 ) 365 )
where y = θ/90°, p is a parameter and Qs and Rs are constant coefficients (that are Q0 = 1.105, Q1 = −1.435, Q2 = −1.072, Q3 = 6.685, Q4 = −13.899, Q5 = 13.080, Q6 = −4.463, R0 = 0.986, R1 = −0.200, R2 = −1.188, R3 = 3.371, R4 = −5.767, R5 = 3.721, and R6 = −0.922).

5.1.2. Solar Incident Angle (Θ) and Global Irradiance with Tilted Solar Panels (Gtilt)

In this study, the solar panels were oriented due south, where they could absorb the longest daily duration of effective sunlight. During the calculation of the longest daily duration of sunlight effectively received, the solar incident angle (Θ, defined in this paper as the angle between the sun and the normal line of the solar panels) with the solar panels at a tilted position was estimated. For this estimation, Θ was defined using the latitude of the panels (λ), the declination angle (δ), and the hour angle (ω), as follows:
Θ = cos 1 ( cos ( β λ ) cos δ cos ω sin ( β λ ) sin δ )
where β is the tilt angle between the solar panel and the horizontal surface.
On the basis of the Equation (22), the theoretical hourly global irradiance with the solar panels at a tilted position (Gtilt) was estimated by:
G t i l t = D C + I C cos Θ

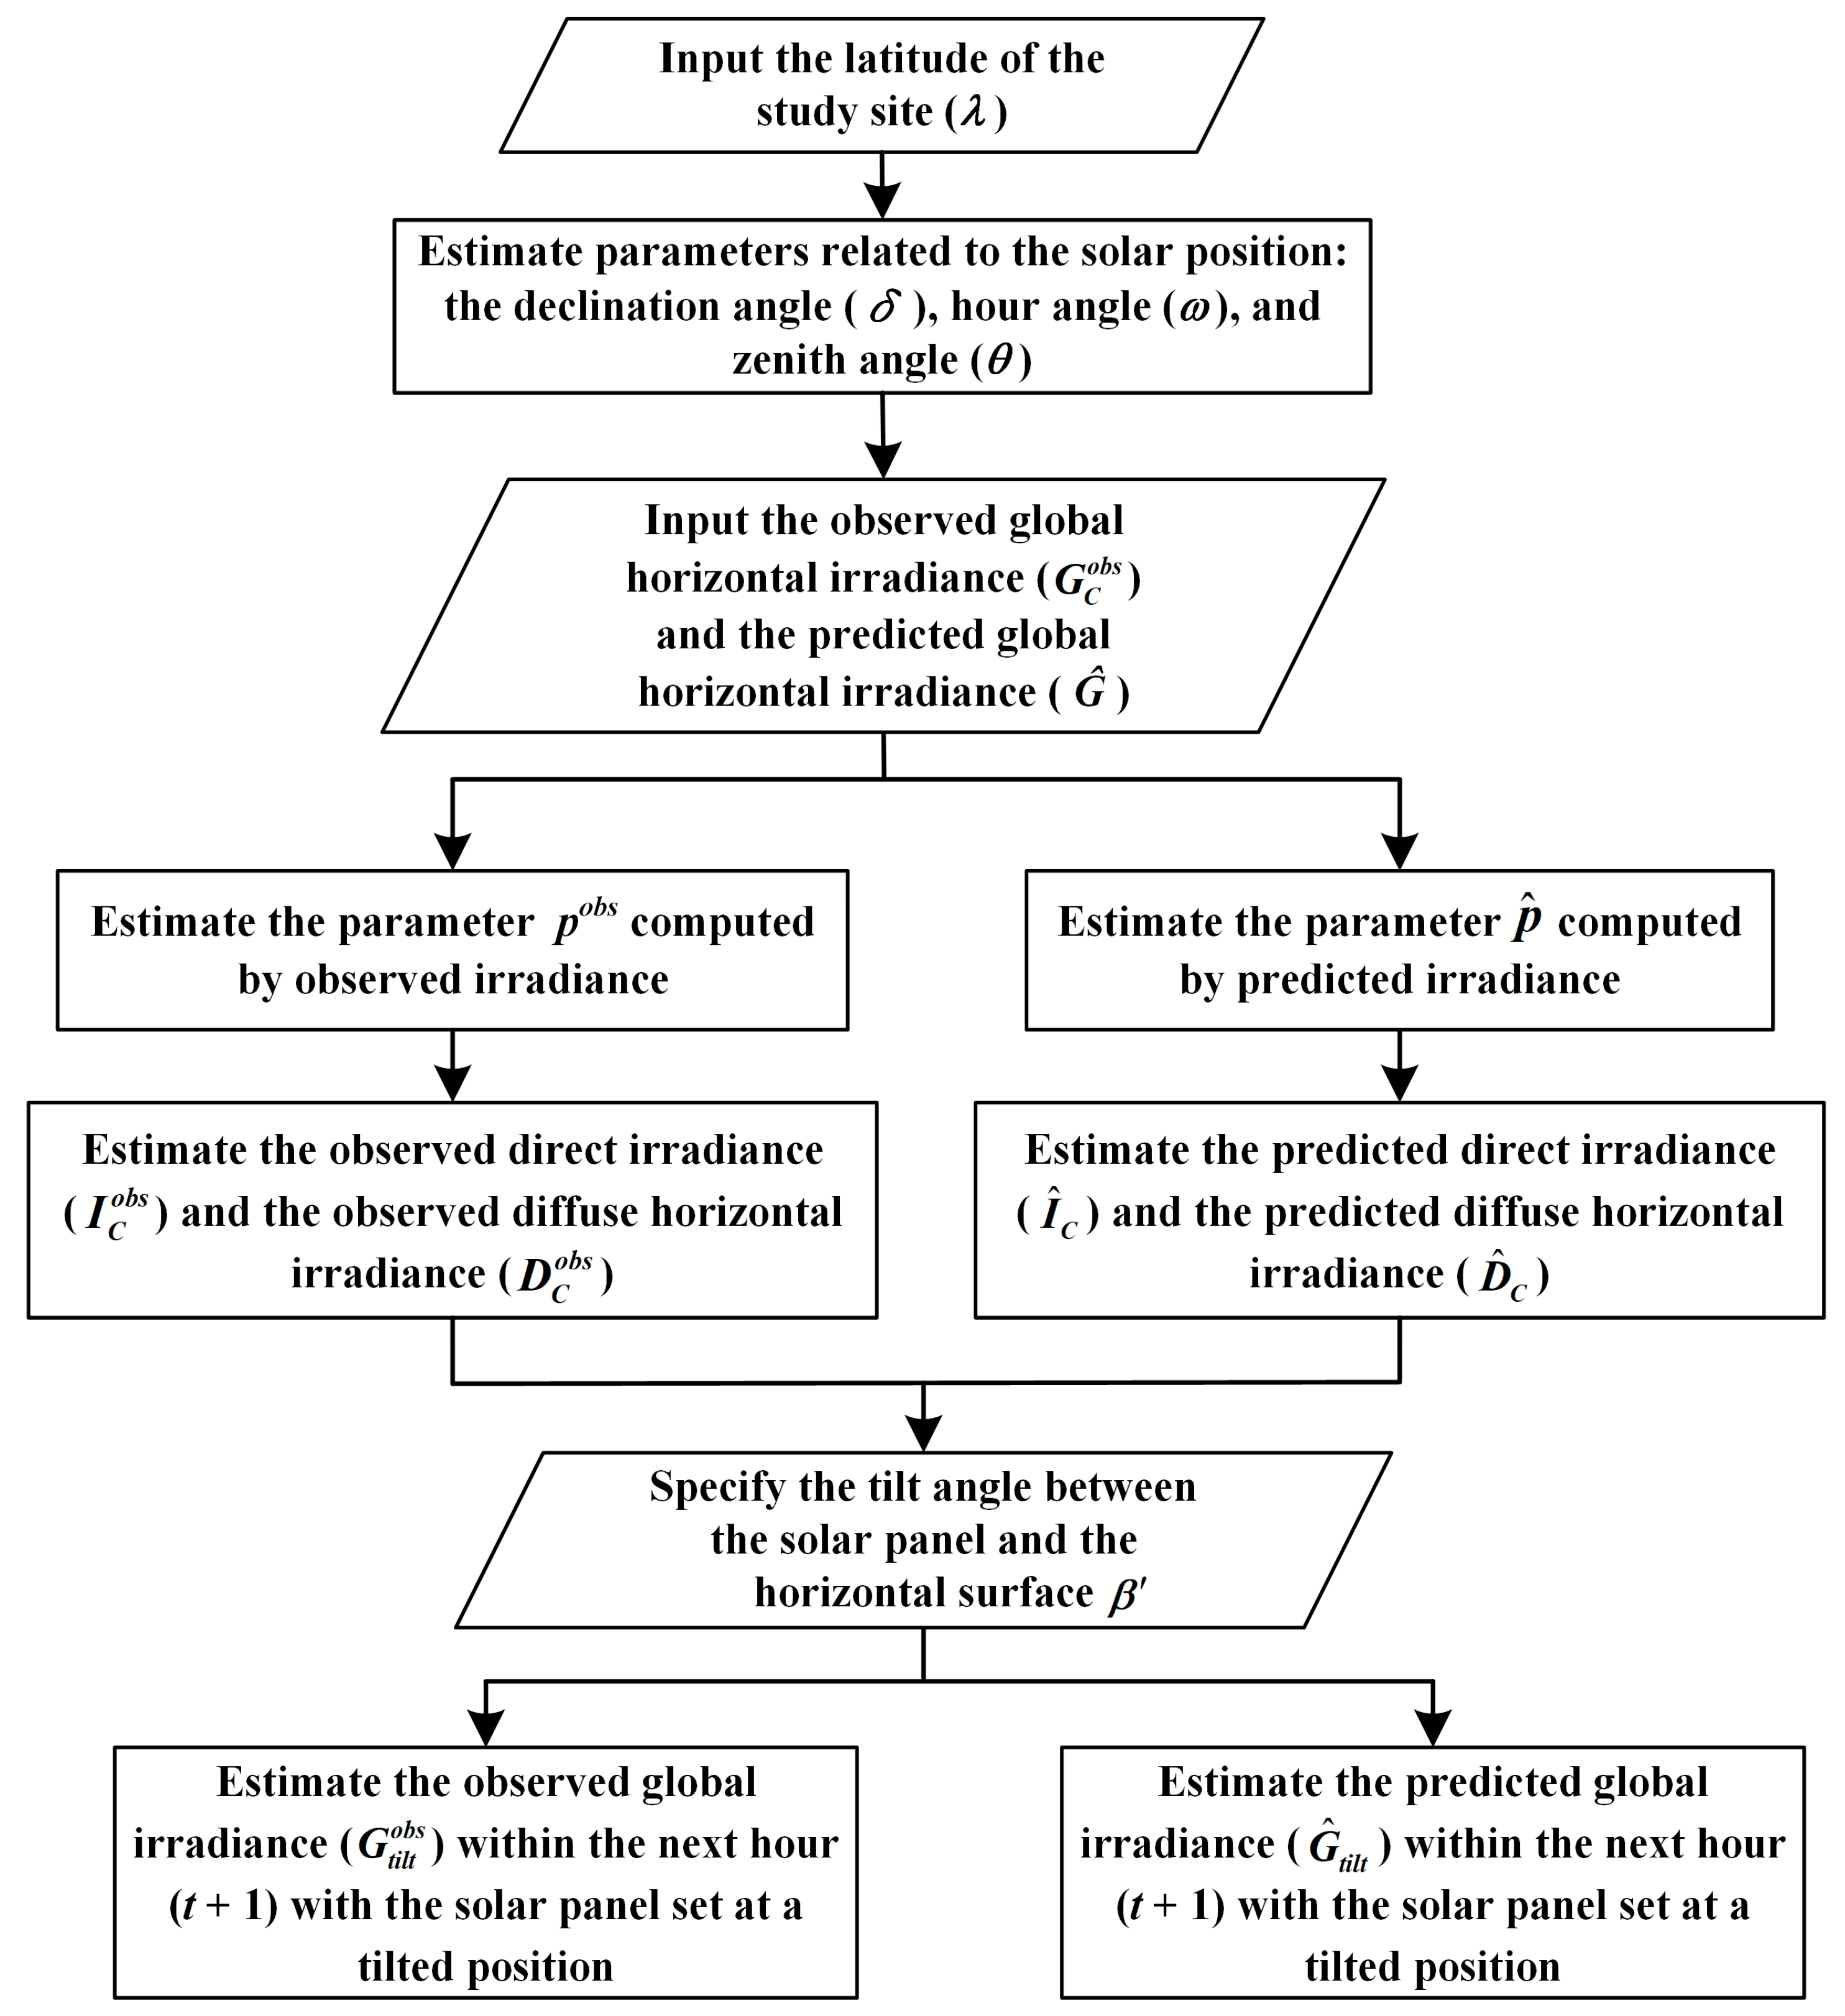
5.2. Estimating Observed and Predicted Solar Irradiance with Tilted Solar Panels

The equations provided in the previous subsection were used to calculate the observed and predicted solar irradiance with the solar panels set at a tilted position. Figure 3 depicts the steps involved in the calculation, including (1) estimating parameters related to the solar position (the declination angle, the hour angle, and the zenith angle), (2) estimating both observed and predicted direct irradiance and diffuse horizontal irradiance, and (3) estimating the observed global irradiance and the predicted global irradiance with the solar panels set at a tilted position. Section 2.3 details the estimation of parameters related to the solar position. Solar irradiance data provided by the CWB (or obtained through ground weather equipment) were used to determine the observed global horizontal irradiance ( G C o b s ). The predicted global horizontal irradiance ( G ^ C ) was estimated using the values predicted by all the machine learning models described in Section 3. The estimation of other parameters in Figure 11 was performed as follows:

5.2.1. Estimating the Observed and Predicted Direct Irradiance and Diffuse Horizontal Irradiance

First, Equation (18) can be used to estimate the parameter pobs computed by observed irradiance G C o b s   and the parameter p ^ computed by predicted irradiance G ^ C , both of which are expressed by:
p o b s = G C o b s s = 0 6 Q s y 2 s
p ^ = G ^ C s = 0 6 Q s y 2 s
Next, Equations (19) and (20) were used to calculate the observed direct irradiance ( I C o b s ) and the observed diffuse horizontal irradiance ( D C o b s ), which are expressed by:
I C o b s = p o b s s = 0 6 R s y 2 s
D C o b s = G C o b s I C o b s cos θ
Both equations were also used to estimate the predicted direct irradiance ( I ^ C ) and the predicted diffuse horizontal irradiance ( D ^ C ), which are expressed by:
I ^ C = p ^ s = 0 6 R s y 2 s
D ^ C = G ^ C I ^ C cos θ

5.2.2. Estimating the Observed and Predicted Global Irradiance with the Solar Panels Set at a Tilted Position

Equation (23) was used to estimate the observed ( G t i l t o b s ) and predicted ( G ^ t i l t ) values of hourly global irradiance with the solar panels set at a tilted position, both of which are expressed by:
G t i l t o b s = D C o b s + I C o b s cos Θ
G ^ t i l t = D ^ C + I ^ C cos Θ

6. Estimating Solar Irradiance with the Solar Panels Set at a Tilted Position

In this section, the solar irradiance was calculated using the equations introduced in the previous section. The results are detailed as follows.

6.1. Estimating the Observed and Predicted Values of Global Horizontal Irradiance and Diffuse Horizontal Irradiance

The observed and predicted values of global horizontal irradiance and diffuse horizontal irradiance were estimated in accordance with Figure 10.
First, the latitude of Yungkang Weather Station (the study site) was input. Second, parameters related to the solar position (the declination angle, hour angle, and zenith angle; see Section 2.3) were estimated. Third, the observed direct irradiance ( I C o b s ) and the observed diffuse horizontal irradiance ( D C o b s ) were estimated on the basis of the observed global horizontal irradiance ( G C o b s ). Fourth, the predicted direct irradiance ( I ^ C ) and the predicted diffuse horizontal irradiance ( D ^ C ) were estimated on the basis of the predicted global horizontal irradiance ( G ^ C ).Hourly changes in the predicted and observed values of both direct irradiance and diffuse horizontal irradiance for three consecutive days after the summer and winter solstices of 2016 (which arrived respectively on 21 June and 21 December) were respectively investigated. Figure 11 displays the observed versus predicted changes in the direct irradiance within t + 1, t + 3, t + 6, and t + 12 for 4 consecutive days starting from the summer and winter solstices.
Figure 12 presents observed values versus predicted changes in the diffuse horizontal irradiance within t + 1, t + 3, t + 6, and t + 12 for 4 consecutive days starting from the summer and winter solstices. The results indicated that the predicted direct irradiance approximated the observed direct irradiance within short forecast horizons but the difference between the two values gradually increased as the forecast horizon lengthened. Moreover, the differences between predicted and observed diffuse horizontal irradiance were smaller than those between predicted and observed direct irradiance and became larger as the forecast horizon increased. In particular, the diffuse horizontal irradiance predicted by MLP within t + 6 (Figure 12c,g) differed markedly from within t + 1 and t + 3 (Figure 12a,b,e,f), when its corresponding observed level reached its nadir within the spans of 0–6 h, 20–30 h, and 44–54 h, and fluctuated within t + 12 (Figure 12d,h).

6.2. Estimating the Observed and Predicted Global Irradiance with Solar Panels set at Different Tilt Angles

The observed ( G t i l t o b s ) and predicted ( G ^ t i l t ) values of global irradiance with solar panels set at different tilt angles were estimated on the basis of the observed and predicted values of direct irradiance and diffuse horizontal irradiance as determined in the previous subsection. The tilt angle of the solar panels (β′) was used as a variadic parameter. Therefore, two different tilt angles of the panels were specified as follows: 23° (which was identical to the latitude of Yungkang Weather Station) and 33°. The observed ( G t i l t o b s ) and predicted ( G ^ t i l t ) values of global irradiance at both tilt angles were estimated and compared.
Figure 13 illustrates hourly changes in the observed ( G t i l t o b s ) and predicted ( G ^ t i l t ) global irradiance with a β′ of 23° for the 4 consecutive days starting from the summer and winter solstices. Figure 14 depicts hourly changes in observed ( G t i l t o b s ) and predicted ( G ^ t i l t ) global irradiance for the 4 consecutive days with a β′ of 33° starting from the summer and winter solstices. The results demonstrated that the predicted global irradiance with the tilted solar panels approximated its corresponding observed value at short forecast horizons, and both differed nonsignificantly even at long forecast horizons. Notably, the global irradiance was higher with a β′ of 23° than at a β′ of 33° on the day of the summer solstice and in the following 3 days, but the result was the opposite on the day of the winter solstice and the following 3 days. The calculation of the total solar irradiance in relation to different tilt angles of the solar panels is discussed in the upcoming subsection.

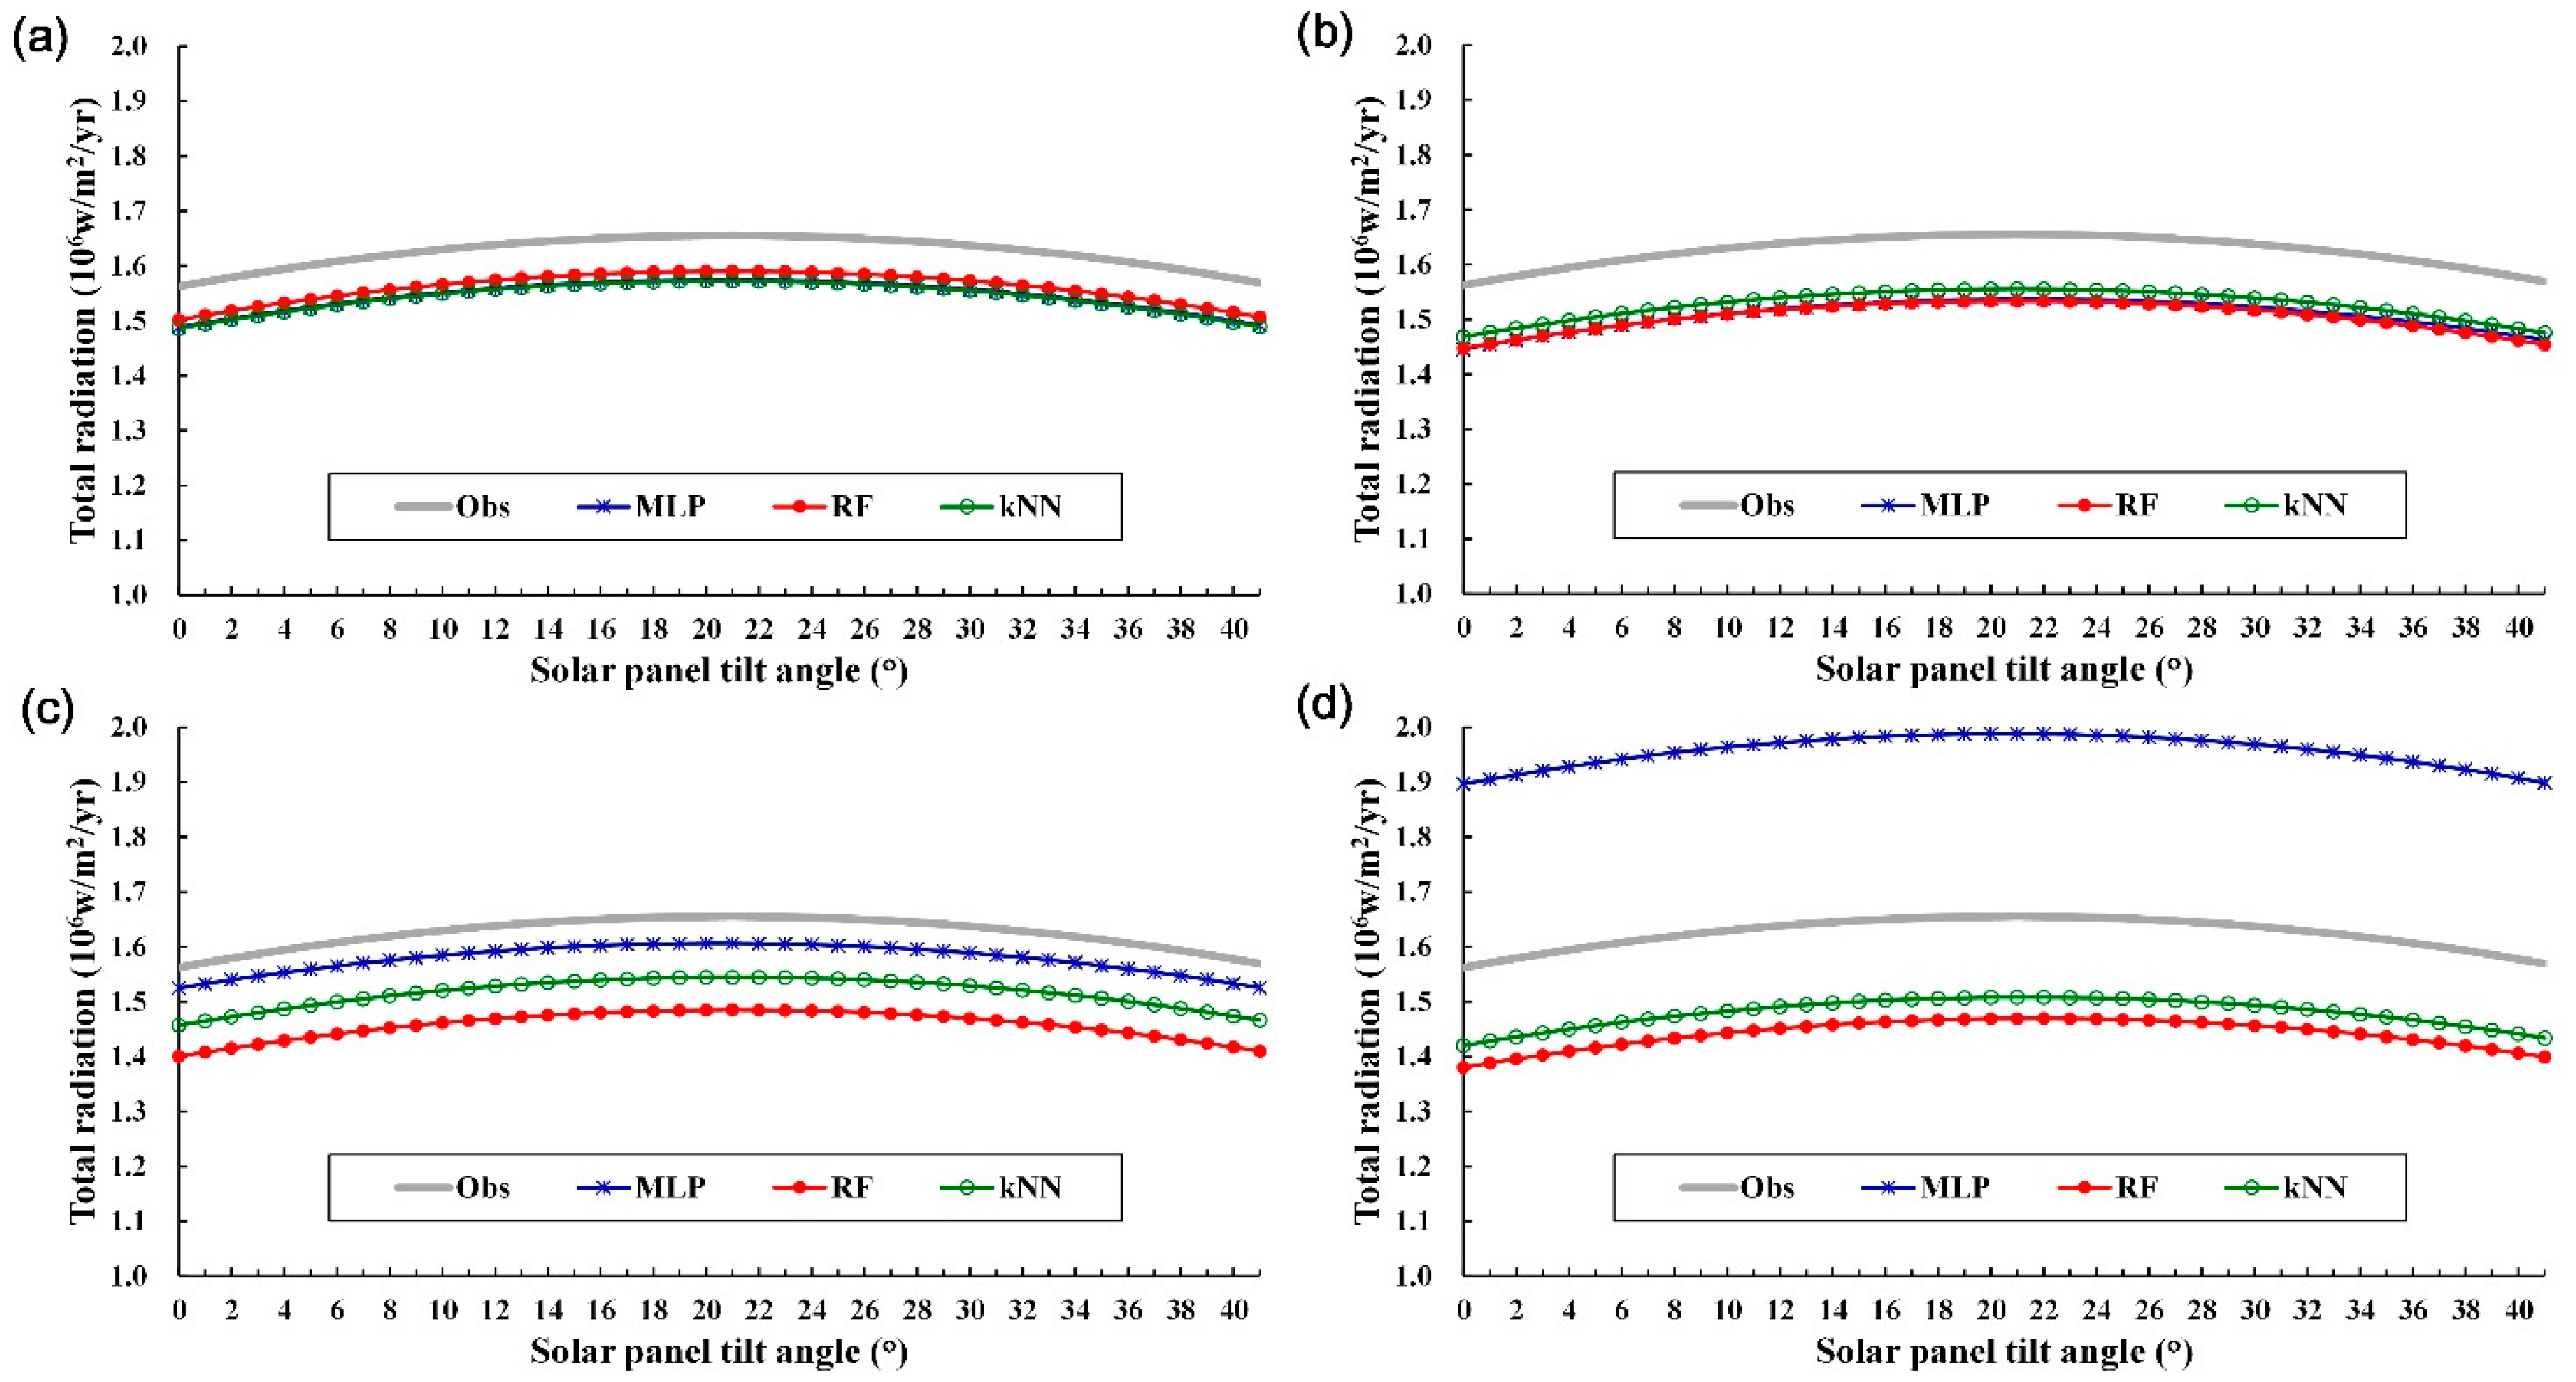
6.3. Total Annual Global Irradiance in Relation to Different Solar-Panel Tilt Angles

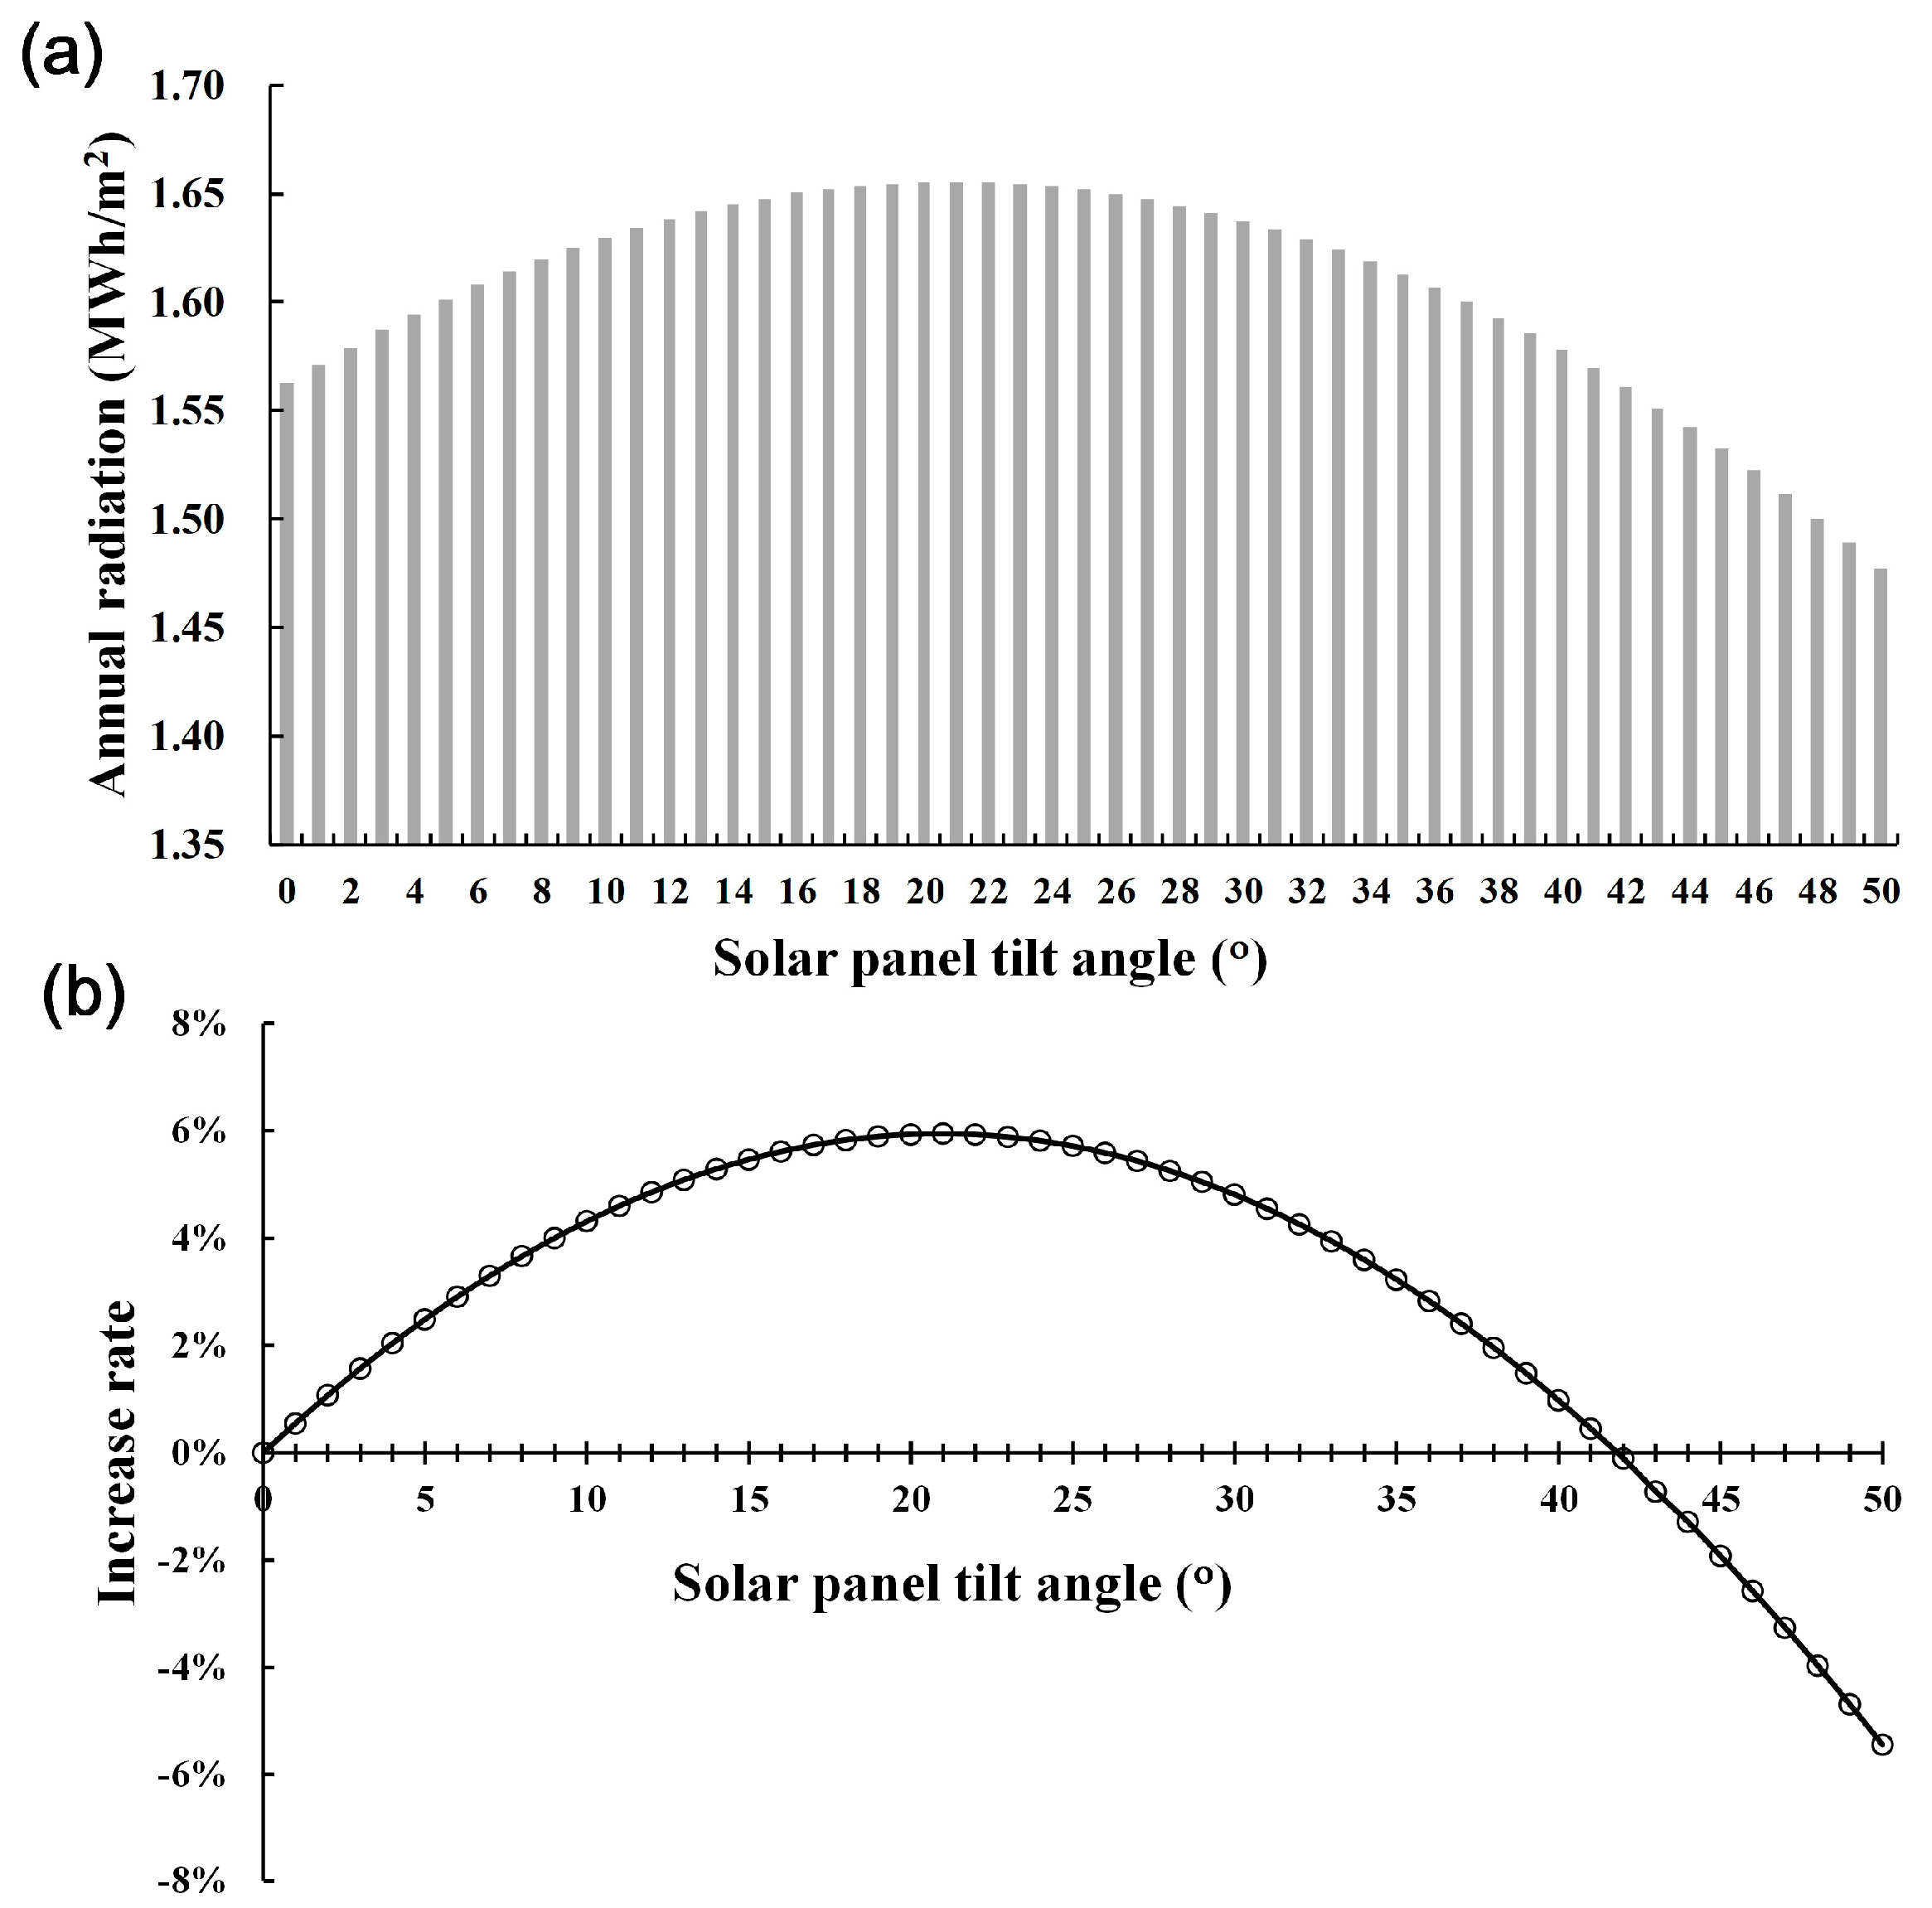
6.3.1. Total Annual Global Irradiance and Its Increase Rate

The total annual global irradiance with the solar panels at tilt angles (β′) from 0° to 50° was estimated. Figure 15a charts the changes in the total annual global irradiance in relation to the different solar-panel tilt angles. The annual irradiance is 1.562 MWh/m2 with a β′ of 0° (i.e., when the solar panels were placed in the non-tilted position) and peaked at 1.655 MWh/m2 with a β′ ranging from 20° to 22°. Moreover, the increase rate of the total annual global irradiance was calculated, with the total annual global irradiance observed at a β′ of 0° as the basic value. The increase rate is estimated as follows:
Increase   rate = G β o b s G β = 0 o b s G β = 0 o b s × 100 %
Figure 15b depicts the increase rate of the total annual global irradiance with a β′ of 0–50°. The results showed that the rate was 0% with a β′ of 0° but rose up to 5.93% with a β′ ranging from 20° to 22°. Notably, it declined gradually to approximate 0% when β′ increased further to 41° (where the rate was approximately 0.45%) and decreased to below 0% with a β′ of 42°. Accordingly, the optimal tilt angle for the solar panels in this study was 0–41°, and they received less sunlight when the tilt angle exceeded 42° than when it was placed in a nontilted position.

6.3.2. Total Annual Global Irradiance at Different Solar-panel Tilt Angles

Figure 16 shows changes in both the observed ( G t i l t o b s ) and predicted ( G ^ t i l t ) values of the total annual global irradiance with a β′ ranging from 0° to 41° within t + 1, t + 3, t + 6, and t + 12. Figure 17 presents changes in the relative error of the predicted total annual global irradiance at different solar-panel tilt angles within t + 1, t + 3, t + 6, and t + 12. The relative error is estimated as follows:
Relative   error = | G t i l t o b s G ^ t i l t | G t i l t o b s × 100 %
The results indicate, (1) the relative error predicted by RF within t + 1 was smaller than that by kNN and MLP; (2) the relative error predicted by kNN within t + 3 was smaller than that by RF and MLP; (3) the relative error predicted by MLP within t + 6 was smaller than that by RF and kNN; and (4) the relative error predicted by kNN within t + 12 was smaller than that by RF and MLP.

7. Conclusions

In this paper, forecasting models based on MLP, RF, kNN, and LR were proposed to estimate surface solar irradiance on an hourly basis and the amount of solar radiation received by solar panels at different tilt angles, thereby enhancing the capability of photovoltaic systems to predict the amount of electricity they generate and improving the reliability of their power supply. The study site was in Tainan in southern Taiwan. The models used ground weather data, satellite remote-sensing data, and solar position data with a forecast horizon of 1–12 h.
The performance of the forecasting models with the optimal dataset combination was also assessed, in relation to different seasons, forecast horizons, and the other dataset combinations. Equations were derived to estimate the solar irradiance received by the solar panels at different tilt angles, and the tilt angles at which the device received ample sunlight were also determined. Some conclusions were drawn from the findings.
First, regarding the performance of forecasting models of surface solar radiation at a 1–12 h forecast horizon, RF and kNN were slightly comparable in the MAE, and their MAE increased steadily as the forecast horizon lengthened. The MAE in MLP was higher than that in RF and kNN and rose considerably as the forecast horizon increased. Consequently, the overall performance of MLP fluctuated. LR exhibited the worst performance of all the forecasting models because, when linear models predict nonlinear problems, conspicuous errors occur. Thus, LR was the least applicable forecasting model in this study.
Second, the total annual global irradiance with the solar panels set at a tilt angle (β′) ranging from 0° to 50° was estimated. The annual irradiance is 1.562 MWh/m2 with a β′ of 0° and peaked at 1.655 MWh/m2 with a β′ of 20–22°, and its level was almost the same with a β′ of 0° and 41°. Moreover, the irradiance was lower with a β′ of 42° than with a β′ of 0°, suggesting that the optimal tilt angle for the solar panels was 20–22°.

Acknowledgments

The support of the Ministry of Science and Technology in Taiwan (MOST105-2634-F-019-001) is greatly appreciated. We also acknowledge Wallace Academic Editing for editing this manuscript.

Conflicts of Interest

The author declares no conflict of interest.

References

  1. López, G.; Rubio, M.A.; Martı́nez, M.; Batlles, F.J. Estimation of hourly global photosynthetically active radiation using artificial neural network models. Agric. For. Meteorol. 2001, 107, 279–291. [Google Scholar] [CrossRef]
  2. Gomez, V.; Casanovas, A. Fuzzy modeling of solar irradiance on inclined surfaces. Sol. Energy 2003, 75, 307–315. [Google Scholar] [CrossRef]
  3. Reda, I.; Andreas, A. Solar position algorithm for solar radiation applications. Sol. Energy 2004, 76, 577–589. [Google Scholar] [CrossRef]
  4. Shen, C.; He, Y.L.; Liu, Y.W.; Tao, W.Q. Modelling and simulation of solar radiation data processing with Simulink. Simul. Model. Pract. Theory 2008, 16, 721–735. [Google Scholar] [CrossRef]
  5. Yeom, J.M.; Han, K.S. Improved estimation of surface solar insolation using a neural network and MTSAT-1R data. Comput. Geosci. 2010, 36, 590–597. [Google Scholar] [CrossRef]
  6. Chen, S.X.; Gooi, H.B.; Wang, M.Q. Solar radiation forecast based on fuzzy logic and neural networks. Renew. Energy 2013, 60, 195–201. [Google Scholar] [CrossRef]
  7. Inman, R.H.; Pedro, H.T.C.; Coimbra, C.F.M. Solar forecasting methods for renewable energy integration. Prog. Energy Combust. Sci. 2013, 39, 535–576. [Google Scholar] [CrossRef]
  8. Bode, C.A.; Limm, M.P.; Power, M.E.; Finlay, J.C. Subcanopy solar radiation model: Predicting solar radiation across a heavily vegetated landscape using LiDAR and GIS solar radiation models. Remote Sens. Environ. 2014, 154, 387–397. [Google Scholar] [CrossRef]
  9. Li, Z.; Rahman, S.M.; Vega, R.; Dong, B. A hierarchical approach using machine learning methods in solar photovoltaic energy production forecasting. Energies 2016, 9, 55. [Google Scholar] [CrossRef]
  10. Persson, C.; Bacher, P.; Shiga, T.; Madsen, H. Multi-site solar power forecasting using gradient boosted regression trees. Sol. Energy 2017, 150, 423–436. [Google Scholar] [CrossRef]
  11. Yousif, J.H.; Kazem, H.A.; Boland, J. Predictive models for photovoltaic electricity production in hot weather conditions. Energies 2017, 10, 971. [Google Scholar] [CrossRef]
  12. Platnick, S.; Valero, F.P.J. A validation of a satellite cloud retrieval during ASTEX. J. Atmos. Sci. 1995, 52, 2985–3001. [Google Scholar] [CrossRef]
  13. Stephens, G. Cloud feedbacks in the climate system: A critical review. J. Clim. 2005, 18, 237–273. [Google Scholar] [CrossRef]
  14. Kühnlein, M.; Appelhans, T.; Thies, B.; Kokhanovsky, A.A.; Nauss, T. An evaluation of a semi-analytical cloud property retrieval using MSG SEVIRI, MODIS and CloudSat. Atmos. Res. 2013, 122, 111–135. [Google Scholar] [CrossRef]
  15. Brandau, C.L.; Russchenberg, H.W.J.; Knap, W.H. Evaluation of ground-based remotely sensed liquid water cloud properties using shortwave radiation measurements. Atmos. Res. 2010, 96, 366–377. [Google Scholar] [CrossRef]
  16. Journée, M.; Muller, R.; Bertrand, C. Solar resource assessment in the Benelux by merging Meteosat-derived climate data and ground measurements. Sol. Energy 2012, 86, 3561–3574. [Google Scholar] [CrossRef]
  17. Nauss, T.; Kokhanovsky, A.A. Retrieval of warm cloud optical properties using simple approximations. Remote Sens. Environ. 2011, 115, 1317–1325. [Google Scholar] [CrossRef]
  18. Wong, M.S.; Zhu, R.; Liu, Z.; Lu, L.; Chan, W.K. Estimation of Hong Kong’s solar energy potential using GIS and remote sensing technologies. Renew. Energy 2016, 99, 325–335. [Google Scholar] [CrossRef]
  19. Shafiullah, G.M. Hybrid renewable energy integration (HREI) system for subtropical climate in Central Queensland, Australia. Renew. Energy 2016, 96 Pt A, 1034–1053. [Google Scholar] [CrossRef]
  20. Lin, C.; Wei, C.C.; Tsai, C.C. Prediction of influential operational compost parameters for monitoring composting process. Environ. Eng. Sci. 2016, 33, 494–506. [Google Scholar] [CrossRef]
  21. Breiman, L. Random forests. Mach. Learn. 2001, 45, 5–32. [Google Scholar] [CrossRef]
  22. Kühnlein, M.; Appelhans, T.; Thies, B.; Nauß, T. Precipitation estimates from MSG SEVIRI daytime, nighttime, and twilight data with random forests. J. Appl. Meteorol. Climatol. 2014, 53, 2457–2480. [Google Scholar] [CrossRef]
  23. Duda, R.O.; Hart, P.E.; Stork, D.G. Pattern Classification, 2nd ed.; John Wiley & Sons Ltd.: Hoboken, NJ, USA, 2000. [Google Scholar]
  24. Toussaint, G.T. Geometric proximity graphs for improving nearest neighbor methods in instance-based learning and data mining. Int. J. Comput. Geom. Appl. 2005, 15, 101–150. [Google Scholar] [CrossRef]
  25. Wei, C.C. Comparing lazy and eager learning models for water level forecasting in river-reservoir basins of inundation regions. Environ. Model. Softw. 2015, 63, 137–155. [Google Scholar] [CrossRef]
  26. Savtchenko, A.; Ouzounov, D.; Ahmad, S.; Acker, J.; Leptoukh, G.; Koziana, J.; Nickless, D. Terra and Aqua MODIS products available from NASA GES DAAC. Adv. Space Res. 2004, 34, 710–714. [Google Scholar] [CrossRef]
  27. Chen, F.C. A Meteorology Assessment for Photovoltaic Generation. Master’s Thesis, Southern Taiwan University of Science and Technology, Tainan, Taiwan, 2006. (In Chinese). [Google Scholar]
  28. Exell, R.H.B. A mathematical model for solar radiation in South-East Asia (Thailand). Sol. Energy 1981, 26, 161–168. [Google Scholar] [CrossRef]
  29. Markvart, T. Solar Electricity; John Wiley & Sons Ltd.: New York, NY, USA, 1994. [Google Scholar]
  30. Wei, C.C.; Hsu, N.S. Multireservoir flood-control optimization with neural-based linear channel level routing under tidal effects. Water Resour. Manag. 2008, 22, 1625–1647. [Google Scholar] [CrossRef]
  31. Ho, T.K. Random Decision Forest. In Proceedings of the 3rd International Conference on Document Analysis and Recognition, Montreal, QC, Canada, 14–18 August 1995. [Google Scholar]
  32. Ho, T.K. The random subspace method for constructing decision forests. IEEE Trans. Pattern Anal. Mach. Intell. 1998, 20, 832–844. [Google Scholar]
  33. Chen, S.Z. Evaluating the Effectiveness of Random Forest Model. Master’s Thesis, National Chiao Tung University, Hsinchu City, Taiwan, 2014. (In Chinese). [Google Scholar]
  34. Trenn, S. Multilayer perceptrons: Approximation order and necessary number of hidden units. IEEE Trans. Neural Netw. 2008, 19, 836–844. [Google Scholar] [CrossRef] [PubMed]
Figure 1. Location of the study site.
Energies 10 01660 g001
Figure 2. Flowchart of the proposed methodology.
Energies 10 01660 g002
Figure 3. Flowchart of estimating observed and predicted solar irradiance with tilted solar panels.
Energies 10 01660 g003
Figure 4. Calibration of model parameters: (a) learning rate for MLP; (b) momentum correction for MLP; (c) size of each bag for RF; and (d) number of neighbors for kNN.
Energies 10 01660 g004
Figure 5. Performance of dataset combinations for solar irradiance at t + 1: (a) MAE, (b) RMSE, and (c) r.
Energies 10 01660 g005
Figure 6. Improvement rates for MLP, RF, kNN, and LR with all dataset combinations: (a) MAE, (b) RMSE, and (c) r.
Energies 10 01660 g006
Figure 7. Prediction errors by all models over a 12-h forecast horizon in the year 2016: (a) MAE, (b) RMSE, and (c) r.
Energies 10 01660 g007
Figure 8. Observed and predicted changes in solar irradiance for the 4 consecutive days within 1 h (t + 1), 3 h (t + 3), 6 h (t + 6), and 12 h (t + 12) starting from: (ad) the vernal equinox on 20 March 2016, and (eh) the summer solstice on 21 June 2016.
Energies 10 01660 g008
Figure 9. Observed and predicted changes in solar irradiance for the 4 consecutive days within 1 h (t + 1), 3 h (t + 3), 6 h (t + 6), and 12 h (t + 12) starting from: (ad) the autumnal equinox on 22 September 2016, and (eh) the winter solstice on 21 December 2016.
Energies 10 01660 g009
Figure 10. Performance of all models over a 12-h forecast horizon: (ac) in summer, and (df) in winter.
Energies 10 01660 g010
Figure 11. Observed versus predicted changes in the direct irradiance within t + 1, t + 3, t + 6, and t + 12 for 4 consecutive days starting from: (ad) the summer solstice, and (eh) the winter solstice.
Energies 10 01660 g011
Figure 12. Observed values versus predicted changes in the diffuse horizontal irradiance within t + 1, t + 3, t + 6, and t + 12 for four consecutive days starting from: (ad) the summer solstice, and (eh) the winter solstice.
Energies 10 01660 g012
Figure 13. Hourly changes in the observed and predicted global irradiance with a β′ of 23° for the four consecutive days starting from: (ad) the summer solstice, and (eh) the winter solstice.
Energies 10 01660 g013
Figure 14. Hourly changes in the observed and predicted global irradiance with a β′ of 33° for the four consecutive days starting from: (ad) the summer solstice, and (eh) the winter solstice.
Energies 10 01660 g014
Figure 15. Results with a β′ of 0–50°: (a) amount of total annual global irradiance, and (b) increase rate of the total annual global irradiance.
Energies 10 01660 g015
Figure 16. Observed and predicted values of the total annual global irradiance with a β′ of 0–41° within (a) t + 1, (b) t + 3, (c) t + 6, and (d) t + 12.
Energies 10 01660 g016
Figure 17. Relative error of the predicted total annual global irradiance within (a) t + 1, (b) t + 3, (c) t + 6, and (d) t + 12.
Energies 10 01660 g017
Table 1. Statistics of ground weather data attributes.
Data SetAttributeUnitMin–MaxMeanStandard Deviation
Ground weatherAtmospheric pressurehPa973.8–1031.51011.25.72
Wind speedm/s0–18.42.831.70
Precipitationmm0–950.231.91
Temperature°C5.6–35.924.35.38
Relative humidity%23–10074.010.17
Radiationw/m20–1125.00162.04249.38
Satellite Remote-sensingAerosol optical depth-0.18–10.742.801.56
Water vaporcm0.15–77.2137.4713.72
Cirrus reflectance-0.25–67.422.924.99
Cloud fraction-0.93–10068.5028.76
Sun PositionDeclination angleDeg.−23.45–23.45−0.0116.58
Hour angleDeg.−165.00–80.007.50103.83
Zenith angleDeg.0.01–179.9990.0043.83
Elevation angleDeg.−89.99–89.990.0043.83
Azimuth angleDeg.−90.00–90.000.0065.09
Table 2. Optimal parameters for all model cases.
Model CaseMLPRFkNN
Learning RateMomentumSize of Each BagNumber of Neighbors
Dataset {A}0.50.24030
Dataset {A, B}0.10.12525
Dataset {A, C}0.10.24530
Dataset {A, B, C}0.10.33025
Table 3. Average performance of dataset combinations for solar irradiance at t + 1.
PerformanceCase {A}Case {A,B}Case {A,C}Case {A,B,C}
MAE62.5263.2339.3339.42
RMSE104.45104.6776.7876.75
r0.9240.9230.9600.961
Table 4. Performance of all models within t + 1 and t + 6 across all seasons.
SeasonPerformancet + 1t + 6
MLPRFkNNLRMLPRFkNNLR
SpringMAE (w/m2)39.437.441.157.976.068.570.6123.1
rMAE0.2090.1980.2180.3070.4030.3630.3740.652
RMSE (w/m2)74.673.880.089.0125.6129.7135.2184.5
rRMSE0.3950.3910.4240.4720.6650.6870.7160.978
r0.9640.9650.9590.9500.8960.8880.8760.767
SummerMAE (w/m2)50.747.648.867.884.978.775.2134.7
rMAE0.2320.2170.2230.3100.3880.3600.3440.616
RMSE (w/m2)96.593.195.9110.6134.0140.1134.4201.6
rRMSE0.4410.4260.4380.5060.6130.6400.6140.922
r0.9500.9540.9510.9330.9060.9010.9060.805
AutumnMAE (w/m2)36.234.136.856.072.463.763.8107.6
rMAE0.2180.2050.2220.3380.4360.3840.3840.648
RMSE (w/m2)72.170.873.489.3122.2123.7121.3170.1
rRMSE0.4340.4260.4420.5380.7360.7450.7311.025
r0.9620.9640.9620.9410.8920.8920.8920.781
WinterMAE (w/m2)29.428.530.752.464.653.857.1104.9
rMAE0.2140.2070.2230.3820.4700.3920.4160.764
RMSE (w/m2)59.457.861.579.2108.4104.1109.1157.9
rRMSE0.4320.4210.4480.5770.7900.7580.7951.150
r0.9680.9690.9660.9400.8840.8930.8800.725

