Nearshore Wave Predictions Using Data Mining Techniques during Typhoons: A Case Study near Taiwan’s Northeastern Coast


Abstract
:1. Introduction
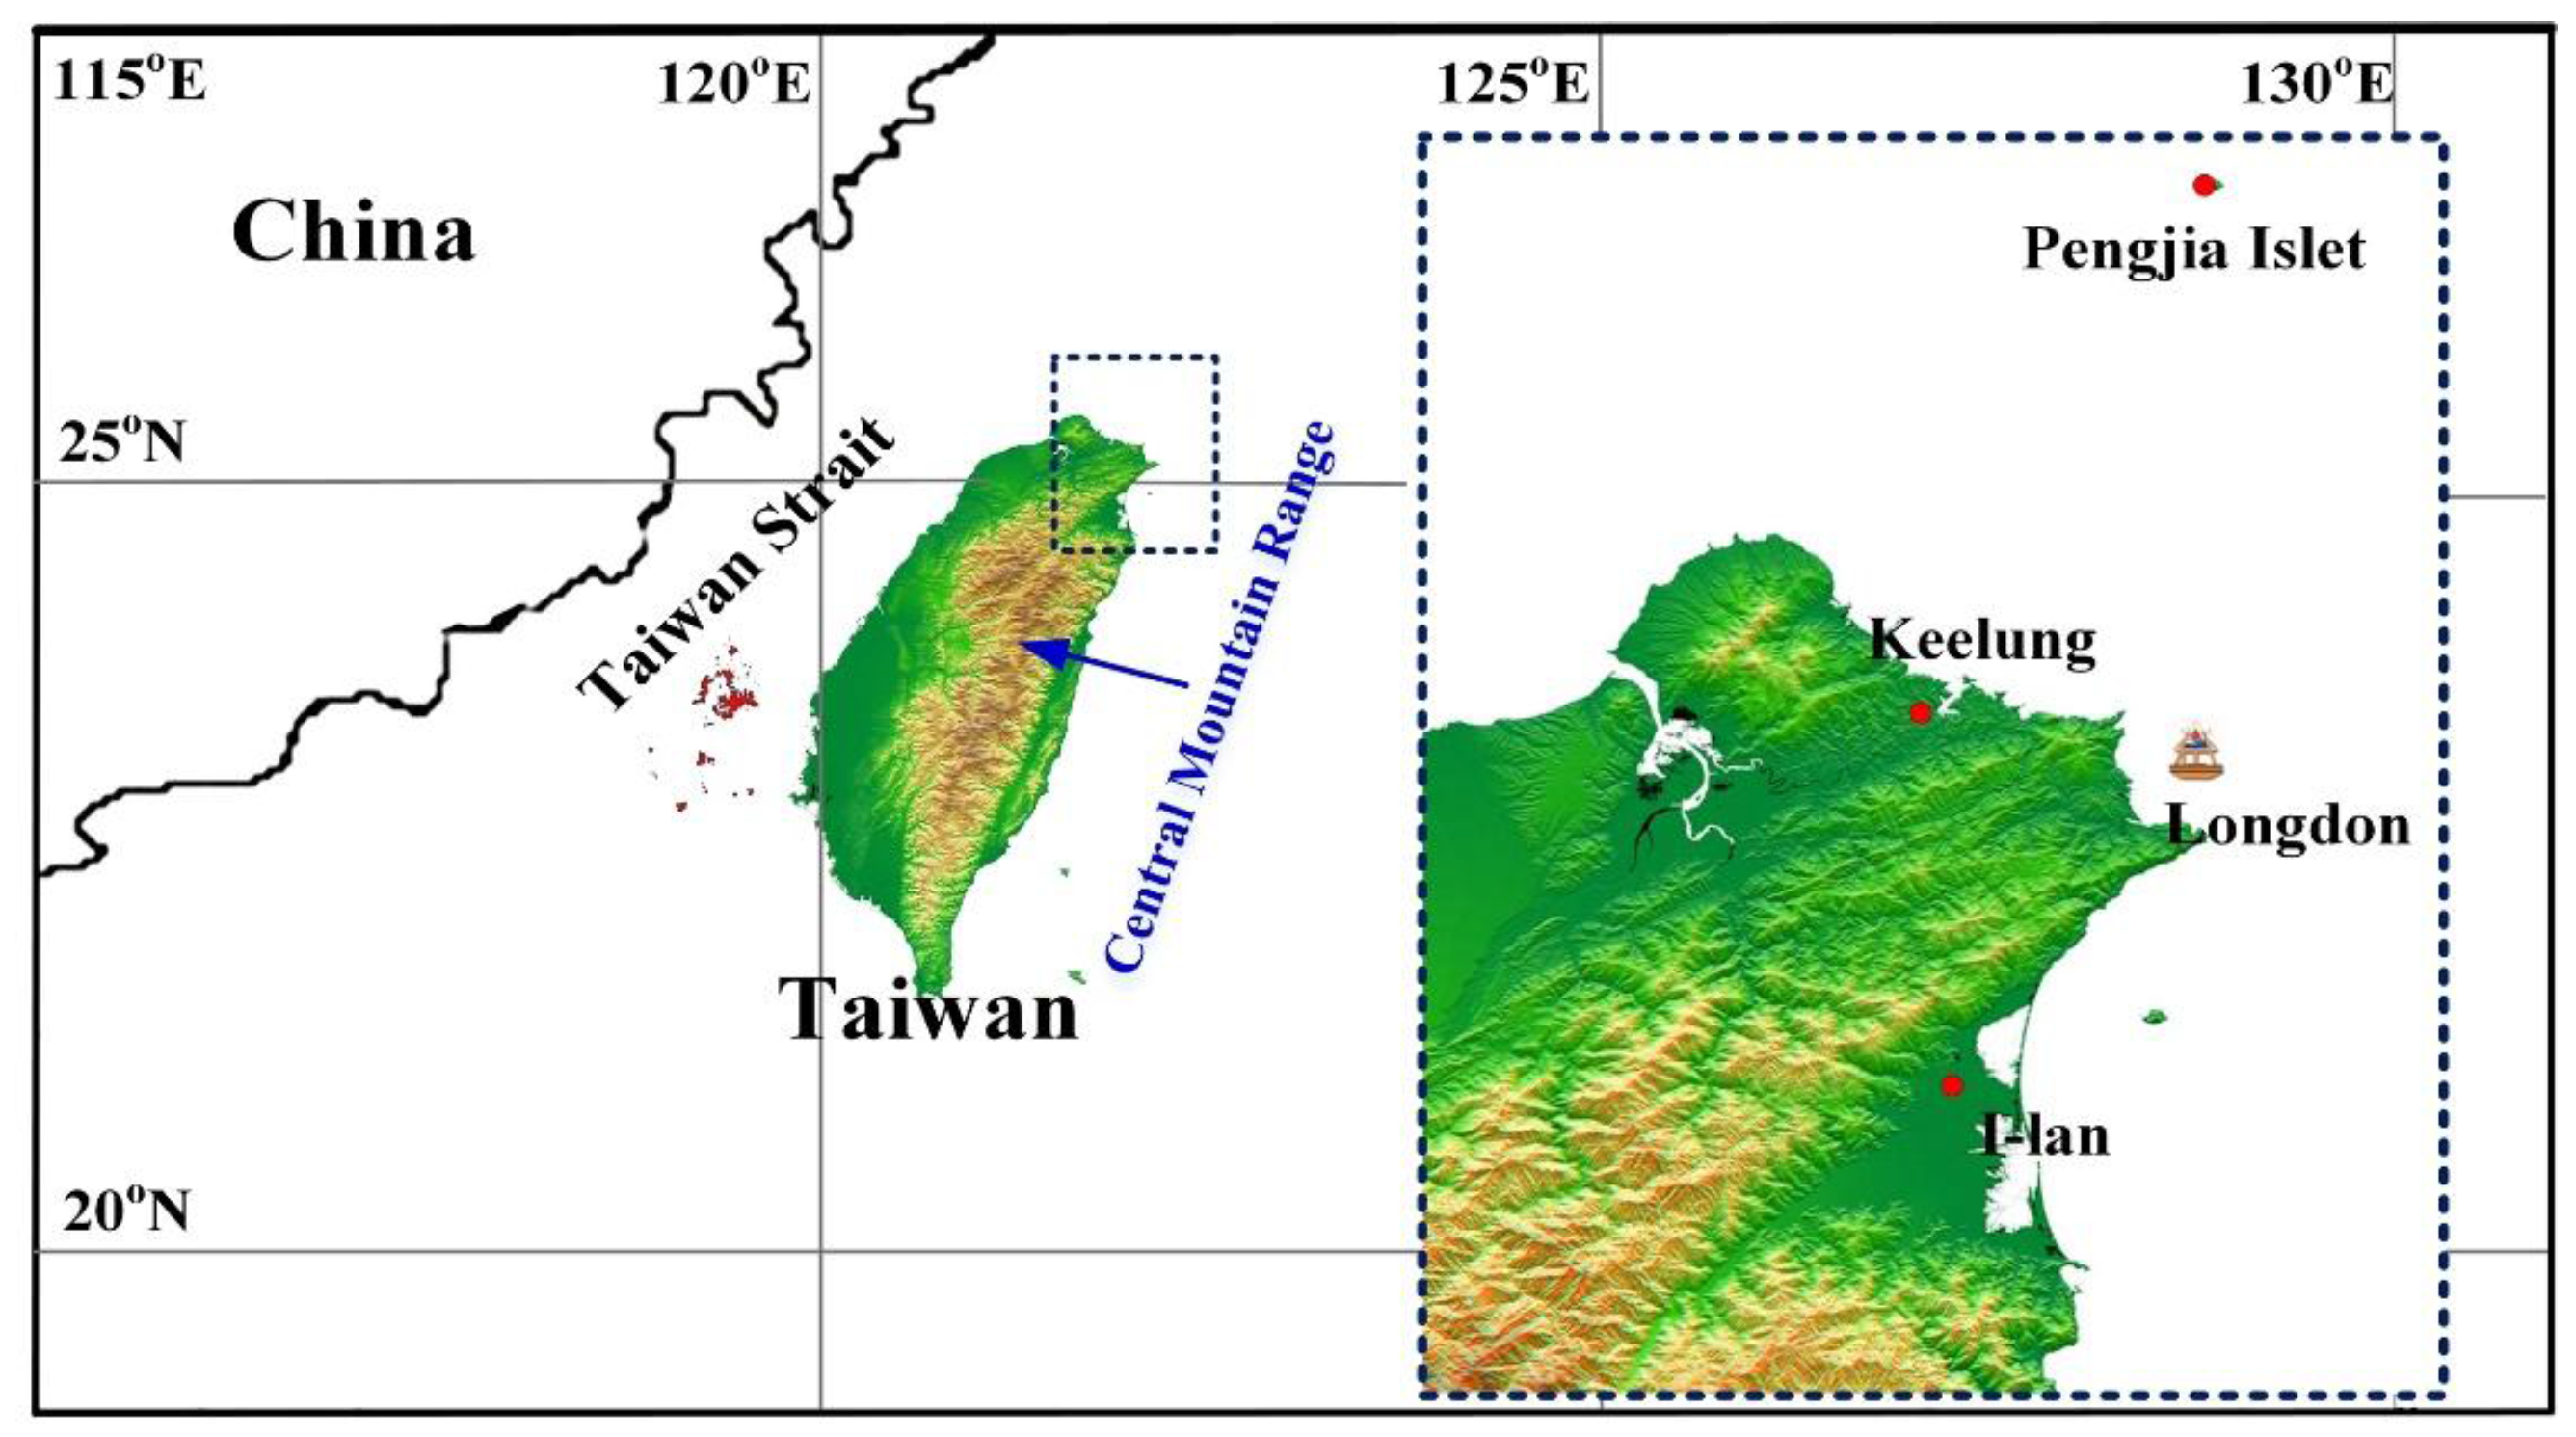
2. Location and Typhoons
2.1. Typhoon Characteristics
2.2. Ground Meteorological Properties
2.3. Buoy Atmospheric Properties
2.4. Buoy Maritime Properties
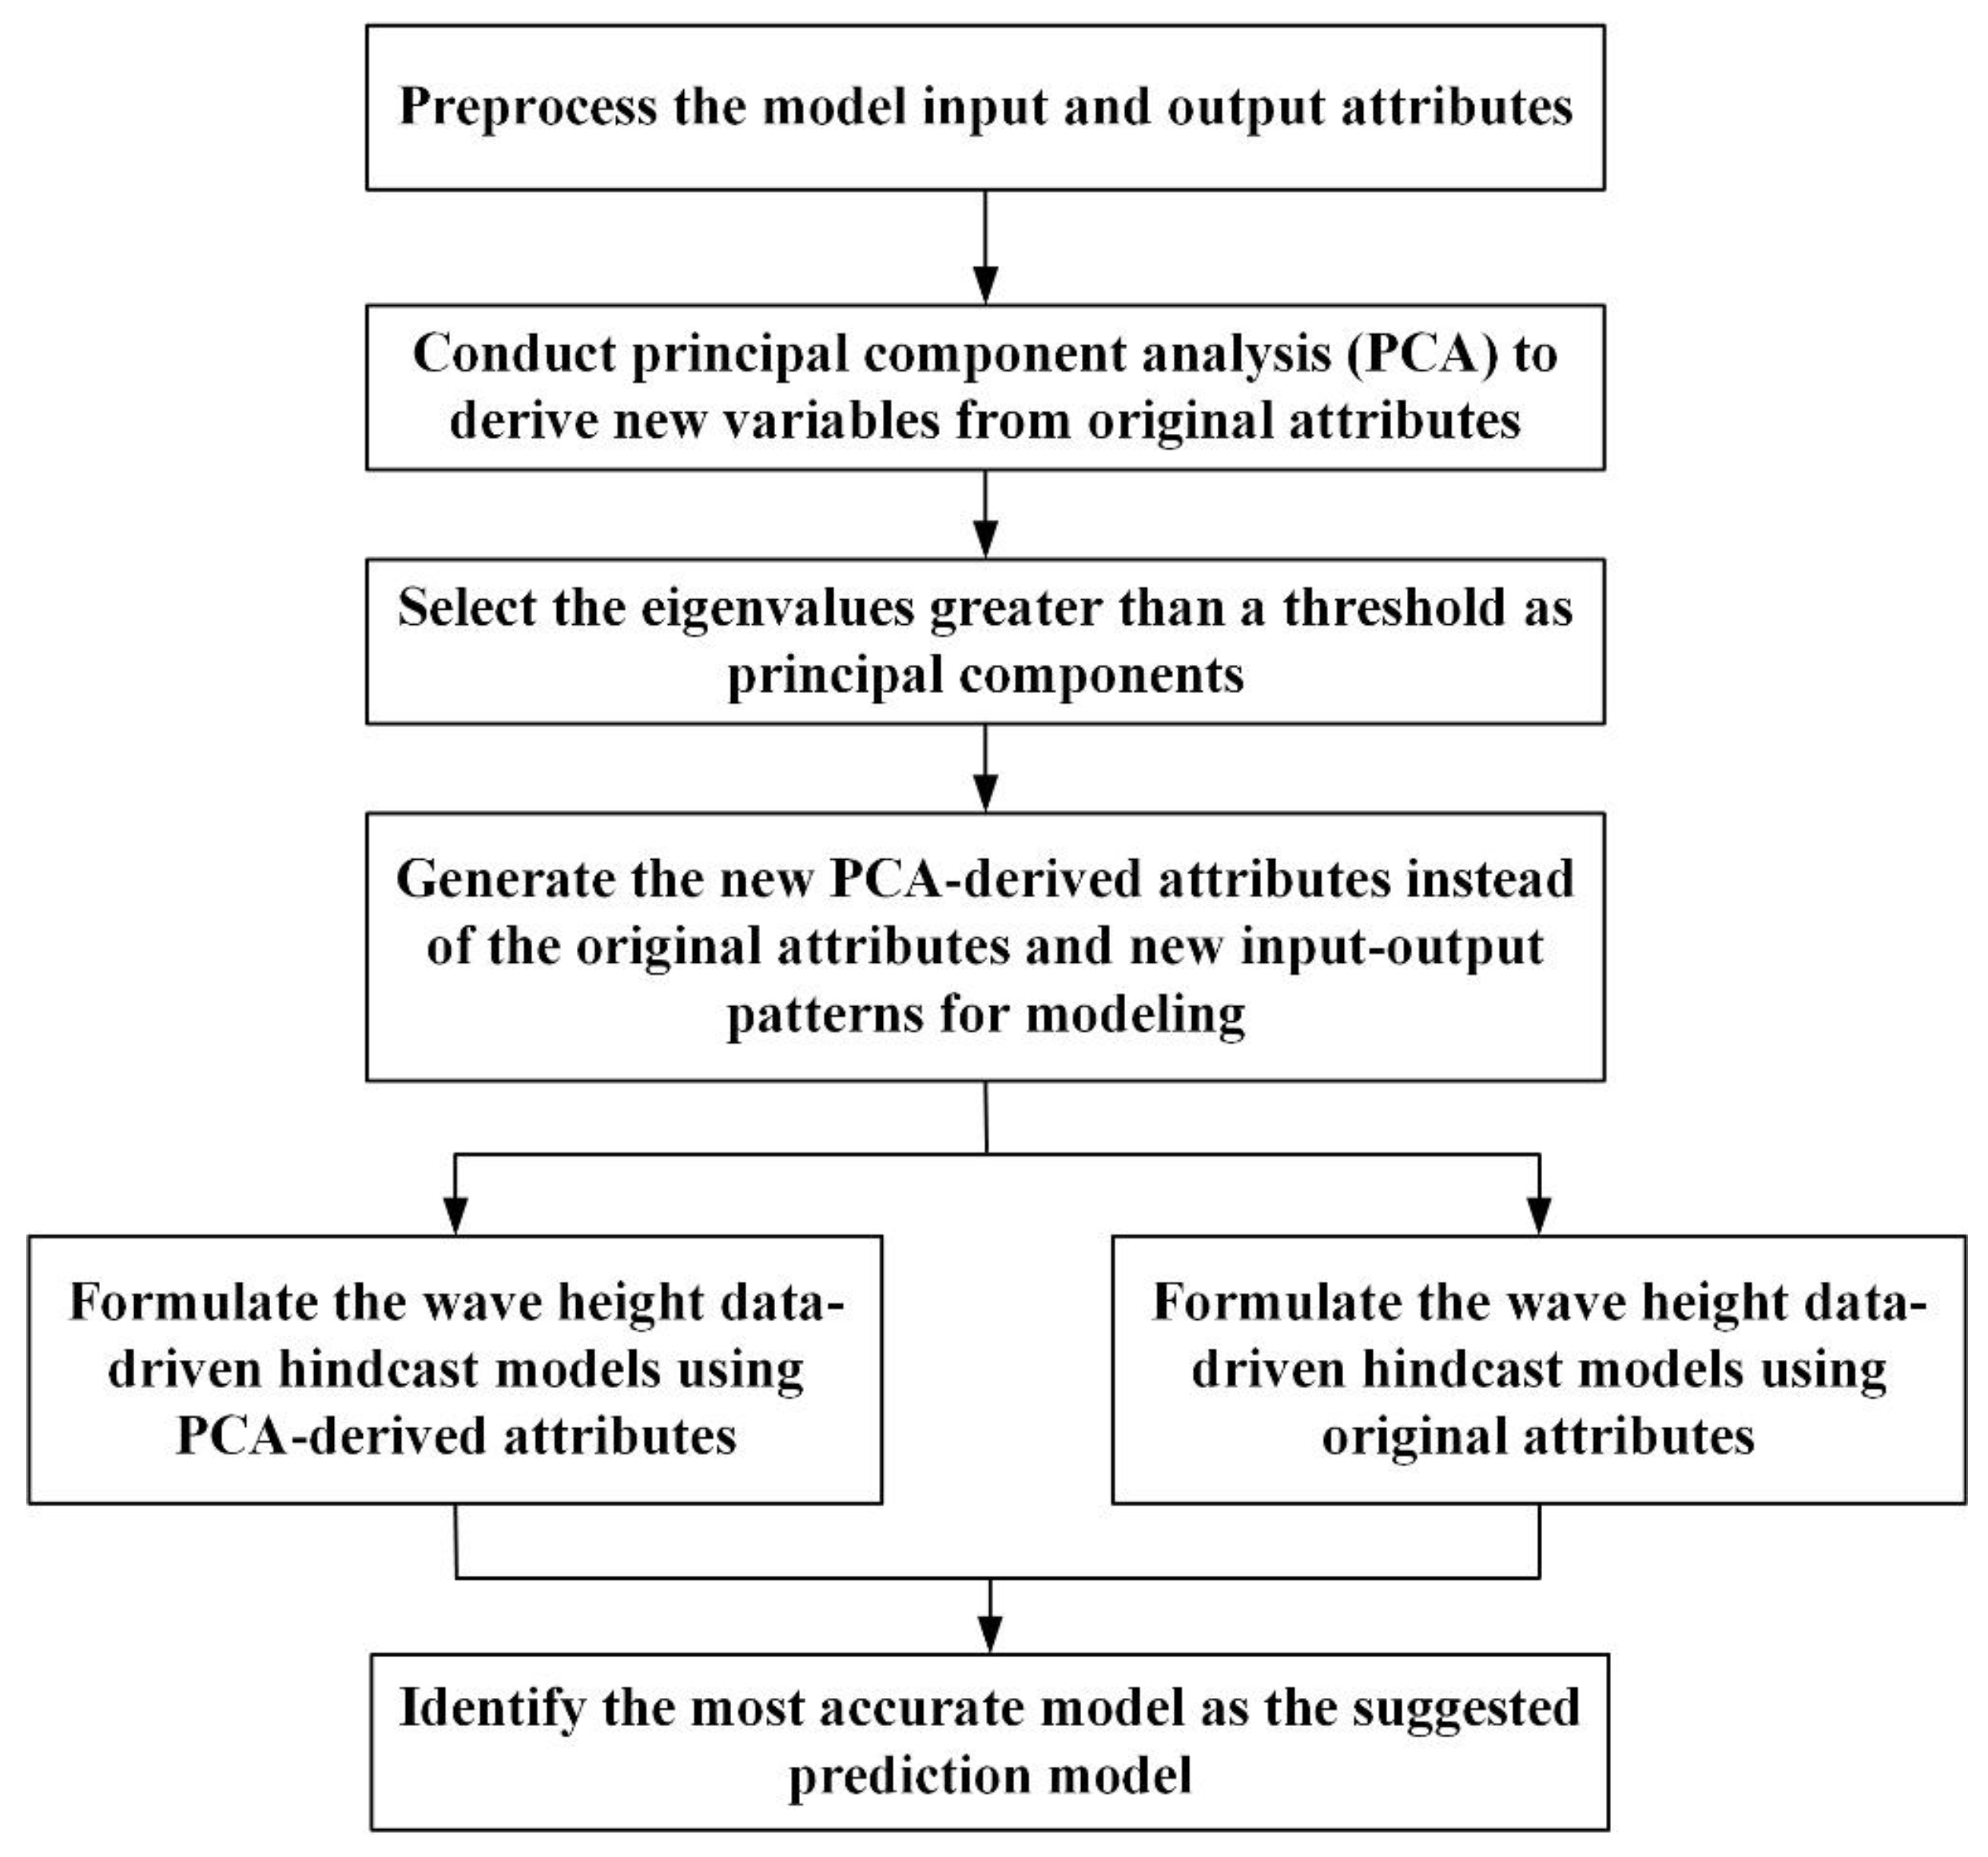
3. Methodology
3.1. PCA Approach
3.2. Data Mining Models
3.2.1. kNN
3.2.2. LR
3.2.3. M5
3.2.4. MLP
3.2.5. SVR
4. Model Development
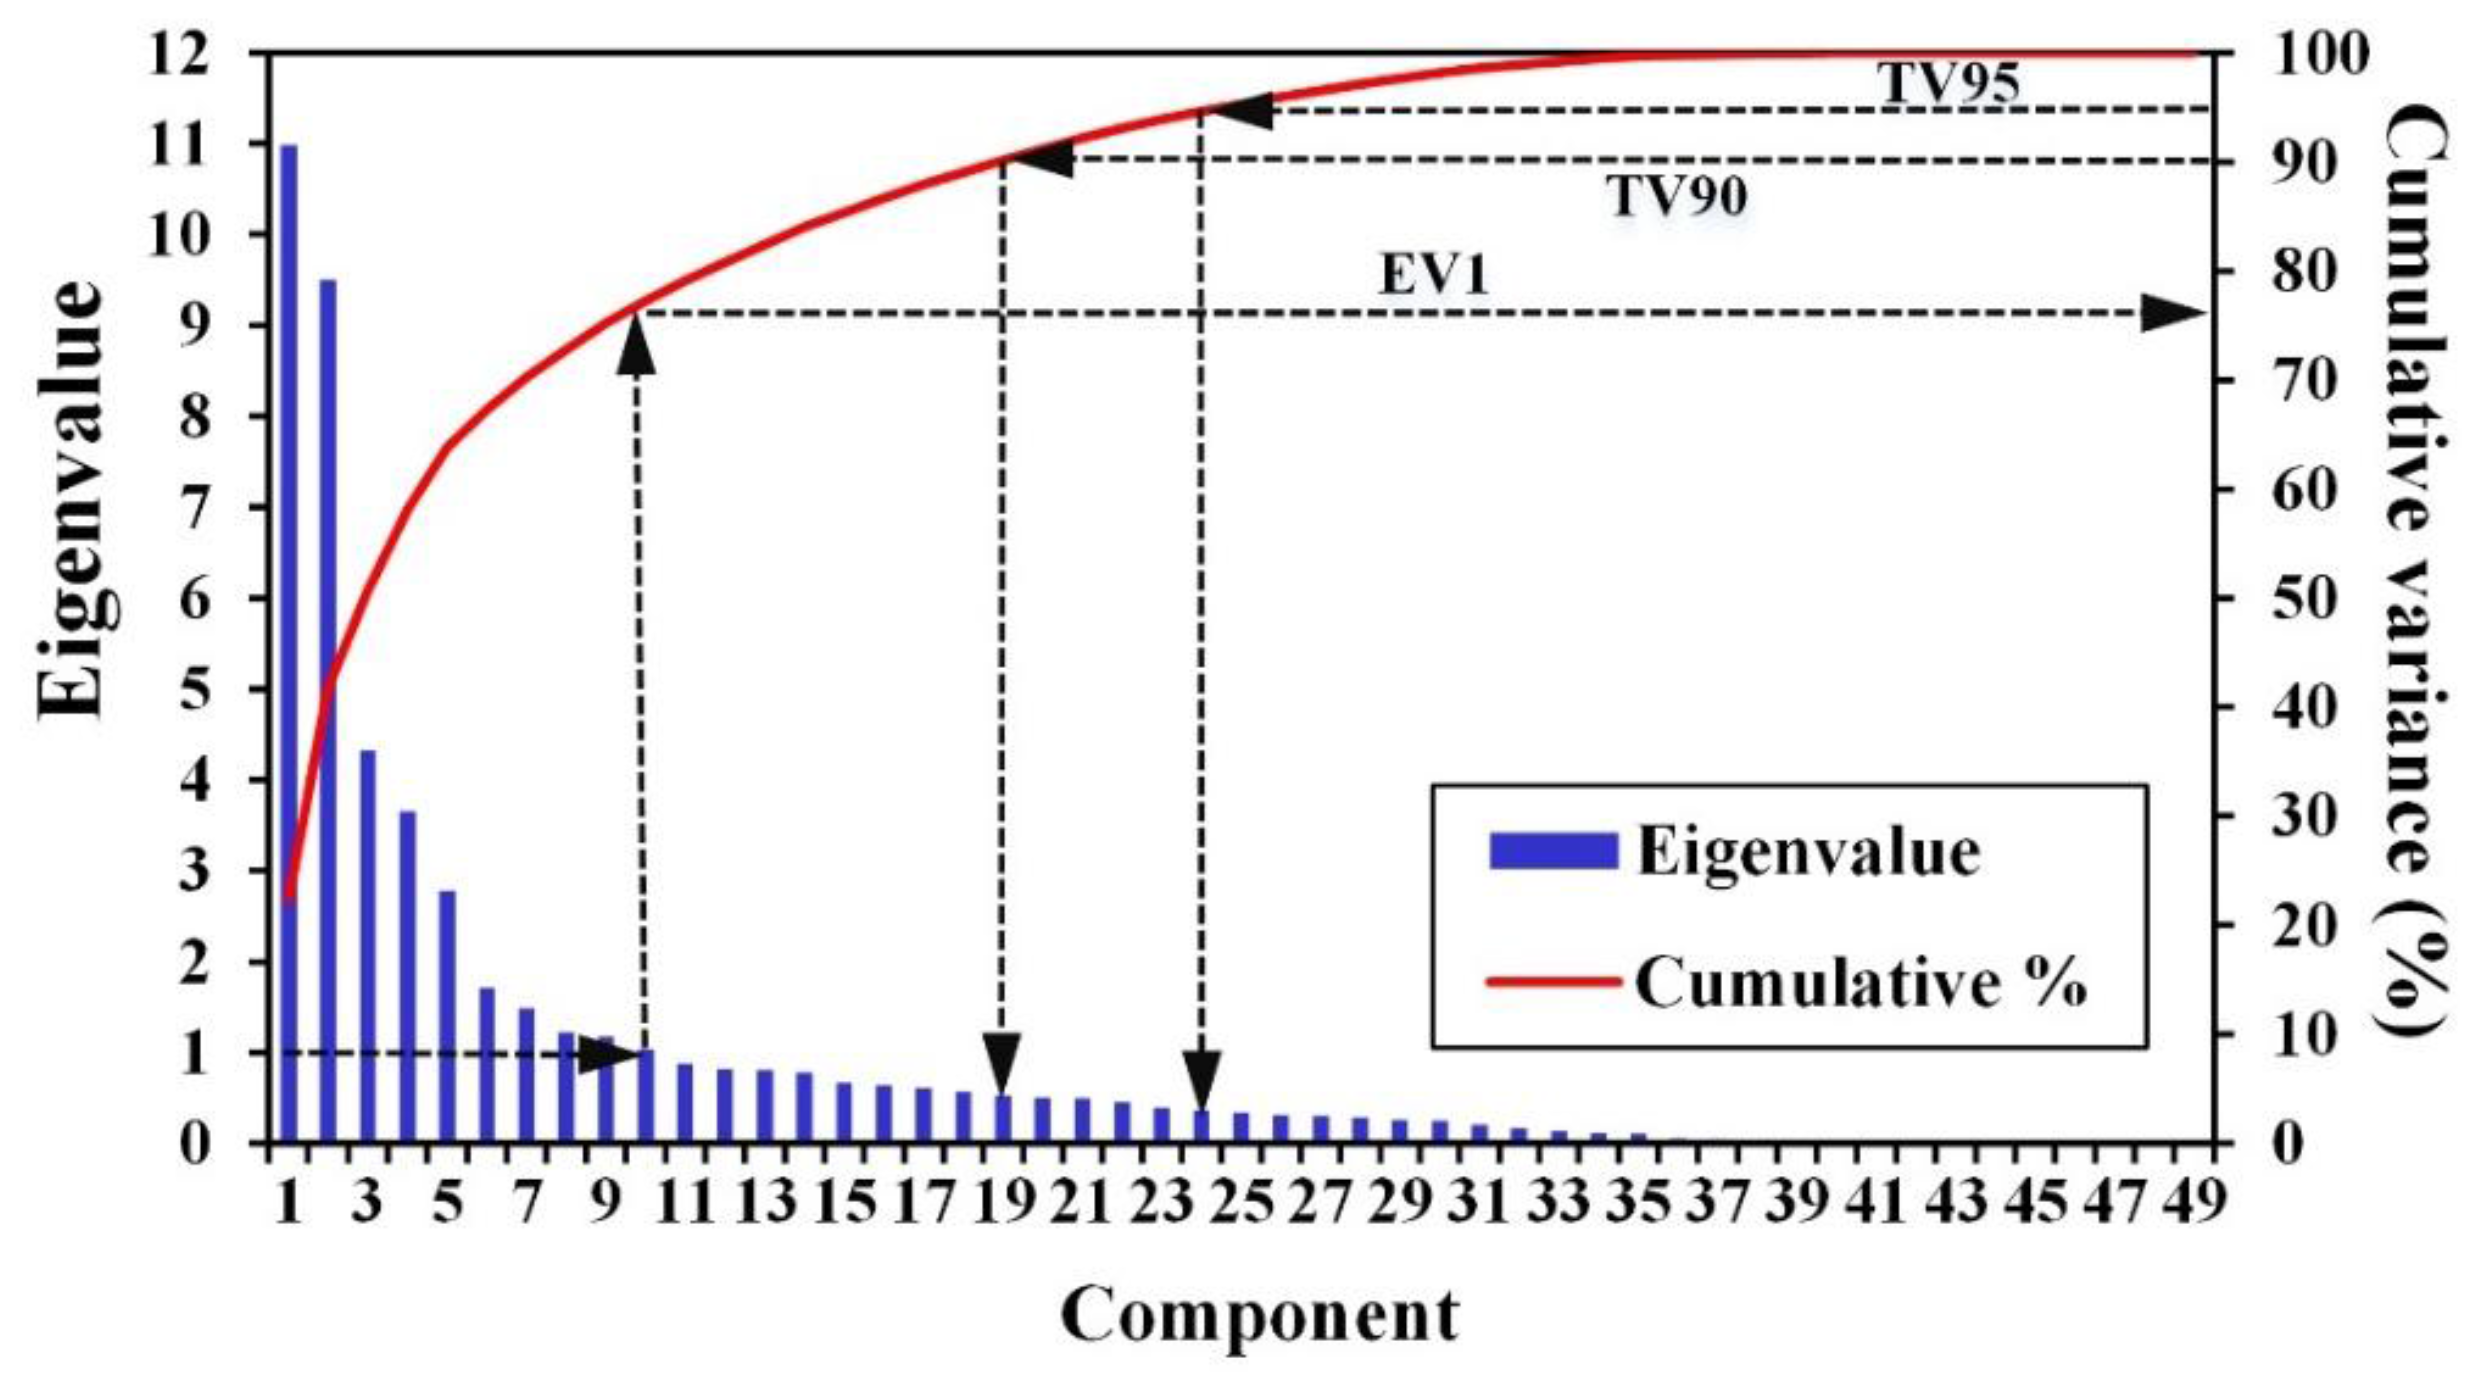
4.1. PCA
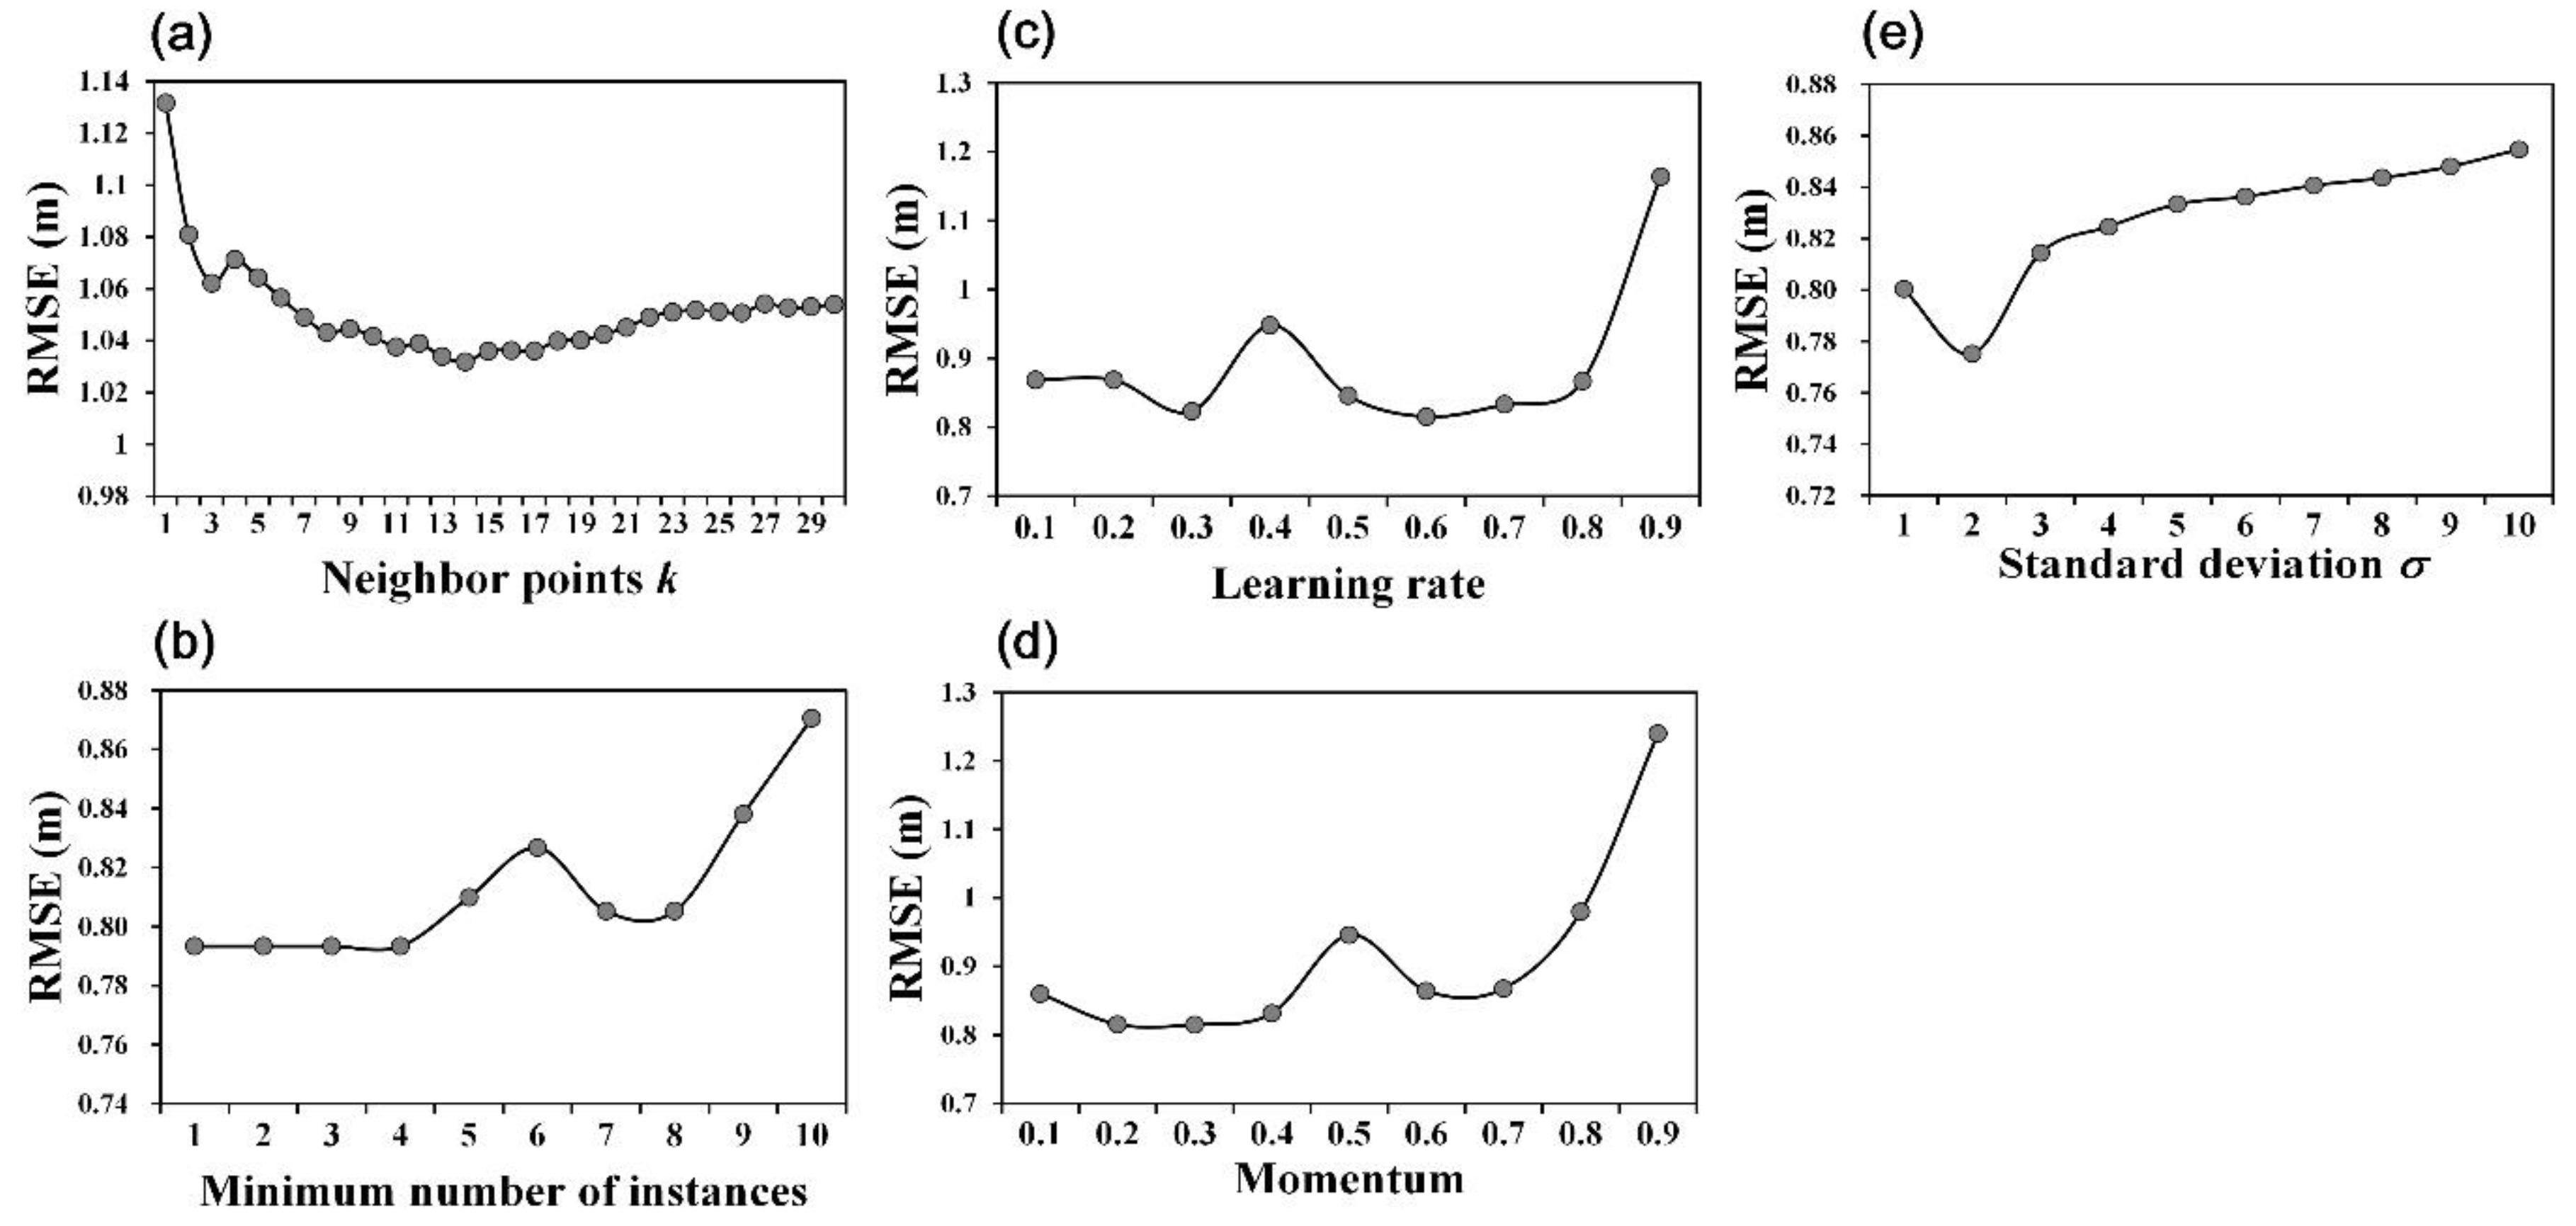
4.2. Model Constructions
5. Evaluation
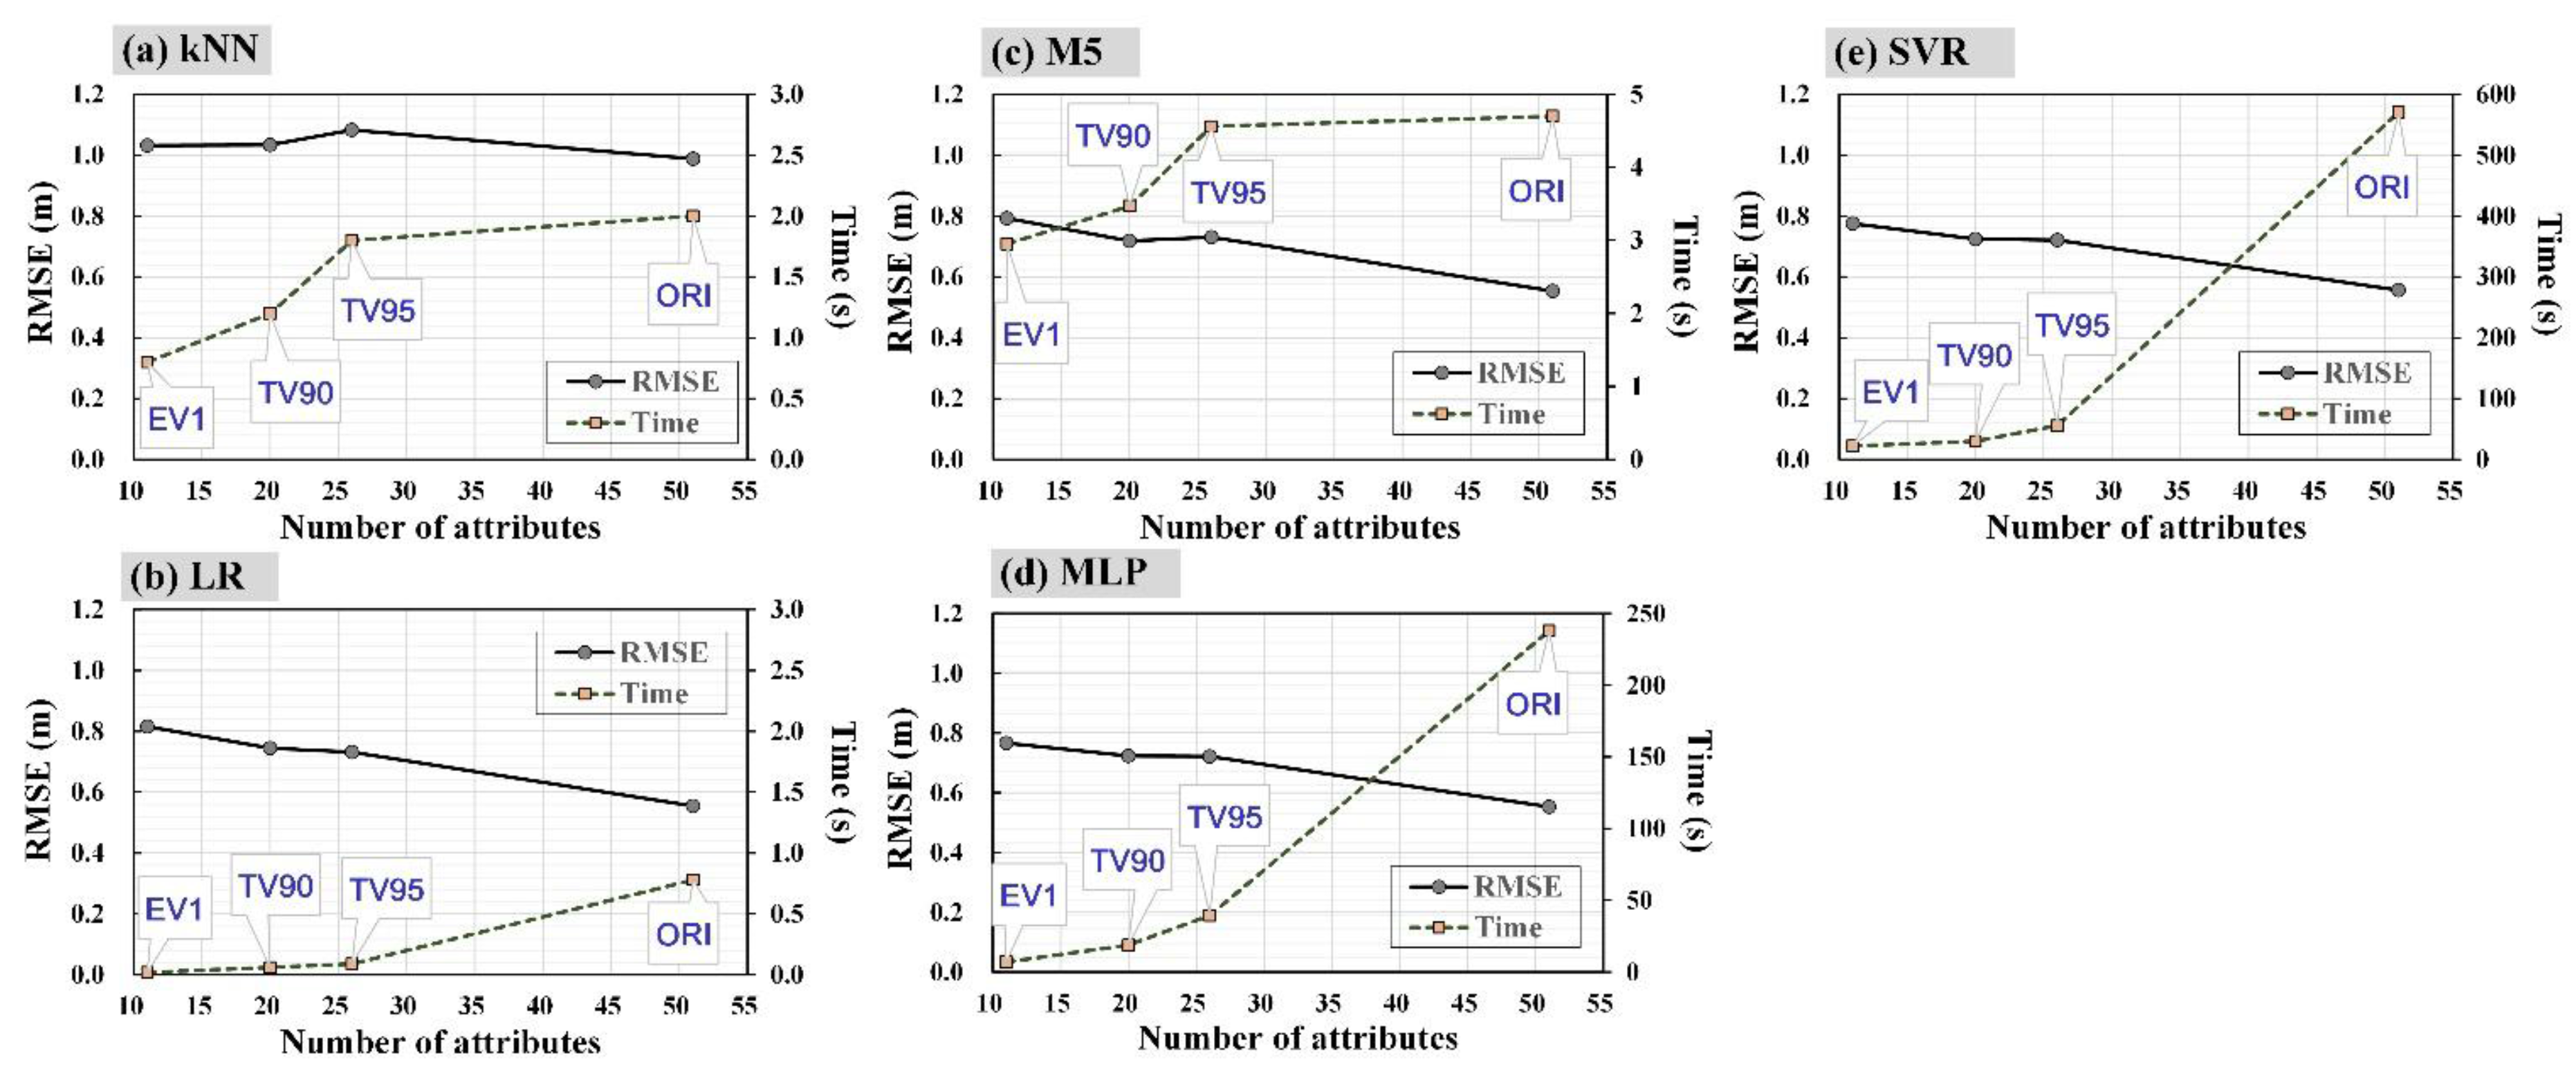
5.1. Effect of Dimension Reduction
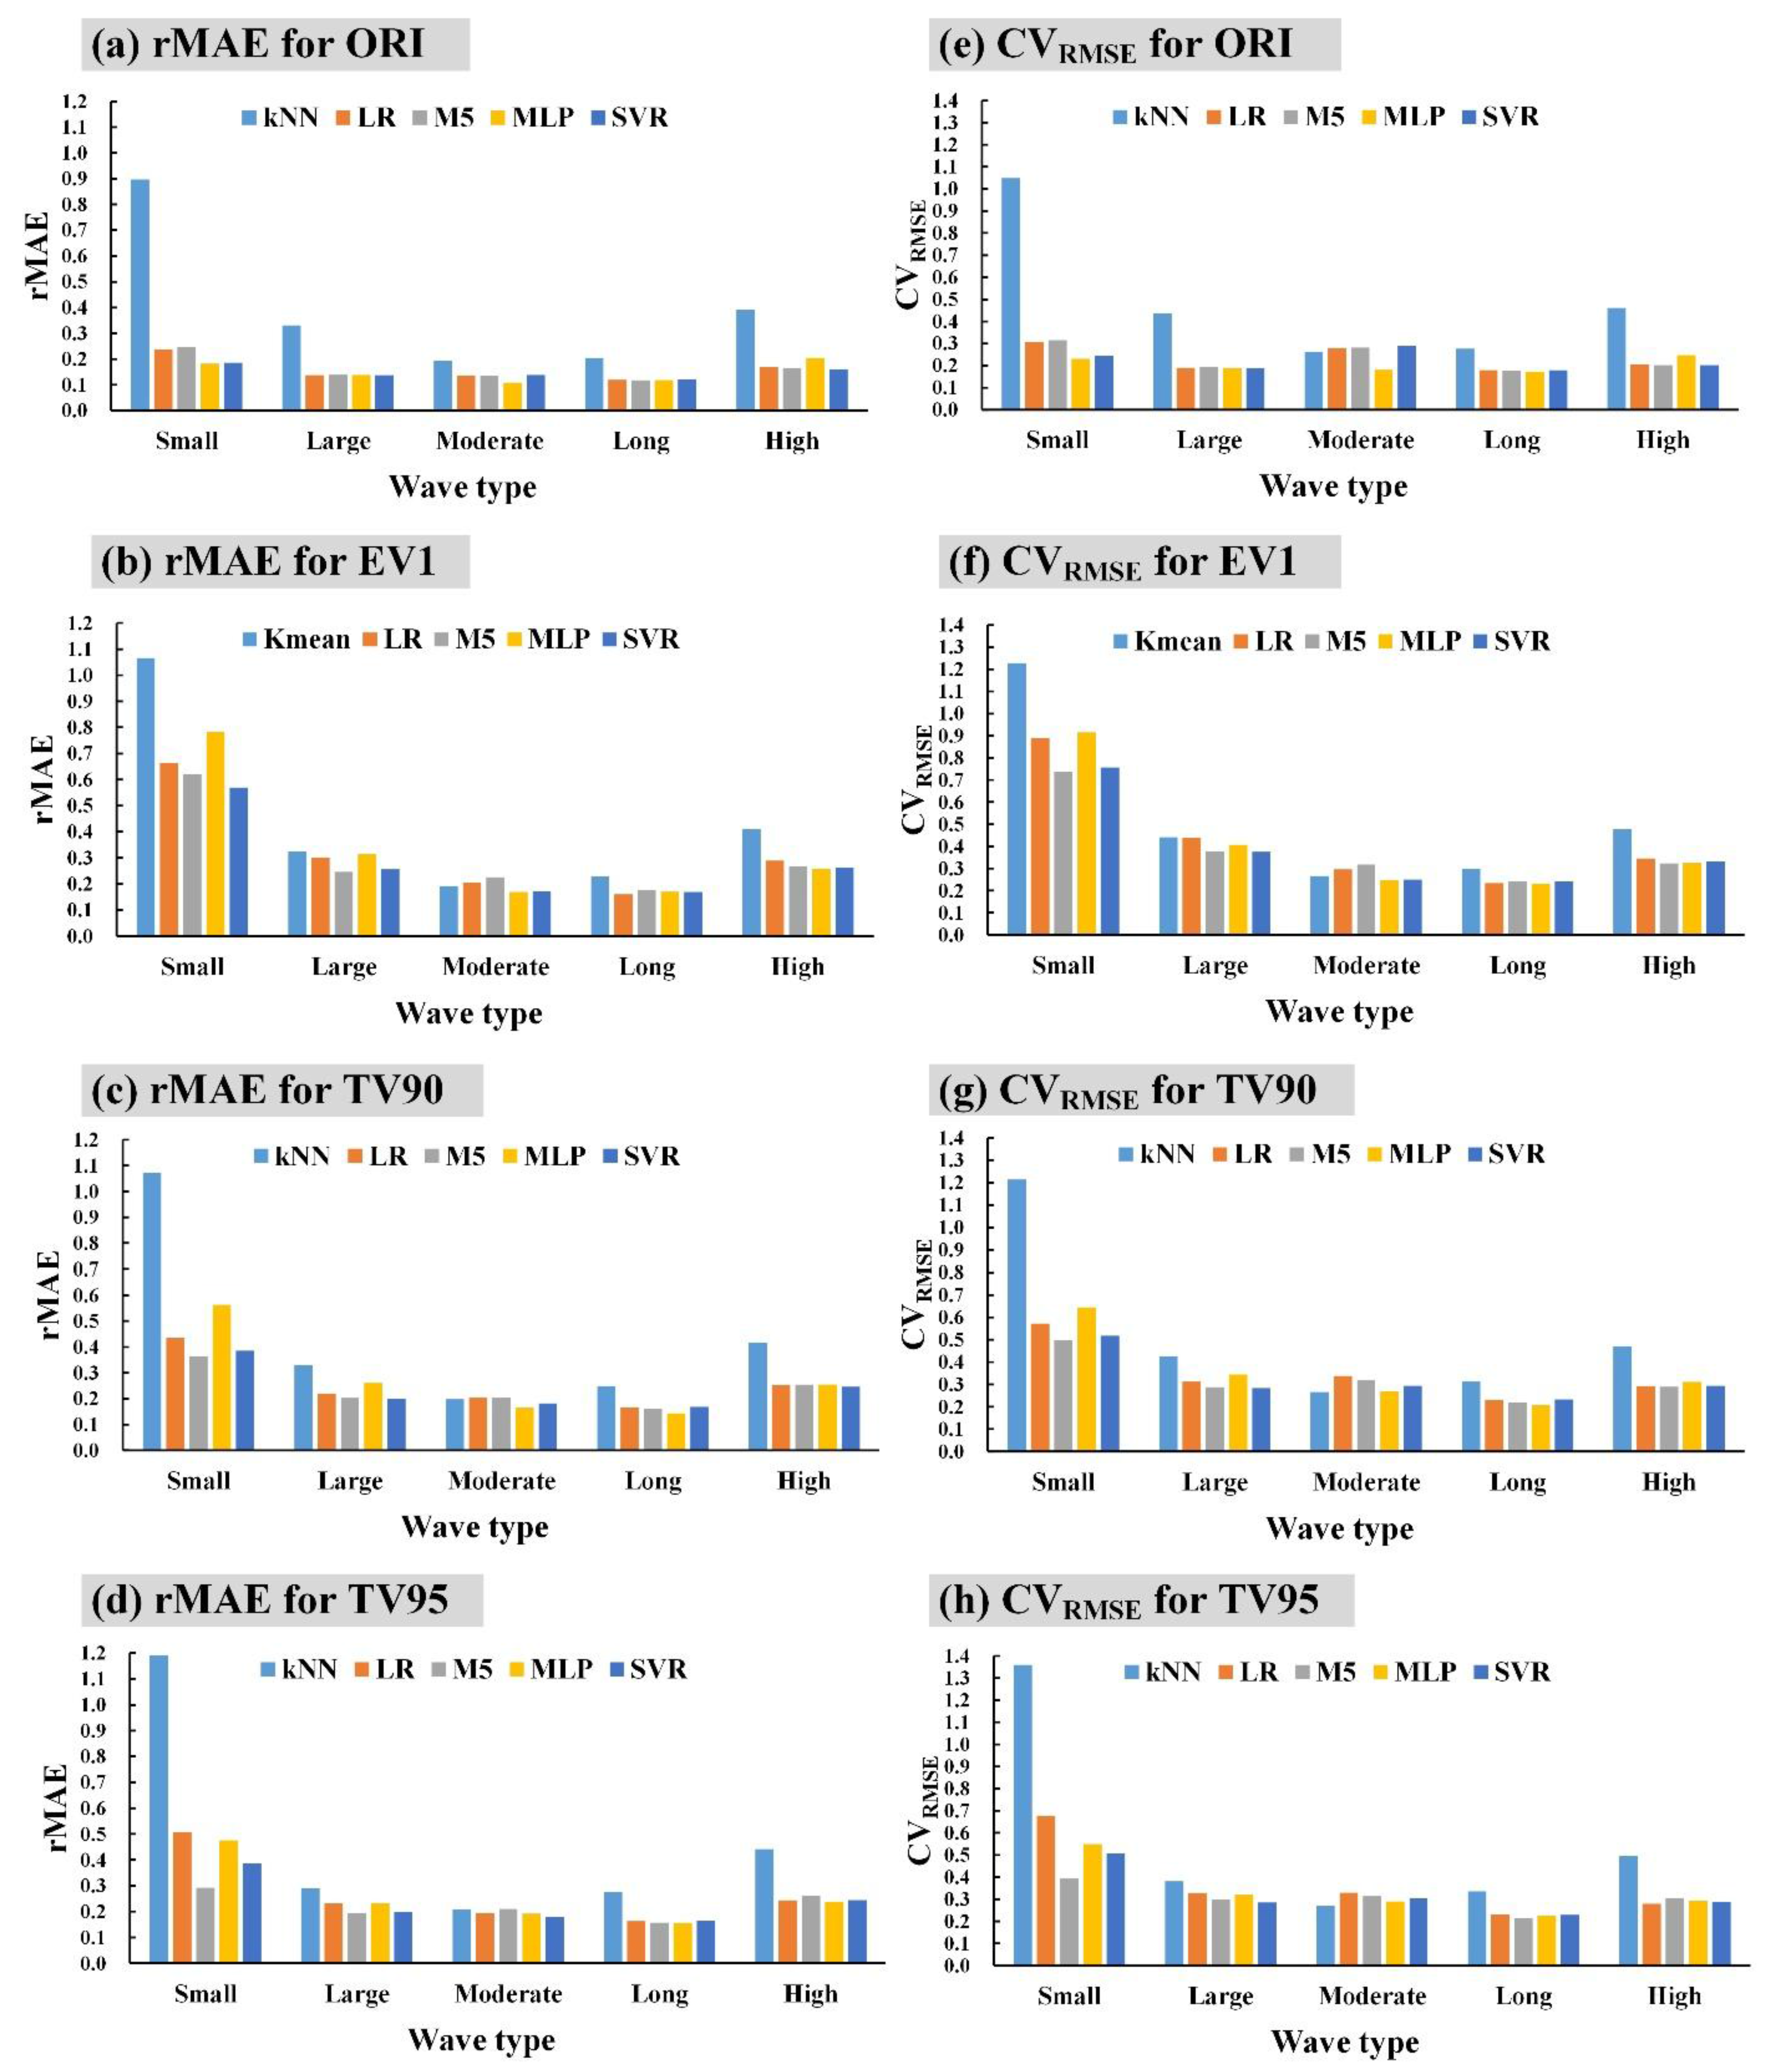
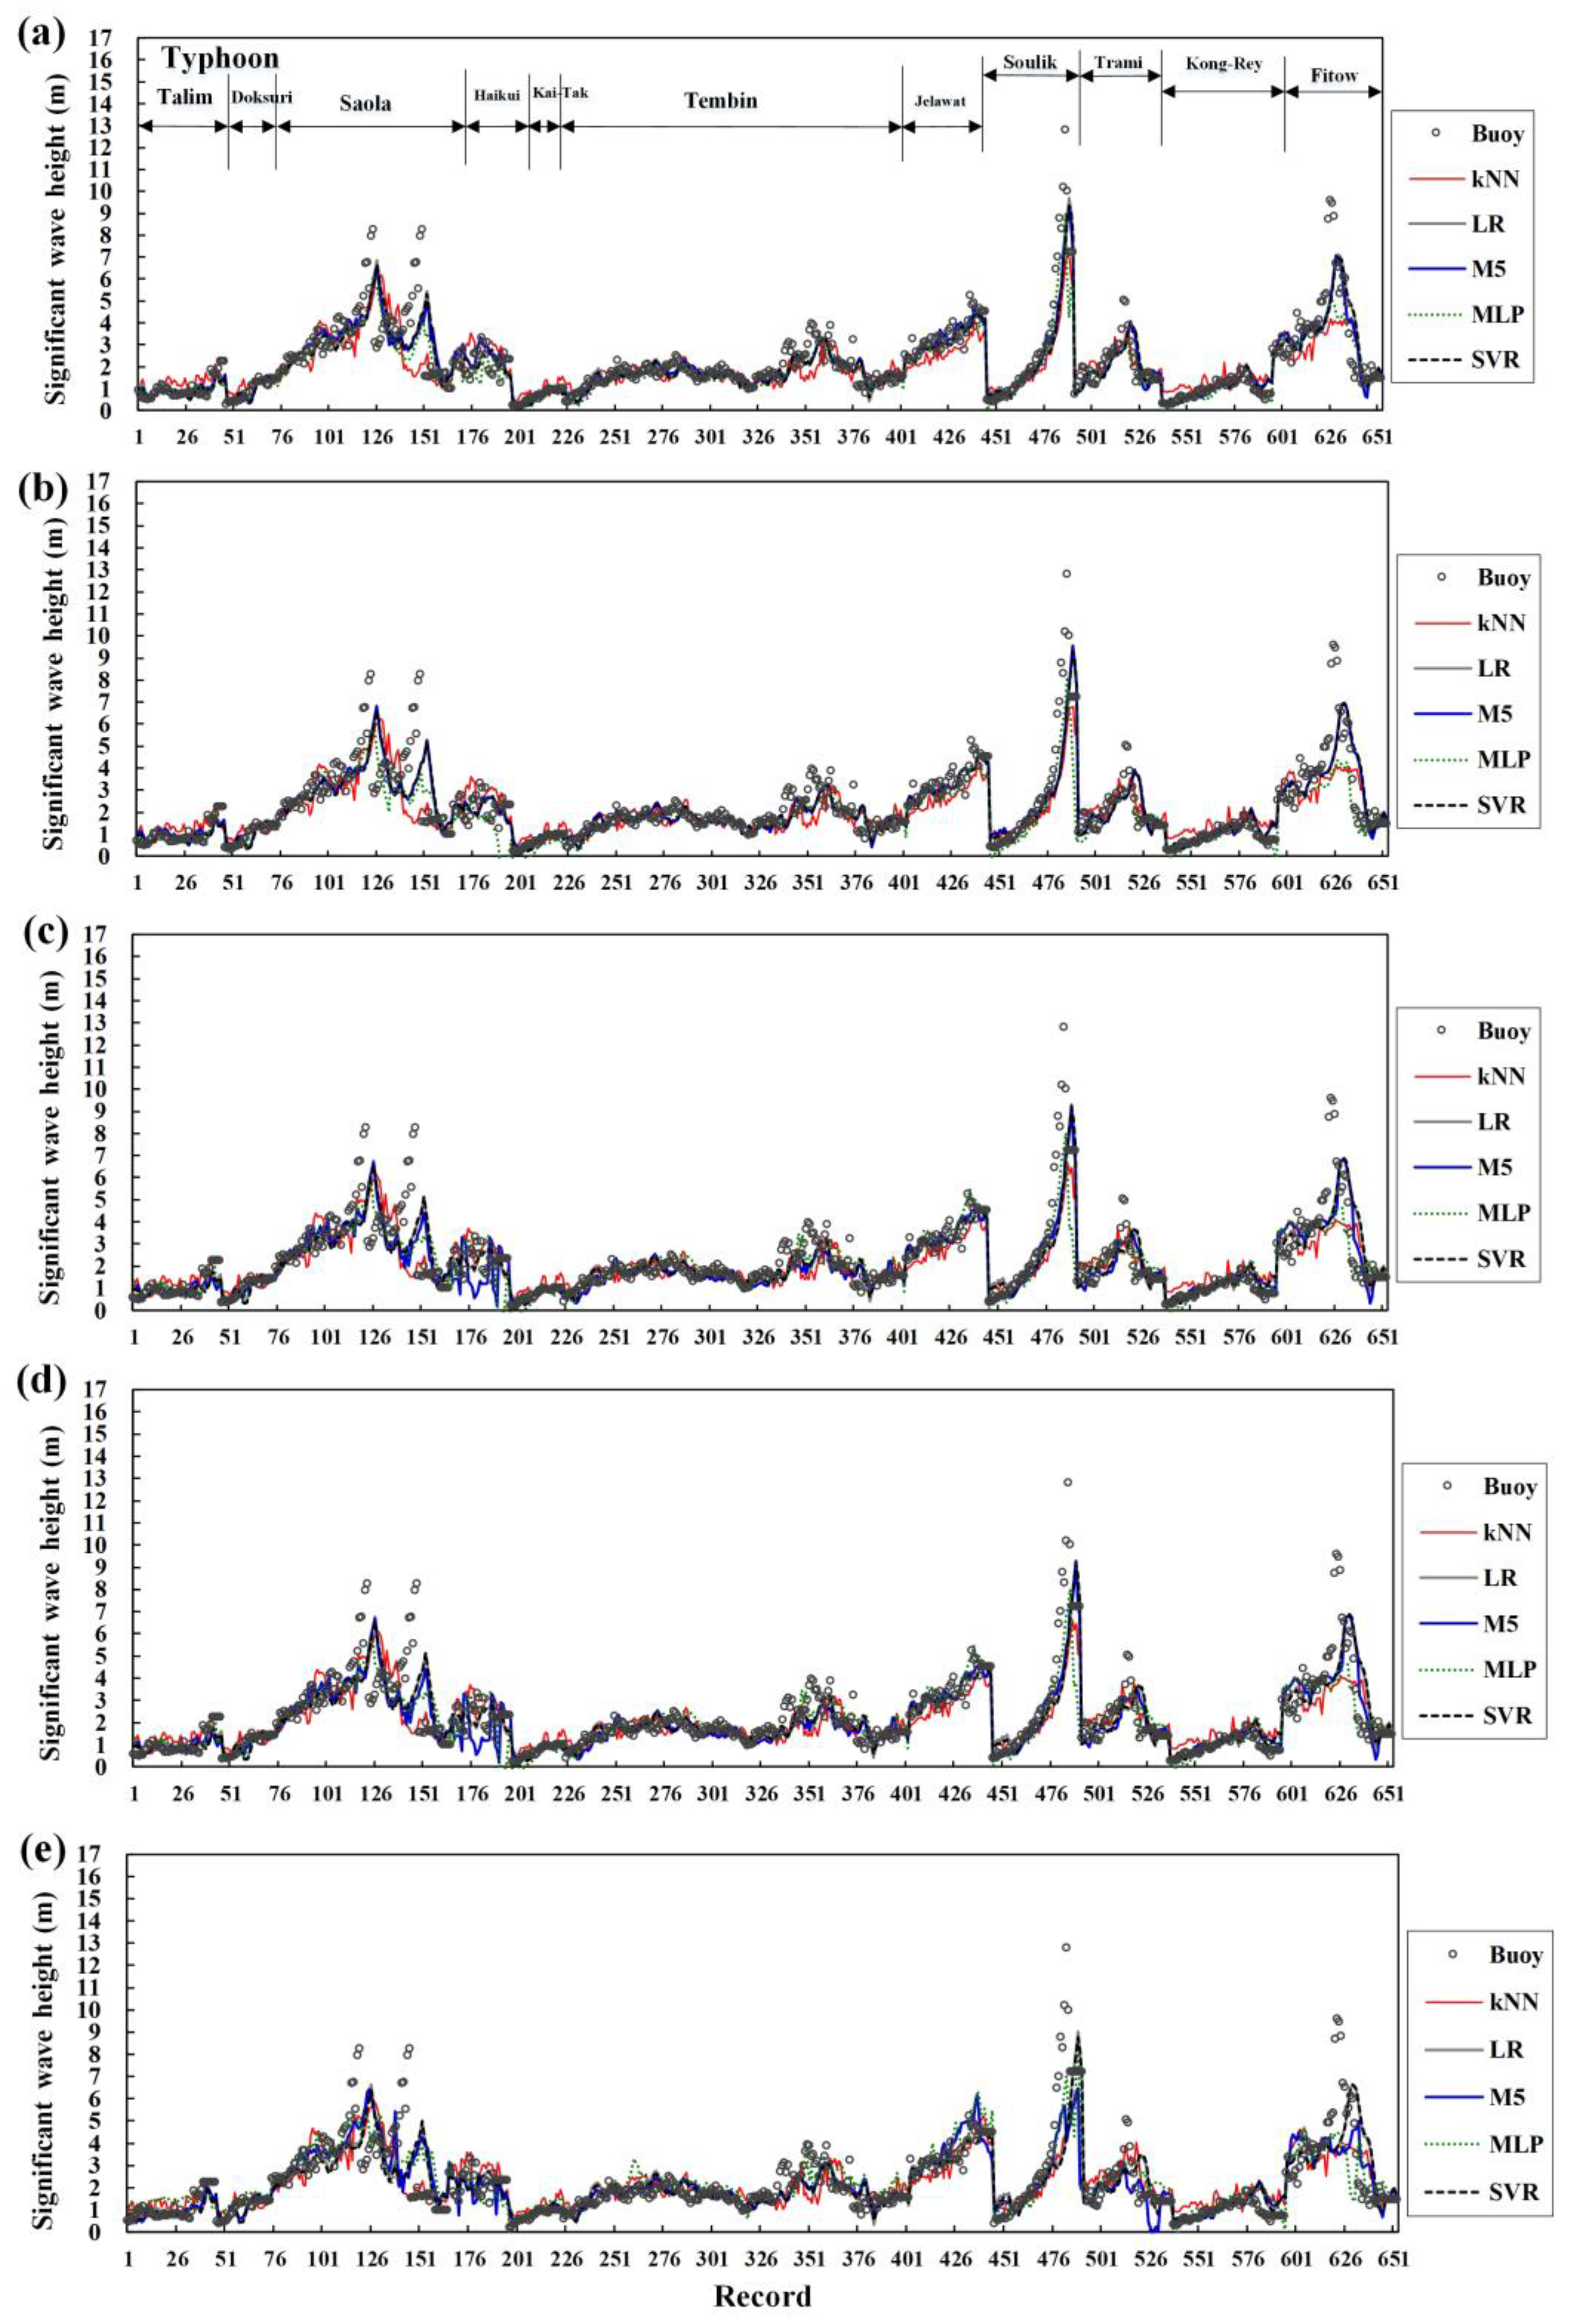
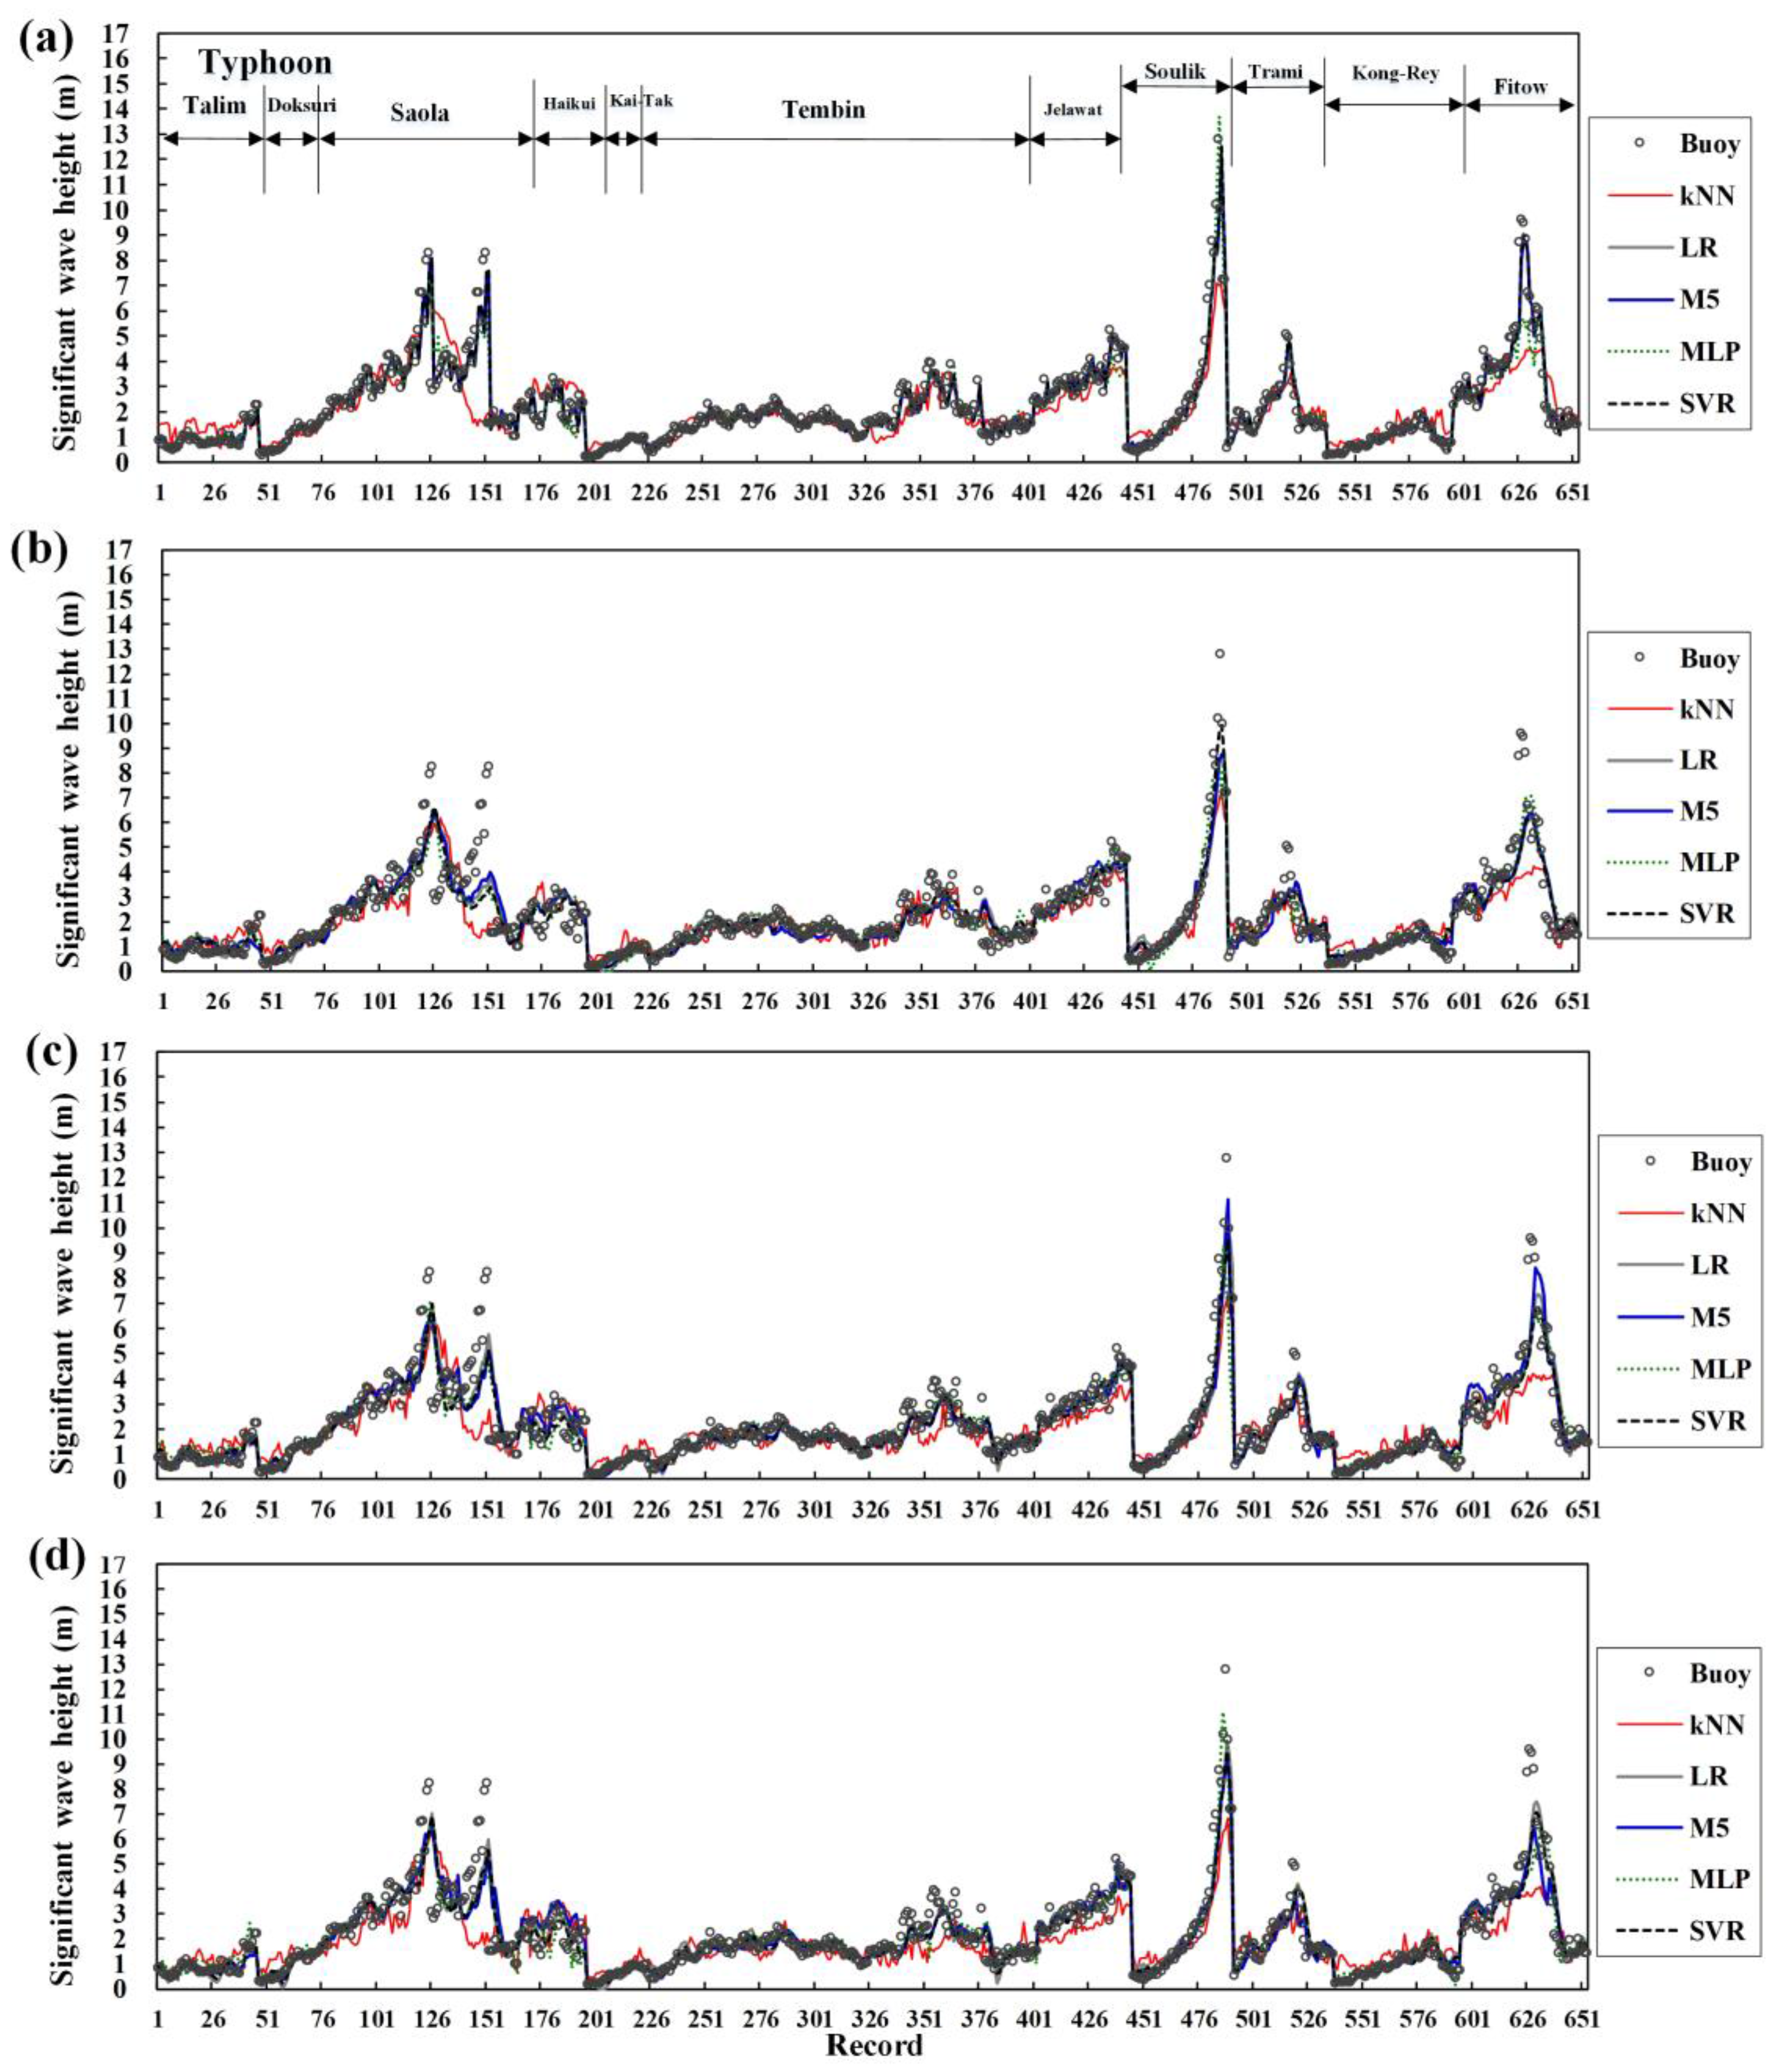
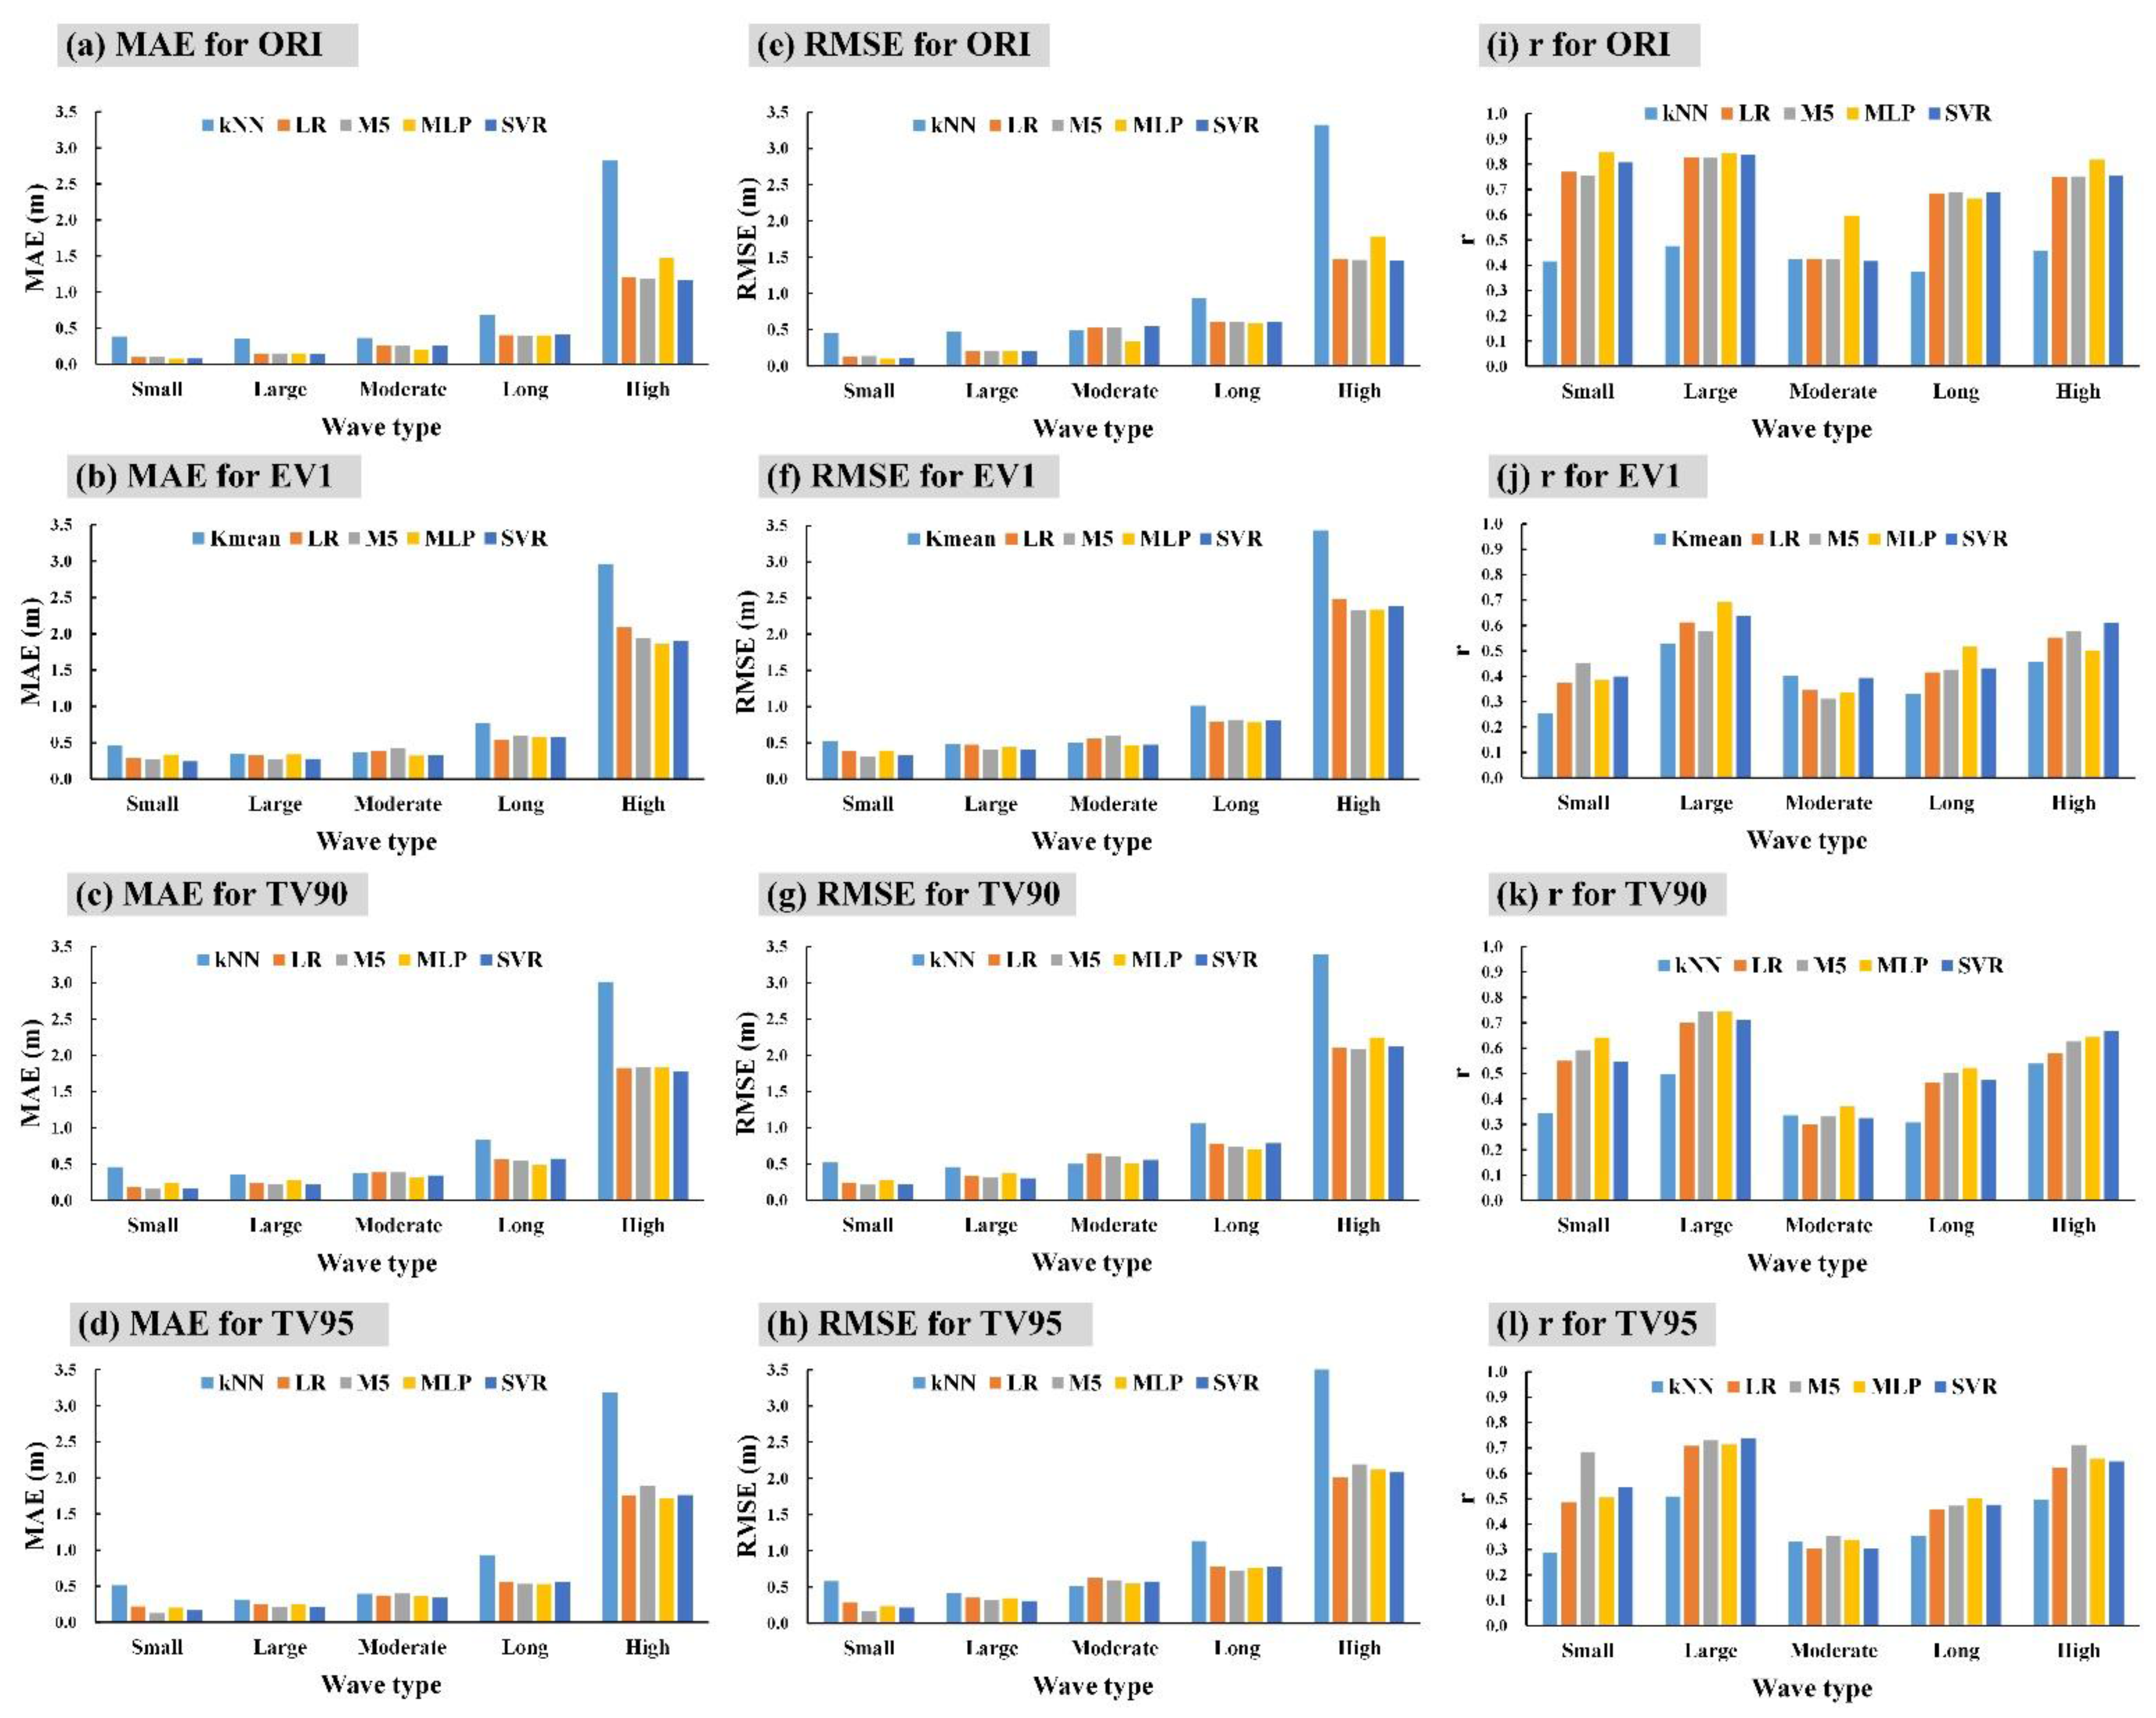
5.2. Performance of Classified Wave Heights
5.2.1. Error Measures
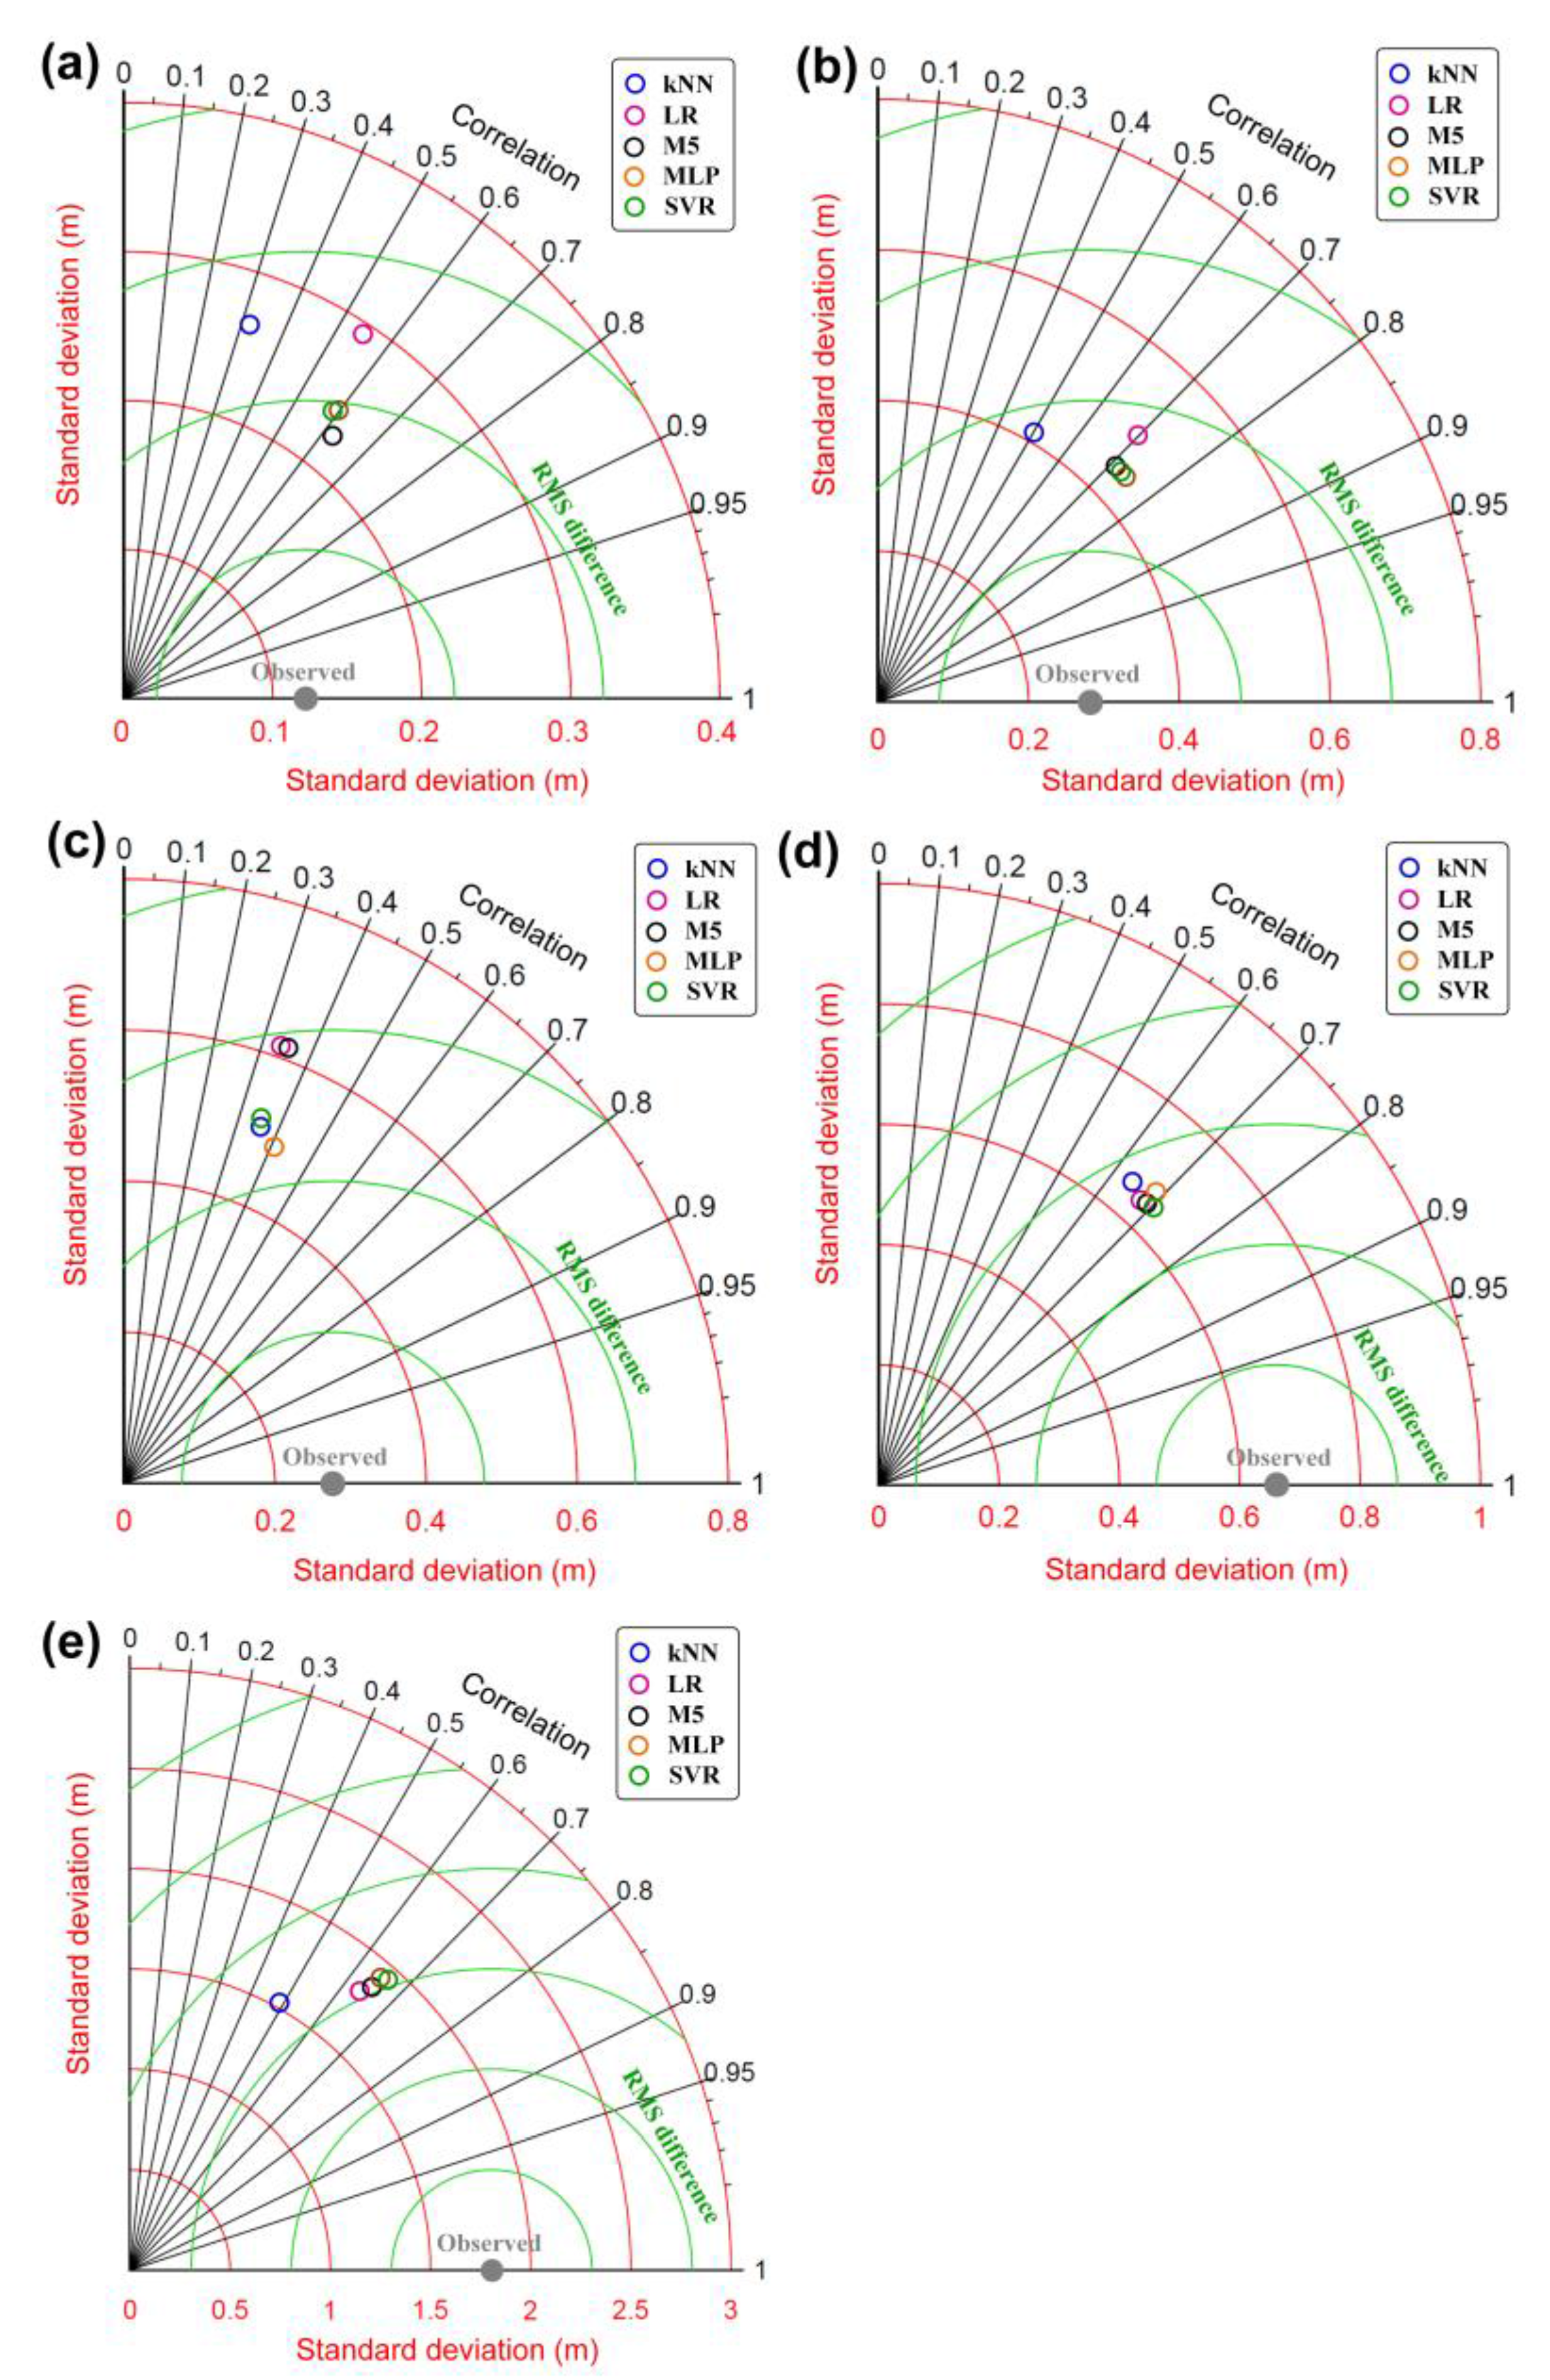
5.2.2. Performance Graphically Using Taylor Diagrams
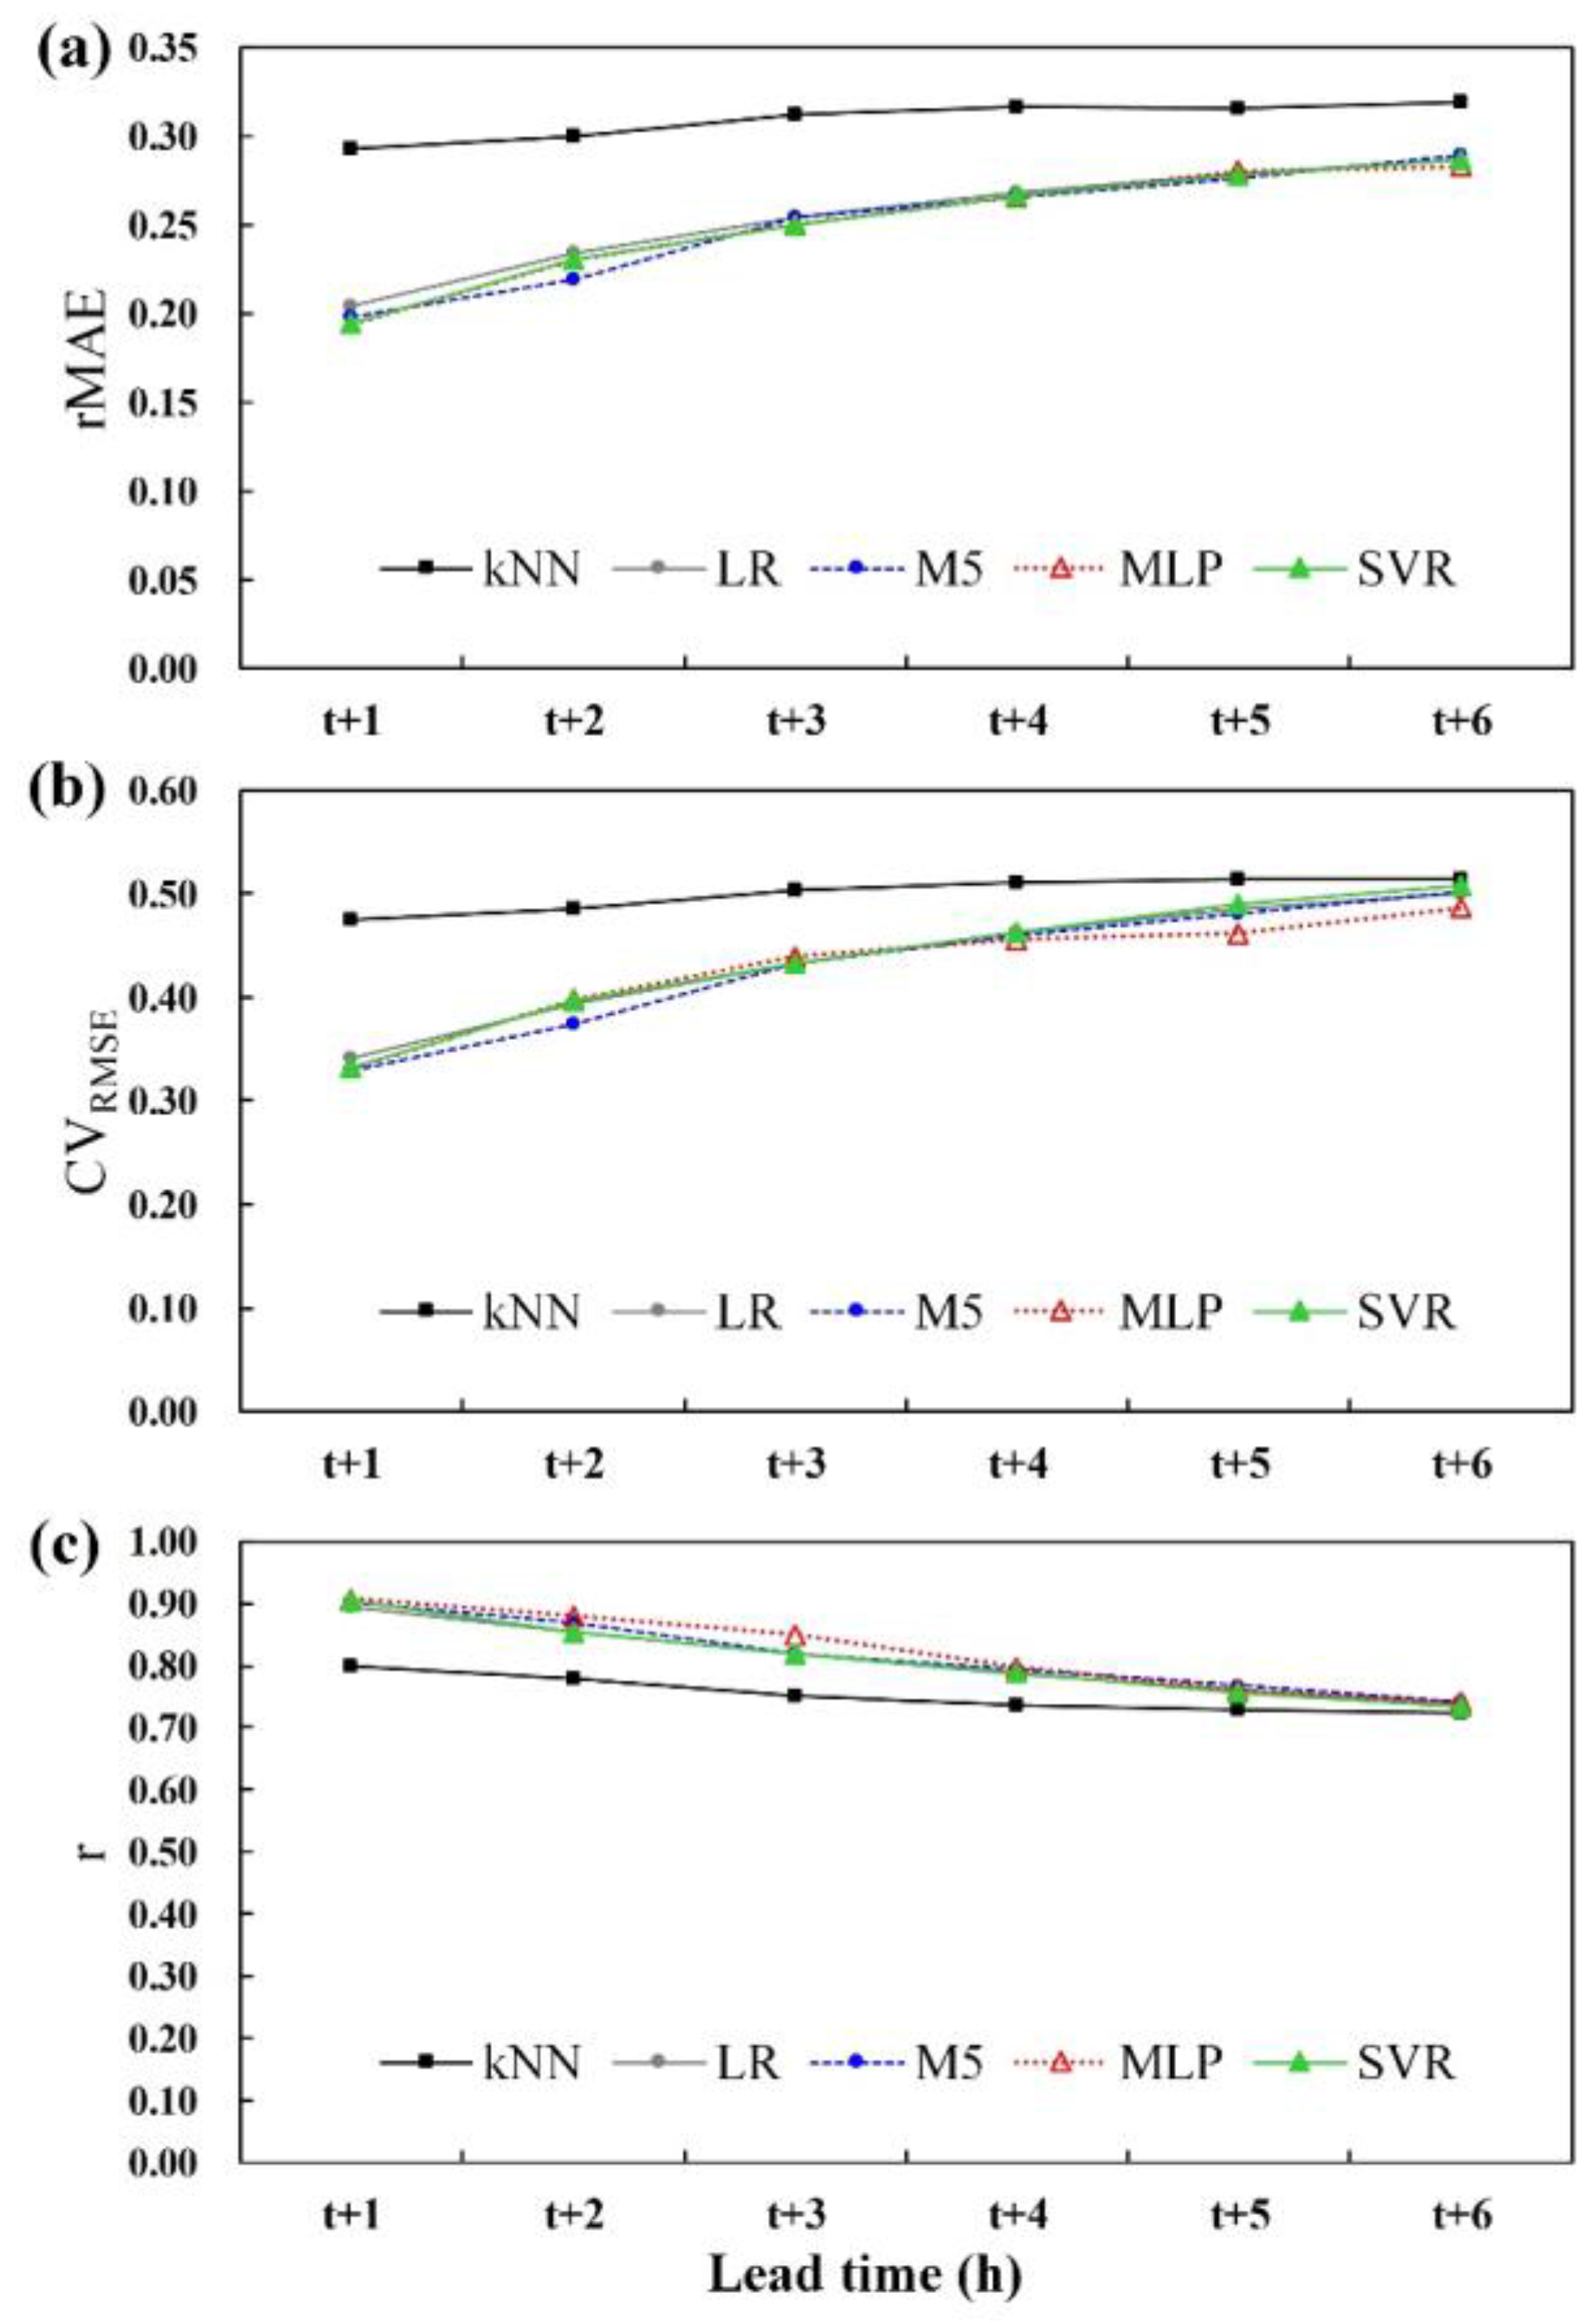
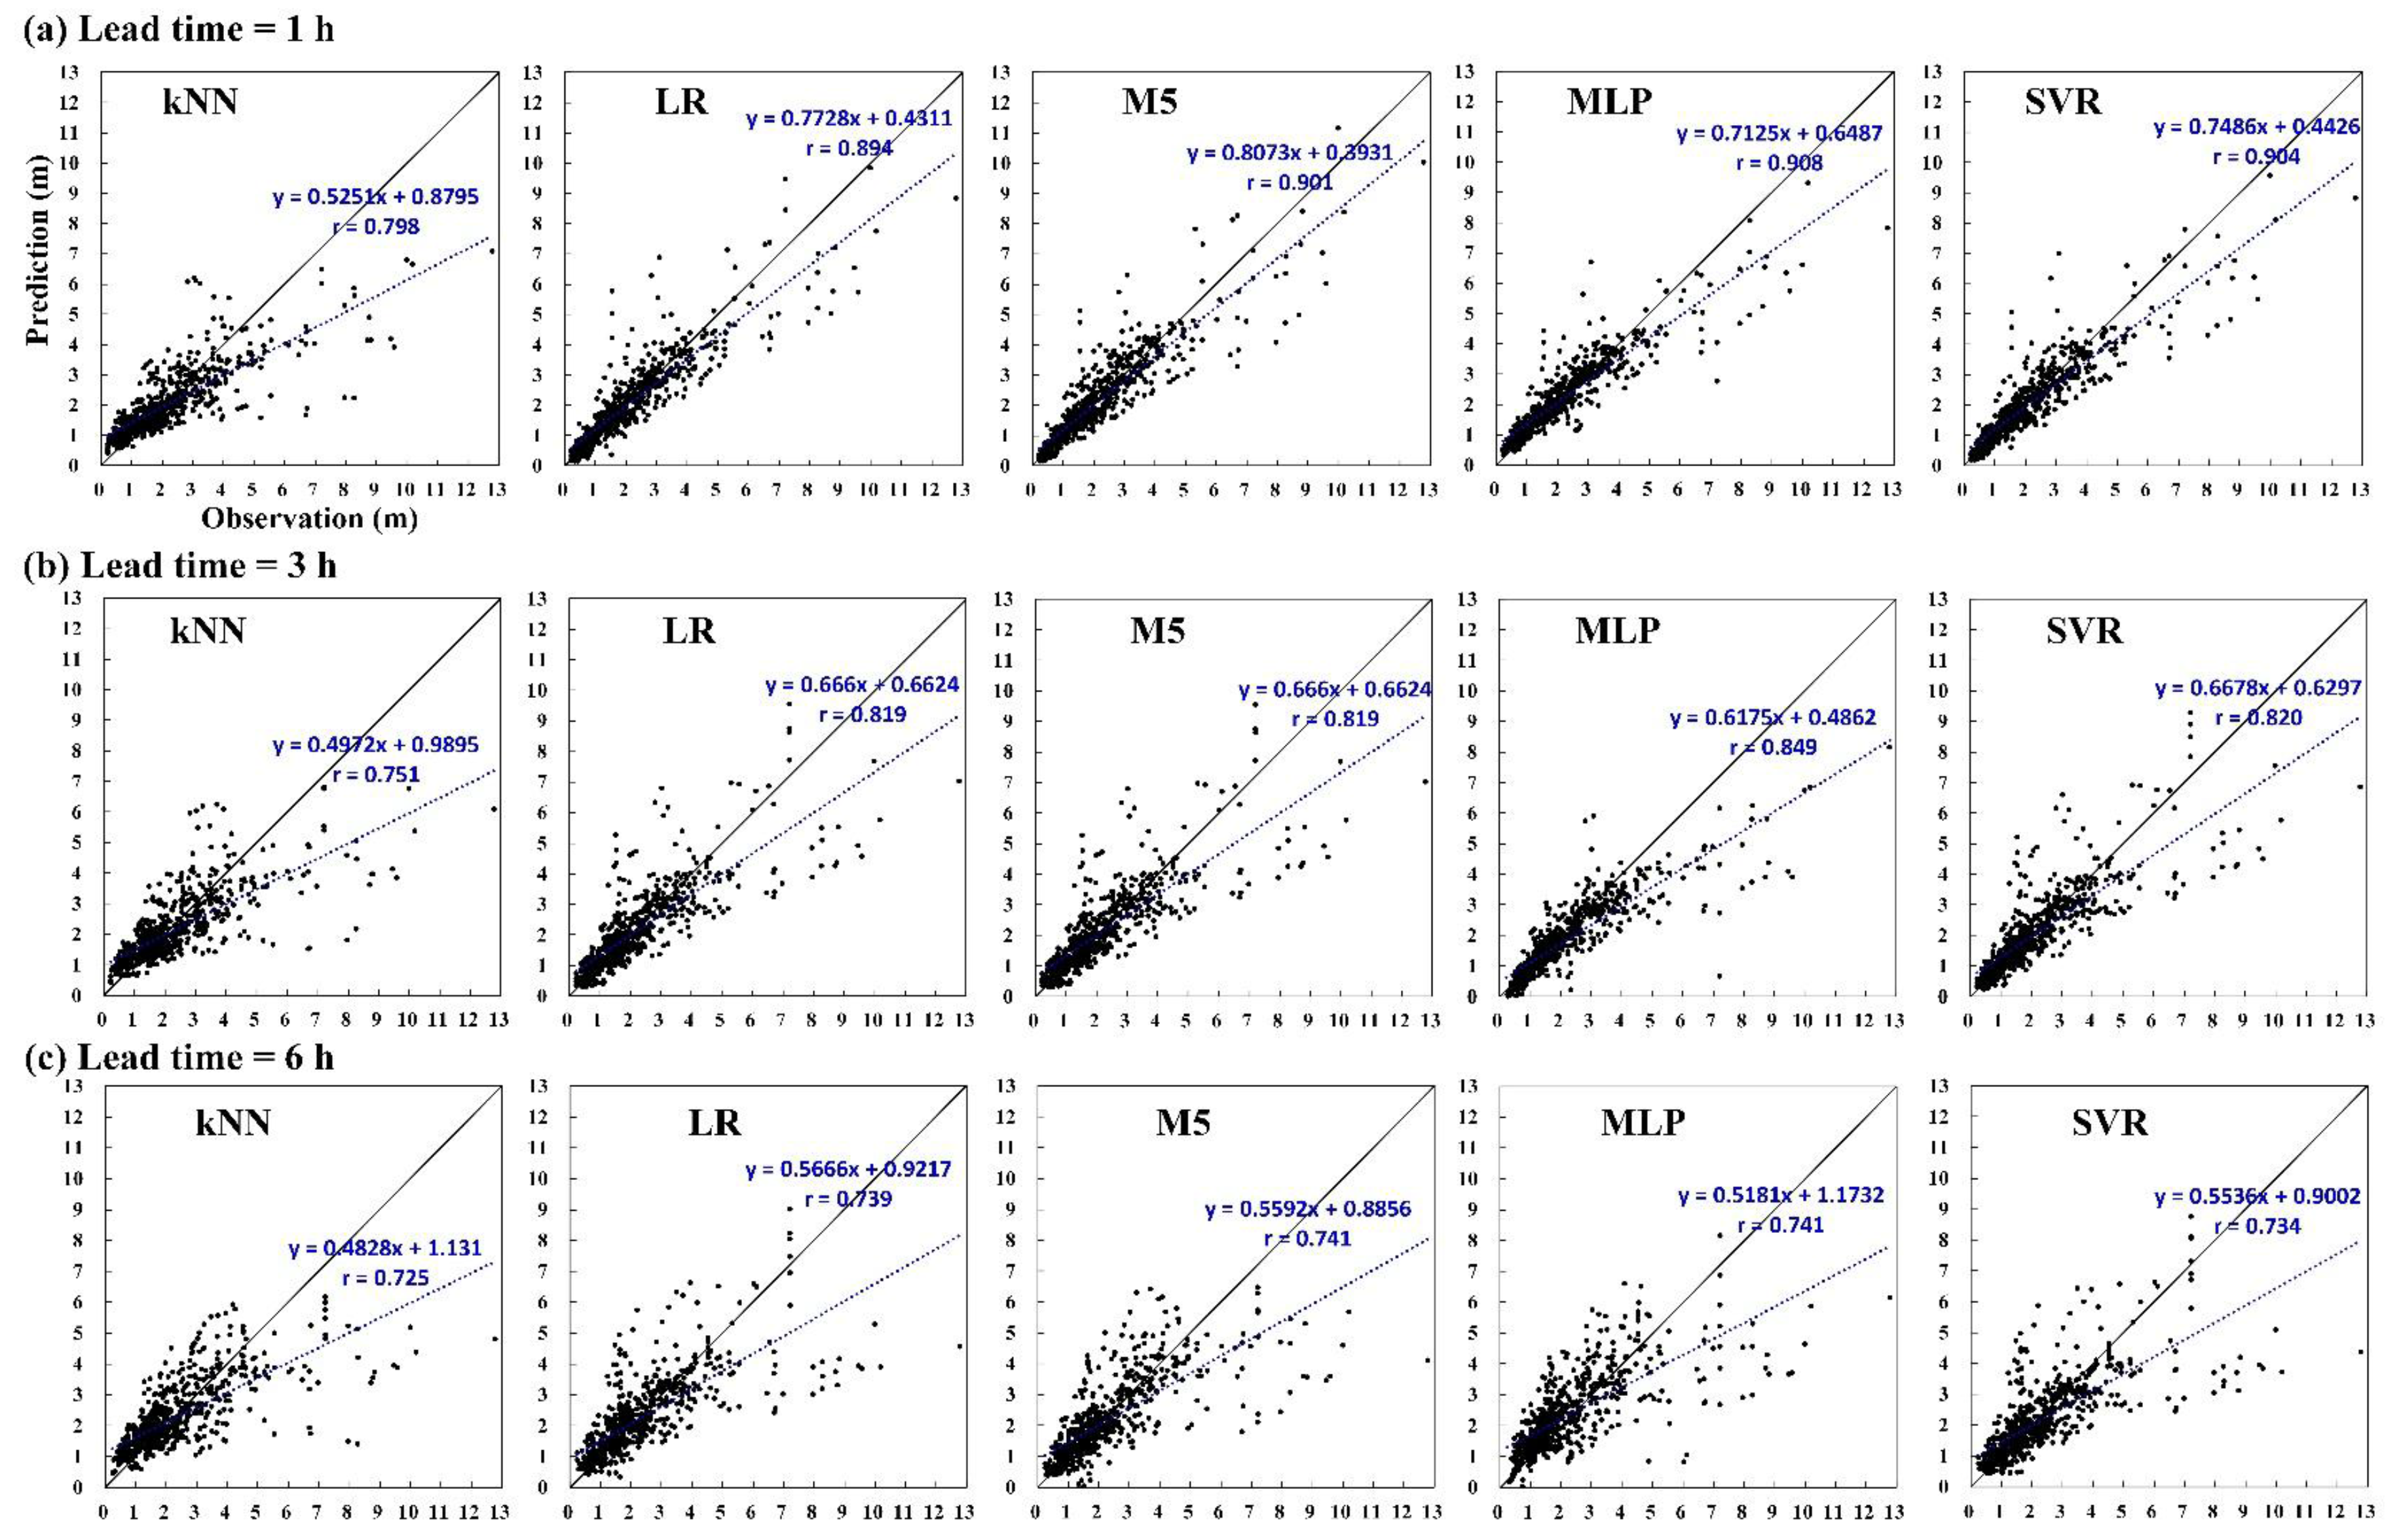
5.3. Evaluation of Various Lead Times
5.3.1. Error Measures
5.3.2. Effect of Ranking Average and Computational Complexity
6. Conclusions
Acknowledgments
Author Contributions
Conflicts of Interest
Appendix A. Typhoons Affecting Offshore Northeast Taiwan 2002–2013

| Typhoon | Period (yy/mm/dd) | Intensity | Typhoon | Period (yy/mm/dd) | Intensity |
|---|---|---|---|---|---|
| Rammasun | 2002/7/2–4 | Category 2 | Sepat | 2007/8/17–19 | Category 3 |
| Nakri | 2002/7/9–10 | Tropical storm | Mitag | 2007/11/26–27 | Category 1 |
| Sinlaku | 2002/9/4–8 | Category 1 | Kalmaegi | 2008/7/17−18 | Category 1 |
| Kujira | 2003/4/21–24 | Category 2 | Fung-Wong | 2008/7/27−29 | Category 2 |
| Nangka | 2003/6/1–3 | Tropical storm | Nuri | 2008/8/19–21 | Category 1 |
| Soudelor | 2003/6/16–18 | Category 1 | Sinlaku | 2008/9/12–14 | Category 3 |
| Imbudo | 2003/7/21–23 | Category 2 | Hagupit | 2008/9/21–23 | Category 2 |
| Morakot | 2003/8/2–4 | Tropical storm | Jangmi | 2008/9/27–29 | Category 3 |
| Vamco | 2003/8/19–20 | Tropical storm | Linfa | 2009/6/19–21 | Tropical storm |
| Krovanh | 2003/8/22–23 | Category 1 | Molave | 2009/7/16–18 | Tropical storm |
| Dujuan | 2003/8/31–9/2 | Category 2 | Morakot | 2009/8/5–10 | Category 1 |
| Melor | 2003/11/2–3 | Tropical storm | Parma | 2009/10/3–6 | Category 2 |
| Conson | 2004/6/7–9 | Category 1 | Namtheun | 2010/8/30–31 | Tropical storm |
| Mindulle | 2004/6/30–7/2 | Category 2 | Lionrock | 2010/8/31–9/2 | Tropical storm |
| Kompasu | 2004/7/14–15 | Tropical storm | Meranti | 2010/9/9–10 | Tropical storm |
| Rananim | 2004/8/10–13 | Category 1 | Fanapi | 2010/9/19–20 | Category 2 |
| Aere | 2004/8/24–26 | Category 1 | Megi | 2010/10/21–23 | Category 2 |
| Haima | 2004/9/12–13 | Tropical storm | Aere | 2011/5/9–10 | Tropical storm |
| Meari | 2004/9/26–27 | Category 1 | Songda | 2011/5/27–28 | Category 3 |
| Nanmadol | 2004/12/3–4 | Category 1 | Meari | 2011/6/23–25 | Tropical storm |
| Haitang | 2005/7/17–19 | Category 3 | Muifa | 2011/8/4–6 | Category 2 |
| Matsa | 2005/8/3–6 | Category 1 | Nanmadol | 2011/8/28–31 | Category 3 |
| Sanvu | 2005/8/11–13 | Tropical storm | Talim | 2012/6/19–21 | Tropical storm |
| Talim | 2005/8/31–9/1 | Category 3 | Doksuri | 2012/6/28–29 | Tropical storm |
| Damrey | 2005/9/21–23 | Tropical storm | Saola | 2012/7/31–8/3 | Category 1 |
| Longwang | 2005/10/1–3 | Category 3 | Haikui | 2012/8/6–7 | Category 1 |
| Chanchu | 2006/5/16–18 | Category 2 | Kai-Tak | 2012/8/14–15 | Tropical storm |
| Ewiniar | 2006/7/7–9 | Category 2 | Tembin | 2012/8/21–28 | Category 2 |
| Bilis | 2006/7/12–15 | Tropical storm | Jelawat | 2012/9/27–28 | Category 3 |
| Kaemi | 2006/7/24–26 | Category 1 | Soulik | 2013/7/11–13 | Category 3 |
| Bopha | 2006/8/8–9 | Tropical storm | Trami | 2013/8/20–22 | Tropical storm |
| Saomai | 2006/8/9–10 | Category 2 | Kong-Rey | 2013/8/27–29 | Tropical storm |
| Shanshan | 2006/9/14–16 | Category 2 | Fitow | 2013/10/4–7 | Category 1 |
| Pabuk | 2007/8/7–9 | Tropical storm | - | - | - |
References
- Wei, C.C. Improvement of typhoon precipitation forecast efficiency by coupling SSM/I microwave data with climatologic characteristics and precipitation. Weather Forecast. 2013, 28, 614–630. [Google Scholar] [CrossRef]
- Chen, W.B.; Liu, W.C.; Hsu, M.H. Predicting typhoon-induced storm surge tide with a two-dimensional hydrodynamic model and artificial neural network model. Nat. Hazards Earth Syst. Sci. 2012, 12, 3799–3809. [Google Scholar] [CrossRef]
- Tsai, H.C.; Lee, T.H. Maximum covariance analysis of typhoon surface wind and rainfall relationships in Taiwan. J. Appl. Meteorol. Climatol. 2009, 48, 997–1016. [Google Scholar] [CrossRef]
- Wu, C.C.; Kuo, Y.H. Typhoons affecting Taiwan: Current understanding and future challenges. Bull. Am. Meteorol. Soc. 1999, 80, 67–80. [Google Scholar] [CrossRef]
- Chang, C.P.; Yeh, T.C.; Chen, J.M. Effects of terrain on the surface structure of typhoons over Taiwan. Mon. Weather Rev. 1993, 121, 734–752. [Google Scholar] [CrossRef]
- Tsay, C.Y. Orography effects on the structure of typhoons: Analyses of two typhoons crossing Taiwan. Terr. Atmos. Ocean. Sci. 1994, 5, 313–333. [Google Scholar] [CrossRef]
- Wei, C.C. Surface wind nowcasting in Penghu Islands based on classified typhoon tracks and the effects of the Central Mountain Range of Taiwan. Weather Forecast. 2014, 29, 1425–1450. [Google Scholar] [CrossRef]
- Wu, C.C.; Yen, T.H.; Kuo, Y.H.; Wang, W. Rainfall simulation associated with Typhoon Herb (1996) near Taiwan. Part I: The topographic effect. Weather Forecast. 2002, 17, 1001–1015. [Google Scholar] [CrossRef]
- Chiu, F.C.; Huang, W.Y.; Tiao, W.C. The spatial and temporal characteristics of the wave energy resources around Taiwan. Renew. Energy 2013, 52, 218–221. [Google Scholar] [CrossRef]
- Feng, X.; Zheng, J.; Yan, Y. Wave spectra assimilation in typhoon wave modeling for the East China Sea. Coast. Eng. 2012, 69, 29–41. [Google Scholar] [CrossRef]
- Zamani, A.; Solomatine, D.; Azimian, A.; Heemink, A. Learning from data for wind-wave forecasting. Ocean Eng. 2008, 35, 953–962. [Google Scholar] [CrossRef]
- Aminzadeh-Gohari, A.; Bahai, H.; Bazargan, H. Simulation of significant wave height by neural networks and its application to extreme wave analysis. J. Atmos. Ocean. Technol. 2009, 26, 778–792. [Google Scholar] [CrossRef]
- Chang, H.K.; Liou, J.C.; Liu, S.J.; Liaw, S.R. Simulated wave-driven ANN model for typhoon waves. Adv. Eng. Softw. 2011, 42, 25–34. [Google Scholar] [CrossRef]
- Clarizia, M.P.; Ruf, C.S. Bayesian wind speed estimation conditioned on significant wave height for GNSS-R ocean observations. J. Atmos. Ocean. Technol. 2017, 34, 1193–1202. [Google Scholar] [CrossRef]
- Makarynskyy, O.; Pires-Silva, A.A.; Makarynska, D.; Ventura-Soares, C. Artificial neural networks in wave predictions at the west coast of Portugal. Comput. Geosci. 2005, 31, 415–424. [Google Scholar] [CrossRef]
- Londhe, S.N. Soft computing approach for real-time estimation of missing wave heights. Ocean Eng. 2008, 35, 1080–1089. [Google Scholar] [CrossRef]
- Etemad-Shahidi, A.; Mahjoobi, J. Comparison between M5’ model tree and neural networks for prediction of significant wave height in Lake Superior. Ocean Eng. 2009, 36, 1175–1181. [Google Scholar] [CrossRef]
- Tsai, J.C.; Tsai, C.H. Wave measurements by pressure transducers using artificial neural networks. Ocean Eng. 2009, 36, 1149–1157. [Google Scholar] [CrossRef]
- Deka, P.C.; Prahlada, R. Discrete wavelet neural network approach in significant wave height forecasting for multistep lead time. Ocean Eng. 2012, 43, 32–42. [Google Scholar] [CrossRef]
- Asma, S.; Sezer, A.; Ozdemir, O. MLR and ANN models of significant wave height on the west coast of India. Comput. Geosci. 2012, 49, 231–237. [Google Scholar] [CrossRef]
- Monahan, A.H. Nonlinear principal component analysis by neural networks: Theory and applications to the Lorenz system. J. Clim. 2000, 13, 821–835. [Google Scholar] [CrossRef]
- Lu, W.Z.; Wang, W.J.; Wang, X.K.; Yan, S.H.; Lam, J.C. Potential assessment of a neural network model with PCA/RBF approach for forecasting pollutant trends in Mong Kok urban air, Hong Kong. Environ. Res. 2004, 96, 79–87. [Google Scholar] [CrossRef] [PubMed]
- Ture, M.; Kurt, I.; Akturk, Z. Comparison of dimension reduction methods using patient satisfaction data. Expert Syst. Appl. 2007, 32, 422–426. [Google Scholar] [CrossRef]
- Wei, C.C. RBF neural networks combined with principal component analysis applied to quantitative precipitation forecast for a reservoir watershed during typhoon periods. J. Hydrometeorol. 2012, 13, 722–734. [Google Scholar] [CrossRef]
- Toussaint, G.T. Geometric proximity graphs for improving nearest neighbor methods in instance-based learning and data mining. Int. J. Comput. Geom. Appl. 2005, 15, 101–150. [Google Scholar] [CrossRef]
- Quinlan, R.J. Learning with Continuous Classes. In Proceedings of the 5th Australian Joint Conference on Artificial Intelligence, Hobart, Australia, 16–18 November 1992; pp. 343–348. [Google Scholar]
- Vapnik, V. The Nature of Statistical Learning Theory; Springer: New York, NY, USA, 1995. [Google Scholar]
- Liu, P.C.; Tsai, C.H.; Chen, H.S. On the growth of ocean waves. Ocean Eng. 2007, 34, 1472–1480. [Google Scholar] [CrossRef]
- Liu, R.X.; Kuang, J.; Gong, Q.; Hou, X.L. Principal component regression analysis with SPSS. Comput. Methods Programs Biomed. 2003, 71, 141–147. [Google Scholar] [CrossRef]
- Saegusa, R.; Sakano, H.; Hashimoto, S. Nonlinear principal component analysis to preserve the order of principal components. Neurocomputing 2004, 61, 57–70. [Google Scholar] [CrossRef]
- Pearson, K. On lines and planes of closest fit to systems of points in spaces. Philos. Mag. 1901, 2, 559–572. [Google Scholar] [CrossRef]
- Hotelling, H. Analysis of a complex of statistical variables into principal components. J. Educ. Psychol. 1933, 24, 417–441. [Google Scholar] [CrossRef]
- Richards, J.E. Recovering dipole sources from scalp-recorded event-related-potentials using component analysis: Principal component analysis and independent component analysis. Int. J. Psychophysiol. 2004, 54, 201–220. [Google Scholar] [CrossRef] [PubMed]
- Chae, S.S.; Warde, W.D. Effect of using principal coordinates and principal components on retrieval of clusters. Comput. Stat. Data Anal. 2006, 50, 1407–1417. [Google Scholar] [CrossRef]
- Liaw, Y.C.; Wu, C.M.; Leou, M.L. Fast k-nearest neighbors search using modified principal axis search tree. Digit. Signal Process. 2010, 20, 1494–1501. [Google Scholar] [CrossRef]
- Bremner, D.; Demaine, E.; Erickson, J.; Iacono, J.; Langerman, S.; Morin, P.; Toussaint, G. Output-sensitive algorithms for computing nearest-neighbor decision boundaries. Discret. Comput. Geom. 2005, 33, 593–604. [Google Scholar] [CrossRef]
- Atkeson, C.G.; Moore, A.W.; Schaal, S. Locally weighted learning. Artif. Intell. Rev. 1997, 11, 11–73. [Google Scholar] [CrossRef]
- Finley, A.O.; McRoberts, R.E. Efficient k-nearest neighbor searches for multi-source forest attribute mapping. Remote Sens. Environ. 2008, 112, 2203–2211. [Google Scholar] [CrossRef]
- Blaker, H. Minimax estimation in linear regression under restrictions. J. Stat. Plan. Inference 2000, 90, 35–55. [Google Scholar] [CrossRef]
- Wei, C.C. Comparing single- and two-segment statistical models with a conceptual rainfall-runoff model for river streamflow prediction during typhoons. Environ. Model. Softw. 2016, 85, 112–128. [Google Scholar] [CrossRef]
- Holmes, G.; Hall, M.; Frank, E. Generating Rule Sets from Model Trees. In Proceedings of the Twelfth Australian Joint Conference on Artificial Intelligence, Sydney, Australia, 6–10 December 1999; pp. 1–12. [Google Scholar]
- Wang, Y.; Witten, I.H. Induction of Model Trees for Predicting Continuous Classes. In Poster Papers of the 9th European Conference on Machine Learning; Springer: Prague, Czech Republic, 1997. [Google Scholar]
- Javadi, A.A. Estimation of air losses in compressed air tunneling using neural network. Tunn. Undergr. Space Technol. 2006, 21, 9–20. [Google Scholar] [CrossRef]
- Lin, C.; Wei, C.C.; Tsai, C.C. Prediction of the influential operational compost parameters for monitoring composting process. Environ. Eng. Sci. 2016, 33, 494–506. [Google Scholar] [CrossRef]
- Patra, J.C.; van den Bos, A. Auto-calibration and -compensation of a capacitive pressure sensor using multilayer perceptrons. ISA Trans. 2000, 39, 175–190. [Google Scholar] [CrossRef]
- Iphar, M. ANN and ANFIS performance prediction models for hydraulic impact hammers. Tunn. Undergr. Space Technol. 2012, 27, 23–29. [Google Scholar] [CrossRef]
- Wei, C.C.; Hsu, N.S.; Huang, C.L. Rainfall-runoff prediction using dynamic typhoon information and surface weather characteristics considering monsoon effects. Water Resour. Manag. 2016, 30, 877–895. [Google Scholar] [CrossRef]
- Kaiser, H.F. The application of electronic computers to factor analysis. Educ. Psychol. Meas. 1960, 20, 141–151. [Google Scholar] [CrossRef]
- Trenn, S. Multilayer perceptrons: Approximation order and necessary number of hidden units. IEEE Trans. Neural Netw. 2008, 19, 836–844. [Google Scholar] [CrossRef] [PubMed]
- Taylor, K.E. Summarizing multiple aspects of model performance in a single diagram. J. Geophys. Res. 2001, 106, 7183–7192. [Google Scholar] [CrossRef]
- Hand, D.; Mannila, P.; Smyth, P. Principles of Data Mining; MIT Press: Cambridge, MA, USA, 2001. [Google Scholar]
- Shafiullah, G.M. Hybrid renewable energy integration (HREI) system for subtropical climate in Central Queensland, Australia. Renew. Energy 2016, 96, 1034–1053. [Google Scholar] [CrossRef]
- Ali, A.B.M.S.; Smith, K.A. On learning algorithm selection for classification. Appl. Soft Comput. 2006, 6, 119–138. [Google Scholar] [CrossRef]
- Shafiullah, G.M.; Amanullah, M.T.O.; Ali, A.B.M.S.; Jarvis, D.; Wolfs, P. Prospects of renewable energy—A feasibility study in the Australian context. Renew. Energy 2012, 39, 183–197. [Google Scholar] [CrossRef]


| Wind Intensity Scale | Ranges | Event Amounts | |
|---|---|---|---|
| Saffir–Simpson wind category | Category 5 | ≥70 m/s | 0 |
| Category 4 | 58–70 m/s | 0 | |
| Category 3 | 50–58 m/s | 10 | |
| Category 2 | 43–50 m/s | 16 | |
| Category 1 | 33–43 m/s | 17 | |
| Additional classifications | Tropical storm | 18–33 m/s | 24 |
| Tropical depression | <18 m/s | 0 | |
| Attribute | Min–Max, Mean | Attribute | Min–Max, Mean | Attribute | Min–Max, Mean |
|---|---|---|---|---|---|
| h1 | 15.0–28.5, 22.5 | m2,1 | 950.2–1007.4, 990.6 | m3,7 | 0.1–25.2, 3.8 |
| h2 | 113.9–131.4, 122.4 | m2,2 | 961.6–1019.7, 1002.5 | m3,8 | 0.0–360.0, 161.8 |
| h3 | 910.0–1000.0, 966.8 | m2,3 | 16.4–32.7, 26.3 | m3,9 | 0.0–70.5, 1.8 |
| h4 | 0.0–300.0, 201.1 | m2,4 | 13.7–29.3, 24.2 | m3,10 | 0.0–1.0, 0.4 |
| h5 | 0.0–50.0, 16.5 | m2,5 | 58.0–100.0, 88.7 | m3,11 | 0.0–3.8, 0.4 |
| h6 | 15.0–55.0, 33.6 | m2,6 | 15.7–40.8, 30.4 | p1 | 1.1–26.7, 7.0 |
| m1,1 | 956.9–1014.8, 998.5 | m2,7 | 0.0–50.3, 11.7 | p2 | 1.0–360.0, 174.5 |
| m1,2 | 959.9–1018.1, 1001.6 | m2,8 | 0.0–360.0, 130.1 | p3 | 1.6–36.1, 10.4 |
| m1,3 | 15.6–36.7, 27.4 | m2,9 | 0.0–186.0, 1.4 | p4 | 16.1–30.6, 26.4 |
| m1,4 | 14.5–27.4, 23.4 | m2,10 | 0.0–1.0, 0.3 | p5 | 955.6–1017.4, 1001.2 |
| m1,5 | 49.0–100.0, 79.6 | m2,11 | 0.0–3.9, 0.5 | b1 | 0.2–12.8, 2.2 |
| m1,6 | 16.5–36.5, 28.9 | m3,1 | 954.5–1018.0, 1000.7 | b2 | 28.0–193.0, 102.2 |
| m1,7 | 0.0–24.0, 4.9 | m3,2 | 955.4–1018.9, 1001.6 | b3 | 33.0–129.0, 67.5 |
| m1,8 | 0.0–360.0, 123.1 | m3,3 | 17.0–38.1, 27.3 | b4 | 11.0–337.0, 90.4 |
| m1,9 | 0.0–75.5, 1.4 | m3,4 | 14.7–28.9, 23.6 | b5 | 0.0–33.9, 26.8 |
| m1,10 | 0.0–1.0, 0.4 | m3,5 | 38.0–100.0, 81.0 | - | - |
| m1,11 | 0.0–3.9, 0.4 | m3,6 | 16.7–39.8, 29.2 | - | - |
| Performance | kNN | LR | M5 | MLP | SVR |
|---|---|---|---|---|---|
| Time (s) | 1.5 | 0.2 | 3.9 | 75.8 | 169.6 |
| RMSE (m) | 1.034 | 0.712 | 0.699 | 0.691 | 0.694 |
| Performance | kNN | LR | M5 | MLP | SVR |
|---|---|---|---|---|---|
| rMAE | 0.309 | 0.254 | 0.252 | 0.251 | 0.251 |
| CVRMSE | 0.500 | 0.436 | 0.432 | 0.429 | 0.437 |
| r | 0.753 | 0.809 | 0.816 | 0.823 | 0.809 |
© 2017 by the author. Licensee MDPI, Basel, Switzerland. This article is an open access article distributed under the terms and conditions of the Creative Commons Attribution (CC BY) license (http://creativecommons.org/licenses/by/4.0/).
Share and Cite
Wei, C.-C. Nearshore Wave Predictions Using Data Mining Techniques during Typhoons: A Case Study near Taiwan’s Northeastern Coast. Energies 2018, 11, 11. https://doi.org/10.3390/en11010011
Wei C-C. Nearshore Wave Predictions Using Data Mining Techniques during Typhoons: A Case Study near Taiwan’s Northeastern Coast. Energies. 2018; 11(1):11. https://doi.org/10.3390/en11010011
Chicago/Turabian StyleWei, Chih-Chiang. 2018. "Nearshore Wave Predictions Using Data Mining Techniques during Typhoons: A Case Study near Taiwan’s Northeastern Coast" Energies 11, no. 1: 11. https://doi.org/10.3390/en11010011
APA StyleWei, C.-C. (2018). Nearshore Wave Predictions Using Data Mining Techniques during Typhoons: A Case Study near Taiwan’s Northeastern Coast. Energies, 11(1), 11. https://doi.org/10.3390/en11010011