Introduction
Given our goal of a computational explanation of the relationship among visual attention, interpretation of visual stimuli and eye movements, it is natural to begin with a look at past efforts that may play the role of foundations. However, the number of models of visual attention and of eye movement control is numbingly large. Even after conscientious reading of this literature, one is still left with the question “How are attention and eye movements related?” One summary account is due to Kowler (2011). Kowler asserts that attention is important for the control of saccades as well as for smooth pursuit. Further, a selective filter is required to choose among all the possible targets of eye movements, and on choosing a target, to attenuate the remaining signals. She points out that the role of perceptual salience is one of allowing potential targets to stand out but that the generation of saccades requires a higher-level process, one that makes a top-down decision and includes intention. As will be clear as our development unfolds, we agree with this perspective and the model we develop does indeed contain such multiple levels of processing. Finally, Kowler also poses a nice set of goals for future research: What determines the decisions made about where to look? How are these decisions carried out? How do we maintain the percept of a clear and stable world despite the occurrence of saccades?
Kowler thus provides us with a springboard; however, these statements do not have the depth and detail needed for the development of a computational account whose performance can be examined and tested. Here, we will consider just one of Kowler’s questions, ‘what determines the decisions made about where to look?’, hoping to add the needed computational detail. And even for this, we will be able to address only part of it.
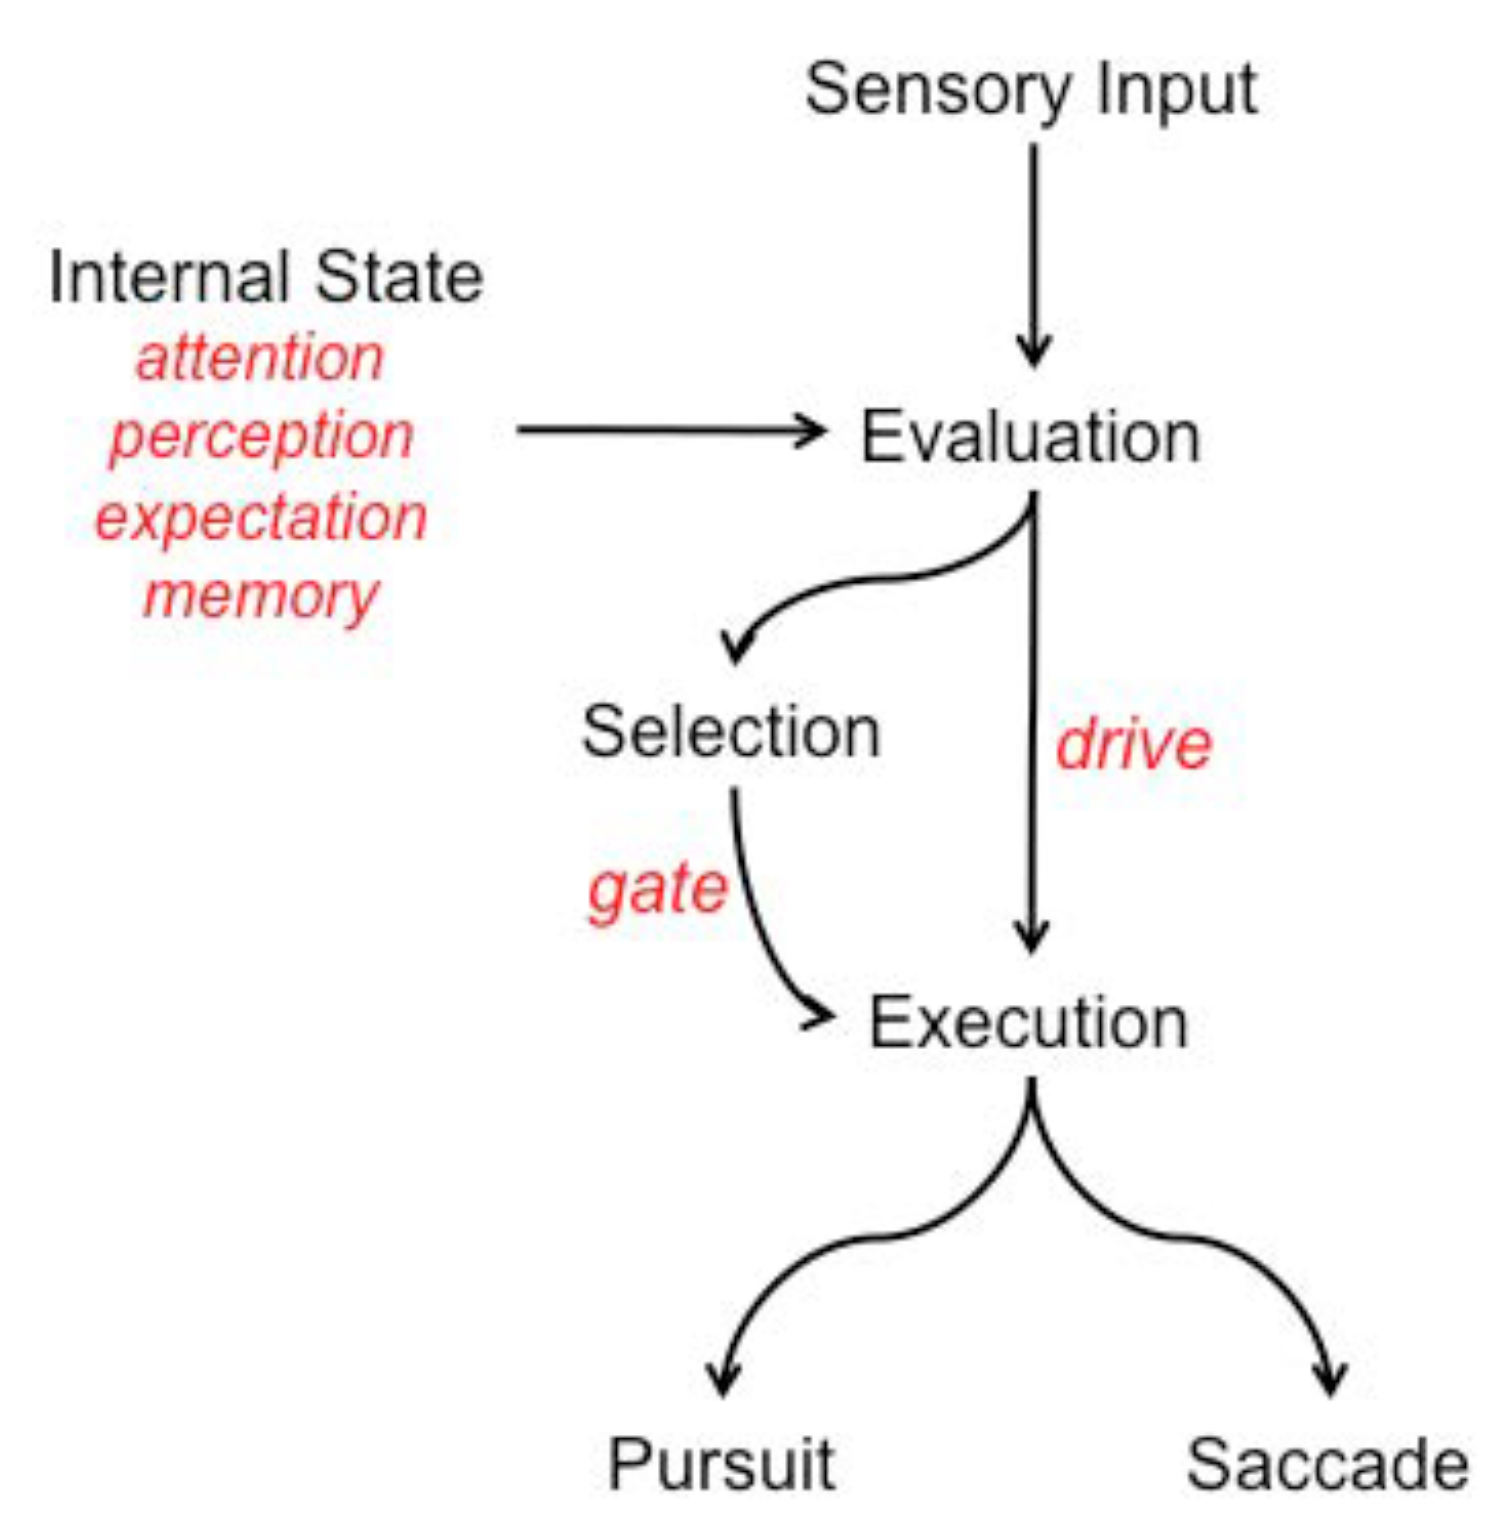
Among the many previous conceptualizations of eye movement processing is one by Krauzlis (2005), and figures from that paper are adapted in our
Figure 1 and
Figure 2. In
Figure 1 we show the set of neural pathways Krauzlis considers important for both saccadic and pursuit eye movements, drawing a connection between these as did Kowler and emphasizing the large degree of overlap of implicated brain structures. This is a guide for our development; however, our model will not be sufficiently detailed to address such a neural level of description. His rationale for proposing the conceptual model of
Figure 2 was to move away from the more common and traditional view of eye movements: signals obtained from early visual processing connect directly to the motor outputs for pursuit and saccadic eye movements. For him, the control of voluntary eye movements involves a cascade of steps that permit flexibility in how the movements are guided, selected, and executed. Higher order processes such as attention, perception, memory, and rewards influence the evaluation of sensory inputs. Sensory evaluation provides input to two subsequent processes. One process selects the target and gates the motor response, likely involving the SC. The other process provides the drive signals that determine the metrics of the movements and likely involves structures such as the cerebellum. In his model, the choice of whether to generate a pursuit movement or a saccade movement, or some combination of the two, is not solely determined by the signals of the traditional view but instead depends on a comparison between the descending signals and the current motor state.
As our own model is presented, it will be clear that we agree at an abstract level. Krauzlis’ cascade of steps provides not only flexibility but also economy of representation. In general, it is likely that results of most computations can be used for more than one subsequent computation. An intermediate representation for its temporary storage permits the result to be used by other processes without the need to re-compute it, thus providing economy in terms of computation time as well as storage medium.
It is our goal to provide several layers of depth and detail to the elements and structure of his diagram. Important components such as the basal ganglia, the cerebellum and the premotor nuclei will not be touched directly by our discussion. Specifically, our discussion will be at a functional level and focused on the visual information that plays a role in selection. We will then propose algorithms for how the various representations may be computed, will show a demonstration of this computation, and speculate on possible neural correlates for the functional elements involving a subset of the pathways presented by Krauzlis earlier.
We begin by being explicit about what we mean by the term “eye movement” and the term “attention”. There are several types of eye movements:
Saccade: voluntary jump-like movements that move the retina from one point in the visual field to another;
Microsaccades: small, jerk-like, eye movements, similar to miniature versions of voluntary saccades, with amplitudes from 2 to 120 arcminutes;
Vestibular-Ocular Reflex: these stabilize the visual image on the retina by causing compensatory changes in eye position as the head moves;
Optokinetic Nystagmus: this stabilizes gaze during sustained, low frequency image rotations at constant velocity;
Smooth Pursuit: these are voluntary eye movements that track moving stimuli;
Vergence: these are coordinated movements of both eyes, converging for objects moving towards and diverging for objects moving away from the eyes;
Torsion: coordinated rotation of the eyes around the optical axis, dependent on head tilt and eye elevation.
Modeling this full set is beyond the scope of this paper, but it is included to show the breadth of coordination and control that the human eye movement system must possess. We will keep this list in mind and take no design decisions that might preclude these extensions. This integration is also suggested by
Bodranghien et al. (
2015), who assert that the purpose of eye movements is to optimize vision by promptly bringing images to the fovea, where visual acuity is best, using saccades and vergence, then stabilizing images on the retina/fovea even when the target or body are displaced, using fixation, smooth pursuit (SP) and the vestibulo-ocular reflex (VOR). Such an integrated view is how we consider eye movements as well.
Our preferred view of attention, on the other hand, is that attention is a set of mechanisms that tune and control the search processes inherent in perception and cognition.
Tsotsos (
2011) suggests that the major types of attentional mechanisms are suppression, restriction and selection. He points out that this definition covers the actions of a wide set of attentional mechanisms and effects (detailed in that volume). There are many other definitions of attention in the literature. They are either not amenable to a computational counterpart or, if they have a computational counterpart, are very narrow in scope. A broad spectrum of views can be seen in
Itti, Rees & Tsotsos (
2005) or
Nobre & Kastner (
2013).
From our reading, there is no real agreement in the literature about how attention and eye movements are related. The opinions range from “attention is allocated before all eye movements” to “attention is simply the side effect of an eye movement”.
Posner (
1980) suggested how overt and covert attentional fixations may be related by proposing that attention has three major functions: (1) providing the ability to process high-priority signals or alerting; (2) permitting orienting and overt foveation of a stimulus; and (3) allowing search to detect targets in cluttered scenes. This is the Sequential Attention Model that proposes that eye movements are necessarily preceded by covert attentional fixations. Klein put forth another hypothesis (
Klein 1980), advocating the Oculomotor Readiness Hypothesis. For Klein, covert and overt attention are independent and co-occur because they are driven by the same visual input. The Premotor Theory of Attention places attention in a fully slave position. Covert attention is the result of activity of the motor system that prepares eye saccades, and thus attention is a by-product of the motor system (
Rizzolatti et al. 1987). However, as Klein more recently writes (
Klein 2004), the evidence points to three conclusions: that overt orienting is preceded by covert orienting; that overt and covert orienting are exogenously (by external stimuli) activated by similar stimulus conditions; and that endogenous (due to internal activity) covert orienting of attention is not mediated by endogenously generated saccadic programming.
From the computational perspective, there are many algorithms for realizing the attention and eye movement link. The problem is that there are too many attention models with no agreed-upon methodology for evaluating or comparing models (for example,
Bylinskii et al. 2015 conclude this after examining 142 models). Typically, performance of algorithms is not compared side-by-side except for those whose foundation is the saliency map (
Koch & Ullman 1985). Such algorithms are validated via fixation image datasets (eg.,
Borji & Itti 2013). However, images in these datasets seem “unnatural” for this purpose. An eye movement in the natural world changes the visual field. As a result, context for local contrast computations may change and those changes affect global conspicuity ranking. Current data sets do not capture this nor do evaluation metrics. Saliency map models still have many other outstanding issues, including how they deal with the scale of interest regions, border effects (the boundary problem mentioned later), spatial (central) bias in datasets, influence of context or scene composition, and oculomotor constraints (
Bruce et al. 2015).
Models of attention that go beyond saliency also abound (for review see
Rothenstein & Tsotsos 2014). These include: Biased Competition (
Desimone & Duncan 1995;
Reynolds et al. 1999); Neurodynamical Model (
Rolls & Deco 2002); Feature-Similarity Gain Model (
Treue & Martinez-Trujillo 1999;
Boynton 2005); Feedback Model of Visual Attention (
Spratling & Johnson 2004); Cortical Microcircuit for Attention (
Buia & Tiesinga 2008); the Reentry Hypothesis (
Hamker 2005); Normalization Model of Attention (
Reynolds & Heeger 2009); Integrated Microcircuit Model (
Ardid et al. 2007); Normalization Model of Attentional Modulation (
Lee & Maunsell 2009); Predictive Coding for Biased Competition (
Spratling 2008); Selective Tuning (
Tsotsos et al. 1995;
Rothenstein & Tsotsos 2014); and Mechanistic Cortical Microcircuit for Attention (
Beuth & Hamker 2015). All of these models propose explanations for how single-cell neural signals change as a result of attentive influences. For example, the most popular model, Biased Competition, proposes that neurons representing different features compete and that attention biases this competition in favor of neurons that encode the attended stimulus. Attention is assumed to increase the strength of the signal coming from the inputs activated by the attended stimulus, implemented by increasing the associated synaptic weights. Many other models use Biased Competition as their foundation, as can be seen in the review cited above. The models are evaluated by examining their qualitative or quantitative ability to replicate neural recordings. All of the models listed demonstrate interesting performance but few touch upon eye movements.
If we consider models of fixation control we see a similarly dizzying variety and number. Among the many good sources for reviews are
Hallett (
1986);
Carpenter (
1991);
Hayhoe & Ballard (
2005);
Tatler (
2009);
Kowler (
2011) and
Liversedge et al. (
2011). Models include
Pola & Wyatt (
1991) who focused on smooth pursuit,
Becker (
1991) who was interested in goal-directed saccadic eye movements, Judge’s model of vergence (1991), Miles’ conceptualization of the VOR (1991), Fischer & Boch’s (1991) description of the many interacting cortical loops for preparation, generation and control of eye movements,
Distler & Hoffmann (
2011) who modeled the optokinetic reflex, Barnes (2011) who focussed on pursuit eye movements, White & Munoz (2011) who examined the role of superior colliculus,
Vokoun et al. (
2011) who considered the role of basal ganglia,
Tanaka & Kunimatsu (
2011) who studied the contribution of thalamus, and
Crawford & Klier (
2011) who modeled 3D gaze shifts. What is interesting about this set of models is their focus on a single component of eye movements rather than integration of different eye movement types and certainly little effort to explicitly include attentional mechanisms. Moreover, for the most part these are not computational models in the sense that they are not implemented in such a way to permit their performance to be examined with realistic image stimuli.
Even though we have cited a very large number of models, there are many more and a complete review is beyond our goals here. The remainder of the paper will proceeds as follows. We will begin with considering the purpose of an eye movement and some of the constraints that result. Secondly, a little-considered problem the boundary problem will be described, accompanied by a solution to it that has major impact on the representations that are needed for fixation selection. Thirdly, the role of saliency maps will be questioned. This will result in a new set of representations that build upon the conclusion of the boundary problem analysis and take the place of the classical saliency map. The fourth major section will propose a new schema that integrates these new elements. This will be followed by a first demonstration of the performance of this new system.
A brief preview of the main points follows. The starting point for this work is the Selective Tuning (ST) model of visual attention (
Tsotsos et al. 1995;
Tsotsos 2011). Tsotsos & Kruijne (2014) give an overview of the how the Selective Tuning model may be extended to provide a basis for visual cognition. This extended system is named The Selective Tuning Attentive Reference (STAR) model and includes elements such as visual working memory, attention executive, and task executive. An additional component of the extension is the connection between attention and fixation control, the main topic of this paper. As mentioned, our goal is to develop a functional, computational model and only speculative connections to potential neural correlates will be mentioned. The main characteristics include:
The purpose of saccades is to bring new information to the center of the fovea.
Overt and covert attentional fixations are integrated into the fixation control system.
A hybrid early-late selection strategy is proposed, combining peripheral feature-based attention with central object-based attention representations.
Functionality is provided so that the right parts of a scene are presented to the fovea at the right time, accomplished through appropriate contributions of a unique set of modulating and driving representations.
The model enables different eye movement types to be integrated into a single, unified, mechanism (specifically, saccades, attentional microsaccades, and pursuit).
Fixation Change Targets the Fovea
The purpose of all saccades is to bring new information to the retina and because the center of the fovea has the highest density of receptors, it is the ideal target for new information. A closer look at the fovea is warranted.
Sources of information on photoreceptor distribution and other retinal characteristics in humans described here are
Østerberg (
1935),
Curcio et al. (
1990), and
Curcio & Allen (
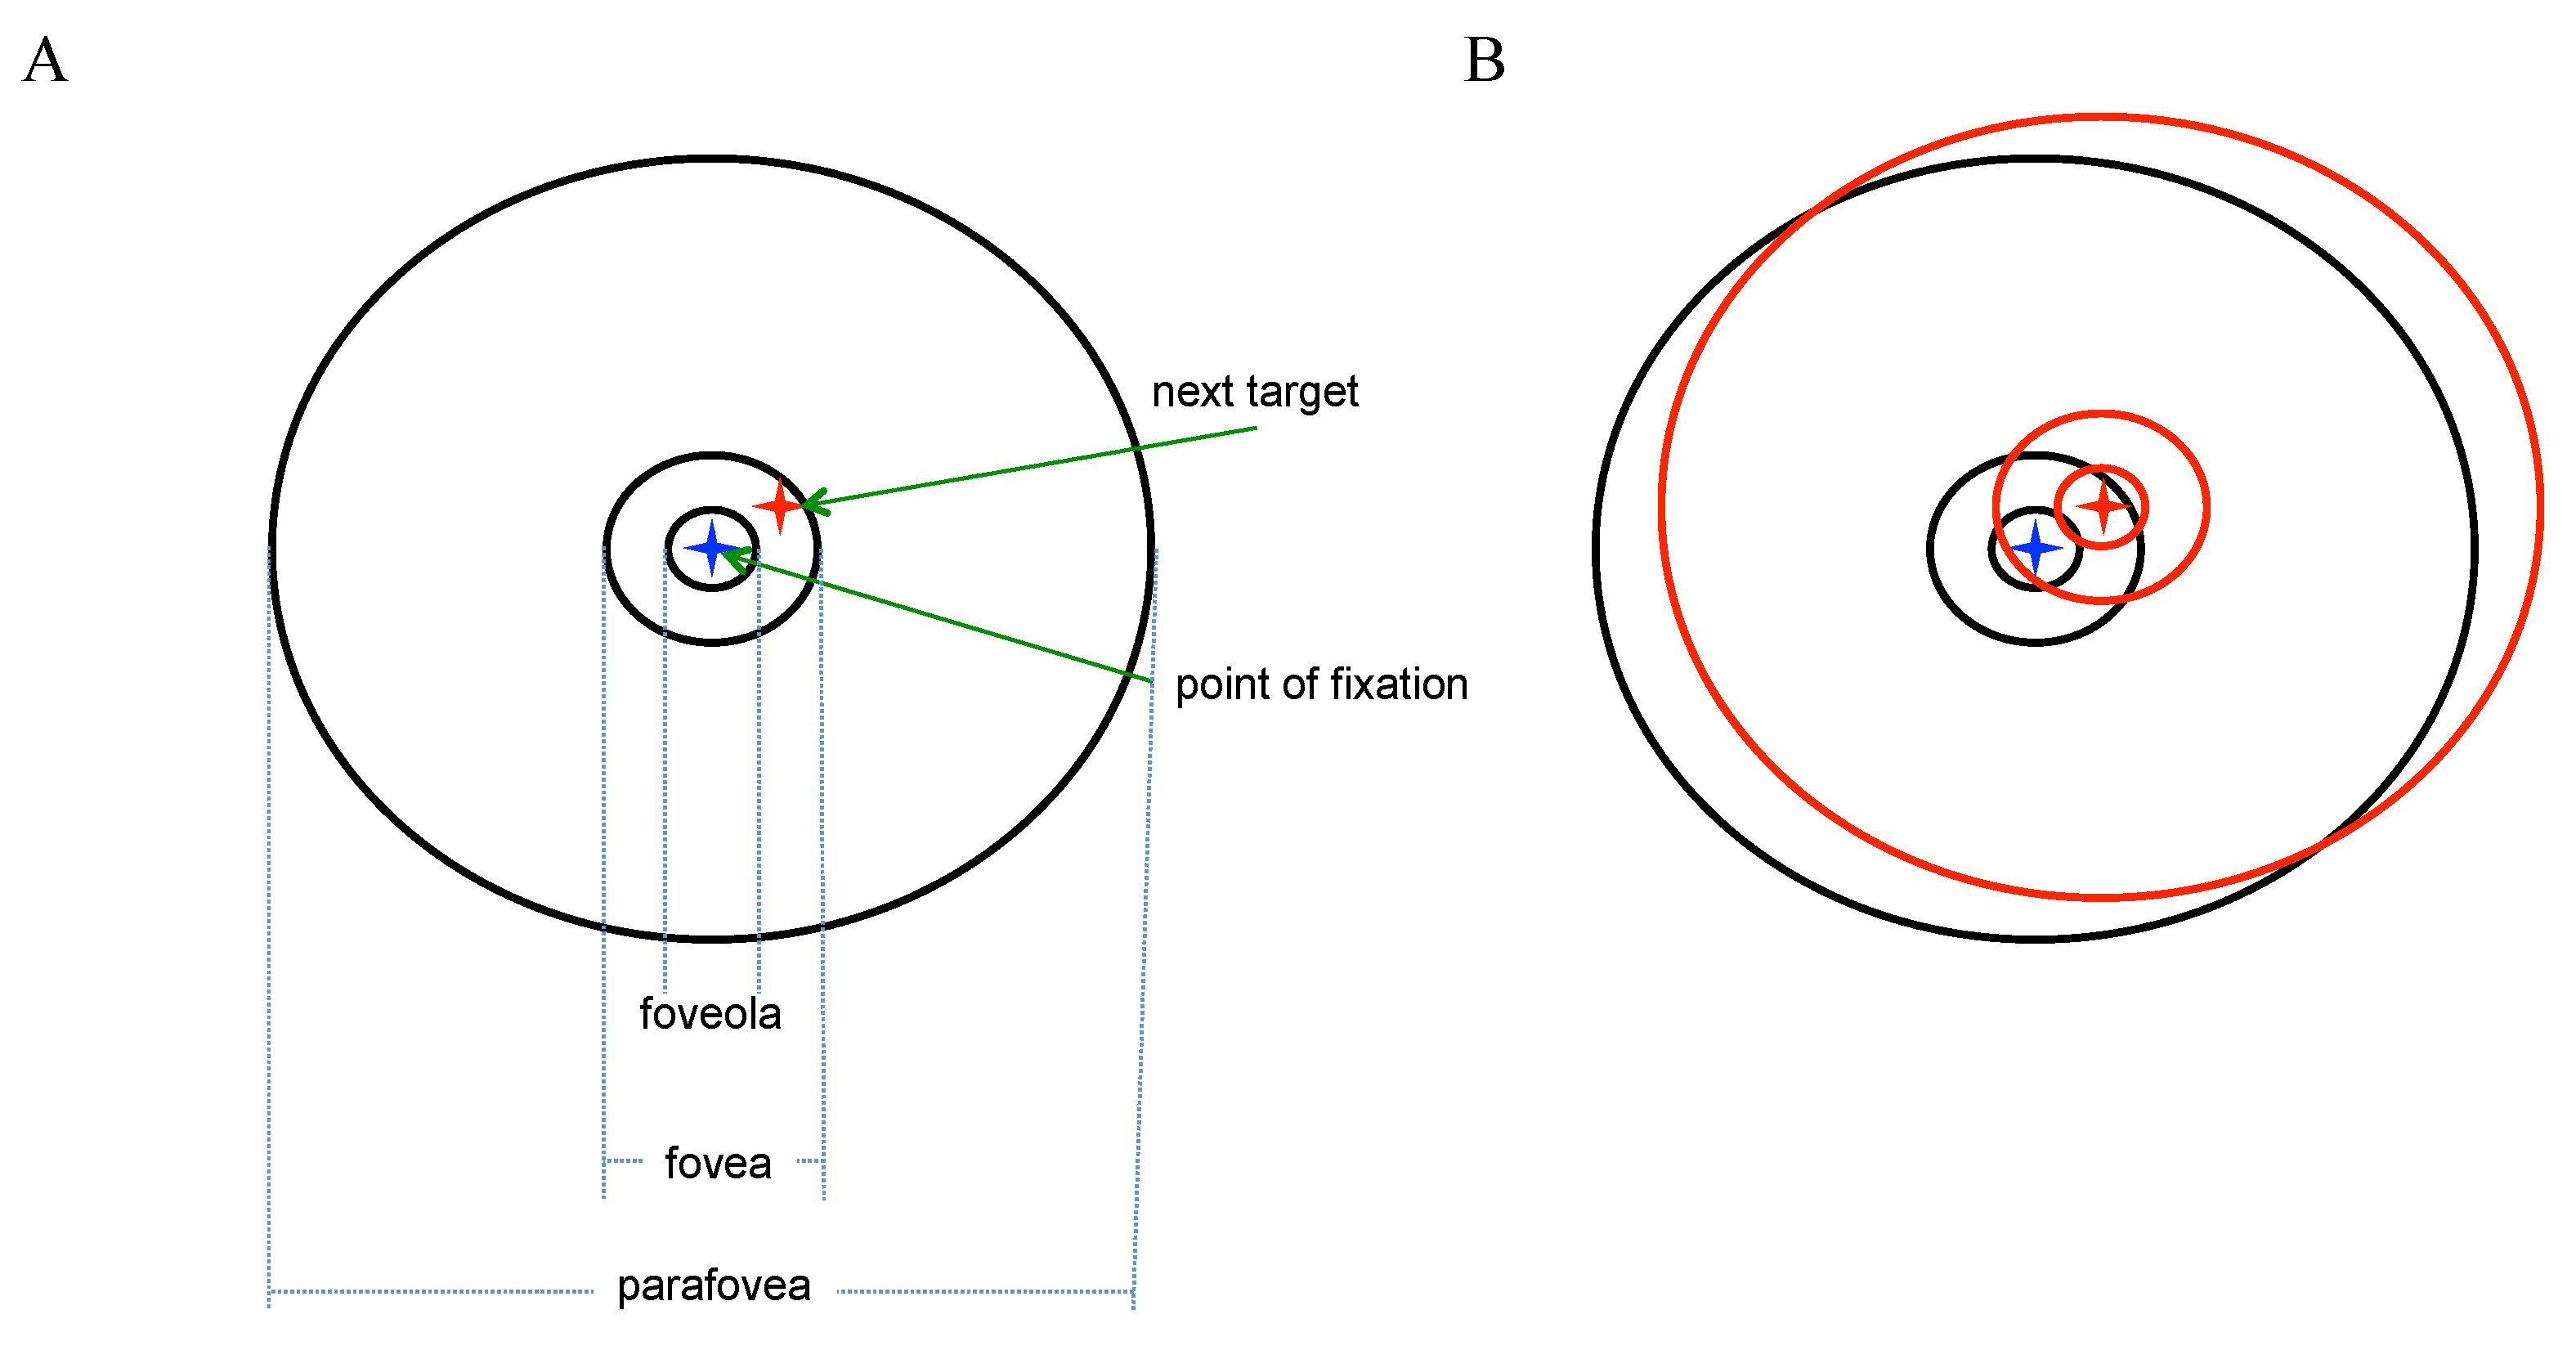
1990). The fovea is a highly specialized region of the central retina that measures about 1.2 millimeters in diameter, or subtends 2° of visual angle in the retinal image. At its center lies the foveola, 350 µm wide (0.5°) that is totally rod-free and capillary free, thus seeming the optimal target for new visual information. The parafovea is the region immediately outside the fovea with a diameter of 2.5 mm (5°). The normal retina represents a full visual field that subtends about 170° horizontally.
The human retina contains on average 92 million rods (77.9 million to 107.3 million). Rod density is zero in the foveola and the highest rod densities are found in a broad, horizontally oriented elliptical ring at approximately the same eccentricity as the center of the optic disk (horizontally at 20° eccentricity). Rod density then slowly decays through the periphery to a value of about 40,000/mm
2. On the other hand, there are on average 4.6 million cones (4.08 million to 5.29 million) in the retina. Peak foveal cone density averages 199,000 cones/mm
2 and is highly variable between individuals (100,000–324,000 cones/mm
2). The point of highest density may be found in an area as large as 0.032 deg
2. This high density is achieved by decreasing the diameter of the cone outer segments such that foveal cones resemble rods in their appearance. Cone density falls steeply with increasing eccentricity; within 1° visual arc of eccentricity cone density falls to about 65,000 cones/mm
2 and by 5° it has fallen to about 20,000 cones/mm
2 decreasing until about 10° eccentricity where it plateaus at about 3,000–5,000 cones/mm
2. The isodensity contours of the distribution of human cones form rough concentric circles across the retina centered at the fovea. Visual information is carried to other parts of the visual processing hierarchy by the optic nerve, which in humans contains between 770,000 and 1.7 million fibers, each an axon of a retinal ganglion cell (
Jonas et al. 1992). There are at least two ganglion cells per cone in the central region up to about 3.5° eccentricity, and this decreases further out toward the periphery. Approximately half of the nerve fibers in the optic nerve carry information from the fovea, while the remaining half carry information from the rest of the retina.
The precipitous decline in cone density away from the fovea is naturally accompanied by a corresponding drop in acuity. Visual acuity is defined as the reciprocal of the visual angle, in minutes, subtended by a just resolvable stimulus (
Anstis 1974). It was shown by Anstis that in order to maintain visual acuity an object (he measured height of a letter to attain a recognition threshold) must increase linearly by 2.76 min in size for each degree of retinal eccentricity up to about 30°, and then somewhat more steeply up to 60°. In his experiment, a letter 0.2° high was just identifiable at 5° from the fovea and a letter 1° high was just identifiable at 25°. In other words, the acuity of a just identifiable object with height
h min falls as
h/(h+2.76d) for
d degrees of its movement away from the center of the retina. It is important to note that overall light levels also play a role, with acuity and visibility shifting towards the rod system as illumination decreases (but this will not be considered further here).
Given these physical realities, it would thus make sense that any fixation control algorithm should wish to have as much visual information fall near the center of the foveola as possible. The next question then is how to accomplish this given the foveola’s small spatial size? The foveola subtends 0.5° of arc, so at a distance of say one meter, the extent of an object that would fit entirely within it is less than one centimeter. Looking at someone’s face one meter away would require a large number of fixations in order to examine all parts at the same level of high detail possible in the foveola.
It seems unlikely that a fixation control method would use covert fixations (It is common, when requiring constant fixation during an experiment, to reject trials where subjects perform eye movements greater than 2° (M. Fallah, personal communication). Thus, microsaccades are permitted and any inference regarding attentional fixation is attributed (perhaps mistakenly) to ‘covert’ attention.) only. This would make sense only for image regions or tasks where high acuity is not important. If an attended stimulus is centered on the foveola, then any change in focus of attention without a corresponding physical eye movement would necessarily decrease acuity given the physical characteristics of the retina described above. The key here then would be to develop an algorithm that can place importance on image regions; this has proven difficult because it is very task-dependent (Modern saliency algorithms attempt to do this, and although their performance for free-viewing tasks can be quite good, the effective inclusion of task-related information is still beyond the state-of-the-art (
Bruce et al. 2015). A fixation change with zero movement of the fovea would necessarily be sacrificing acuity along a quite steeply declining profile. The spatial pattern of task-based conspicuity would play the major role in deciding whether a covert fixation is sufficient for a given target location A control algorithm would be required to constantly judge the trade-off between loss of acuity and economy of movement. Certainly the decrease in acuity with increasing eccentricity is so severe as to make covert fixations to the periphery quite ineffective except for some stimuli, such as abrupt or highly conspicuous image events (e.g., easy figure-ground segregation), or some simple visual tasks (categorization of central stimuli, for example).
Combining covert fixations with ‘normal’ saccades (
Tatler et al. (
2006) examined the amplitude of ‘normal’ saccades and found in a free view task 66% of saccades were to locations within 8° of the current centre of gaze (with a peak in the 2-4° range), and in their particular search task, 50% (with a peak in the 4-6° range)) is another option, much more sensible than covert fixations alone, but there is still the issue of deciding when to use one or the other. Even when instructed to maintain fixation, the eye is constantly executing adjustments to overcome drift and other mechanical effects.
Hafed et al. (
2009) describe corrective microsaccades as important for maintaining fixation since the eyes necessarily drift, with these corrections occurring roughly every 250ms.
A third option, and the one we will adopt, is to combine covert fixations with normal saccades as described but to also ascribe attentional utility to the subset of microsaccades that are not playing a corrective role. The radius of the foveola is 0.25° or 15’ of visual angle. A target at the edge of the foveola could be fixated using a microsaccade (see
Martinez-Conde et al. 2004;
Poletti et al. 2013;
Rolfs 2009). Even a target at the edge of the fovea would require a saccade amplitude of only 1° (see
Figure 3). Similar ideas were presented in
Hafed & Clark (
2002) where microsaccades were linked to covert fixation intent. Such eye movements are typically not considered in attentional experiments because subjects may be required to maintain fixation within a small window, perhaps 2-5° in size during a trial. In order for this strategy to work, we need to not only have task importance as mentioned, but also sufficient spatial location resolution to permit attentional microsaccades to be directed and thus have purpose. This further requires a smooth integration with the corrective microsaccade mechanism. This option seems in line with the old idea that the sensory gradient is the basic factor in eye movements and fixation (
Weymouth et al. 1928) as well as with a more modern view (
Ko et al. 2010), among others.
Corrective saccades seem required not only for the reasons
Hafed et al. (
2009) described, but also to verify that the eye movement has indeed captured the intended target. An eye movement includes some level of mechanical noise or perhaps the target moves or the head moves and thus, an eye movement may not fall exactly where it was planned. For these reasons, it would be sensible that a monitoring process exists to ensure the intent of the observer is maintained, adding corrective actions as needed. Our model does not currently include such a monitoring process, but its inclusion would be straightforward.
Overall, it seems that our modeling direction shares perspectives with
Hafed et al. (
2015) and
Ko et al. (
2010). We view microsaccades as small saccades that play several roles, and as such, have impact to the full enterprise of understanding visual attention.
In summary, a novel view of the covert-overt fixation distinction is adopted. The goal of an attentional fixation is to access a needed piece of information from a visual scene. The need may be accompanied by a requirement for spatial precision and if it were, this would determine whether an eye movement is needed. An eye movement can have any amplitude. The following fixation changes are distinguished:
a. fixation changes where there is zero eye movement call these true covert fixations driven by a change of attentional focus where spatial precision at the new fixation location on the retina is sufficient for the current task;
b. fixation changes considered as microsaccades driven by a change in attentional focus and accompanied by an imperative for high spatial precision;
c. fixation changes that are usually considered overt experimentally. Again, these are due to changes in attentional focus with or without the need for spatial precision.
d. eye movements that are not accompanied by a change in attentional focus but are due to a corrective mechanism of some kind (corrective microsaccades for drift or tremor, vestibular-ocular reflex, optokinetic nystagmus, etc.).
The Boundary Problem
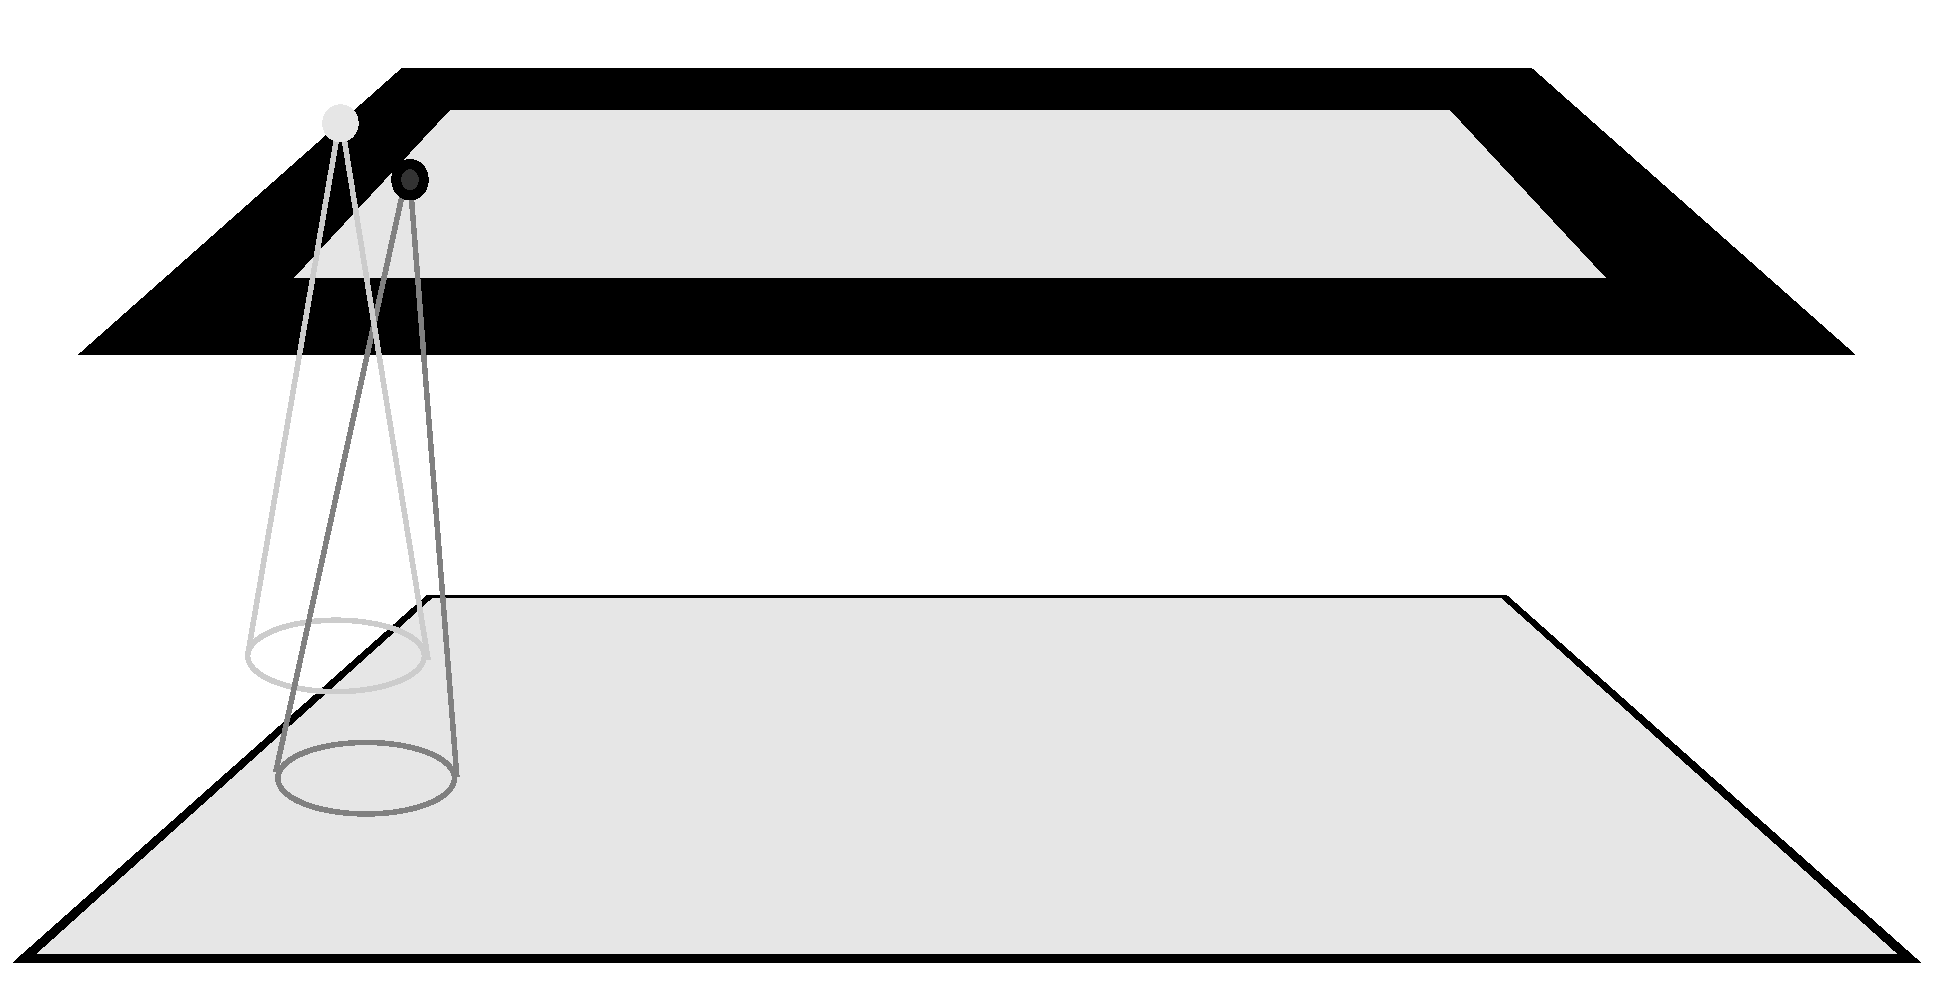
The boundary problem is well known in computer vision and is an inherent issue with any hierarchical, layered representation. However, it seems to not have played any role in theoretical accounts of human vision. The basic idea is shown in
Figure 4. Suppose we consider a simple hierarchical, feedforward, layered representation where each layer represents the full visual field, i.e., the same number of locations. Let’s say that at each position of this uniform hierarchy a neuron exists selective for some feature; this hierarchy may represent some abstraction of features layer to layer. The process that transforms the lower layer (the input) to the upper layer is the convolution, the basic mathematical counterpart of the implementation of neural tuning across a receptive field that takes one function, the image, and another, the kernel that models the tuning properties of a neuron, to create the response of those tuning properties across the image. At each layer, a kernel half-width at the edge of the visual field is left unprocessed because the kernel does not have full data across its extent as shown in
Figure 4.
Common remedies, seen as tacit elements of many computer vision and neural network algorithms, are outlined in Van der Wal & Burt (1992): extension of the image using blank elements; extension of the image using repeated image elements; wrapped-around image elements; attempts to discover compensatory weighting functions; or, ensuring the hierarchy has few layers with little change in resolution between layers to reduce the size of boundary affected. The reality is that none of these, except the possibility of a compensatory weighting mechanism, has any plausible biological counterpart; however, searches for such a weighting mechanism have not been successful. In any case, it is unlikely that the brain has developed such a weighting mechanism. If it had, the upper layers of the visual processing hierarchy would represent the full visual field veridically, and as will be seen below, they do not.
The boundary problem is compounded layer by layer because the half-widths are additive layer to layer. The result is that a sizeable border region at the top layer is left undefined, and thus the number of locations that represent true results of neural selectivity from the preceding layer is smaller. This resulting structure has similar qualitative properties to what is found in layers of the visual cortex.
Gattass et al. (
1988) looked at areas V3 and V4 of macaque. Both V3 and V4 contain representations of the central portion of the visual field (up to 35° to 40° eccentricity), but V4 receptive fields are larger.
Gross et al. (
1981) were the first to detail properties of inferotemporal (IT) neurons in the macaque monkey and showed that the median receptive field size was about 23° diameter and that the center of gaze or fovea fell within or on the border of the receptive field of each neuron they examined. Geometric centers of these receptive fields were within 12° of the center of gaze implying that the coverage of the visual field is about 24° at best from center of gaze. It seems that as the visual hierarchy is ascended, virtually all RFs include the fovea, almost all RF centers are foveal or parafoveal, and there is little or no representation outside 30-40° eccentricity, meaning that the higher level representations primarily provide an interpretation of the central area of a visual scene (which is imaged by the retina to about 60° nasally and 110° temporally). However, this raises a question: how can decisions about anything be made correctly outside the central area of visual field from responses of area TE neurons alone (or other high level area)? Where would a cue for a fixation change come from if the stimulus lies outside the central region? The answer is that early visual representations must play that key role and this is exactly the starting point of all saliency map algorithms.
These early visual representations, however, are only sufficient to capture so-called feature-based attention. Object-based attention seems to need more as its source input, namely, a representation of objects. The trend, thus, has been to develop object saliency algorithms that combine conspicuity computed from early representations with sensitivity to objects (see
Borji et al., 2012, for overview and benchmarks). These algorithms are based on stimulus properties more akin to perceptual organization rather than explicitly including methods for object categorization or interpretation. In the brain, the only representations that can provide input to object attention algorithms are those from the highest levels of the visual cortex, which we have just demonstrated suffer from the boundary problem and thus cover only the central portions of the visual field.
The connection between the boundary problem and saccades was made in
Tsotsos et al. (
1995). There, it was proposed that if a representation of the periphery, computed from early layer representations so as to not suffer from the boundary problem, were used together with the high level central representations, the problem may be ameliorated.
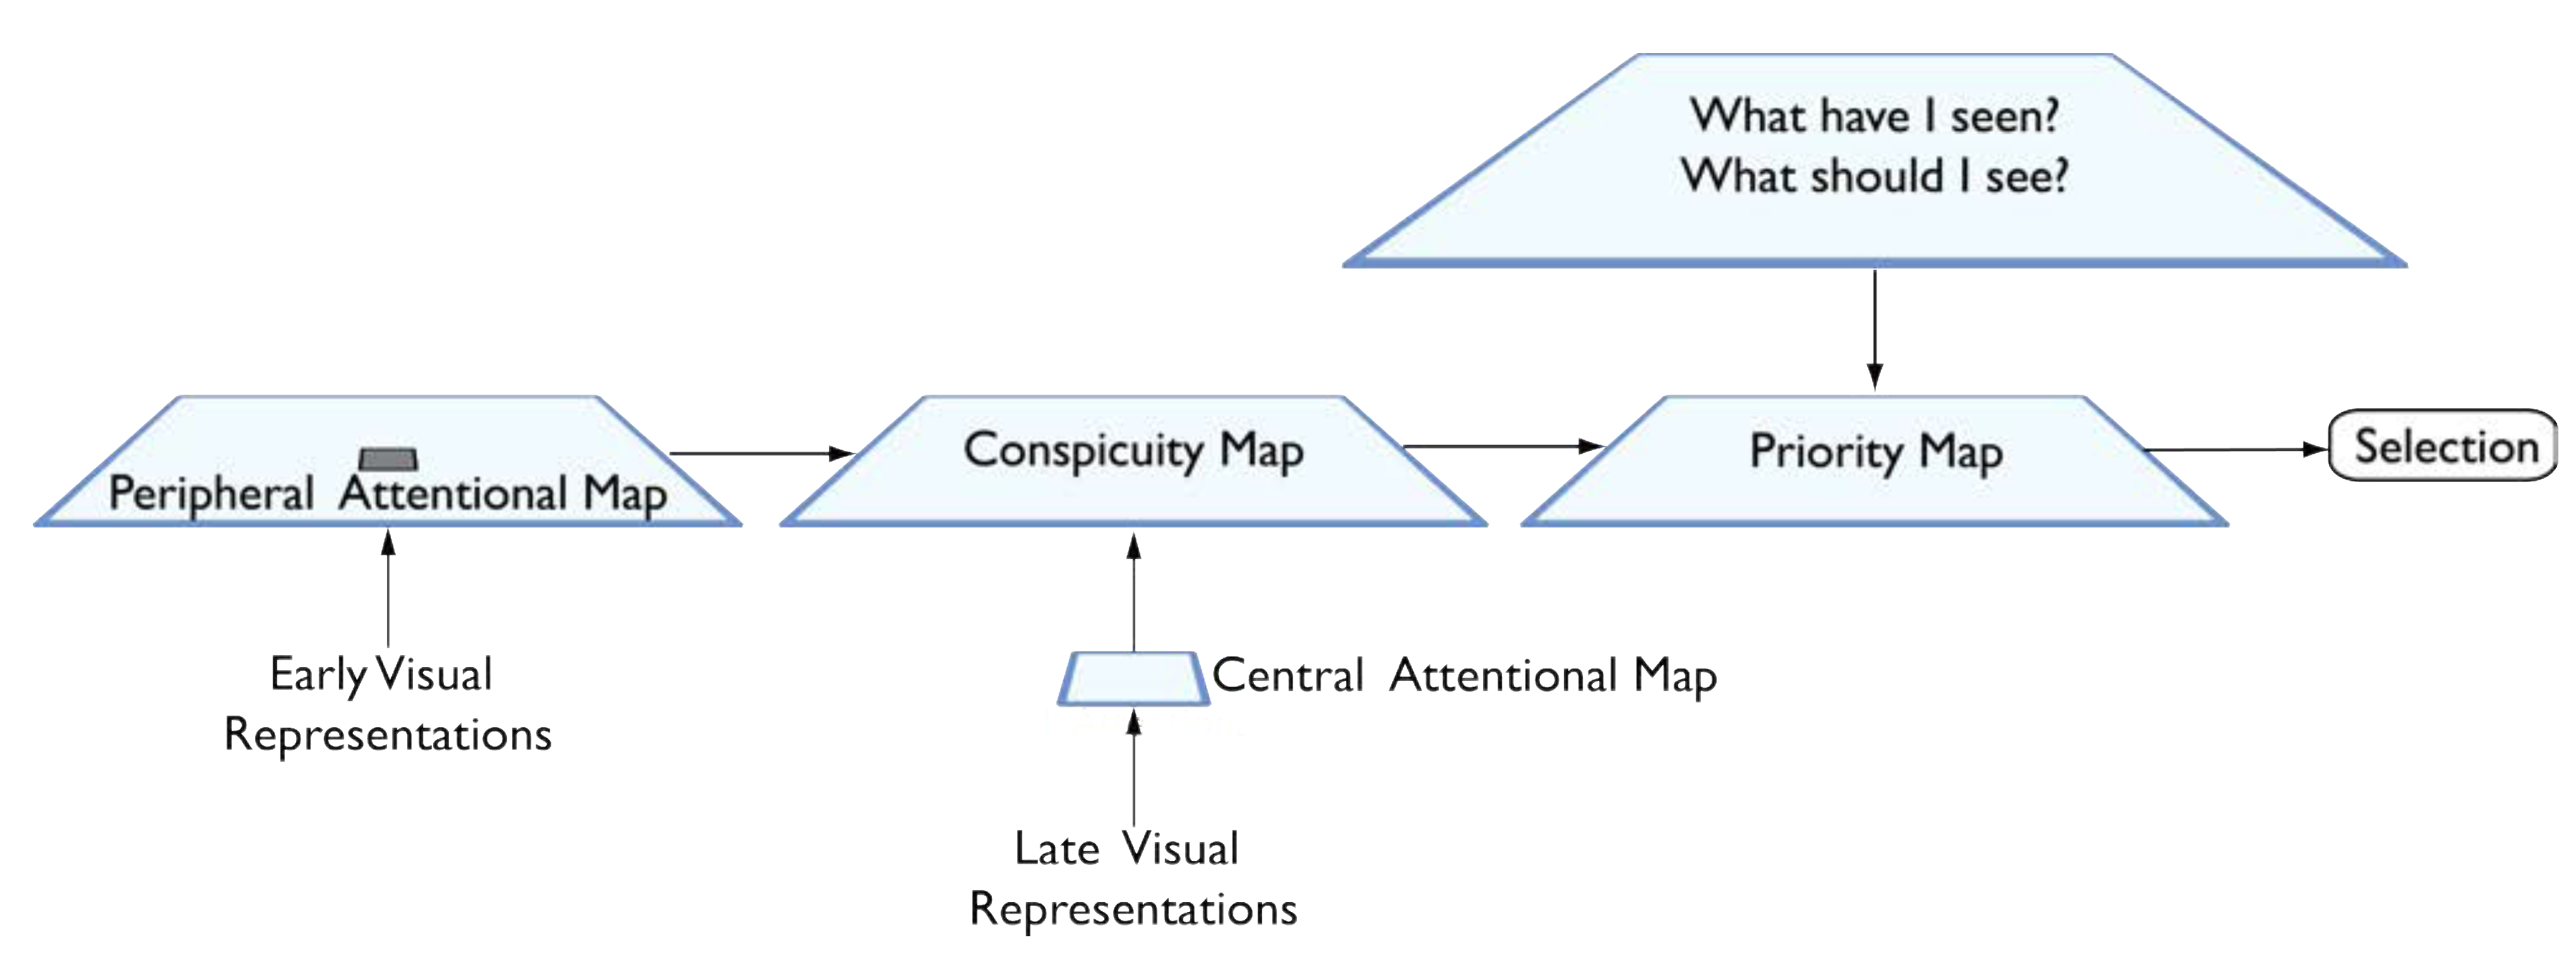
Figure 5 shows a schematic of how such a solution might be structured.
Object-based attention requires a base representation of conspicuity that involves objects, and accordingly the top layers of the visual hierarchy must be involved (the path from late visual representations to central attentional field to conspicuity map of
Figure 5). The boundary problem requires a conspicuity representation that is not corrupted in its periphery, and thus, early representations need to be involved (the path from early visual representations to peripheral attentional map to conspicuity map of
Figure 5). As a result, this is a source for featurebased attention. The determination of next attentional focus becomes a competition among all the candidates from these two presentations, modulated by other concerns related to task and fixation history. A subsequent section will provide more details and demonstrate how such a structure performs.
Thus, the visual system can overcome the boundary problem by moving the eyes. With the appropriate representations and computations to determine the transformations among them, the visual system can easily ensure a high-resolution view of scene elements of interest, however, with the expense of the time and effort required to foveate those elements.
The Role of Saliency Maps
Perhaps the one notion that dominates current thinking is that of the saliency map as the connection between attention and eye movements. The original
Koch & Ullman (
1985) proposal has endured: that the maximum in a retinotopic representation of visual field conspicuity determines the spatial location that is then passed on to a subsequent recognition or interpretation process. It is important, however, to recall that eye movements were not part of that work in any way, partly because it was intended as a model of Feature Integration Theory (Treisman & Gelade 1980). Perhaps the earliest work to connect a saliency model to eye movements was that of
Clark & Ferrier (
1988) who used a saliency map to drive robotic camera fixations.
Since then, research in both computational and biological vision has entrenched the original Koch & Ullman proposal in models (It is important to note that the Koch & Ullman proposal does not mention feature or object attention and just focuses on spatial attention. Some models in this list include elements beyond spatial attention; our critique concerns only the spatial attention component) of single image vision (i.e., without eye movements), including
Ullman & Sha’ashua (
1988),
Olshausen et al. (
1993),
Itti et al. (
1998),
Walther et al. (
2002),
Z. Li (
2002, 2014),
Deco & Rolls (
2004),
Itti (
2005),
Chikkerur et al. (
2010),
Zhang et al. (
2011) and
Buschman and Kastner (
2015).
These models all attempt to explain the impressive ability of the human visual system to very quickly categorize the contents of a scene. Fast categorization was quantified by
Potter (
1976), with results strengthened by
Thorpe et al. (
1996),
Potter et al. (
2014), and more. They showed that even with a very short exposure time (as short as 13ms) human vision can recognize visual stimuli within 150ms, or in other words, a single feedforward pass through the visual system. Thorpe et al. found human performance averaging 94% accuracy for 20ms exposure while Potter et al. found a performance range from 60% 80% for exposures between 13ms 80ms (note, these were not all directly comparable experiments). The key point of relevance here is that to theoreticians and modelers, this meant that the amount of computation that can be performed was constrained by the response time. The short exposure times mean there is little (or no) time for any lateral or inter-area computations and certainly not feedback. If this is to be consistent with the Koch & Ullman proposal, it places saliency computation within the first feedforward pass of visual information through the processing hierarchy.
We question this. If the computation of saliency occurs early in the feedforward pass through visual areas, and determines a region (or point or object) of interest for further processing, then, in order for human subjects to exhibit the observed categorization performance the first region-of-interest determined by a saliency algorithm must correspond to the target object. This must be the case since there is no time for a serial search through saliency derived target regions. Does it? This question has never been tested (but see
Tsotsos & Kotseruba 2015).
We developed the following test. If the question were to be answered in the affirmative, then, if we ran the same images used by the Potter and Thorpe experiments (that motivated the feedforward component of so many current models) through a variety of saliency algorithms, those algorithms should yield a first region-of-interest coinciding with the correct targets. To execute our tests, we obtained the datasets used by Thorpe and by Potter. Images within these sets that contained targets were ground-truthed by hand; targets were carefully outlined to form a target mask. The Potter dataset had 1711 images in total, 366 with targets, while the Thorpe dataset has 2000 images, 994 with targets. The Potter images were 300x200 pixels in size while the Thorpe images were 512x768 pixels. In the Potter experiments, questions were posed to subjects about image contents either before the stimulus or after. In the Thorpe et al. experiments, subjects were asked whether or not an image contained an animal and knew this question in advance. Across the experiments, task influence was either not relevant to the result, or constant and abstract, and thus it was reasonable to test with saliency algorithms not designed for task influence.
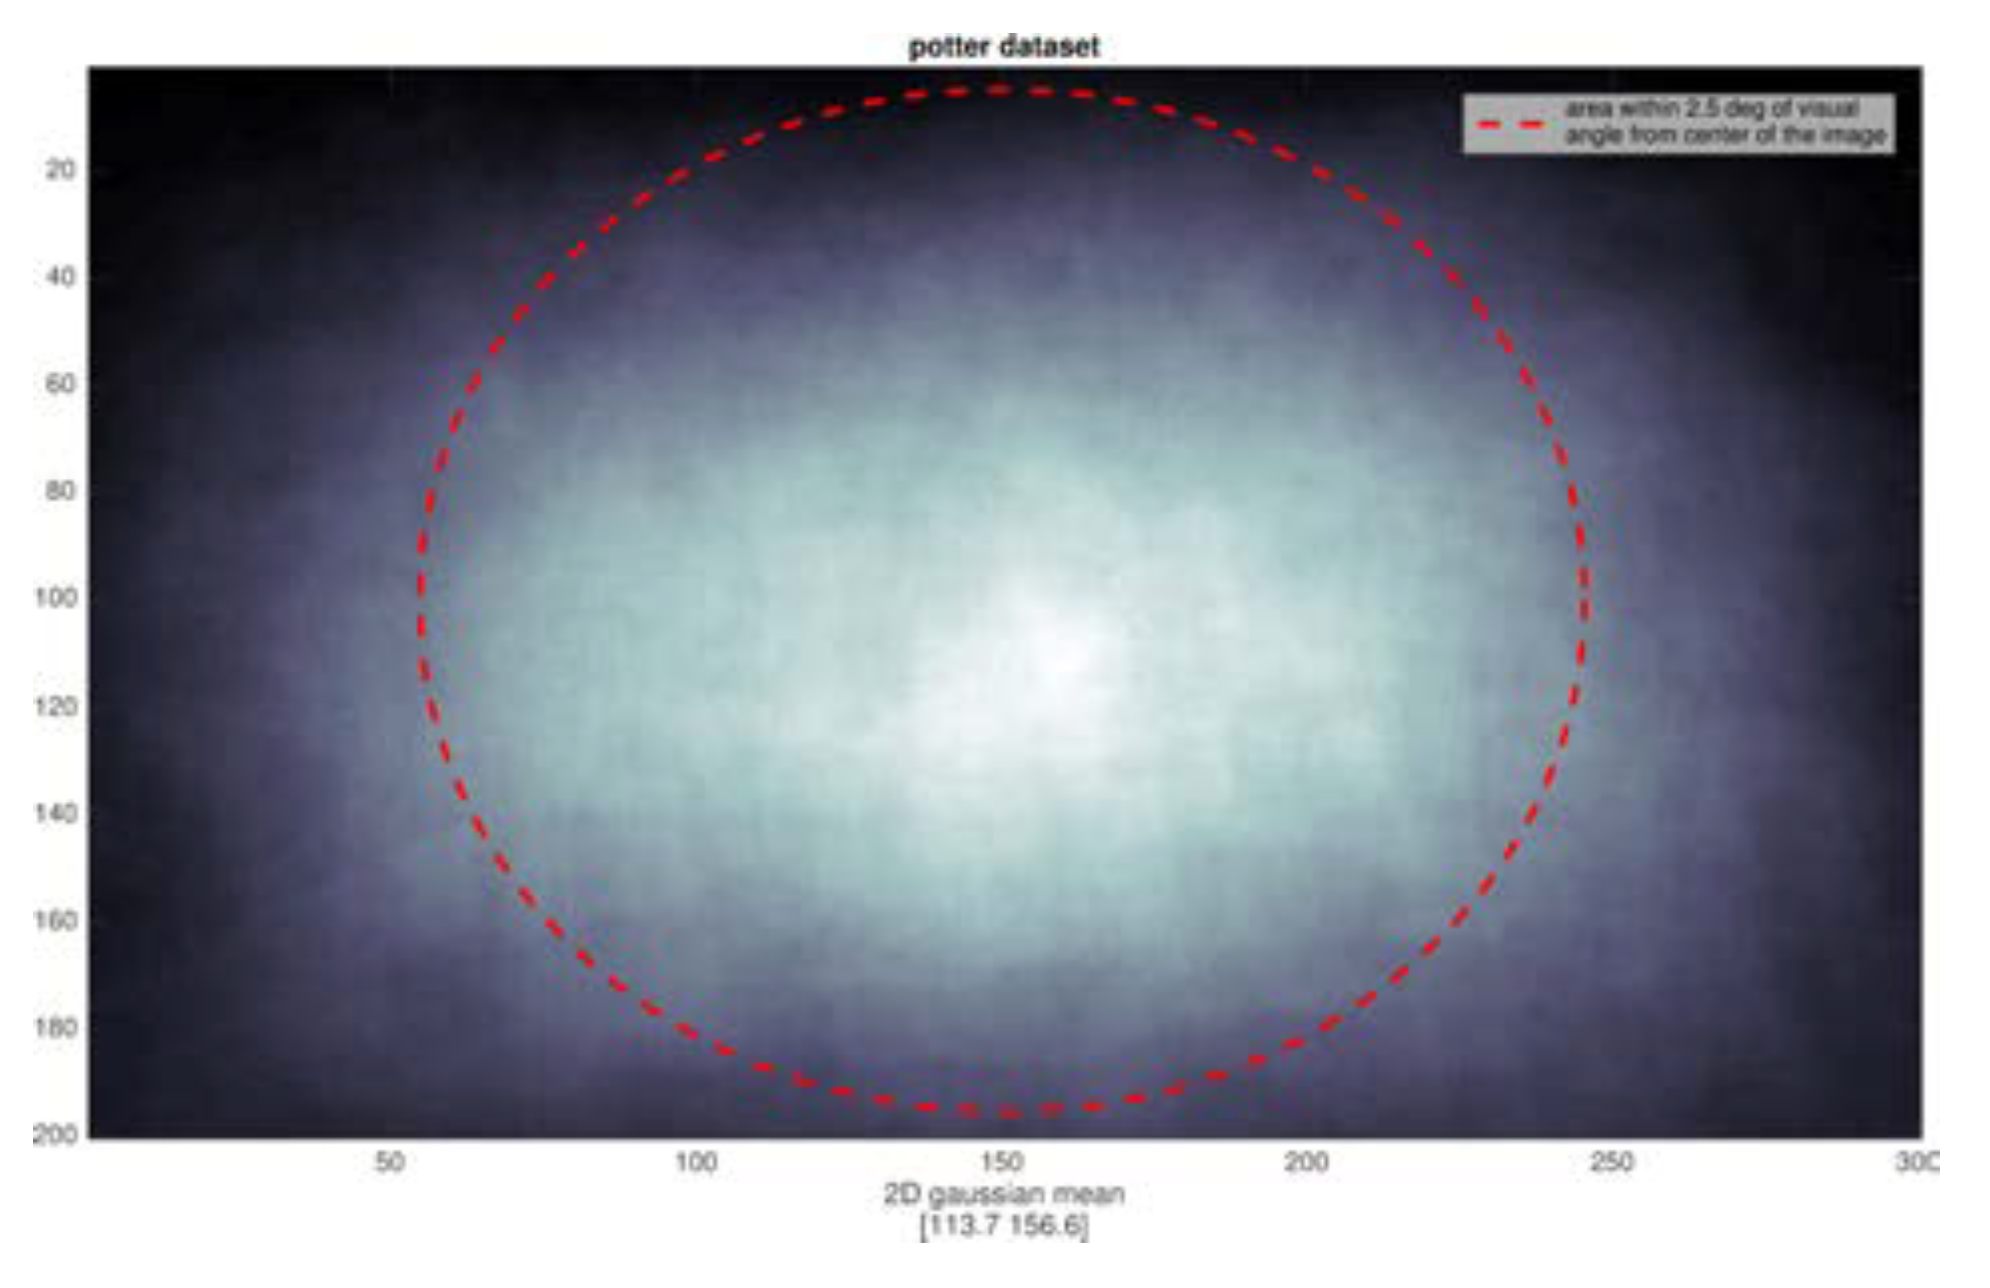
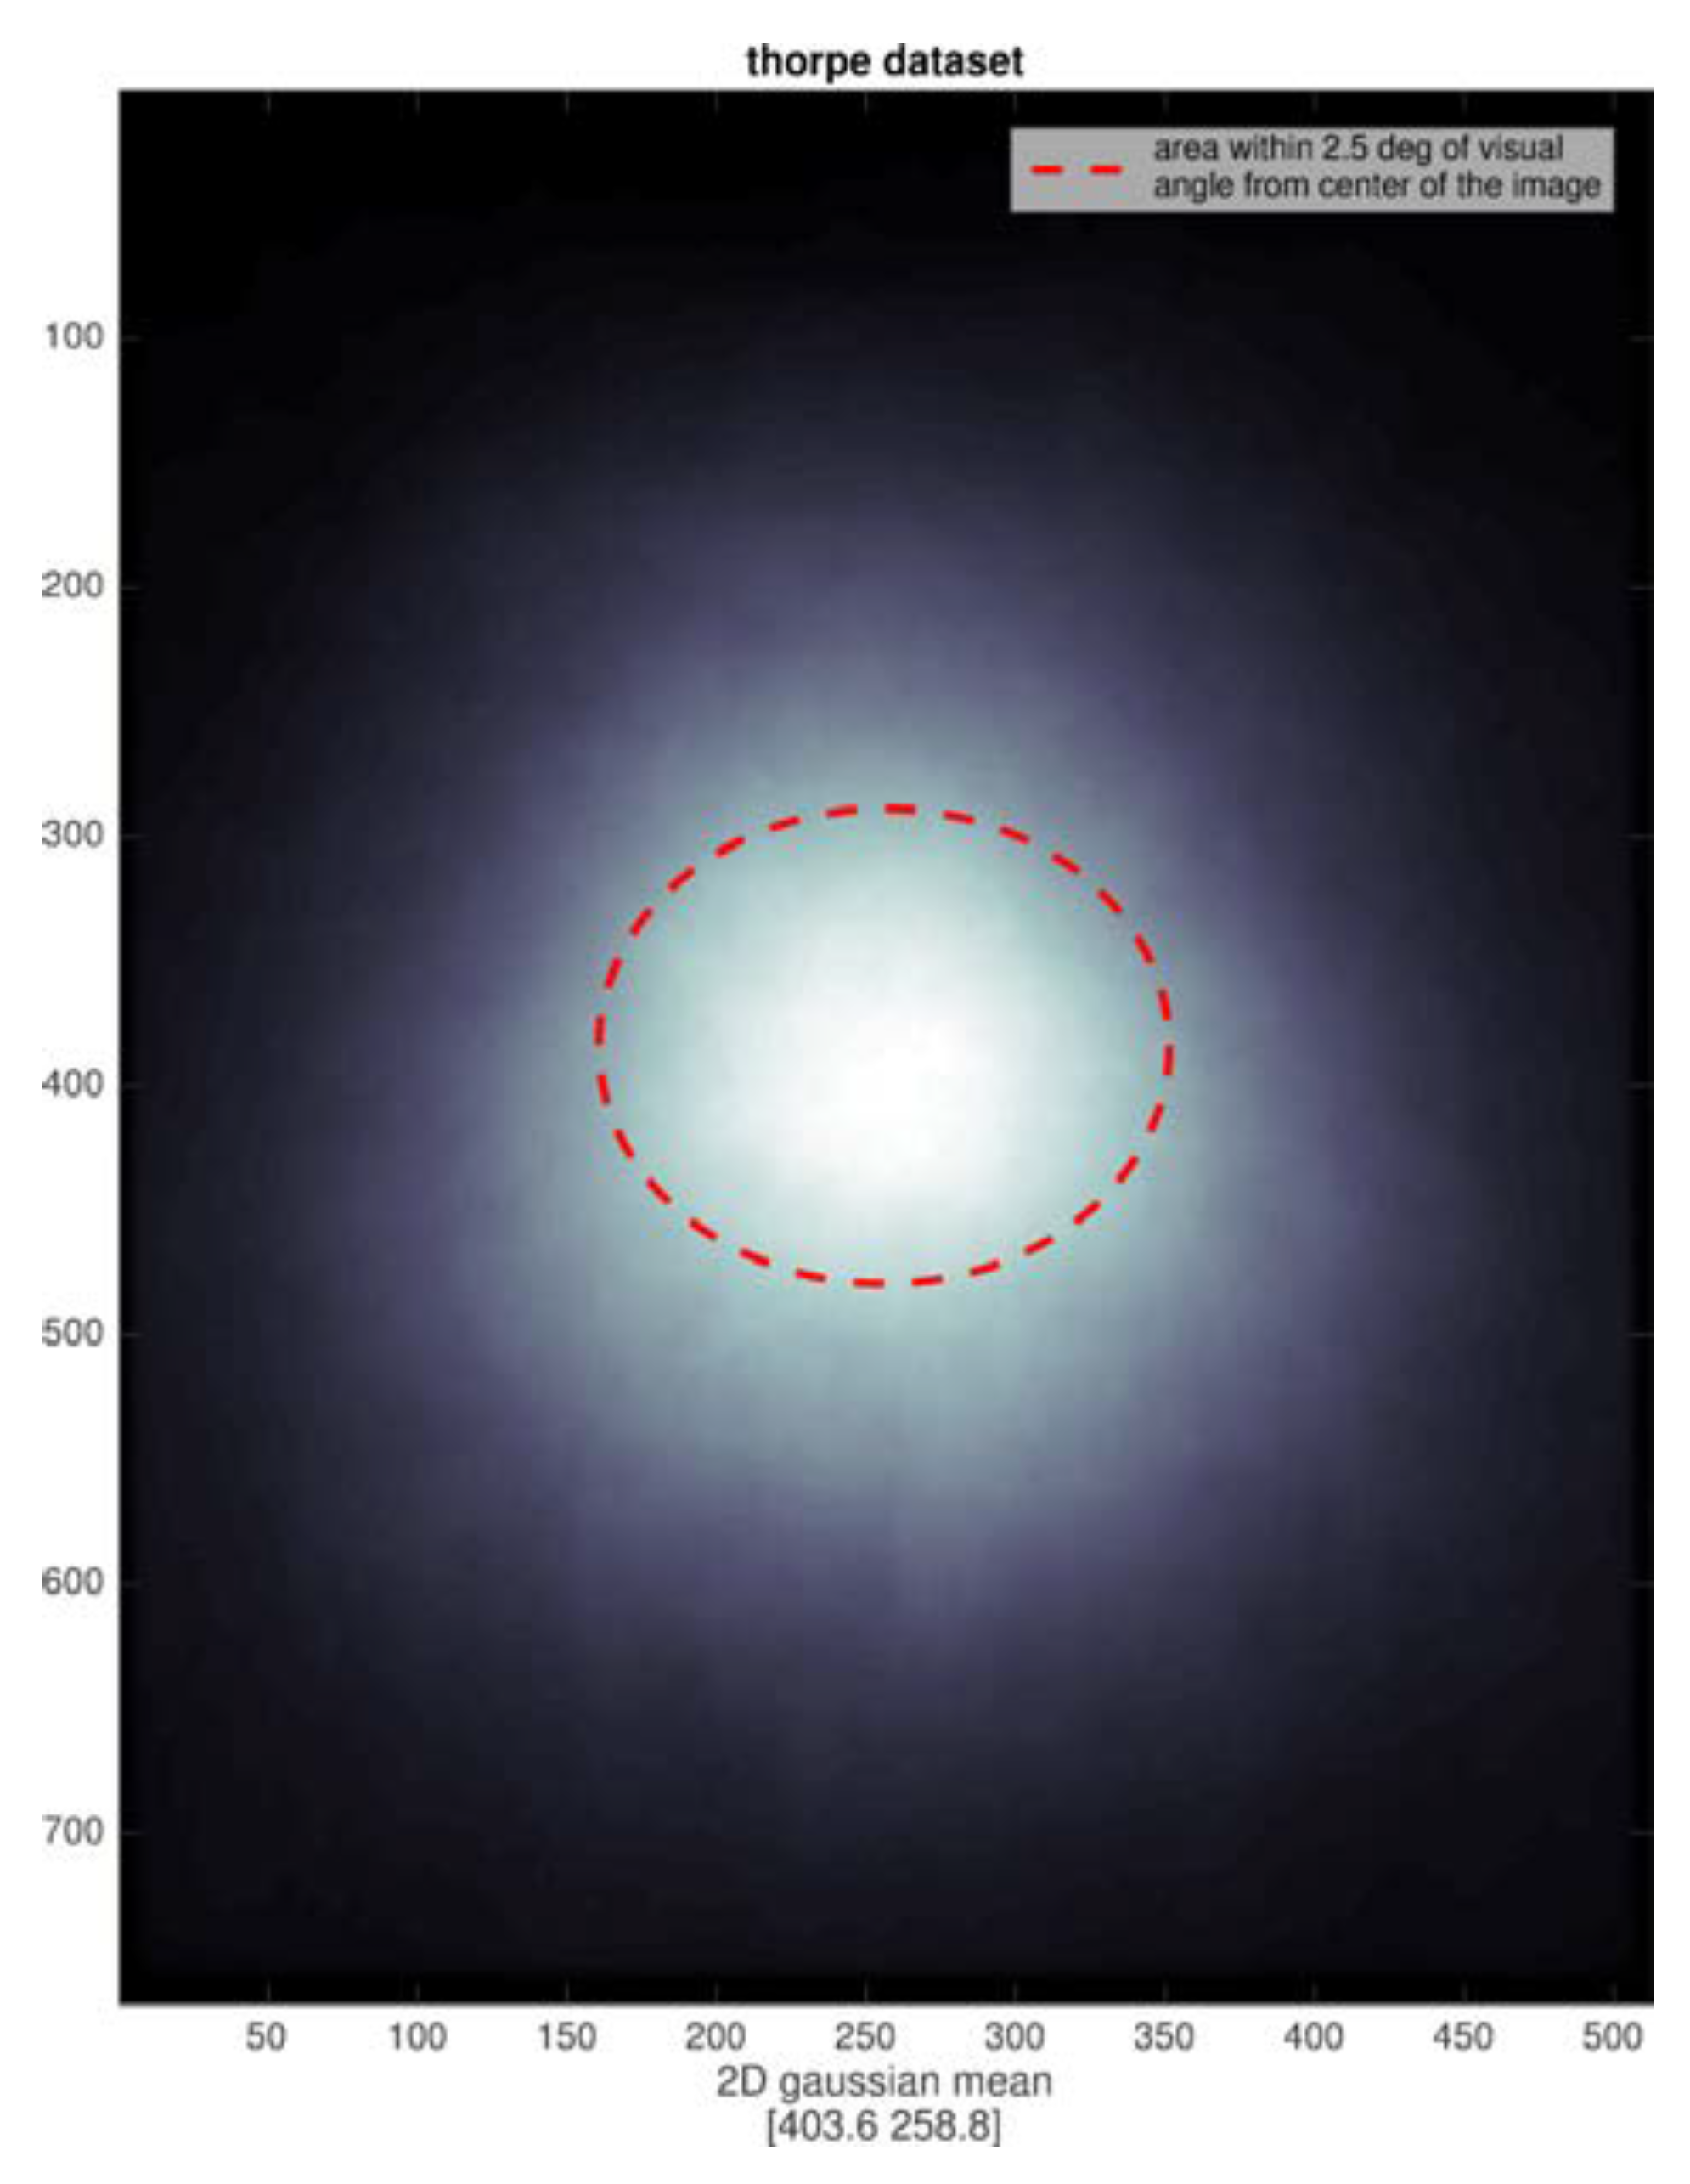
We analyzed the position of all targets and found a very strong center bias, not surprising since the images were all commercial photographs. Any subject fixation point instructions for the image center then naturally provide a good view of the intended target. Of course, no eye movements are possible with the short stimulus durations. The distributions of target extent for the two datasets are shown in
Figure 6 and
Figure 7. Superimposed on each, shown as a red oval, is the 2.5° eccentricity mark (computed at a viewing distance of 57 cm, monitor pixel density of 95.78 PPI on a 23” diagonal with resolution set to 1920x1080) which demonstrate that subjects really did not need to move their eyes in order to have a good sample of the target fall within their parafovea when fixating on the image center.
We examined the output of four algorithms on all images, both target and non-target. We chose three saliency models: the most commonly used and cited model by
Itti, Koch and Niebur (
1998) IKN; the AIM (Attention via Information Maximization) model (
Bruce & Tsotsos 2009), a consistently high performing model in benchmark fixation tests; and the
Goferman et al. (
2010) model CAS (Context Aware Saliency) a high scoring model on object benchmarks as opposed to the other two that are evaluated primarily on fixation data. We also added the ‘objectness’ algorithm (OBJ) because the human experiments all involve categorization of objects (
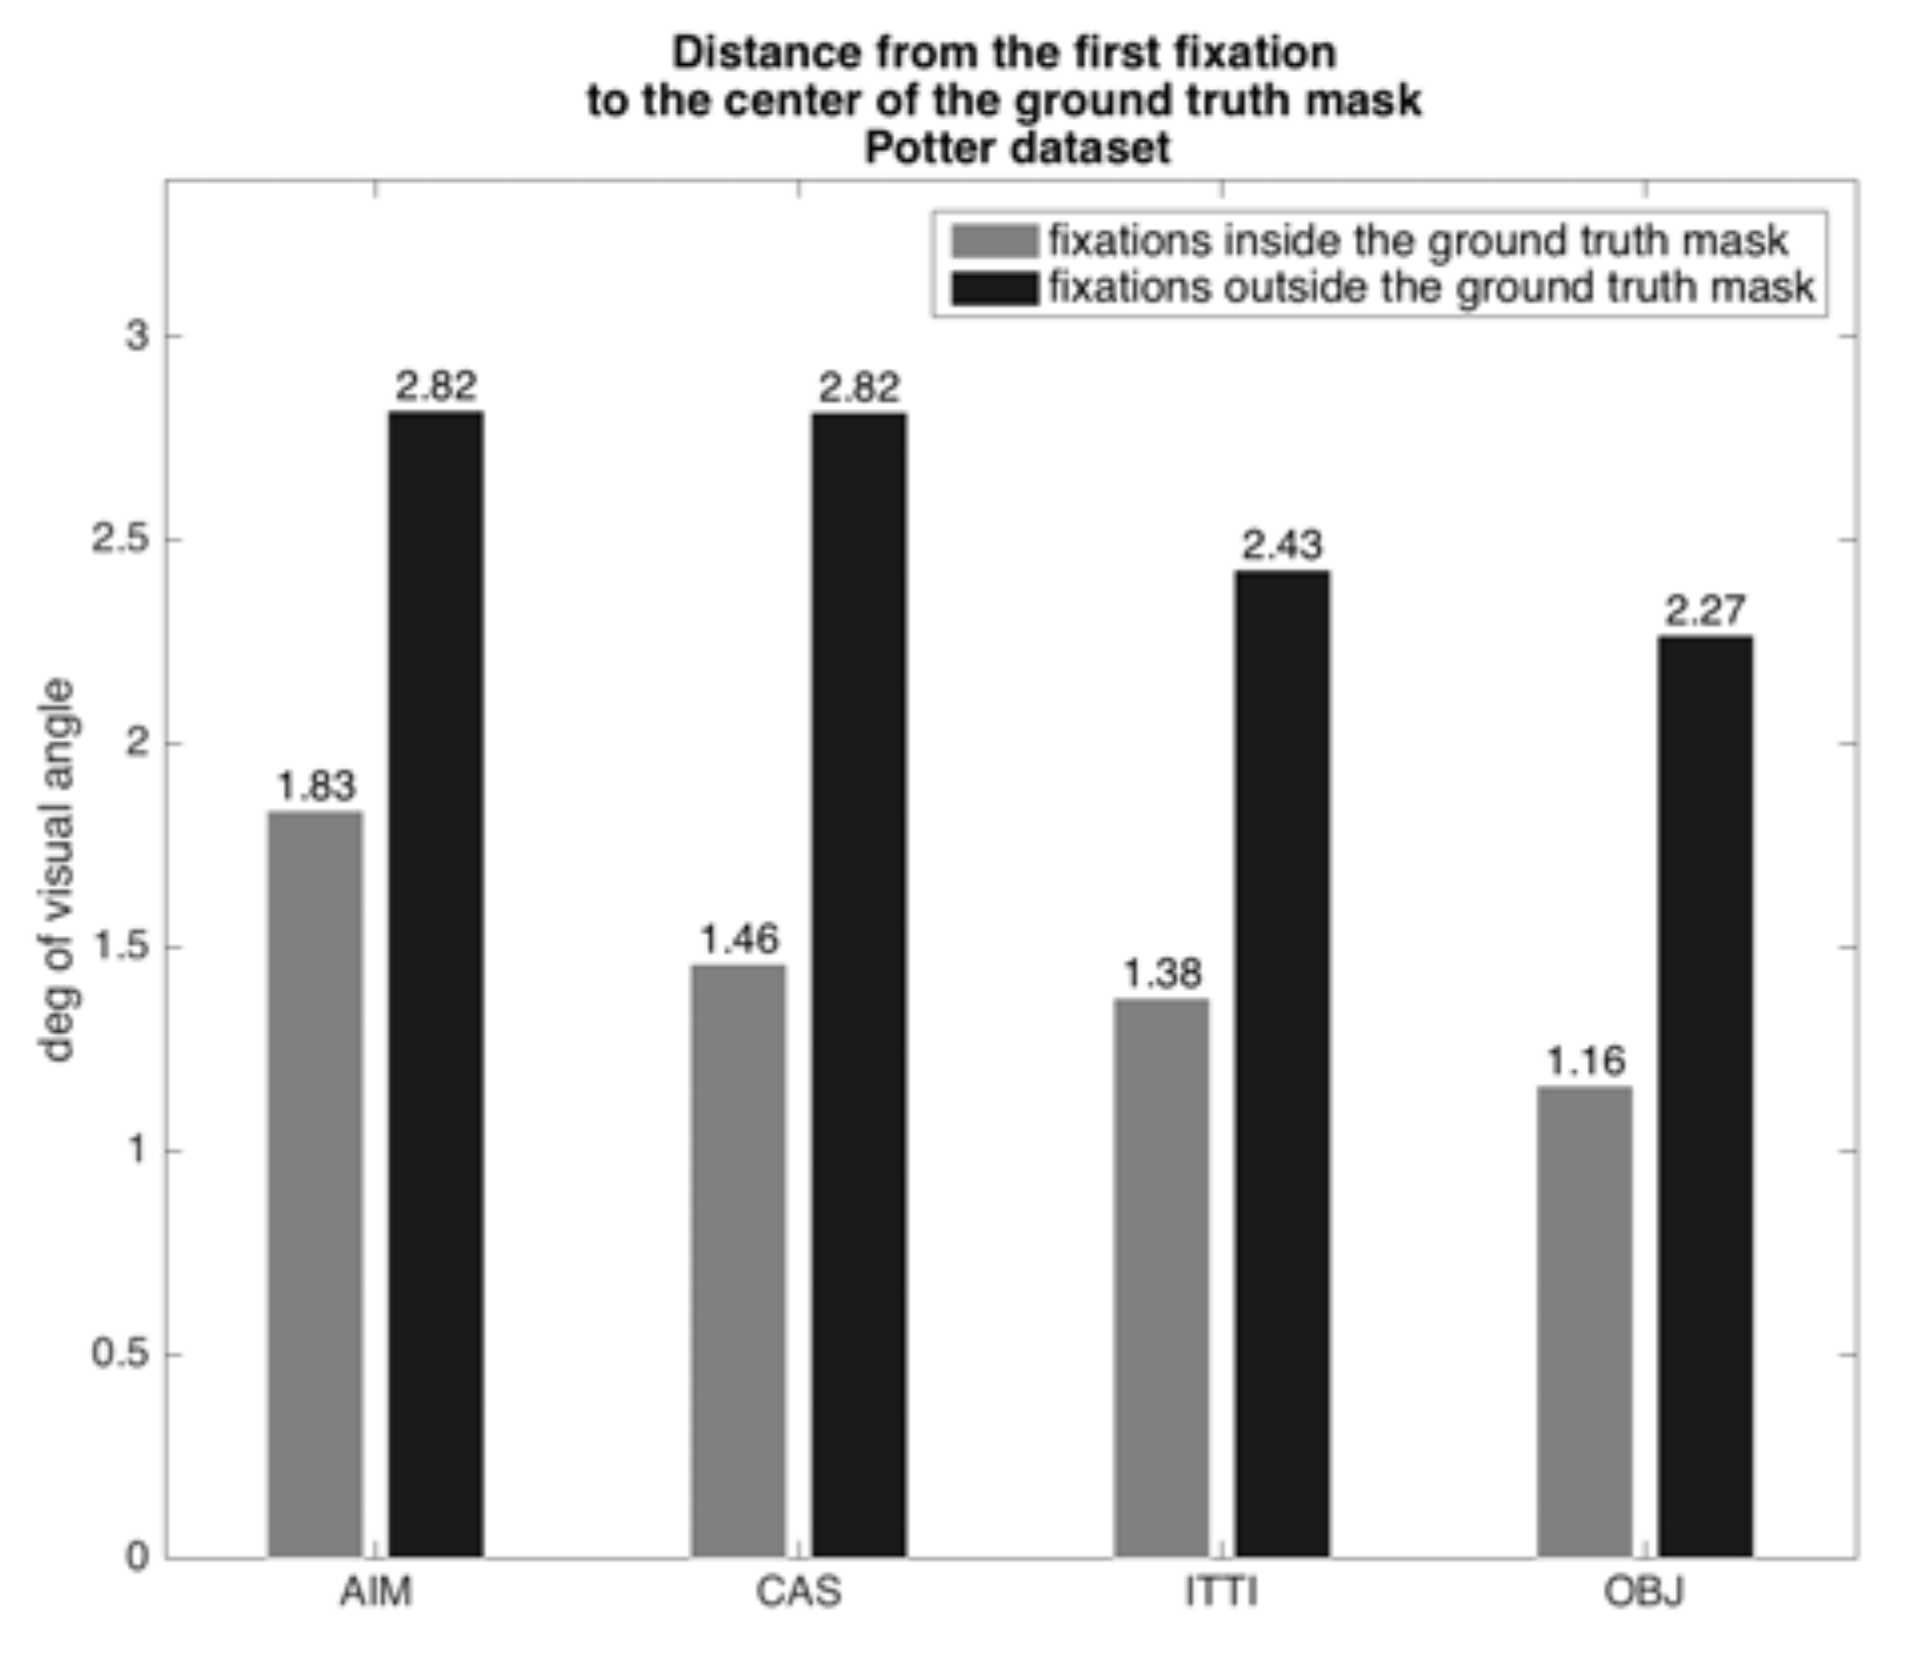
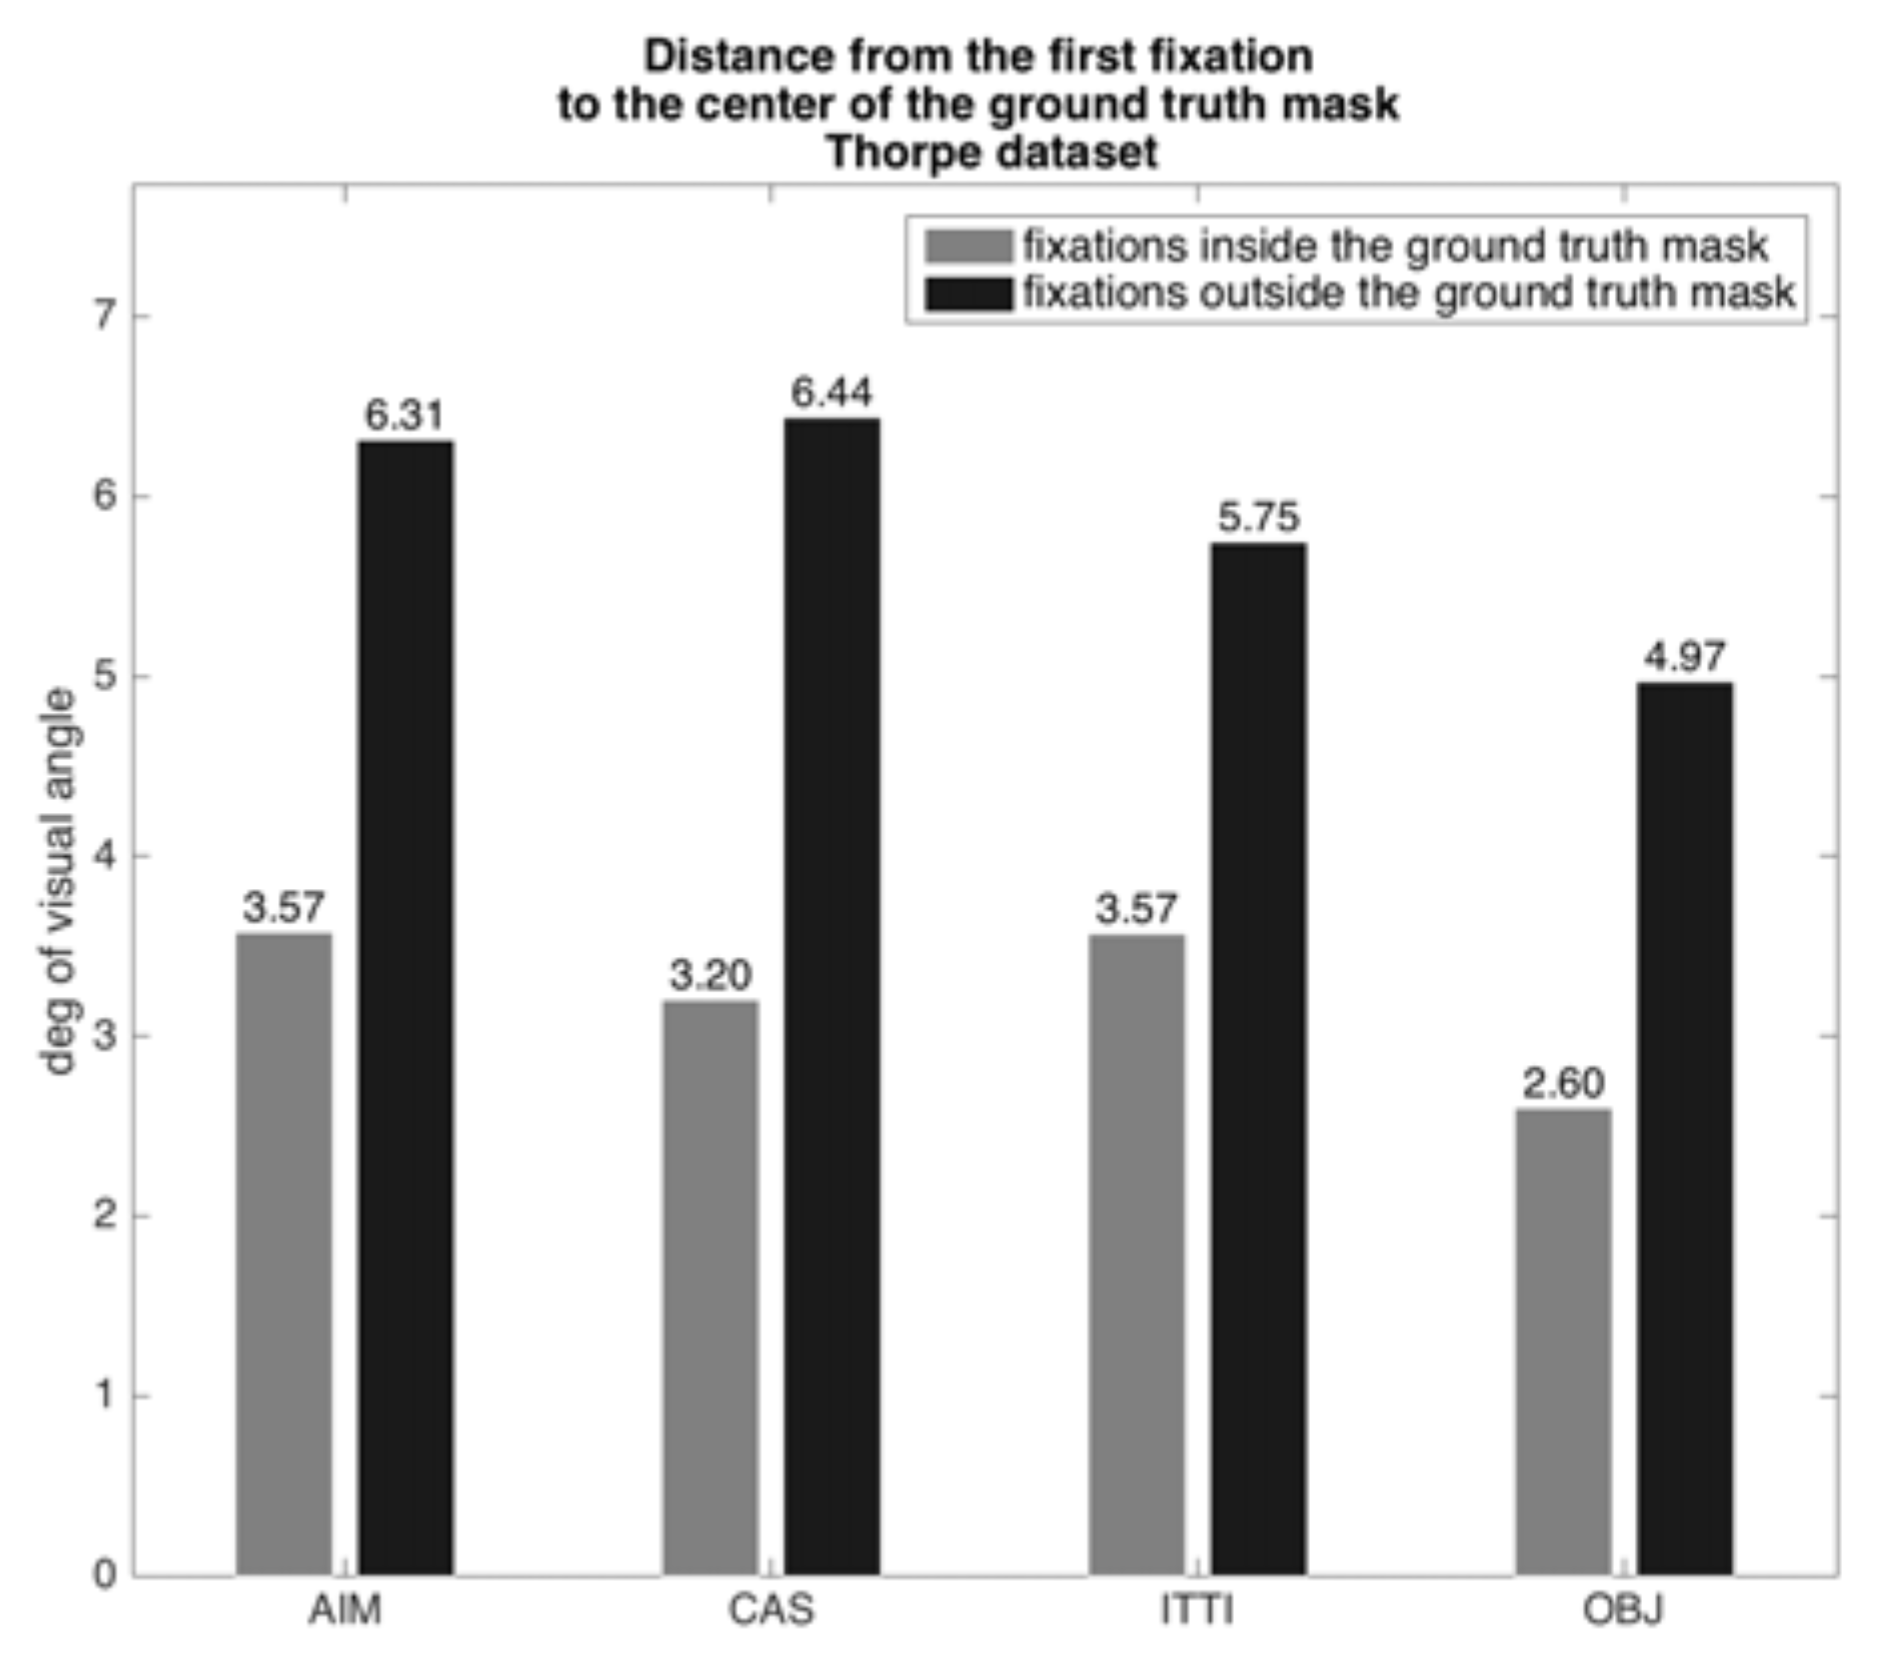
Alexe et al. 2010). All algorithms were used with default parameters and published implementations. We ran each image in both datasets through each algorithm. For each, we noted the location of the first fixation point and determined its spatial relationship to the ground-truthed target’s mask. The plots, depicted in
Figure 8 and
Figure 9, show the results for the positive target stimuli. They show two quantities for each dataset: the average distance in degrees of visual angle of an algorithm’s first fixation from the center of the target bounding box for fixations inside and outside the target bounding box (at a viewing distance of 57 cm, monitor pixel density of 95.78 PPI on a 23” diagonal with resolution set to 1920x1080). The algorithms all would place the center of the selected region for analysis well into a reduced acuity region for the Potter stimuli and much further for the Thorpe stimuli. Recall the discussion on visual acuity from a previous section, where it was shown that acuity is quite reduced for each degree of retinal eccentricity. Since the misalignment of target with fixation center ranges from 1.16° to 6.44°, this implies a serious possibility of impaired categorization performance for the saliency-driven strategy. For the Potter dataset the result is better than for the Thorpe set because the target distributions differ (
Figure 6 shows the Potter dataset is much better confined to the parafoveal region), and perhaps there is an image size effect as well.
Table 1 shows a numerical comparison of fixation results; the algorithms yield 30% 37% of first fixations outside the target region. This connects to the previous bar plots by showing the counts of fixations that went into the average values of distances shown there.
The above only considers the positive target images what about the negative target images? Thorpe et al. found that 150ms of processing is required regardless of whether the image contained a target. We ran the algorithms in the same way for all of the non-target images as well and obtained first fixations. If the Koch & Ullman processing strategy were the one used in the human visual system, the point or region around that fixation point would be processed to determine if the target were present, and likely the answer would be negative. But that negative response would be indistinguishable from a false negative on a target image, in addition to having its own error rate. Considering that a significant number of first fixations did not fall on targets for the true positive image, overall performance would be far from the human performance reported by Potter and by Thorpe. As a result, this strategy is not likely the one used in human vision. The early selection strategy is completely wrong for non-target stimuli because there can be no certainty that other locations do not contain a target. Finally, any concern regarding the appropriateness of the overall comparison because of task instructions has no basis for the non-target case; an early selection method remains ineffective and a negative response remains indistinguishable from a false positive.
Of course, there are the possibilities that we just did not test the proper saliency algorithm or that the development of saliency still has a way to go before the results of our tests might be closer to human performance. However, no further development would impact the early selection aspect of the Koch & Ullman strategy; it would remain inappropriate for the non-target stimuli.
A New Cluster of Conspicuity Representations
The previous section argued against the early selection mechanism rooted in saliency maps. Its rejection is not an easy decision to make given the wide variety of models that use saliency for this purpose. Clearly, a stimulus-based method of attracting attention seems necessary; what we propose, however, is that this is only one of several representations that combine in order to provide the decision for the right parts of a scene to present to the fovea at the right time. In the same way that the Late Selection Theory (
Deutsch & Deutsch, 1963) countered Broadbent’s Early Selection Theory (1956) and was further refined by Attenuator Theory (
Treisman 1964), here too our proposal aims to keep the useful aspects of the saliency map idea and to supplement them in order to develop a hybrid that can take on different functions as the situation requires. We propose three new representations of saliency plus one new representation of location.
The first representation replicates the stimulus-driven conspicuity representation of the original saliency map but is re-named the Peripheral Attentional Map (see
Figure 5). Like saliency maps, this encodes stimulus-driven local feature conspicuity a stimulus-based attentional push with the important difference that it is restricted to the visual periphery in order to participate in a solution to the boundary problem. Its role is to enable fixation changes for reasons of surprise, novelty and exploration. Our preferred algorithm for its computation is the AIM algorithm (
Bruce & Tsotsos 2009,
2005) because its roots are in information theory and specifically targeted for surprisal.
Object-centred conspicuity drives central visual field fixation changes that are intended to examine object components (or motions) for purposes such as description, comparison or discrimination, as well as pursuit. This corresponds to the box labeled Central Attentional Map in
Figure 5. The central-peripheral distinction is imposed not only because of the retinal receptor anisotropy, but also to solve the hierarchical boundary problem previously described. In the section on the boundary problem, evidence was given for the highest levels of visual cortex faithfully representing only the central portions of the visual field. As a result, this map covers only that central region. This central focus of attention (cFOA) is computed by the competitive selection mechanism within the Selective Tuning model (ST) that is based on a region winner-take-all algorithm (
Rothenstein & Tsotsos 2014;
Tsotsos 2011).
Task-specific attentional pull represents the desire of the perceiver to attend a particular location, feature, motion or object related to the current task. A high degree of urgency, or attentional pull, imposes a priority for the system to attend some location. This representation, (labeled “What have I seen? What should I see” in
Figure 5) can adjust (strengthen or weaken, narrow or expand) or override location-based inhibition-of-return (IOR) and its natural decay, or add new locations/features for priority. It involves at least two influences: a bias against what has been previously fixated and bias for what the current task needs fixated. The negative bias may be interpreted in the context of a task as “I have already looked at this location, so likely do not need to look again”, while the positive bias could be thought of as “I still need to look at this location in order to complete my task” or “I know I have looked here before but I think there is more information relevant to my task to be obtained by looking again”. The method for computing this representation is a current topic of study; a good early effort for the task-based component can be seen in
Navalpakkam & Itti (
2005) while a more recent investigation in the relationship between task and attention can be seen in
Haji-Abolhassani & Clark (
2013). Clearly, a tight linkage between working memory and task execution control is required for such a representation and such an effort is part of the STAR framework.
The Attentional Sample (AS) is a representation introduced to answer the question “what is extracted from an attentional fixation?” This is very much like the output of what
Wolfe et al. (
2000) call postattention the process that creates the representation of an attended item that persists after attention is moved away from it. Part of this must include detailed location information. It is computed by the recurrent localization mechanism of Selective Tuning (
Tsotsos 1993;
2011;
Rothenstein & Tsotsos 2014). As a component of the fixation control strategy the important role of the attentional sample is to provide sufficiently precise location information so that an eye movement can be correctly executed, including microsaccades. The crux of the method is that the process traces back the neural activations from the cFOA selected at the highest levels of vision to the earliest representations that correspond to each pixel of the cFOA (examples are shown in
Tsotsos 2011). That tracing back continues as long as there are recurrent connections, and this basically means all the way to the LGN. What is needed now is to ensure that there is enough spatial resolution in LGN representations of the fovea to enable almost cone-level selection. Curcio & Allen (1990) report that each cone in the fovea, up to about 1° eccentricity, contacts 3 ganglion cells and for several degrees more, contacts 2. Ganglion cells have a one-to-one relationship with optic nerve fibers and thus input to LGN. It is clear then, that within the fovea, location precision is available for our recurrent localization (see
Rothenstein & Tsotsos 2014;
Tsotsos 2011;
Boehler et al. 2009;
Tsotsos 1993) at the level of the LGN.
This recurrence and computation takes time. It is processed concurrently with the other components of the overall strategy. The key temporal constraint is that the recurrence must have completed and the location must be available at the same time that the global focus of attention (gFOA) is passed on to the eye movement controller. If, for any reason, an eye movement is initiated before this temporal constraint is satisfied, that movement is more likely to require correction during its trajectory or after landing in order to conform to the spatial instruction contained in the attentional sample.
We also need to propose a different overall processing strategy to deal with the non-target scenario that led to our decision to abandon the Koch & Ullman algorithm. For the Potter and Thorpe stimuli, the entire image would fall within our object-centered conspicuity representation. This representation not only plays a role in determining the next eye movement, but also in any further scene interpretation or decision downstream in the system. In both cases, it would provide sufficient information to a global process to determine target presence or absence. Late selection is thus the better strategy for these stimuli because it permits a global, objectbased, determination for target absence. Several previous authors have emphasized the need for attention to operate in such a late selection manner (for example,
Fuster 1990). Of course, we cannot forget that the central representations have limits too: a late selection strategy is only good for the central portion of the visual field as previously argued, further motivating the complementarity present in our hybrid solution. This also highlights that an early selection strategy may be the only viable one when targets are found in the mid-to-far periphery.
Many authors have considered the issue of the neural correlate to representations of conspicuity or saliency. Whether or not a single such representation exists in the brain remains an open question with evidence supporting many potential loci: superior colliculus (
Horwitz & Newsome, 1999;
Kustov & Robinson, 1996;
McPeek & Keller, 2002); LGN (
Koch, 1984;
Sherman & Koch, 1986); V1 (
Li, 2002); V1 and V2 (
Lee et al. 1999); pulvinar (
Petersen et al. 1987;
Posner & Petersen, 1990;
Robinson & Petersen, 1992); FEF (
Thompson et al. 1997); parietal areas (
Gottlieb et al. 1998). In each of these, the connection to a saliency representation is made because maxima of response that are found within a neural population correspond with the attended location. Each of the examined areas has such correlated maxima; could it be that they all do simultaneously? Perhaps this is why evidence has been found in so many areas for the neural correlate to the saliency map. Maybe saliency is a distributed computation, and, like attention itself, evidence reflecting these computations can be found in many, if not all, neural populations. Our cluster of representations is a potential way out of this debate.
Combining the Elements: STAR’s Fixation Control Strategy
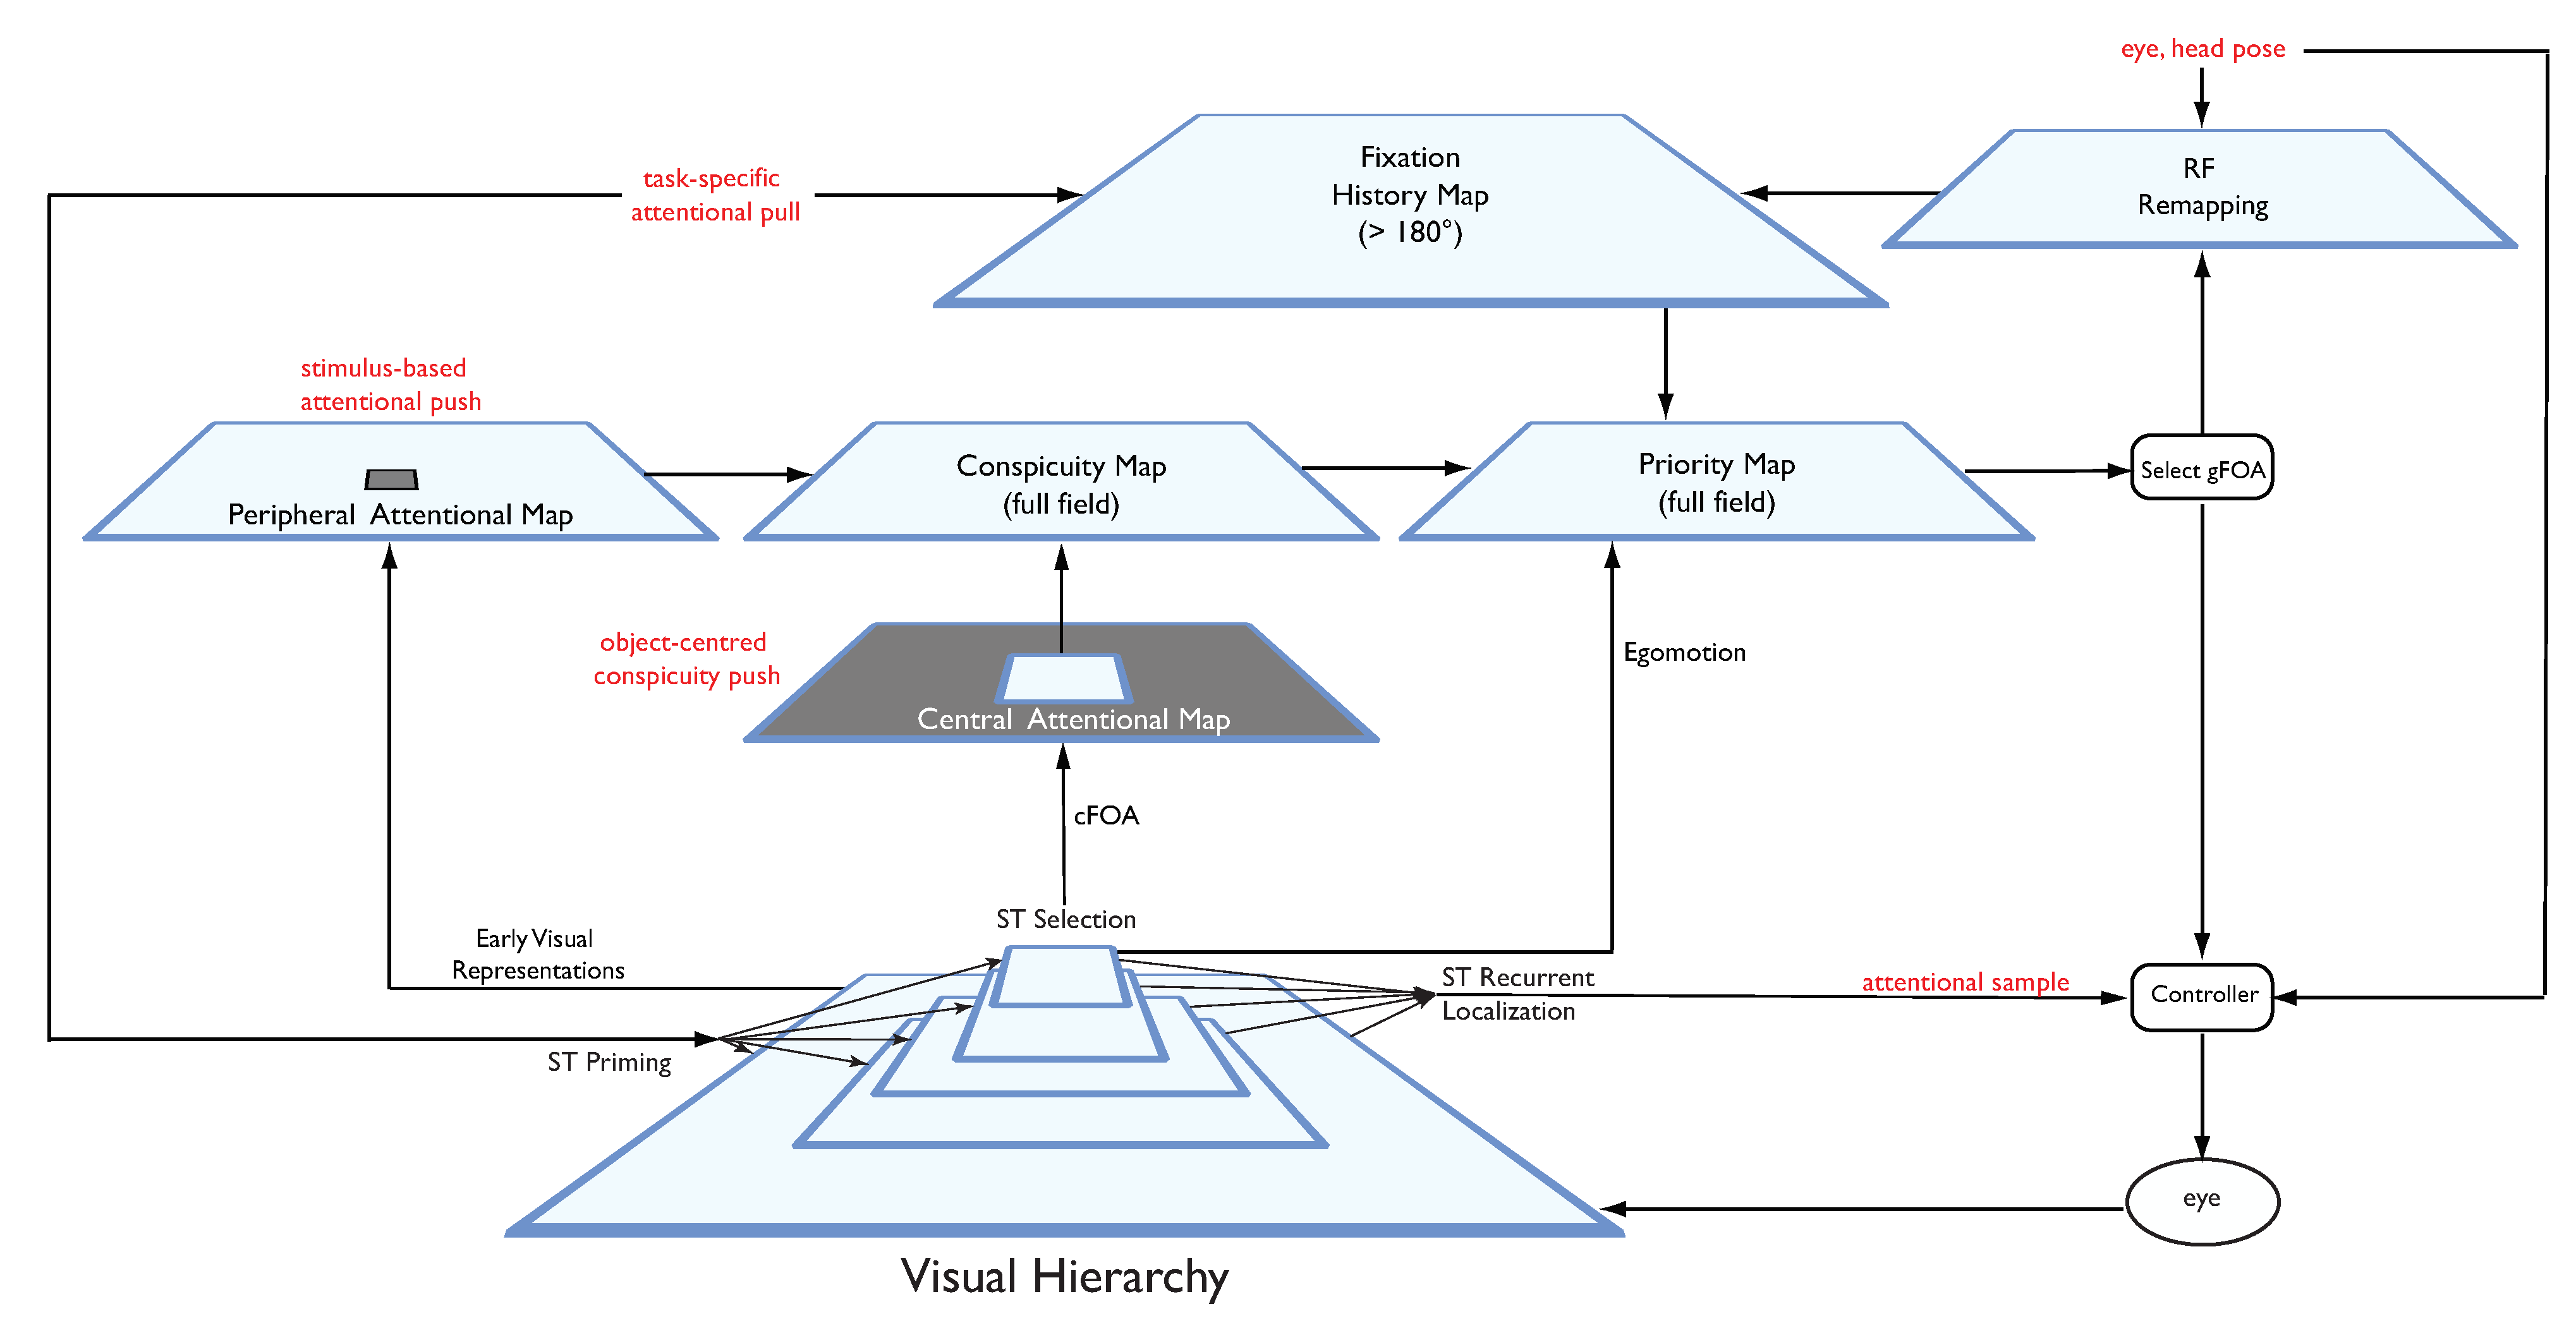
It is time to put all of the elements presented so far together into a unified picture, as mentioned earlier. In Tsotsos & Kruijne (2014) an overview of how the Selective Tuning model is extended was presented. This extended system is named STAR: The Selective Tuning Attentive Reference model. The fixation control strategy within STAR is shown in
Figure 10. It is important to note that this is designed from a functional viewpoint, constrained by several characteristics of biological vision systems. The basic characteristics are:
The purpose of all saccades is to bring new information to the retina and because the center of fovea has the highest density of receptors, it is the ideal target for new information.
Overt and covert attentional fixations are integrated into the fixation control system. Overt saccades cover the full range of amplitudes possible while a covert fixation would require a completely stationary retina. The choice between whether to execute an overt or a covert fixation depends largely on the purpose for the fixation, i.e., on the representation we term the task-specific attentional pull. Typical components of this pull that matter in this regard are whether or not the agent wishes or is allowed to make an overt fixation, and if the location of the target stimulus in the visual field with the current fixation permits spatial sampling of sufficient quality to satisfy the task requirements by covert (if yes) or overt (if no) fixation.
A hybrid early-late selection strategy is proposed to solve the boundary problem by combining a peripheral feature-based attention representation with a central object-based attention representation.
Functionality is provided so that the right parts of a scene are presented to the fovea at the right time. Those right parts are determined by a combination of the priority or urgency to attend to a particular location, feature or object related to the current task, surprise or novelty of a stimulus, the need to explore the visual world, and functional needs such as description, comparison or discrimination. The right time to present the right parts is determined by a modulation of the representation that drives selection. That modulation comes from representations that have broad functionality, including urgency as well as novelty and surprise.
The model enables different eye movement types to be integrated into a single, unified, mechanism (specifically, saccades, attentional microsaccades, corrective microsaccades, and pursuit). Other eye movement types, such as vergence, are within its future extensions (for a stereo vision version of ST see
Bruce & Tsotsos 2005).
The system architecture is presented as a sequence of transformations on representations (trapezoidal boxes in the figure), representations being connected by actions (arrows or rounded rectangles). Arrows that connect two representations represent non-linear weighted sum operations of the form typically seen in other neural models. Each representation is thus a function of two or more other representations. A rounded rectangle is a process that is executed on a representation and has an output that goes to another representation or process. The components of this diagram follow.
a. Peripheral Attentional Map It is derived from early visual representations (such as those found in visual areas V1 or V2) in order to minimize the impact of the boundary problem on peripheral representations. In our realization, the AIM algorithm, as previously mentioned, covering only the periphery of the visual field, computes it. This does not mean that feature-based attention does not operate in the central visual field; of course it does, but from an eye movement point of view, any features that might attract attention within the central field are already being processed fully. Only features outside the central region need special consideration. A potential neural counterpart might be area V6Av (
Pitzalis et al. 2013;
Galletti et al. 1999b). It is important to note that in the monkey, area V6A has been divided into two subregions (see Luppino et al. 2005 and Gamberini et al. 2011), namely, V6Ad and V6Av. Both contain visual cells, but V6Ad mainly represents the central 30° of the visual field, whereas V6Av mainly represents the peripheral part of the visual field (>30° eccentricity) (Gamberini et al. 2011). In humans,
Pitzalis et al. (
2013) have found the homologue of monkey V6Av and they report that V6Av represents the far periphery (as in monkey) >30° of eccentricity. Further, it receives input from early visual areas. As a result, V6A, and particularly V6Av, satisfies the requirements for our Peripheral Attentional Map representation.
b. Central Attention Map The central attention map receives input from the highest layers of the visual hierarchy, both objects and motions. Object or motion conspicuity determines the relative strength of all stimuli across the central visual field. It is also the representation over which ST’s selection method is computed which provides hypotheses for further decision-making regarding task completion (
Tsotsos 2011). However, for the purpose of fixation control, it is the object/motion conspicuity that is used. A neural correlate might be area V6 (
Pitzalis et al. 2006;
Fattori et al. 2009;
Galletti et al. 1999a), or perhaps as noted in the previous paragraph, in conjunction with V6Ad. Area V6 clearly has its own representation of the fovea, distinct from the foveal representation of the other dorsal visual areas.
Braddick & Atkinson (
2011) include area V6 in their schematic of brain areas involved in visuo-motor modules for the development of visually controlled behaviour, specifically, saccades and reaching. Human V6 has a representation of the center of gaze separate from the foveal representations of V1/V2/V3, and importantly lacks a magnification factor. For the purposes of this representation, magnification factor is not needed, just a point-to-point representation. It is interesting to note how there seems to be a correspondence between the extent of this central representation and the area of strong central representation in the upper layers of the visual processing hierarchy. Given the realities of the boundary problem, this may be more than coincidence.
c. Task-specific Attentional Pull These are influences from outside the fixation control system.
Buschman & Miller (
2007) claim that these influences arise in prefrontal cortex and flow downwards, specifically from the frontal eye fields (FEF) and lateral prefrontal cortex (LPFC). In our model, we intend these to be due to the world knowledge of the perceiver, the task instructions given to the perceiver or imposed by the perceiver, interpretations of already seen scenes that impact the current perception, and so on. These issues are for future work.
d. The Attentional Sample (AS) During ST’s recurrent localization, competitive processes at each level of the hierarchy, in a top-down progression, select the representational elements that correspond to the attended stimulus. The purpose is to extract the information that a task might require and this is not always the information at the highest level, say at the level of object categories. Some tasks will require more detail, such as locations, or feature characteristics. In general, the AS is formally a subset of the full visual hierarchy, where there is a path from the top of the hierarchy to the earliest level, and where at every level, a connected subset of neurons with spatially adjacent receptive fields comprises the selected stimulus at that level of representation. The full AS then contains all the neurons that correspond to the selected stimulus, which then specifically represent its retinotopic location that can be used to guide an eye movement.
e. Fixation History Map (FHM) This is a representation of 2D visual space larger than the visual field that combines the sequence of recent fixations with task specific biases. Locations that have been previously fixated decay over time through a built-in inhibition-of-return process or can be reinforced via task biases. This means that there will be a tendency to not fixate previously fixated locations unless there is a task-specific reason to do so (see Klein 2000). Task influence, then, modulates the impact that fixation history has on the representation from which next the fixation target is selected. The FHM is centered at the current eye fixation and represents 2D space in a gaze-centered system. The FHM is updated on each fixation with an associated saccade history shift with direction and magnitude opposite to the trajectory of the eye movement so that correct relative positions of fixation points are maintained (
Colby & Goldberg, 1999;
Duhamel et al., 1992; see also
Zaharescu et al., 2004;
Wloka 2012). In essence, the FHM is a type of shortterm memory. A possible neural correlate may be the frontal eye fields (FEF).
Tark and Curtis (
2009) found evidence for FEF to be an important neural mechanism for visual working memory and represents both retinal and extra-retinal space, just as we need.
Just to provide one example of task modulation, consider an instruction to an experimental subject to maintain fixation to within a 2° window (corresponding to point b of the concluding paragraph on the section titled Fixation Change Targets the Fovea). This could be translated into a spatial preference for the image center in the representation of FHM, and thus modulate the priority map by suppressing its contents outside the acceptable fixation window. Thus, even if the central attentional map gives strong response to a target, for example, at 10° eccentricity, that will be suppressed in the priority map and not trigger an eye movement. The only eye movements that would be considered by the controller are those within the acceptable window. But, as noted earlier, these are the ones typically ignored by the experimenter (see footnote 1), and thus processing would be labeled as covert even though attentional microsaccades might be executed.
f. RF Remapping The representations of peripheral attention, central attention, conspicuity, priority, location, and fixation history are all in a gaze-centered coordinate system. When gaze changes, the coordinates must be remapped to reflect the change and to cause all points to be corresponded appropriately. The RF Remapping process accomplishes this, taking as input the current eye and head pose, the previous gaze and the new gaze in order to compute a change vector for each point in the visual field of the FHM. This change need not apply to the other maps because the new gaze will refresh them. The algorithm for performing this was abstractly described in
Colby & Goldberg (
1999) and
Duhamel et al. (
1992), and detailed computationally in
Zaharescu et al. (
2004) and
Wloka (
2012). The FHM is updated on each fixation with an associated saccade history shift with direction and magnitude opposite to the trajectory of the eye movement so that correct relative positions of fixation points are maintained.
g. Conspicuity Map The conspicuity map here is the closest to the saliency map of Koch & Ullman. It is the combination of the peripheral and central attention maps.
White & Munoz (
2011) advocate that the superior colliculus (SC) represents two largely independent structures with functionally distinct roles. One is consistent with the role of a salience map, where salience is defined as the sensory qualities that make a stimulus distinctive from its surroundings. The other is consistent with the role of a priority map (
Fecteau and Munoz, 2006), where priority is defined as the integration of visual salience and behavioural relevance, the relative importance of a stimulus for the goal of the observer. Our conspicuity map corresponds to the former and our priority map, described next, the latter. This is not without controversy, however.
Miller & Buschman (
2013), for example, suggest that bottom-up attention, salience, originates in LIP. There are other views also as was discussed in an earlier section.
h. Priority Map The priority map combines input from the conspicuity map, the fixation history map (to modulate conspicuity reflecting inhibition of return and task influences) and an egomotion representation. There is some evidence to support an egomotion representation in area 7a, a late stage of the dorsal motion processing stream (
Siegel & Read 1997) and we have modeled this previously (
Tsotsos et al. 2005). The egomotion representation is included here in order to assist with pursuit eye movements. If the eye is pursuing a visual target, then this is reflected in a representation of full field motion. There is no focus of expansion/contraction, but rather there is full field translation. This translation, direction and speed, can act as a predictor of where to fixate next in order to maintain pursuit. This prediction can then modulate the priority representation. It acts only as a modulator rather than a driver because there are situations where there might in fact be a higher priority target, say due to a surprise element appearing in the peripheral attention map. The main decision of global Focus of Attention (gFOA) is made using the priority map, combining all of these components. Its use here seems closely related to the Priority Map of
Fecteau and Munoz (
2006).
i. Visual Hierarchy This is the usual hierarchy of visual areas, dorsal and ventral, involved in visual interpretation, surveyed in
Kravitz et al. (
2013). In the figure, it is caricatured as a single pyramid but the model permits a complex lattice of pyramid representations (see
Tsotsos 2011). The hierarchy is supplemented with the Selective Tuning attention model that implements taskguided priming, recurrent localization and selection of the central attentional focus (cFOA). Realizations of shape, object and motion hierarchies that include the attentional process are overviewed in
Tsotsos (
2011). The central attentional focus may be an object, a moving object, a larger component of a scene, a full scene, or may even be multiple items.
An Example
A first demonstration of this control strategy follows, presented in several parts. It is important to note at the outset that not all of the structure in
Figure 10 has been implemented at this time; there is no implementation of task influences and thus we demonstrate free-viewing performance only, the attentional sample is not included nor is it needed for the example since we do not have a high resolution task, and the pursuit cues are also not included, and again, not needed since the image is static.
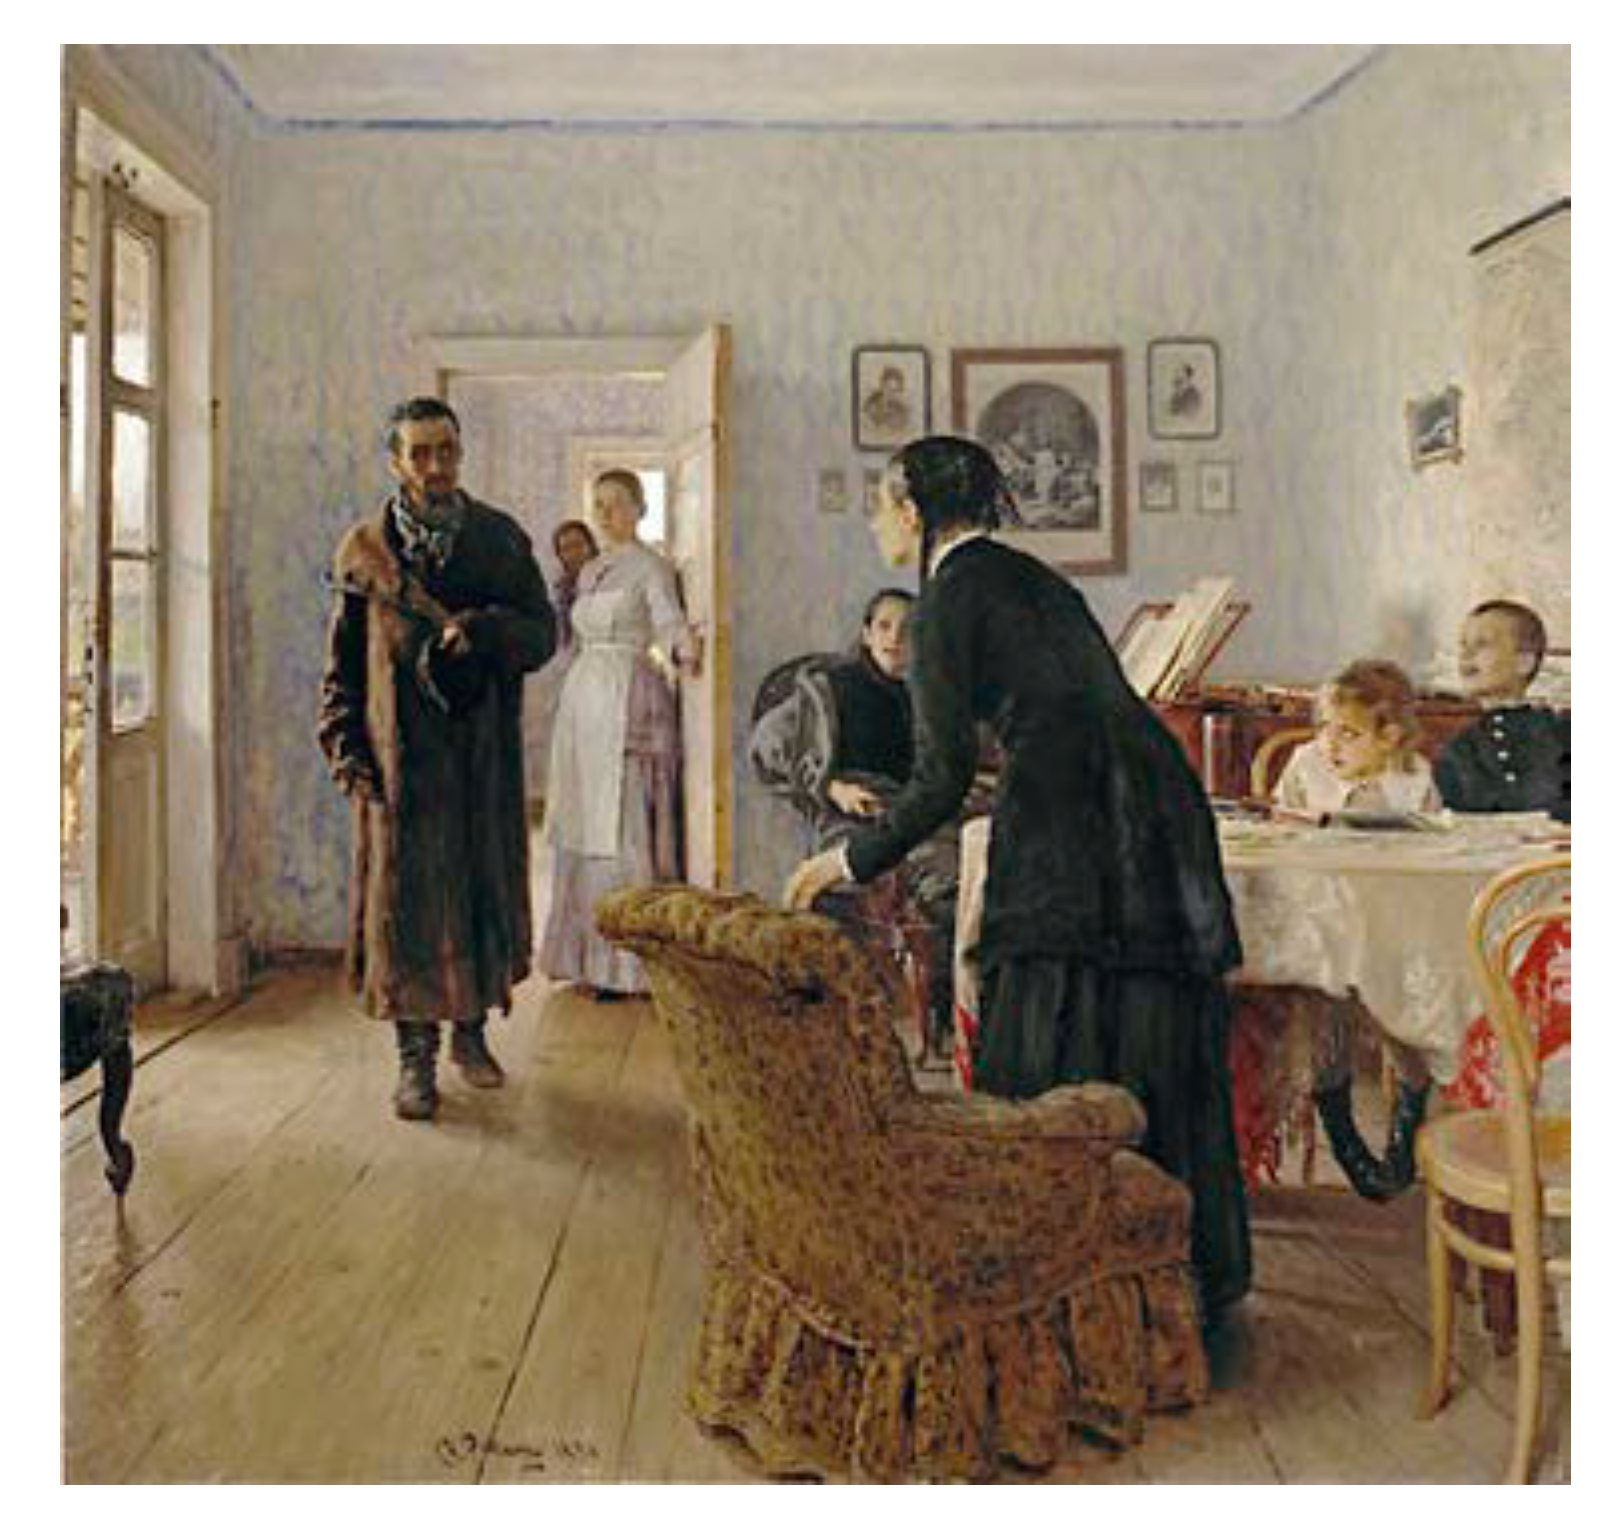
In order to create the demonstration we considered the corpus of available eye movement datasets on which standard models are evaluated, but concluded that they are not applicable and the kinds of quantitative metrics used for comparative evaluation of existing models cannot be used (from a ground truth perspective there is an issue with exposure duration, and from a quantitative metric comparison, most metrics are heat-map based and do not take into account temporal sequence). For this first demonstration we are resigned to qualitative examples only. A classic qualitative example of eye movement patterns is due to Yarbus (1967) (The figures we reproduce here are from the Russian edition, found widely on the web, because they are of much higher quality. А. Л. Ярбус. Рoль движений глаз в прoцессе зрения. Наука, 1965) who recorded scanpaths of subjects viewing the painting by Ilya Repin
Unexpected Visitors (
Figure 11). He published an interesting variety of scanpaths, the best known and reproduced example is that for a single individual who was asked a variety of questions about the painting, in addition to being allowed to view it freely. This result is reproduced in our
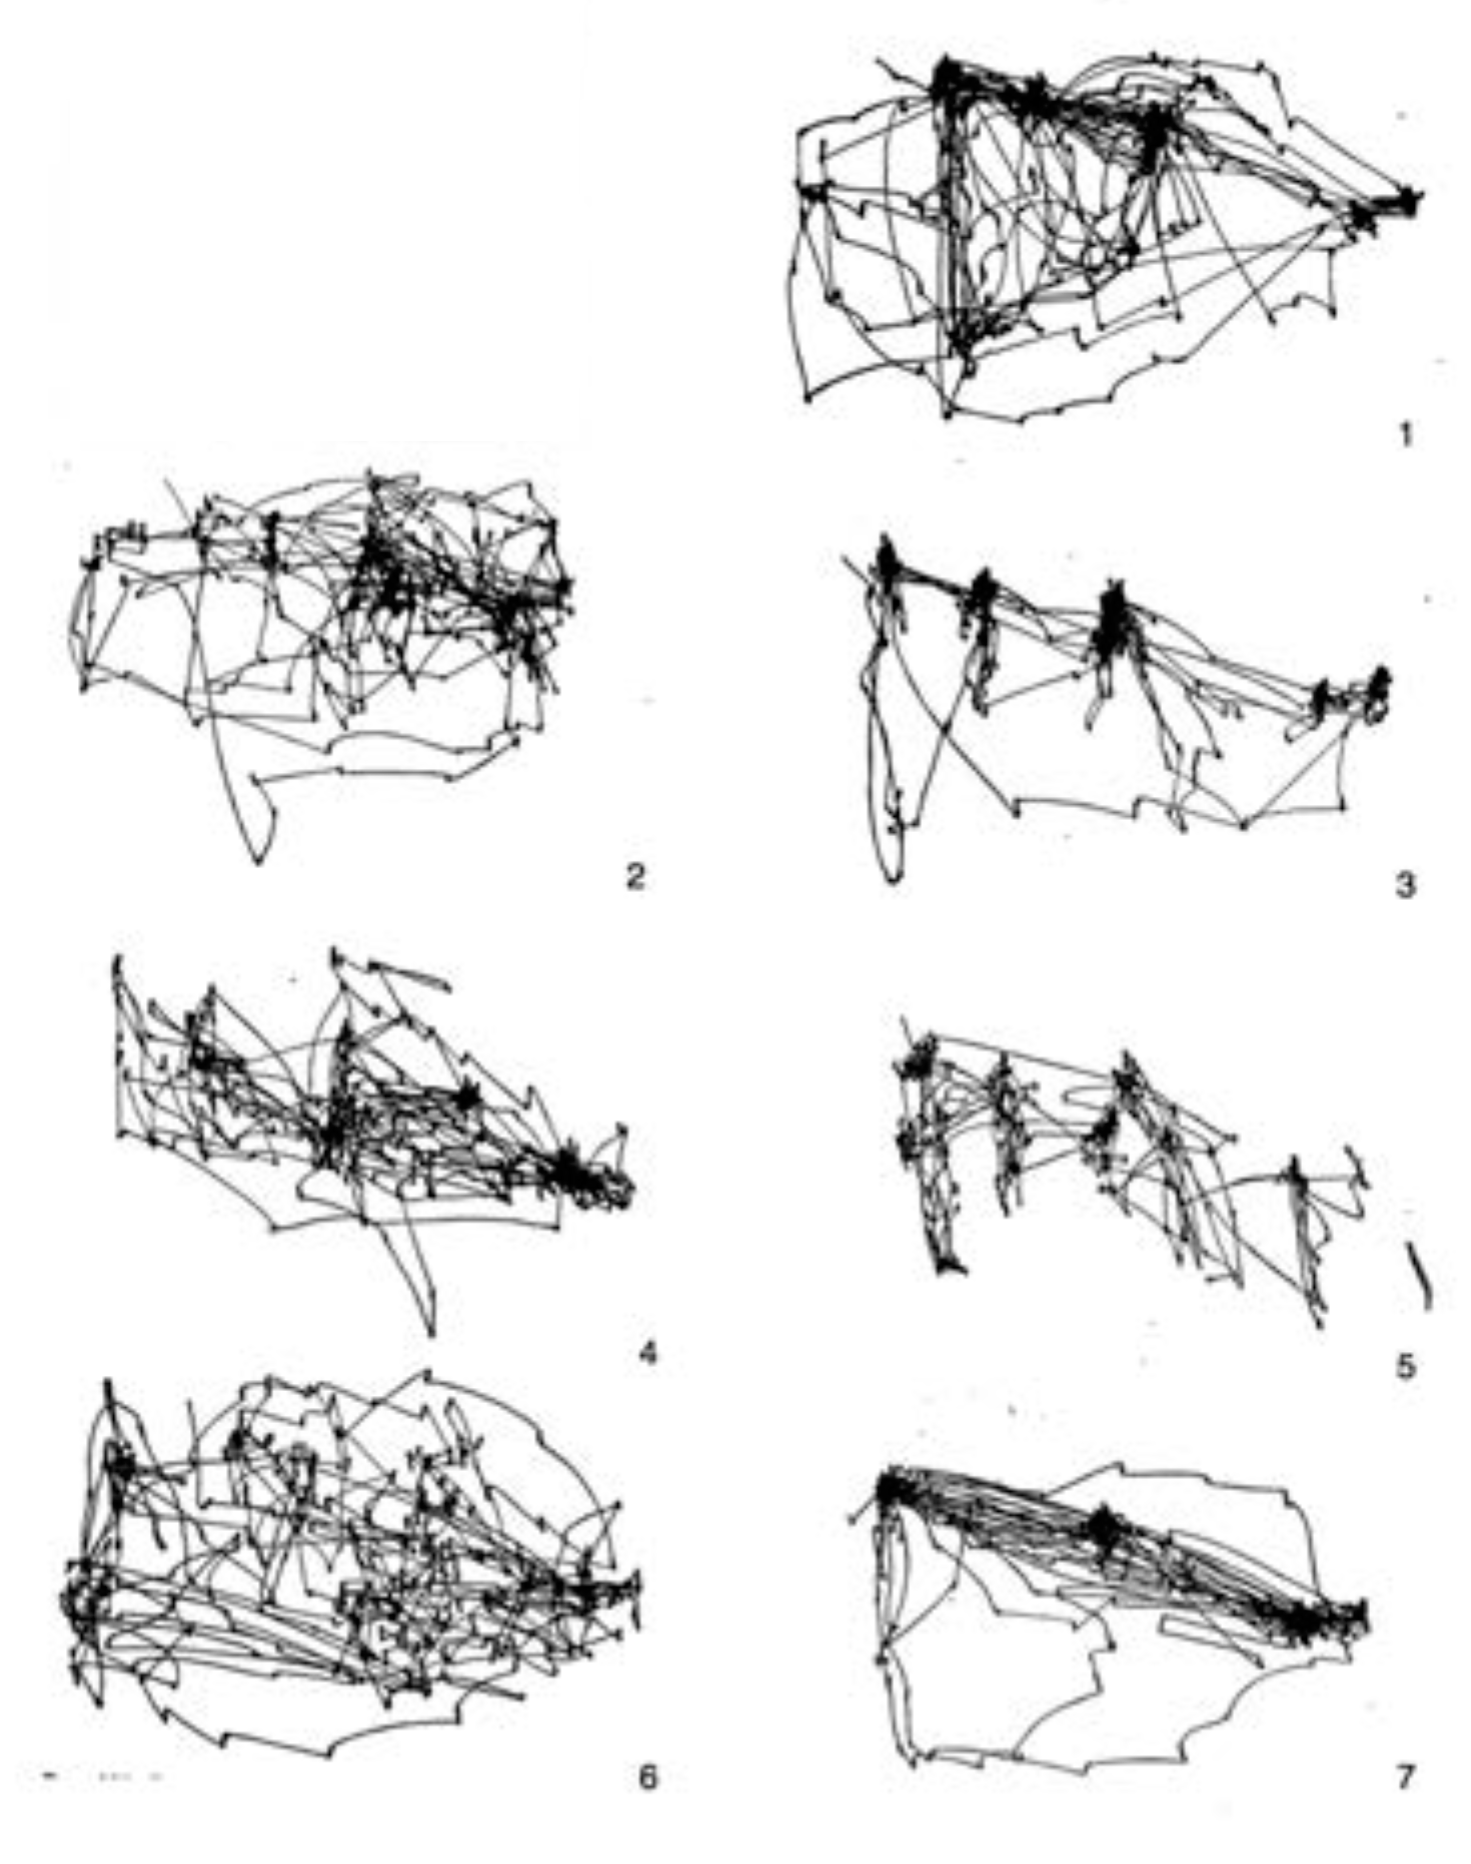
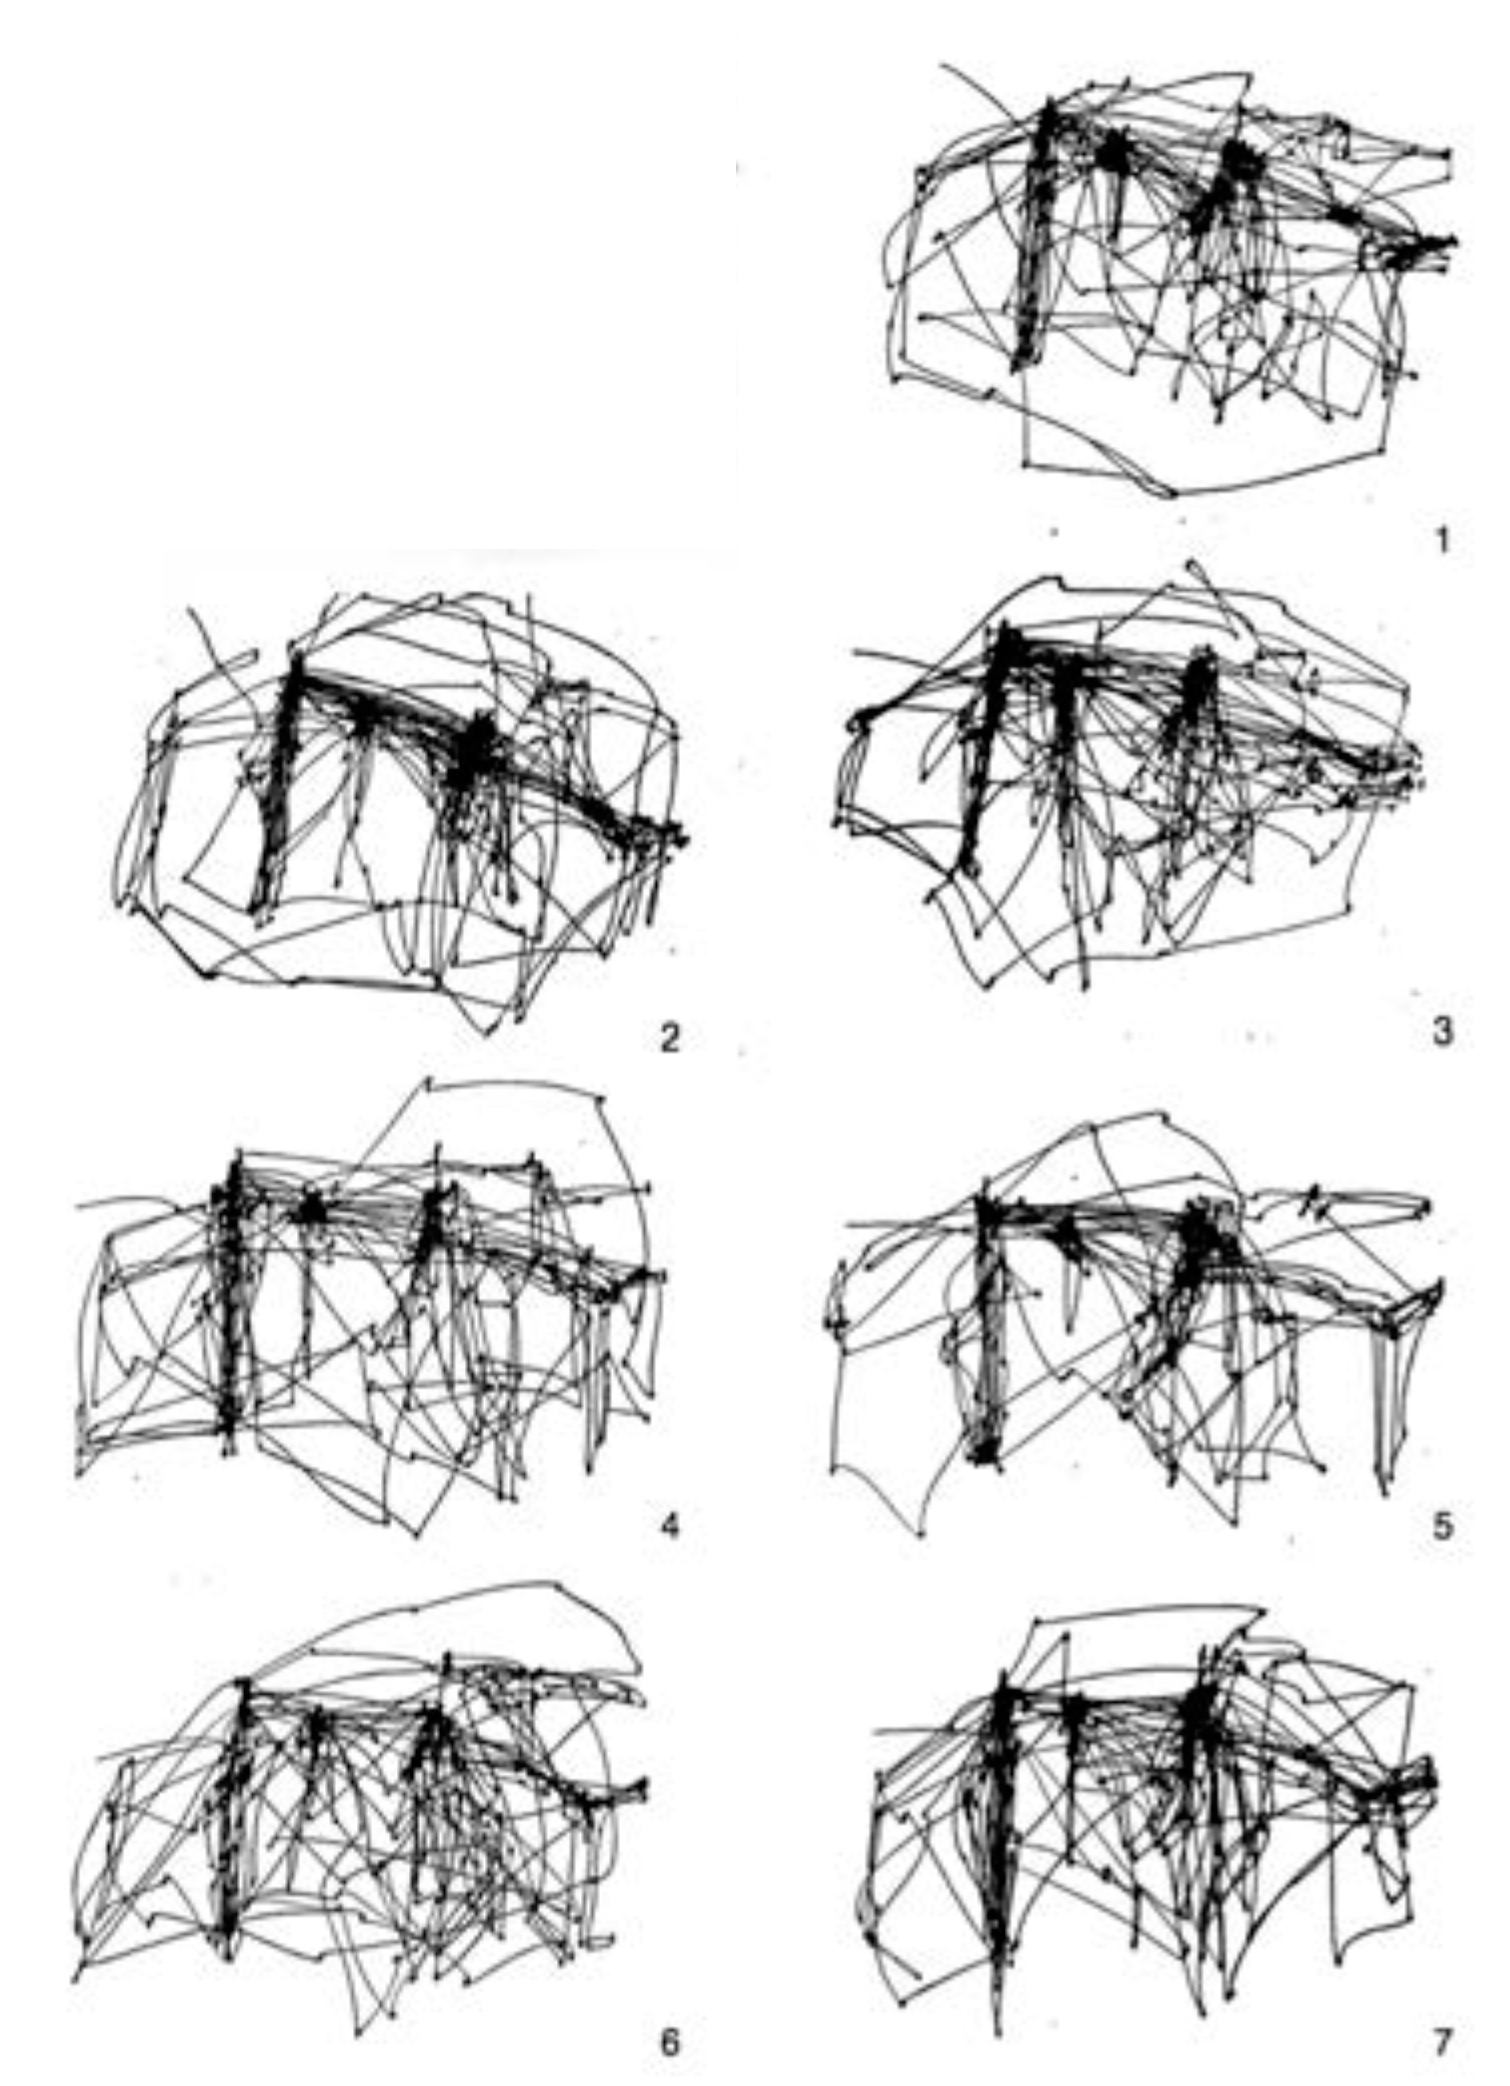
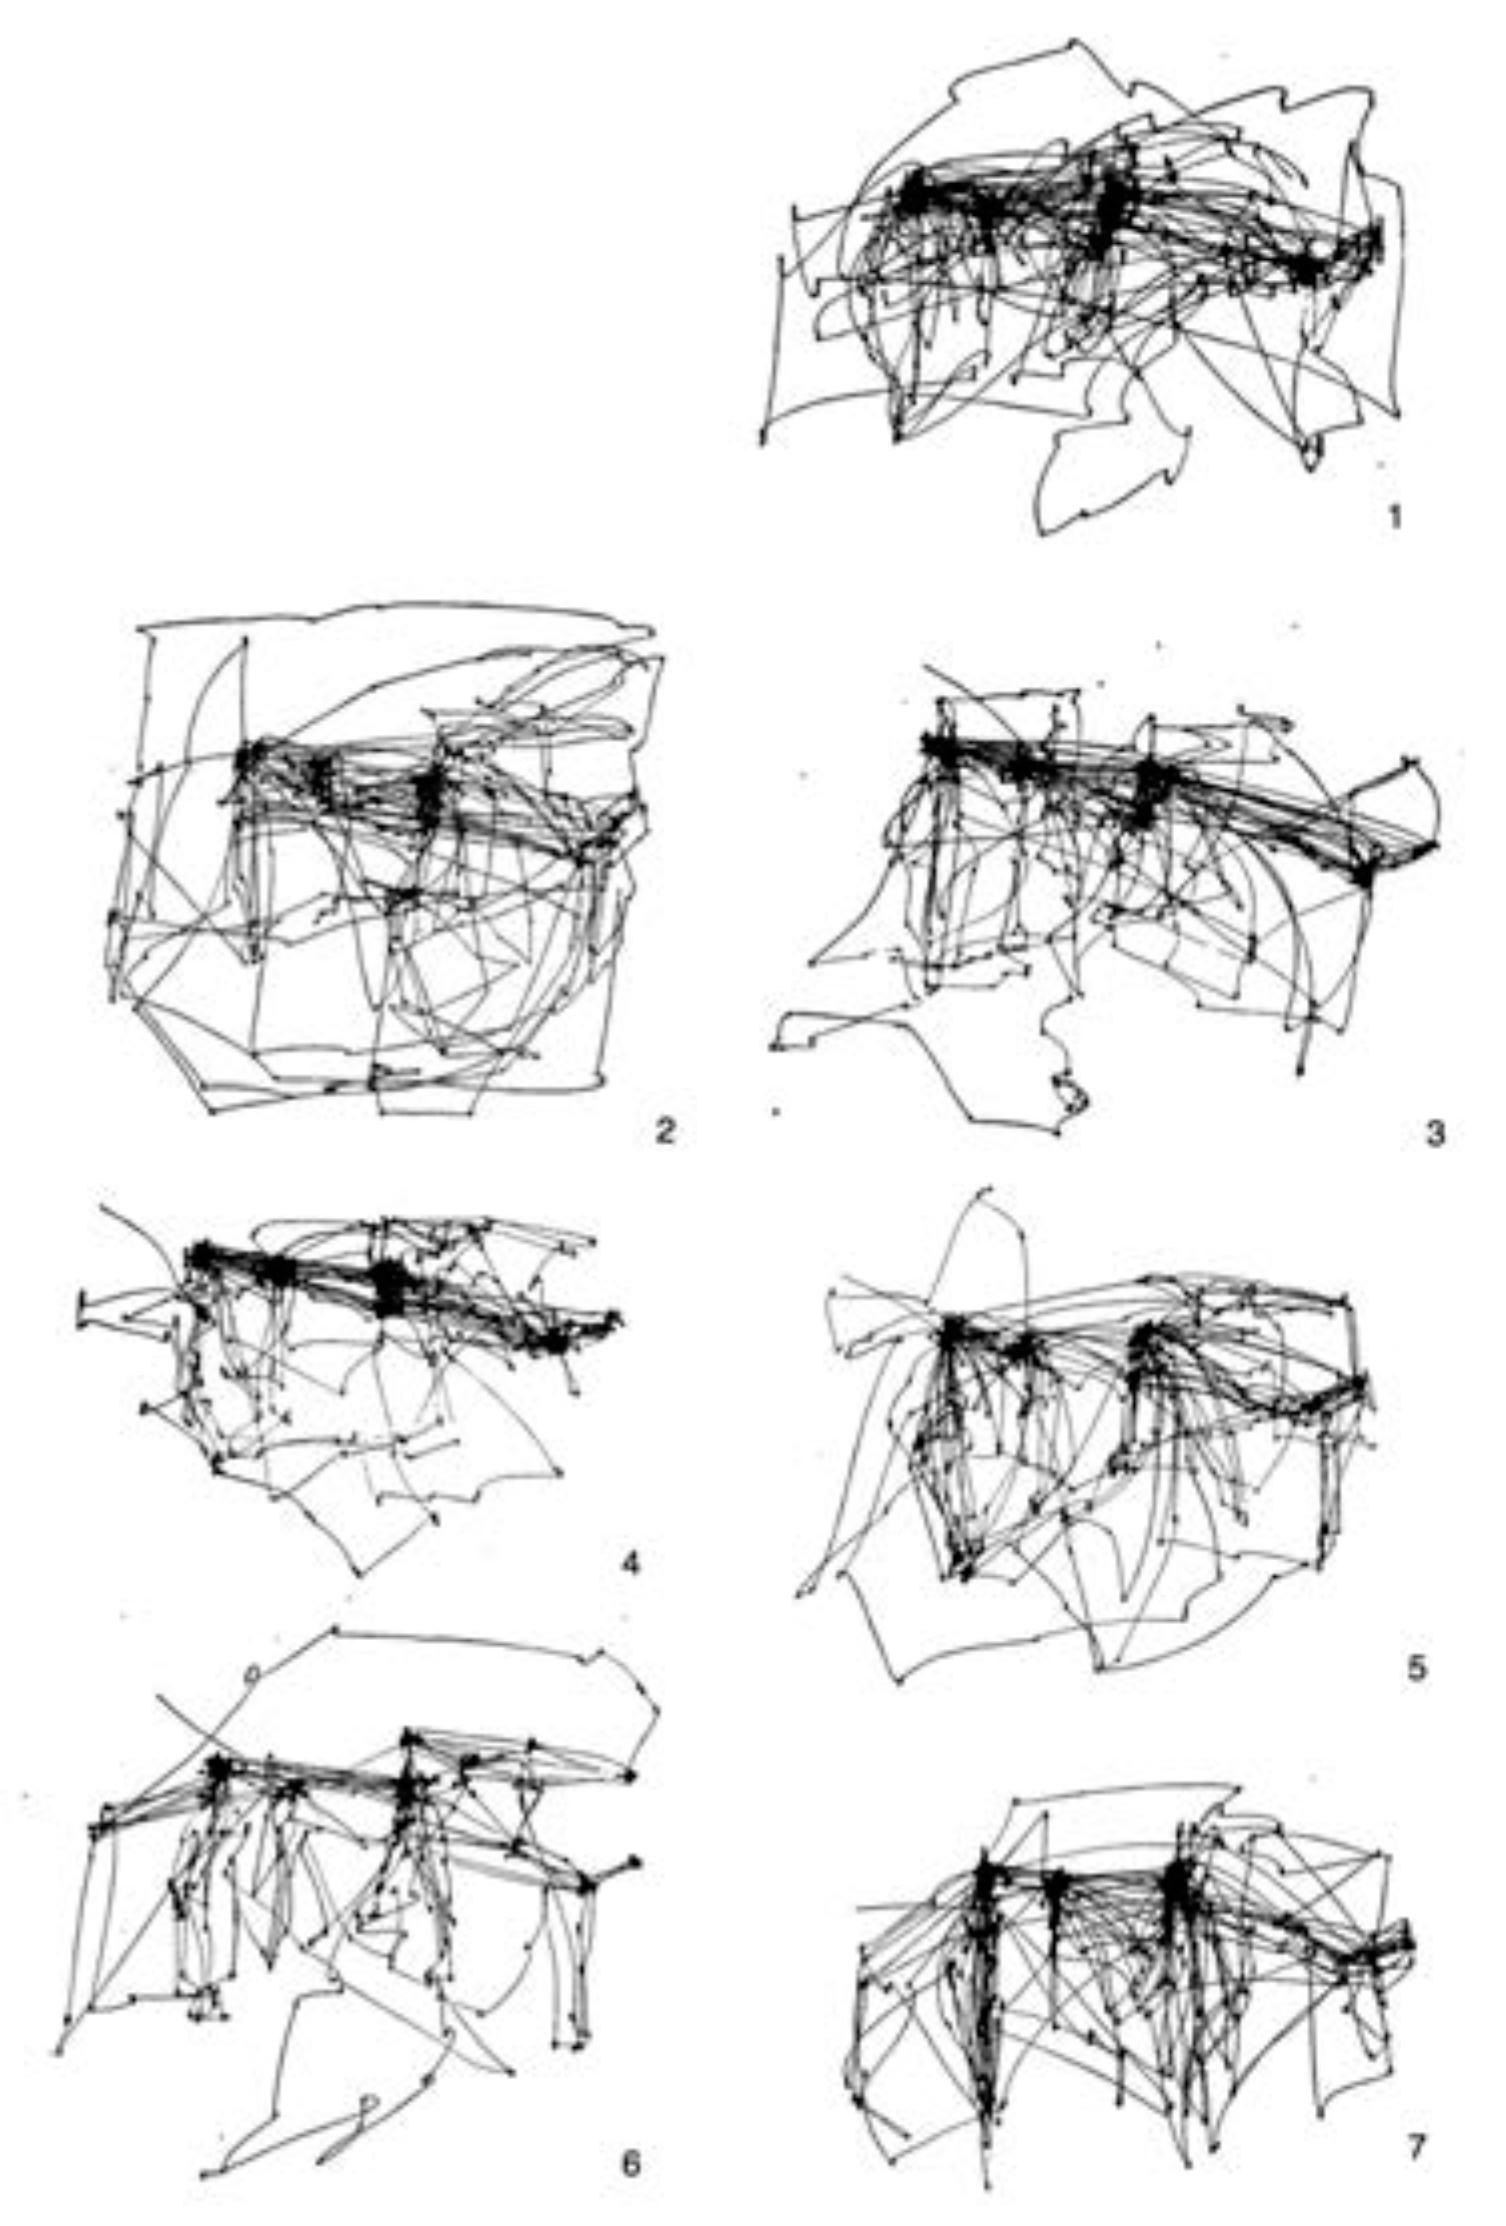
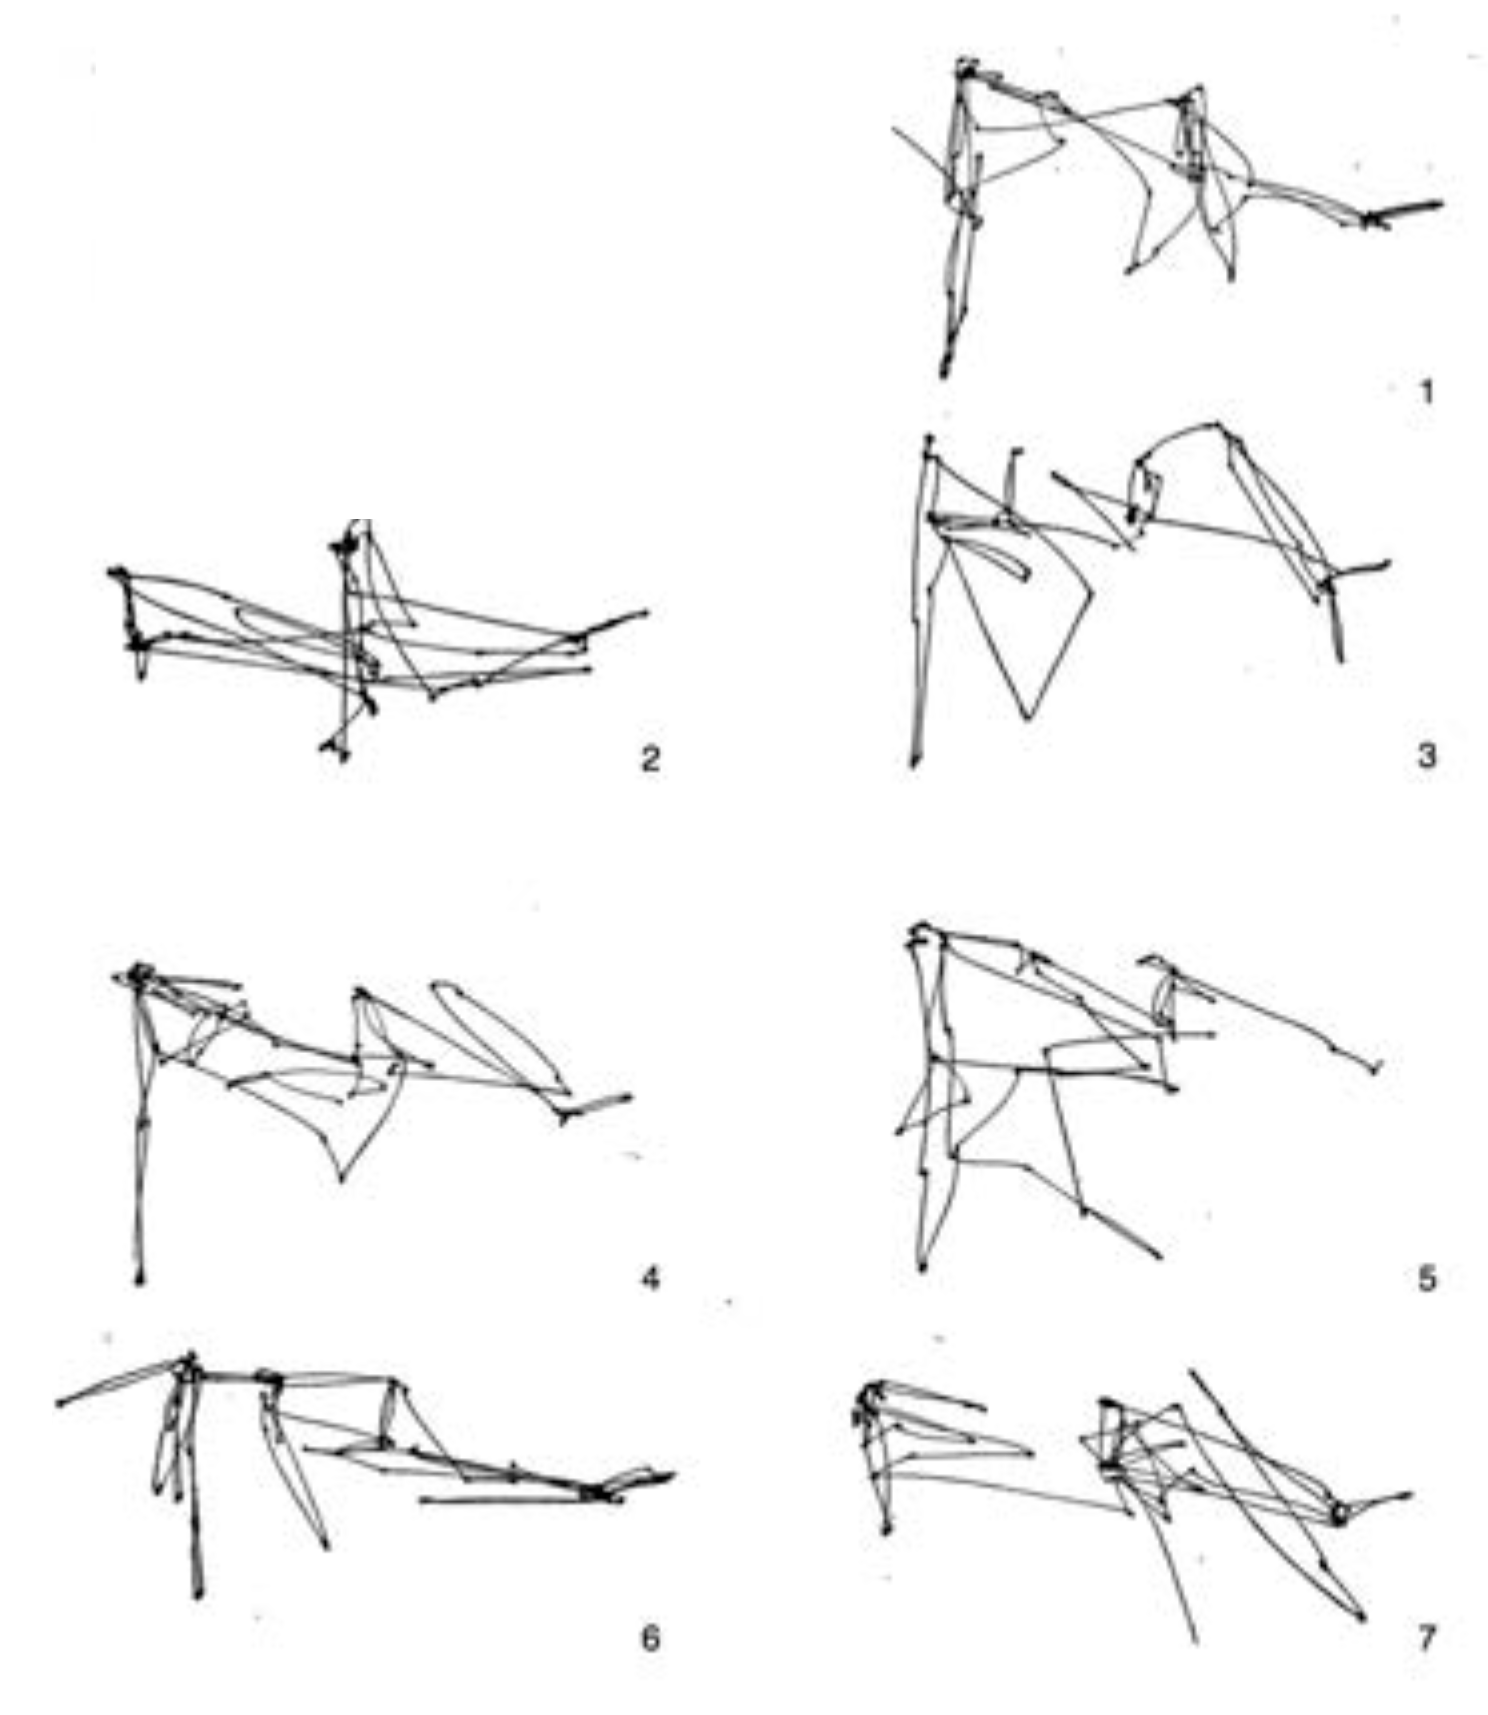
Figure 12. Yarbus ran his experiments for 3 minutes, so if we assume 3-4 fixations per second, this means that he recorded perhaps 600 or 700 fixations per trial. From this figure, we compare qualitatively to the free-viewing scanpath (top right). Yarbus also published several other experiments. One of these is the 7 different free-viewing scanpaths generated by a single subject viewing the painting 7 different times, reproduced in
Figure 13. In our
Figure 14, Yarbus shows the eye fixation tracks for seven individual subjects, each viewing the scene for 3 minutes without instruction. The final Yarbus example is shown in
Figure 15. There, he shows 7 consecutive 25-second fragments from a single subject free-viewing the painting. Yarbus did not provide any data regarding covert fixations or microsaccades in his work.
For our demonstration the following are the pertinent parameters and computations, beyond what has already been described:
a. Size of the image of the painting 1024x980 pix-els.
b. The size of the visual field is set to the size of the full image (1024x980 pixels), which is assumed to map onto a visual field 160 degrees wide (so approximately 160x153 degrees). Each of the representations other than the FHM and the central map are of this size. With a viewer sitting 57cm from the painting, this assumes the painting has been blown up to be approximately 6.5m wide. (Note that Yarbus did not specify his subjects’ viewing distances).
c. The radius of the “hole” in the peripheral attention map is 162 pixels (corresponding to 25° eccentricity).
d. Inhibition of return (IOR) is applied as a cone of inhibition, the peak being maximal suppression at the point of previous fixation, and then a linear decrease in suppression to 50% at the edge of the cone with a diameter of 10 pixels (approximately 1.5 degrees). The decay rate of the inhibition of return in the FHM was set so that any fixation added to the FHM would decay linearly within 100 fixations (The decay rate was empirically determined to give good performance; however, an exhaustive search of this parameter space was not done. The choice of linear decay was made for simplicity; other functions can easily be used).
e. The size of the FHM is double that of the field of view.
f. Size of the central map The central attention map comprises the central portion of the visual field up to 25.5° eccentricity, thus including a small overlap region with the peripheral hole. Values inside the overlap region are the point-wise maximum between the two fields. (This is an artifact of the implementation and has no theoretical significance).
g. The peripheral attentional map was computed using an implementation of AIM based on log-Gabor filters at 8 orientations of 2 spatial scales across three colour opponency channels (
Wloka 2012;
Bruce et al. 2011)
h. The central attentional map was computed using a template-based search for faces, defined using an autocorrelation function using the actual faces of the painting. This computation is not representative of ST’s visual hierarchy but was used because there is no implementation of a set of general object recognizers for the kinds of items in this painting. Standard face recognition methods were ineffective, as was training a classifier using image patches from a variety of paintings, and gave responses to a wide variety of locations. It is thus important to not overstate the results of the comparison.
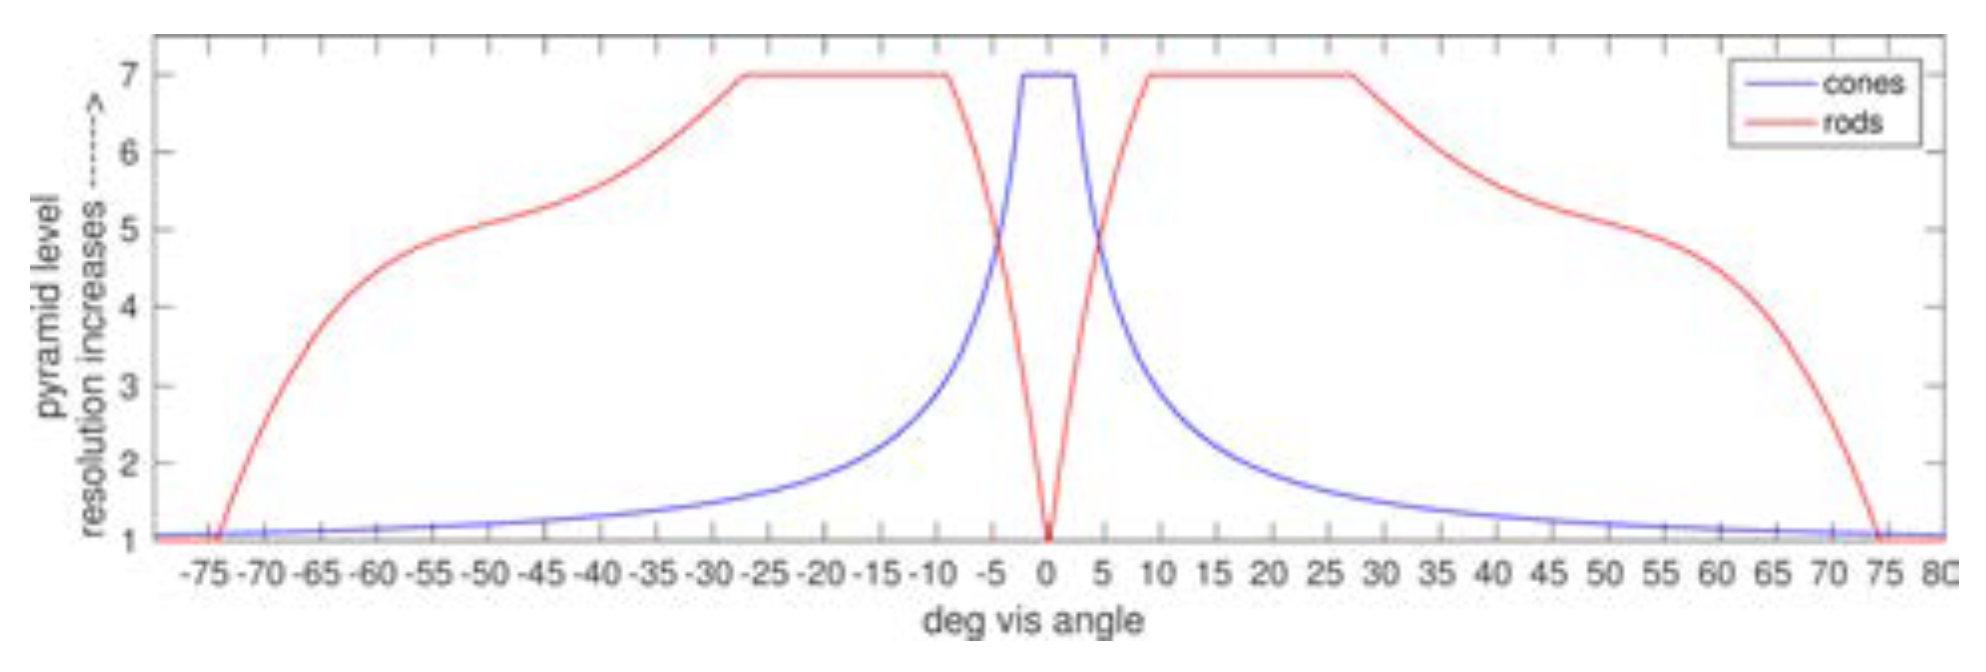
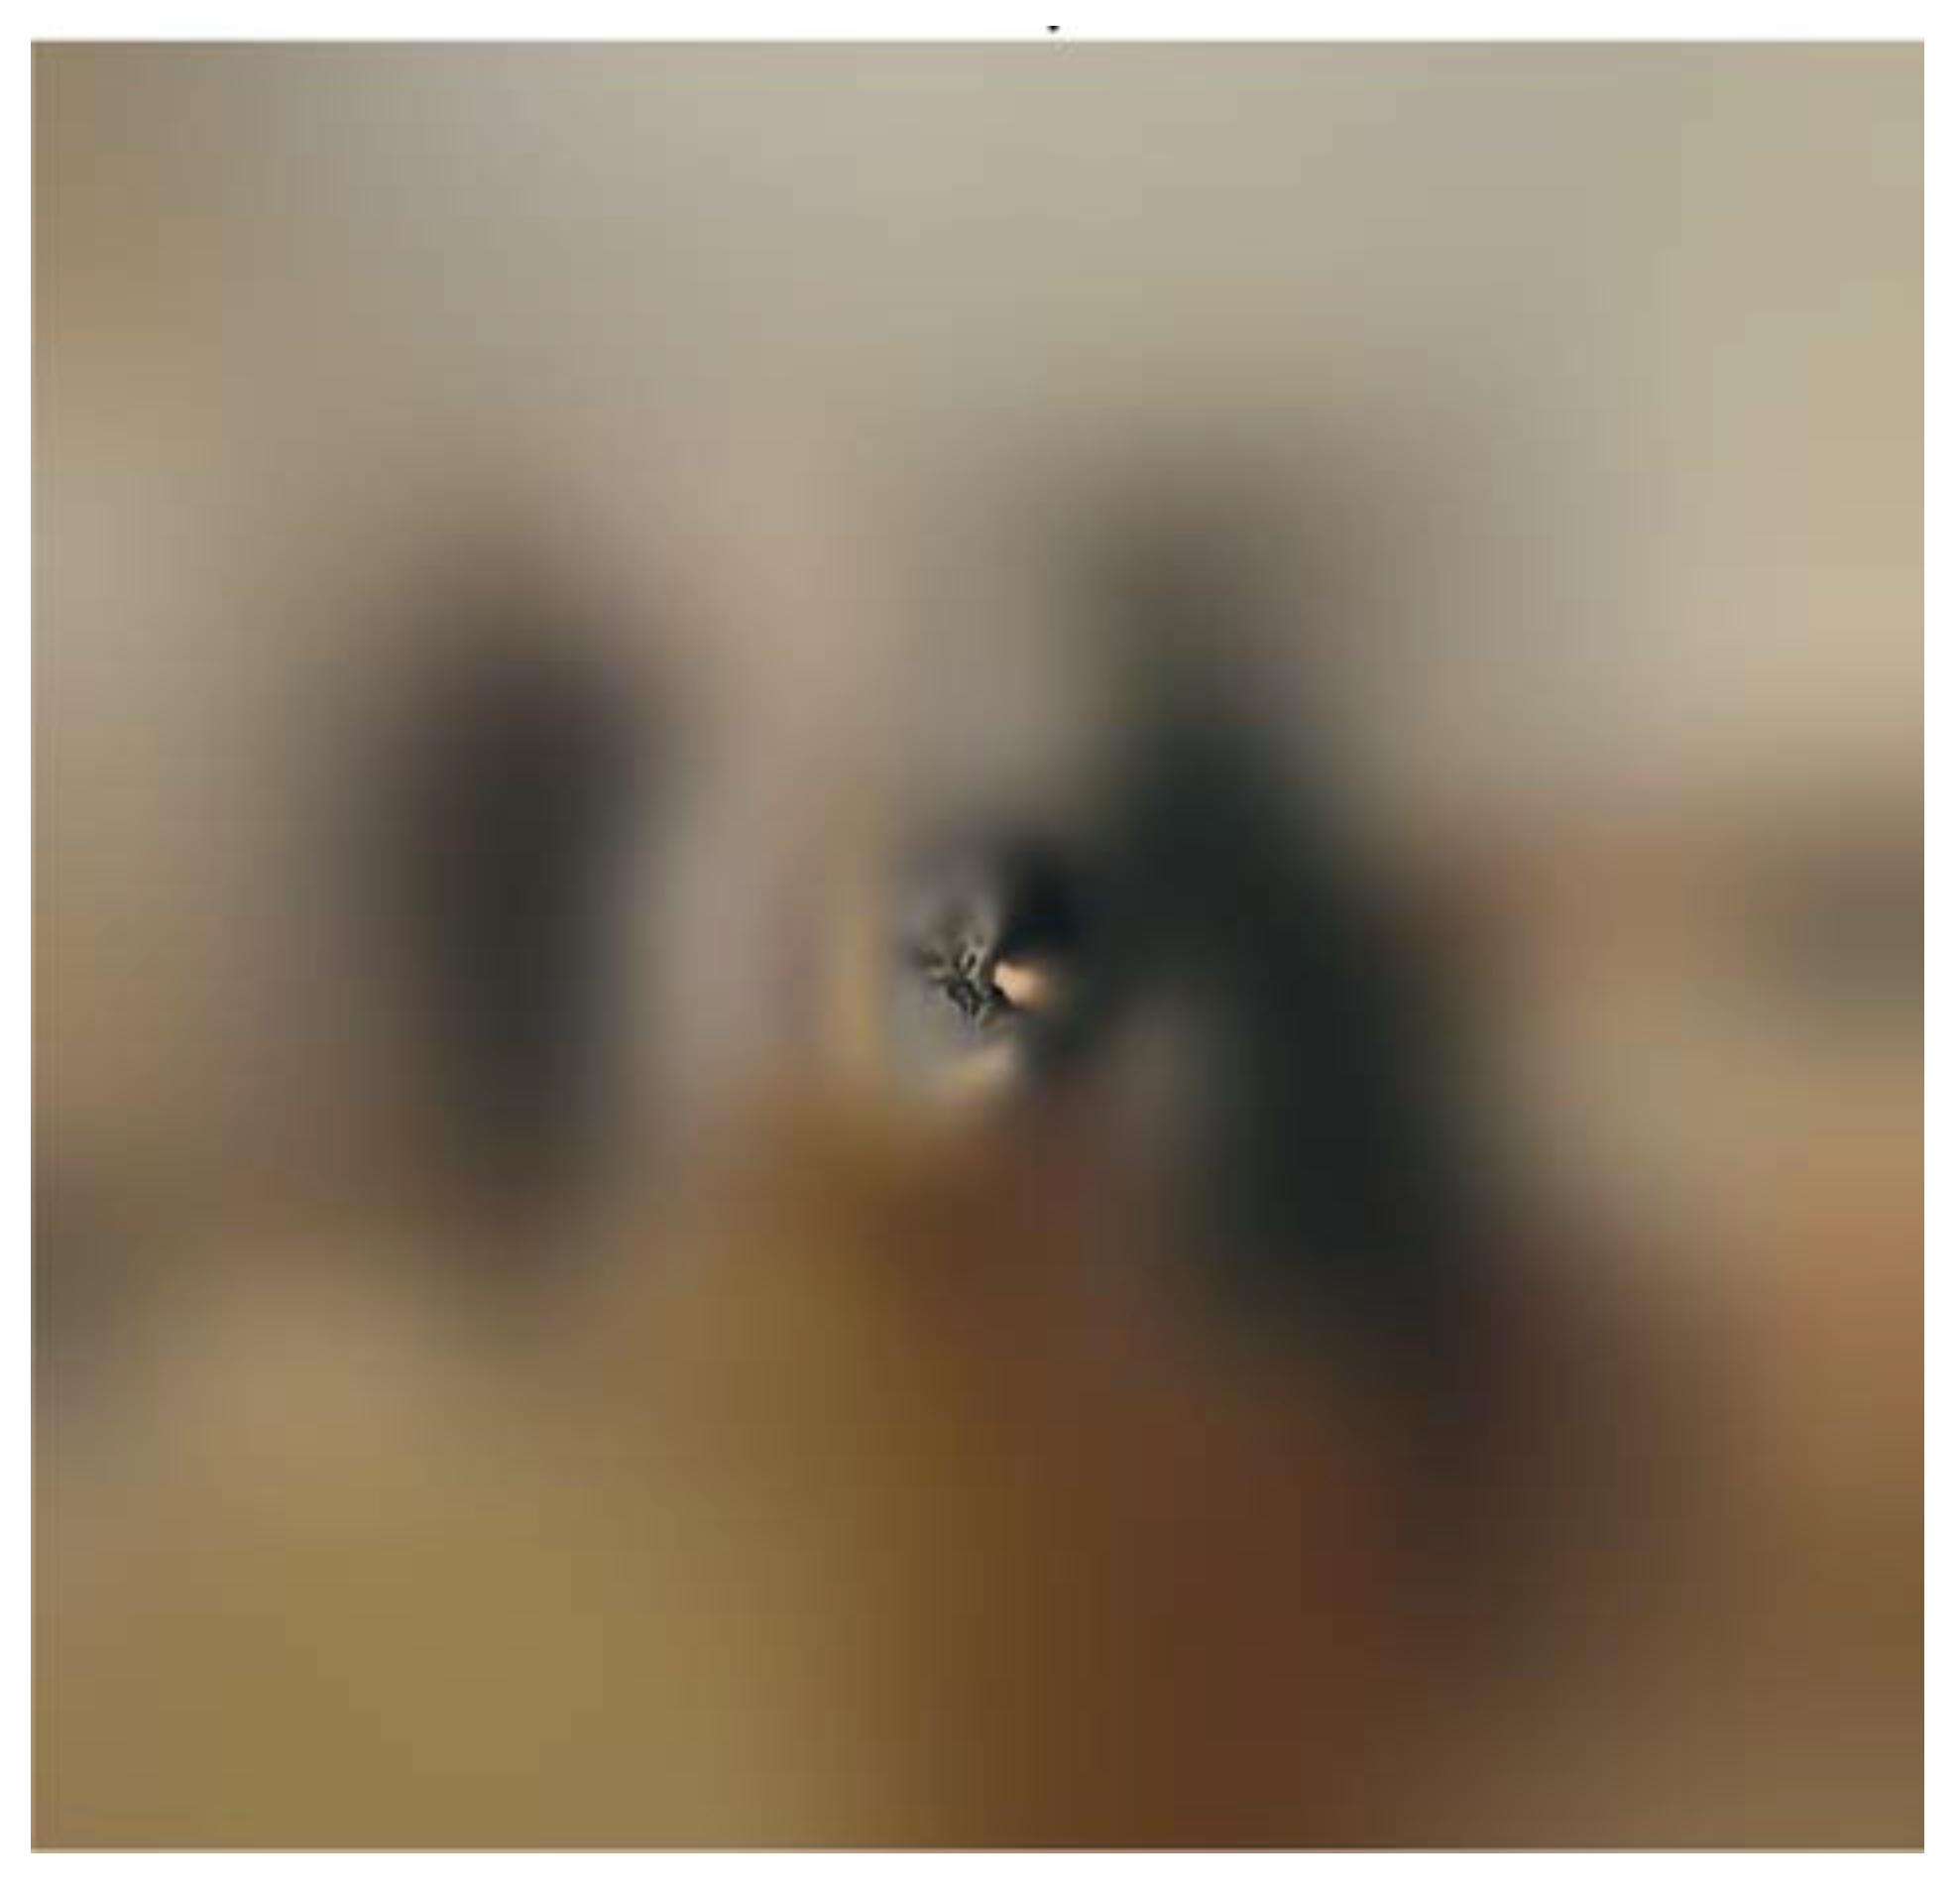
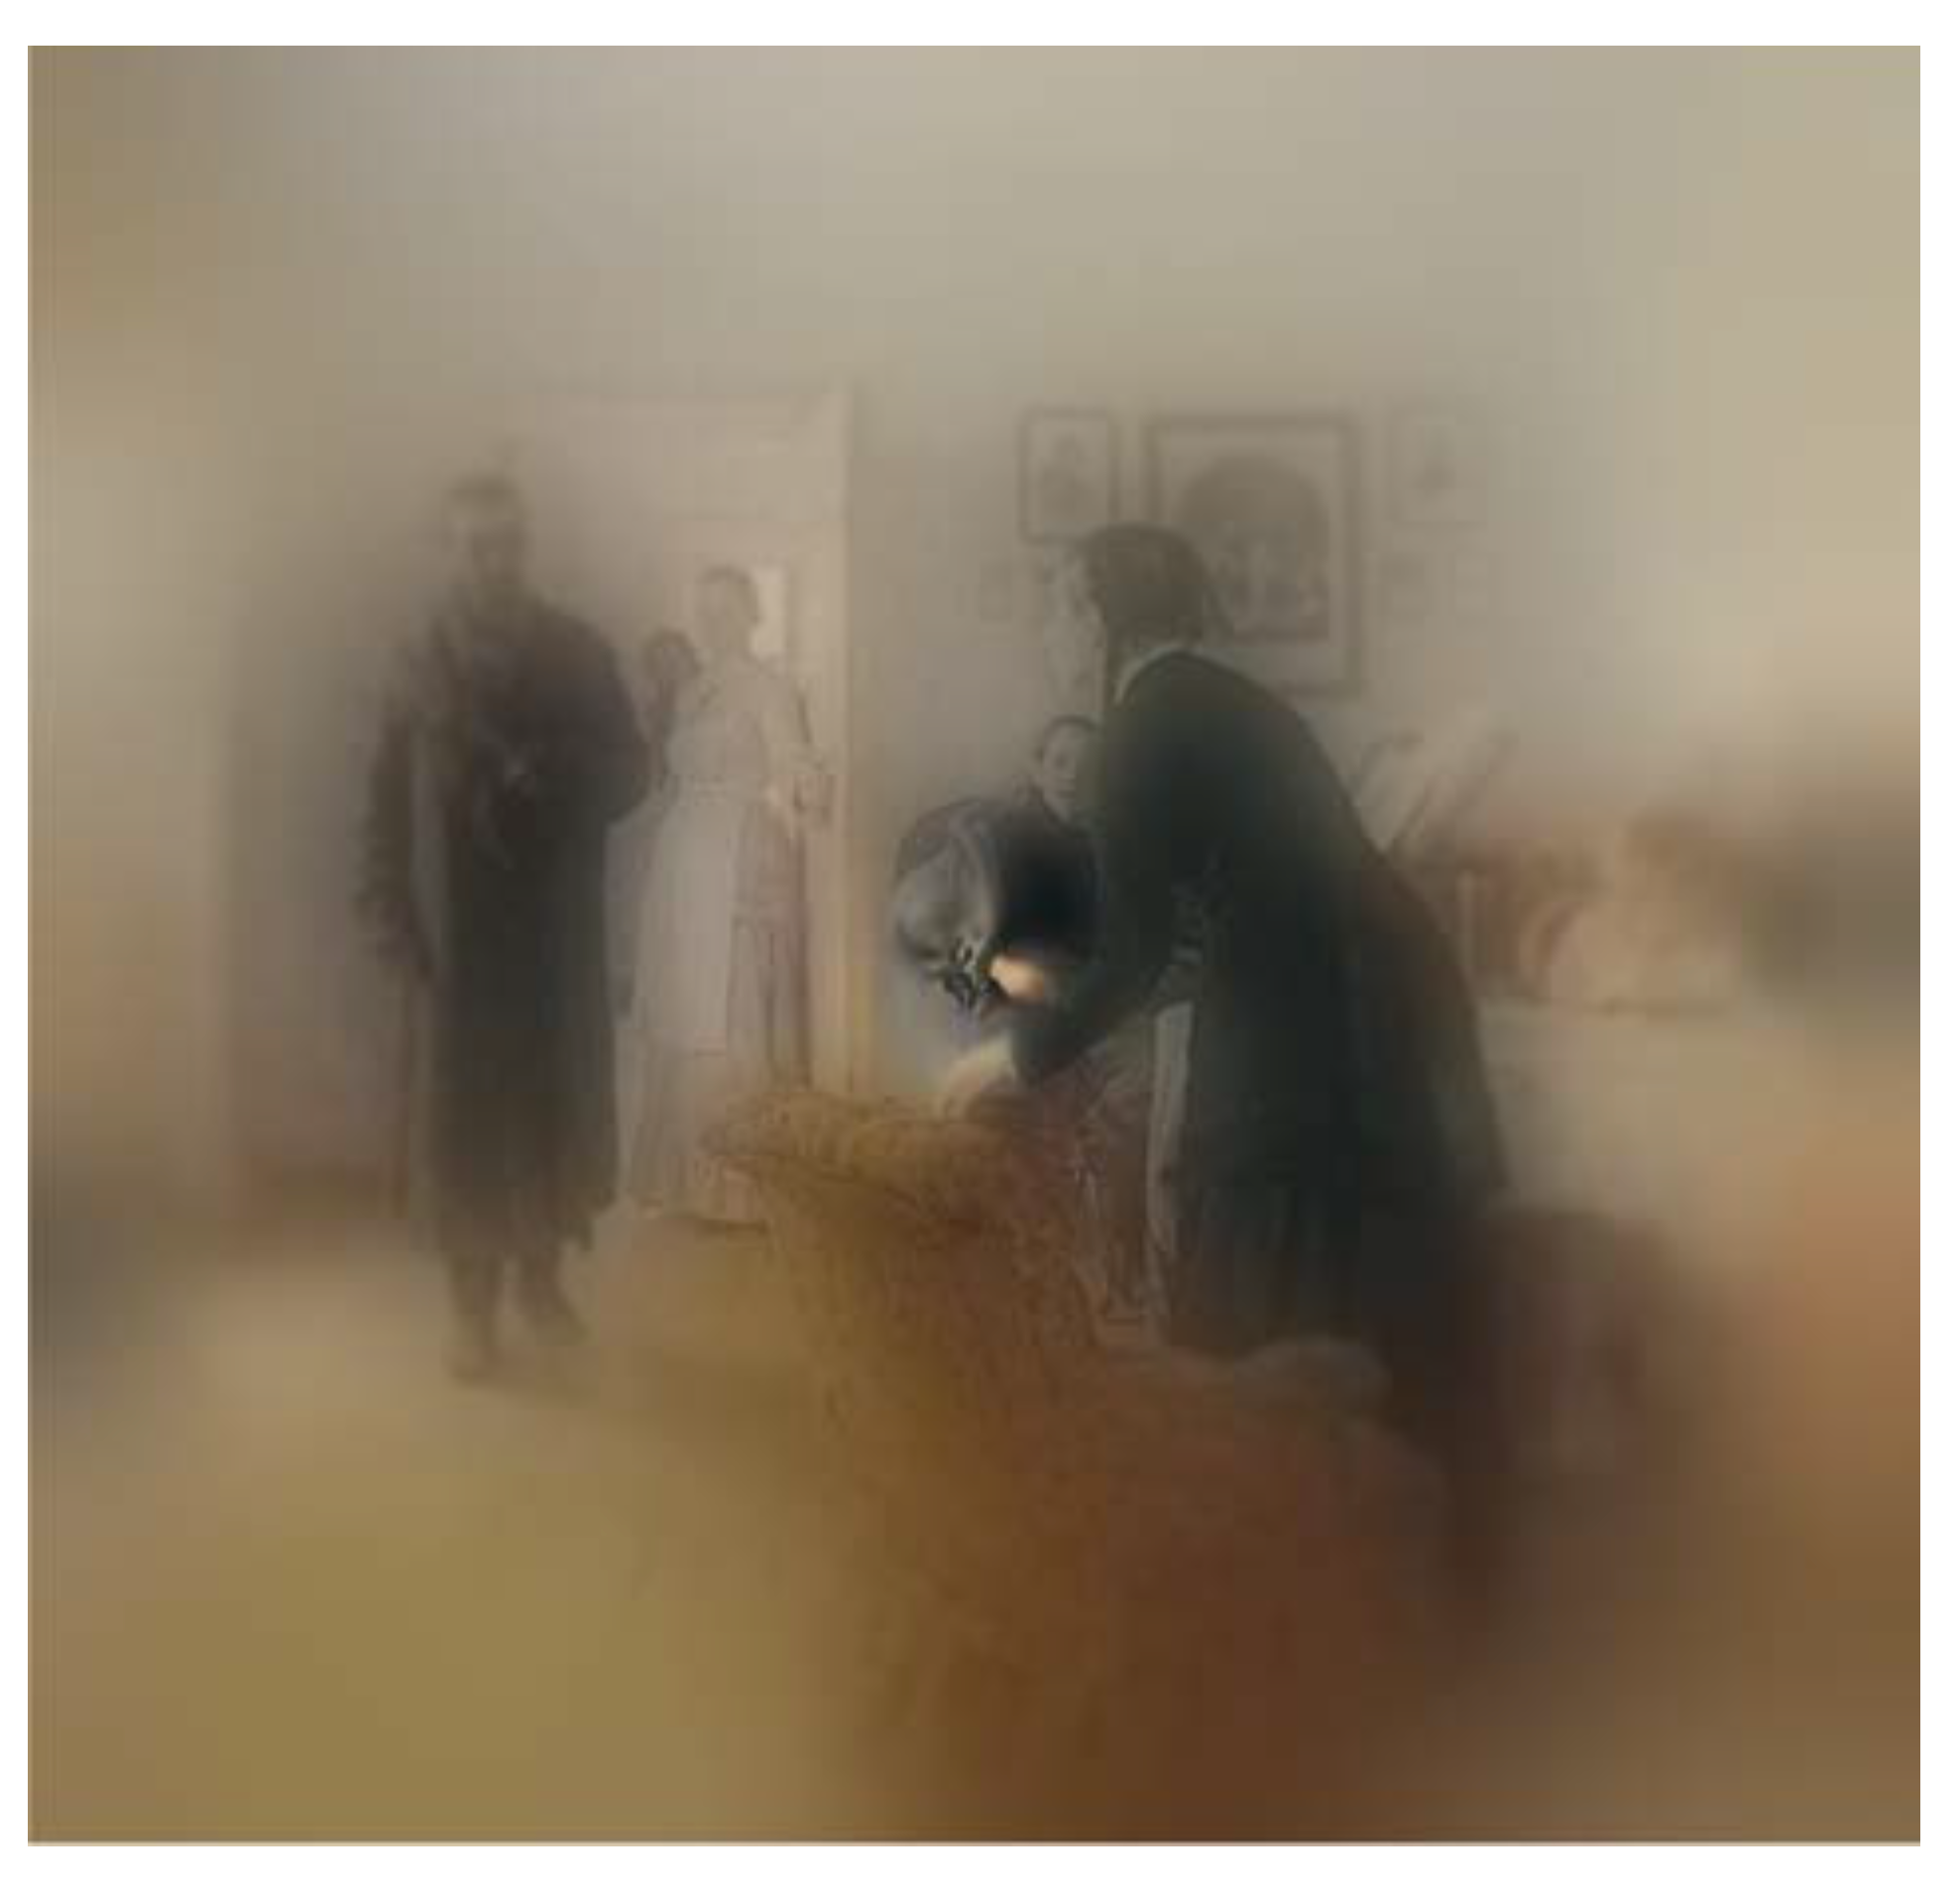
i. Although the digital image of the painting is represented with uniform spatial sampling, this would not allow a test of the impact of a space-variant input representation as described in an earlier section. We developed a novel transform for converting the input stimulus to one with similar spatial sampling distribution for both rods and cones as the retina. Thus, the input to our fixation system is an approximation of a retinal sampling for a specified fixation point. The Appendix provides additional detail on this transform.
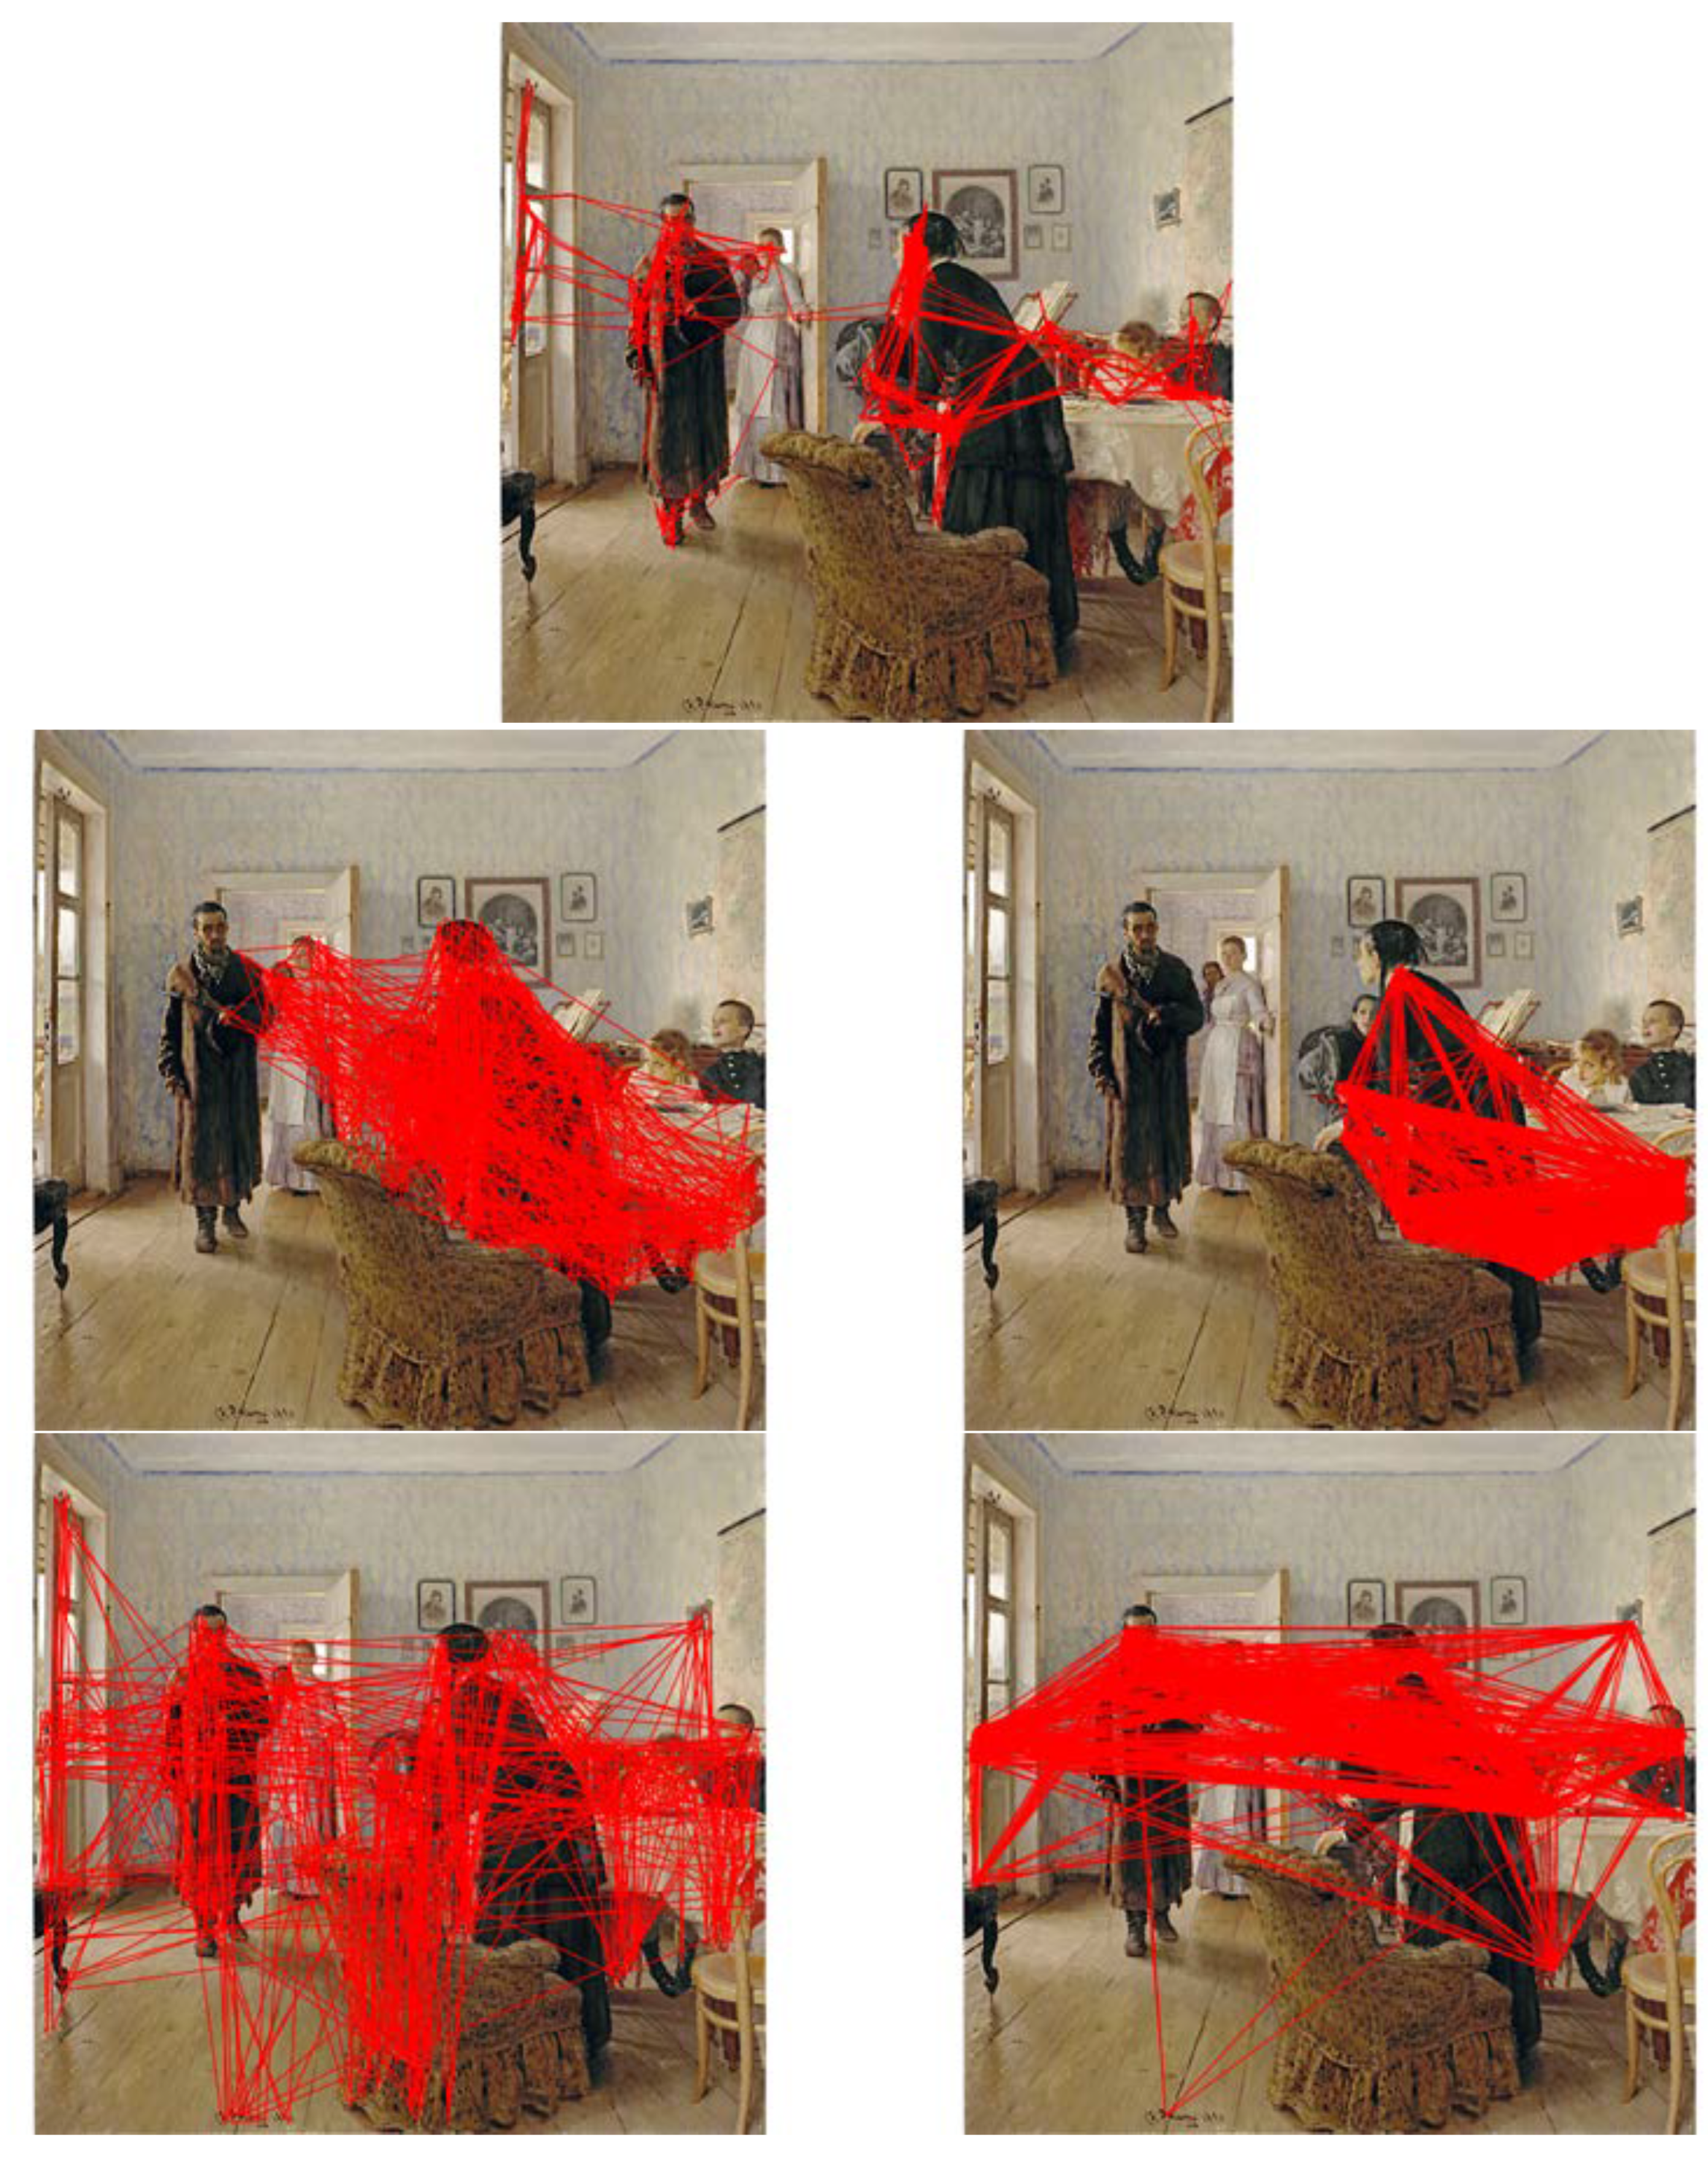
As an added point of comparison, we ran the AIM and CAS algorithms (used also in a previous section) on the full Repin painting image and recorded their scanpaths. The observations from these tests follow.
1.
Figure 16, top panel, shows 720 fixations, before the algorithm was terminated in order to show a similar number of fixations as Yarbus recorded. In the same way that the human free-viewing scanpaths all seem to have favorite locations where subjects returned to, so does the scanpath of STAR. It is this repeated fixation pattern that allows one to imagine a purpose behind the observations.
2. The middle left panel of
Figure 16 shows the results for the CAS algorithm. It is difficult to see any similarities or patterns between the CAS result and any of the single or group human scanpaths in the free-viewing condition. At an abstract level, the CAS fixations seem without purpose, while the human ones seem to exhibit some purpose even in free-viewing.
3. The bottom left panel of
Figure 16 shows the results for the AIM algorithm. As with CAS, it is difficult to see any similarities or patterns between the AIM result and any of the human scanpaths in the free-viewing condition.
4. We wanted to check if the simple addition of IOR decay would make a significant difference to the scanpaths of AIM and CAS. We added exactly the same decay as STAR to both and the results are shown in the middle and bottom right panels of
Figure 16. The patterns do differ; however, it is still difficult to discern any purpose from those scanpaths. Both seem to be just much more of the same. Although not conclusive, it does appear if the simple addition of a decaying IOR cannot on its own explain the differences.
5. We can compare the STAR scanpath not only to the free-viewing condition, but also to the target condition for question 3: Give the ages of the people. On the assumption that an observer would focus on faces in order to judge age, it is clear that the STAR scanpath in
Figure 16, by virtue of its method of computing the central attentional map, could have been generated by a human observer.
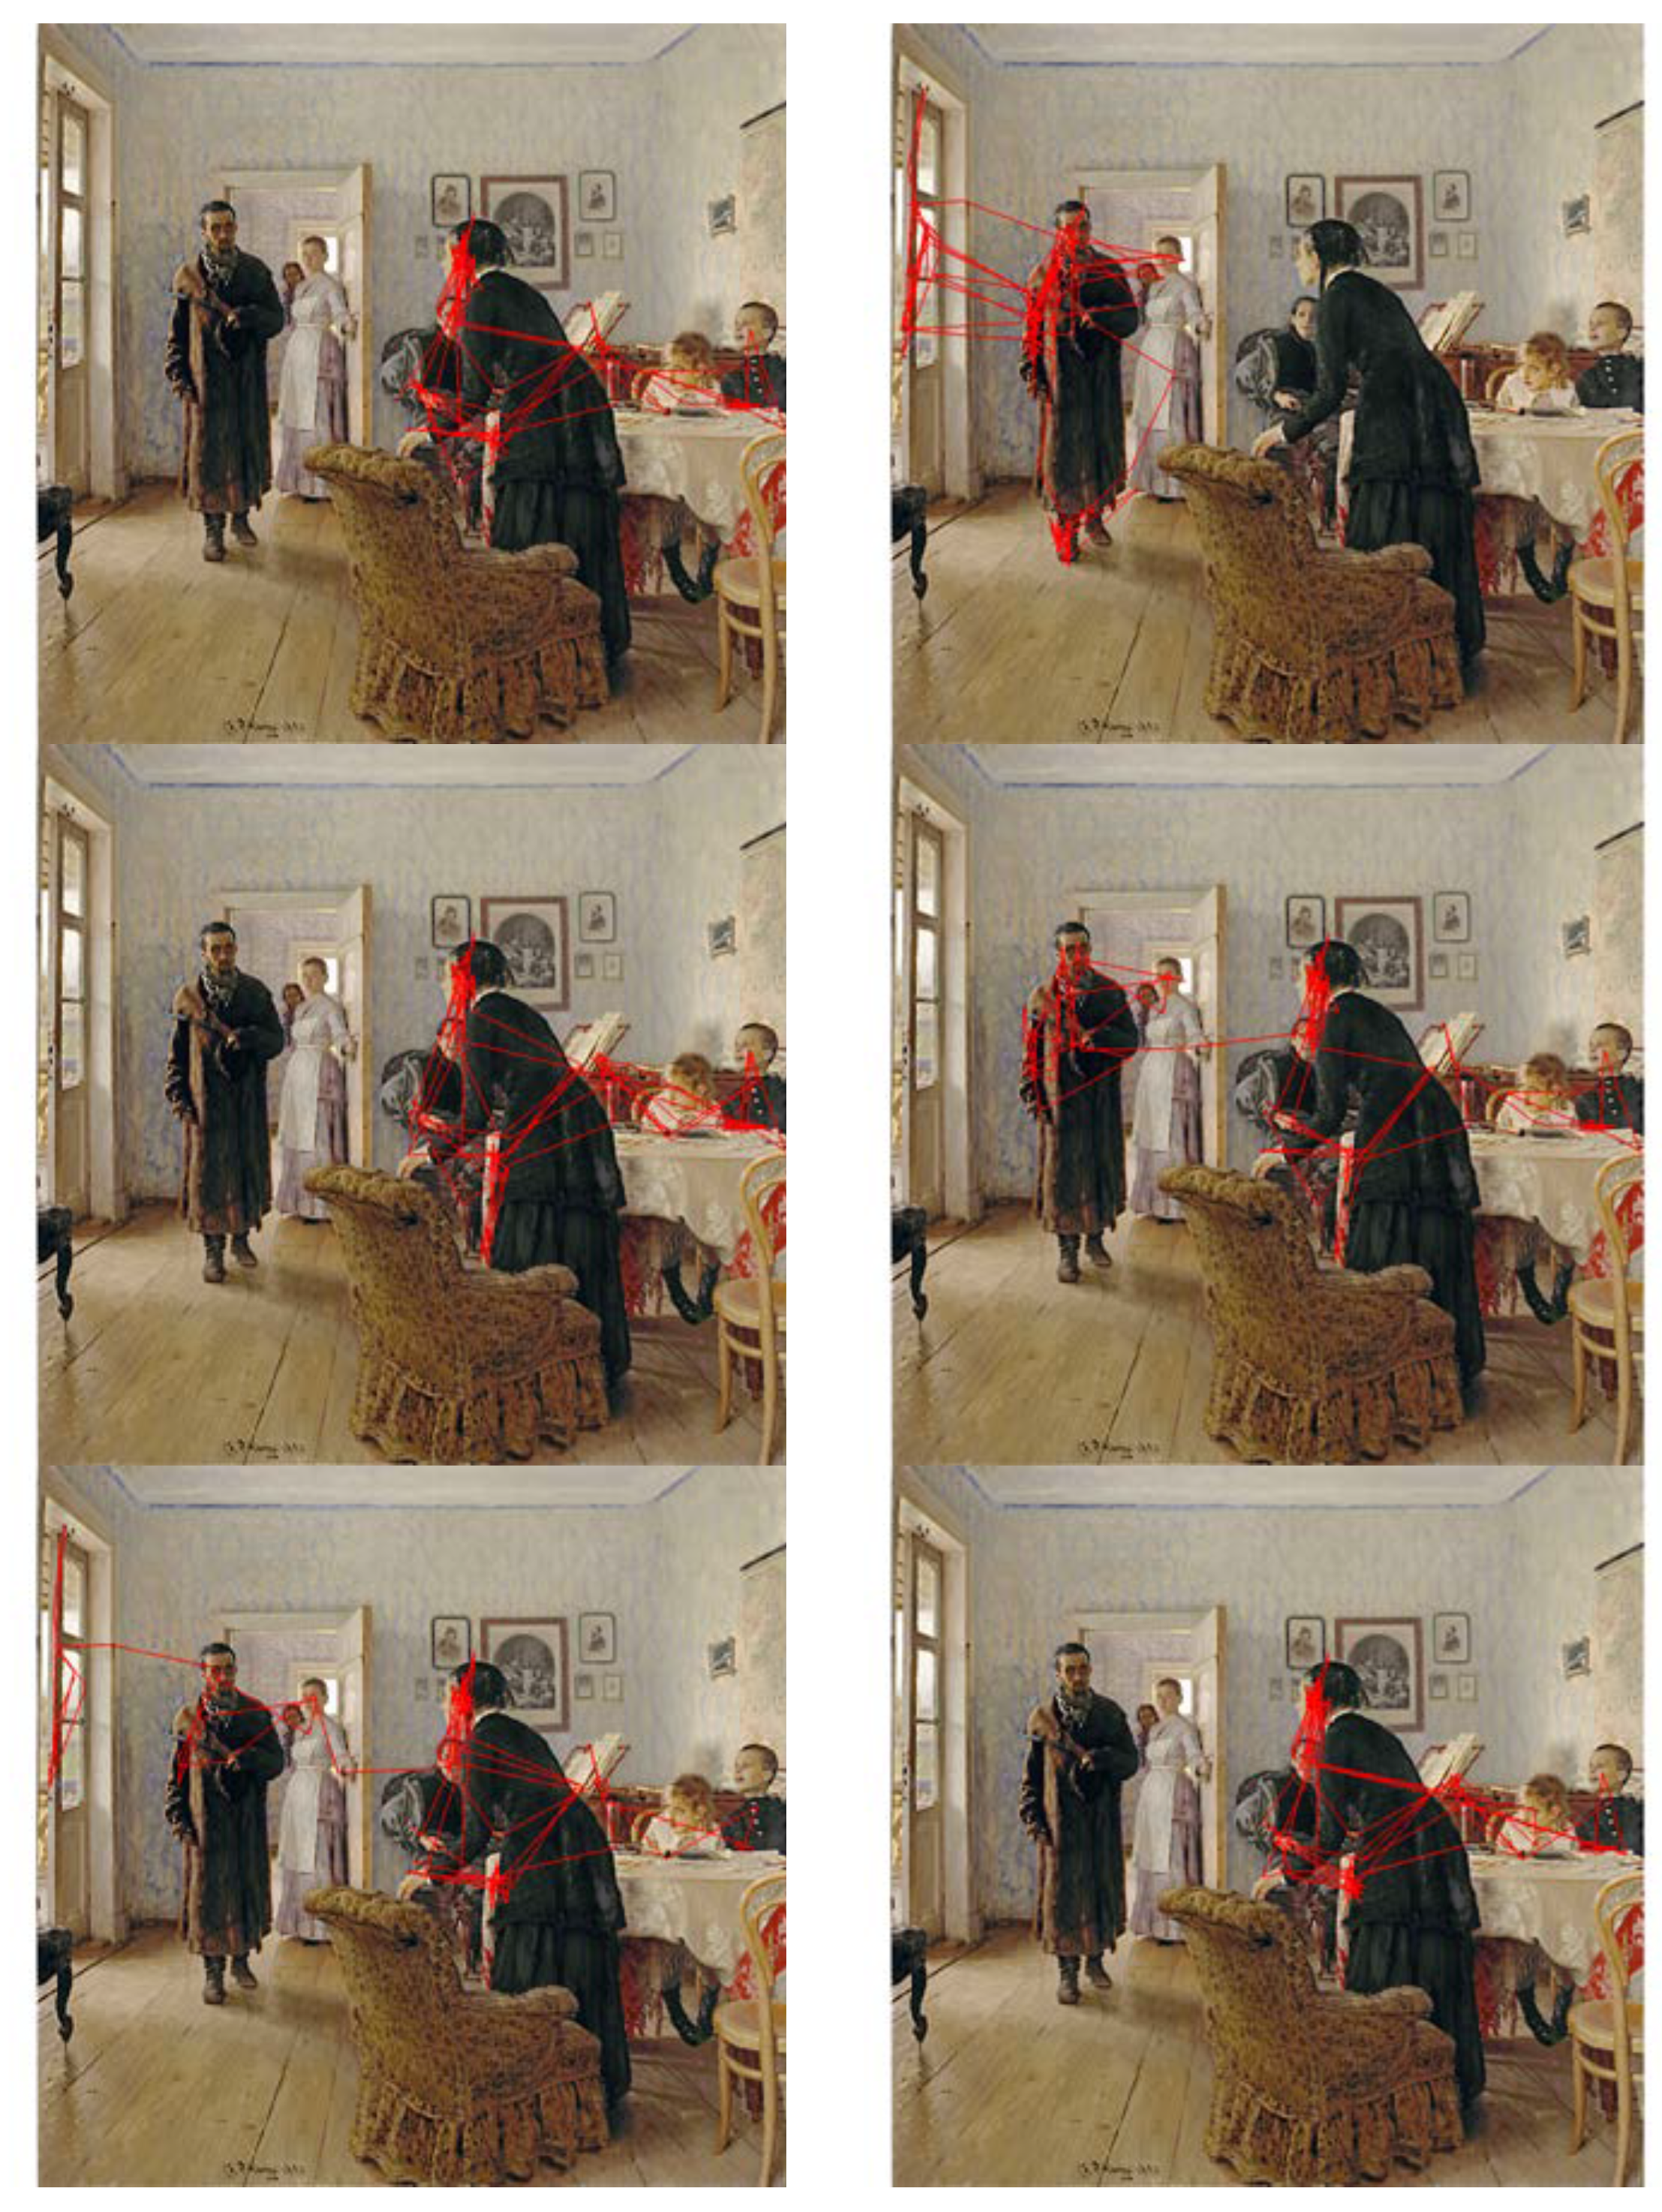
6. We examine sub-sequences of fixations, as did Yarbus. STAR’s fixations are divided into segments of 103 fixations (1/7th of the full 720 fixation sequence) in
Figure 17. The sub-sequences of STAR appear rather similar to those of the human observer, so much so that if there were inter-changed it would be difficult to tell them apart.
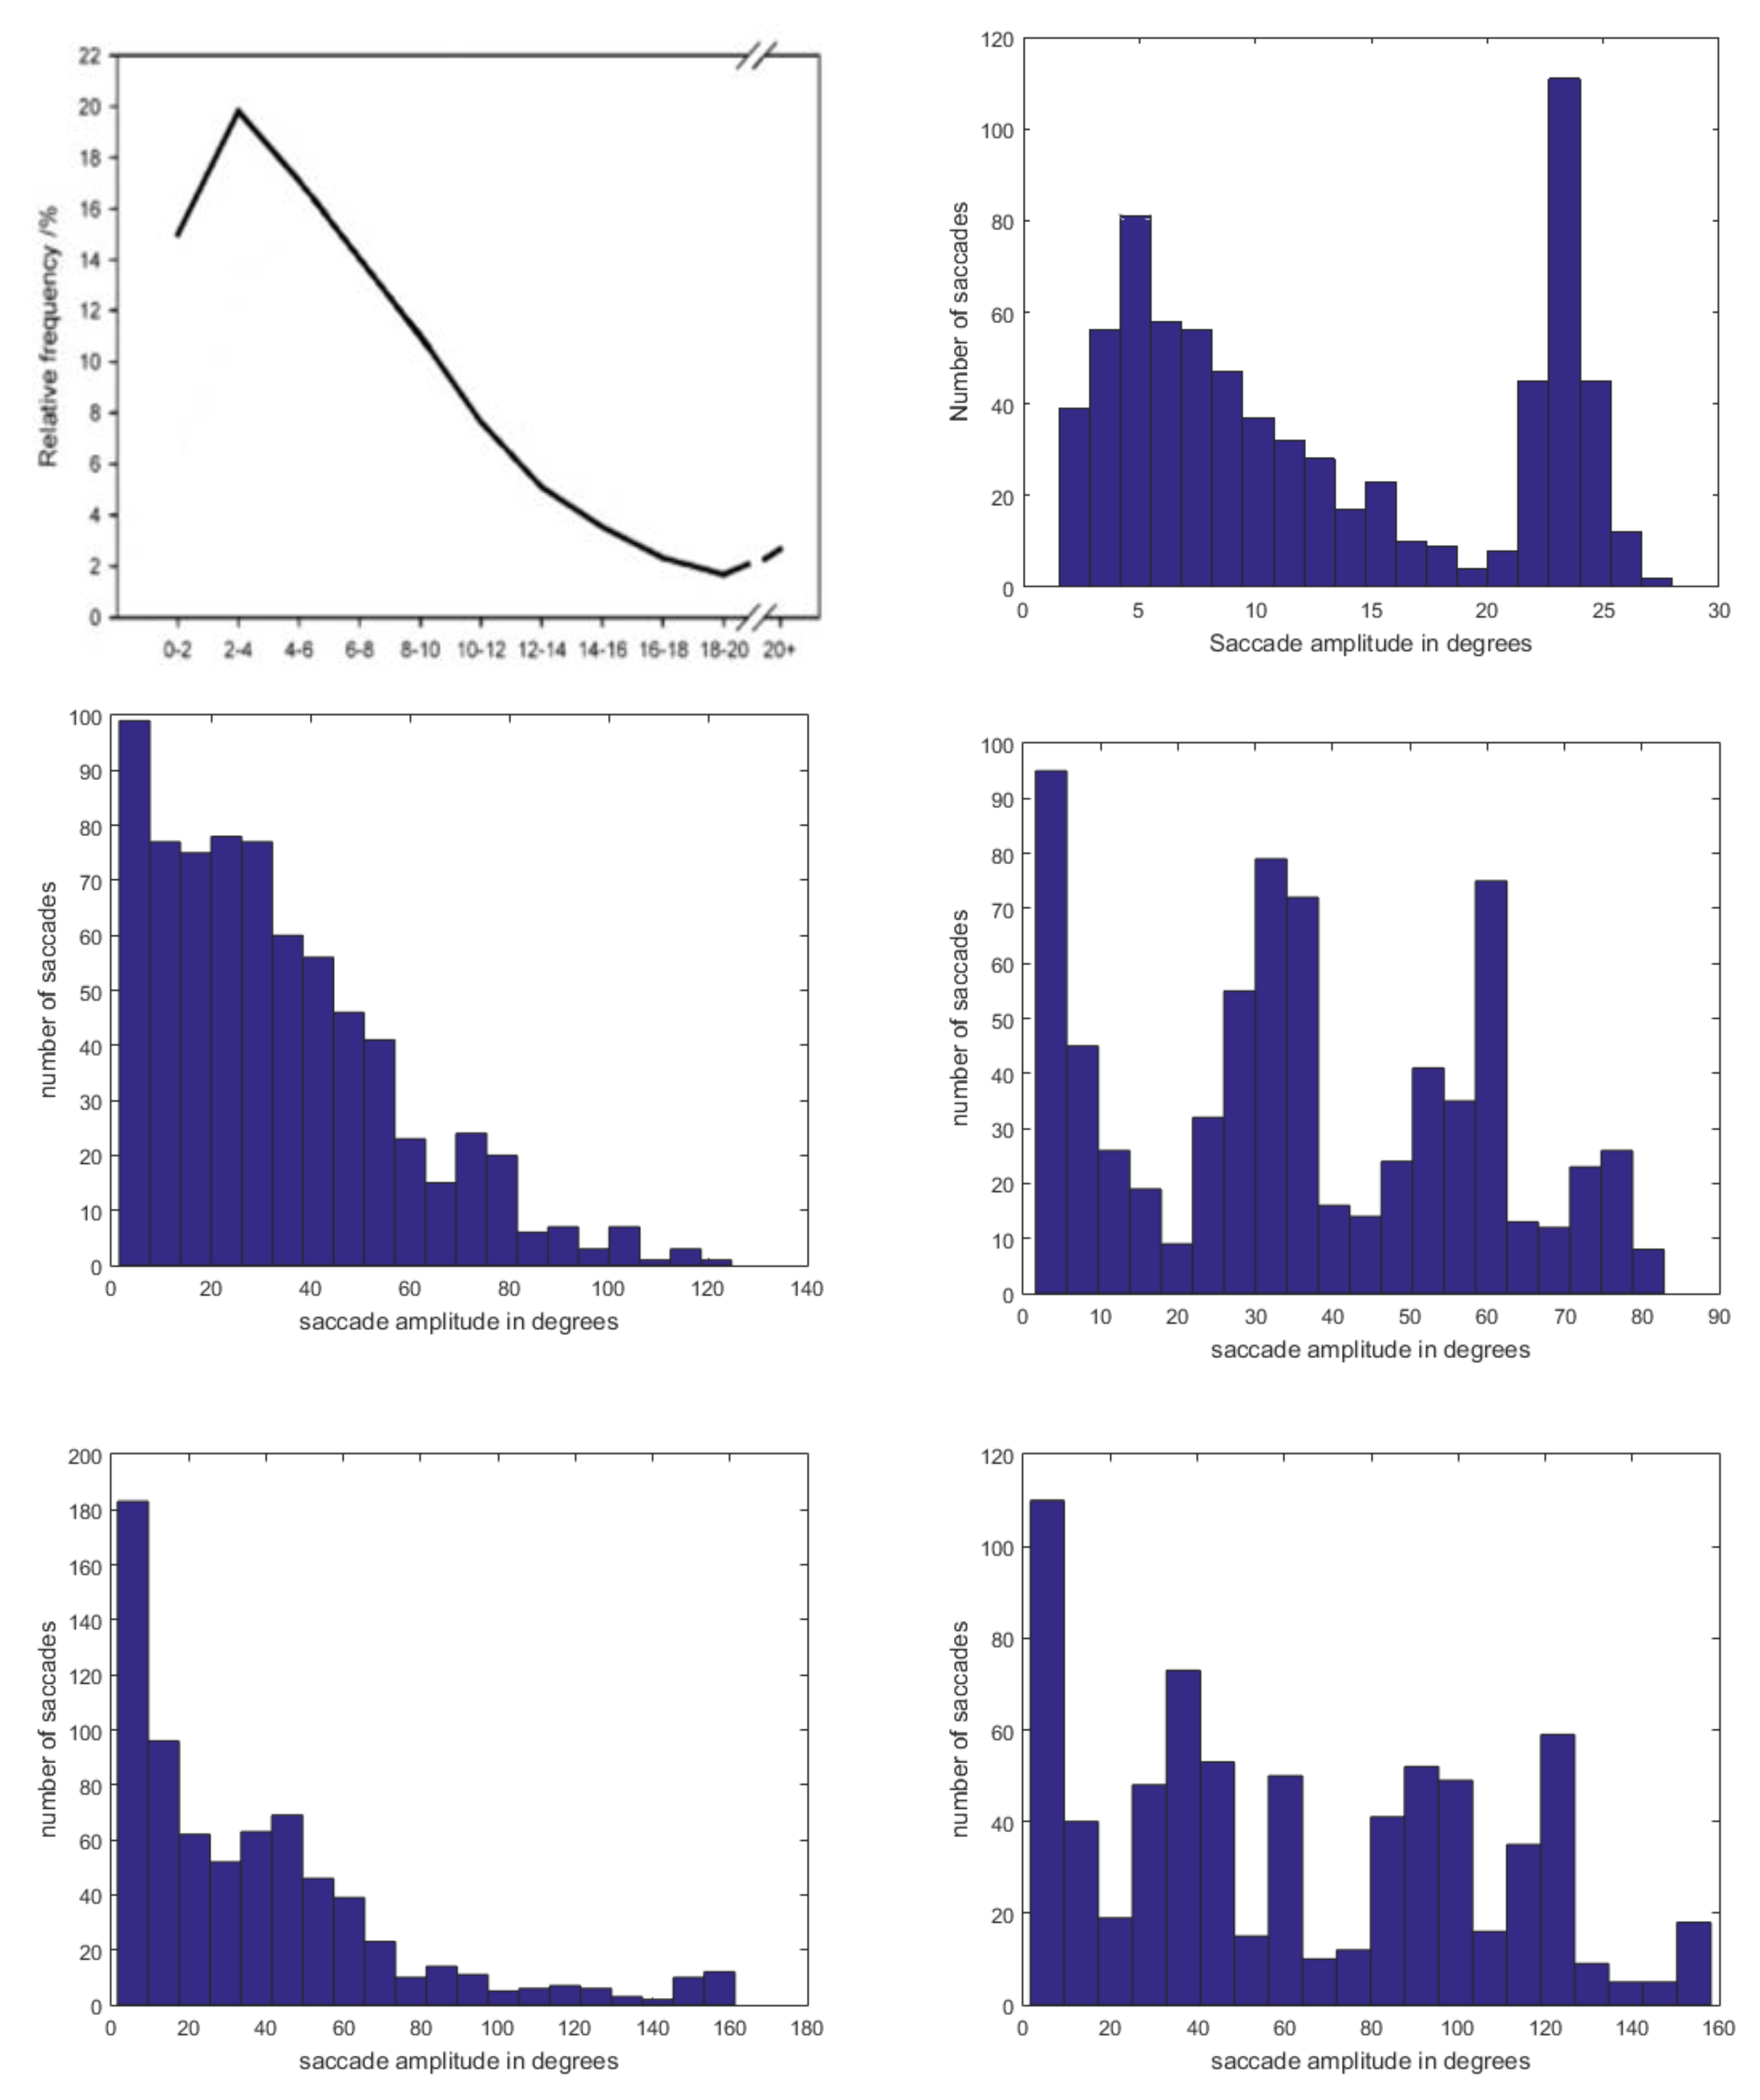
7. Finally, we were curious to see the ranges of saccade amplitudes STAR produces.
Tatler et al. (
2006) present an experimental profile of saccade frequency vs amplitude. Part of their
Figure 1 is adapted here as
Figure 18 (top left panel). STAR’s equivalent distribution, measured in degrees of visual angle as well, is in the top right panel. The similarity is remarkable and predicts that if Tatler et al. had plotted the higher amplitudes they may have found a sharply rising profile. By contrast, the same plots for the CAS and AIM algorithms, both with and without IOR decay, seem entirely unrelated to the experimental findings.
It is important to be reminded that these are abstract and qualitative conclusions and that a more quantitative procedure is needed to determine how effective STAR might be. It is our immediate goal to develop such a procedure. In the meantime however, we are encouraged by the similarities with human observers and by the differences with well-known saliency methods. There is one more dimension to this performance demonstration that has value but a different form.
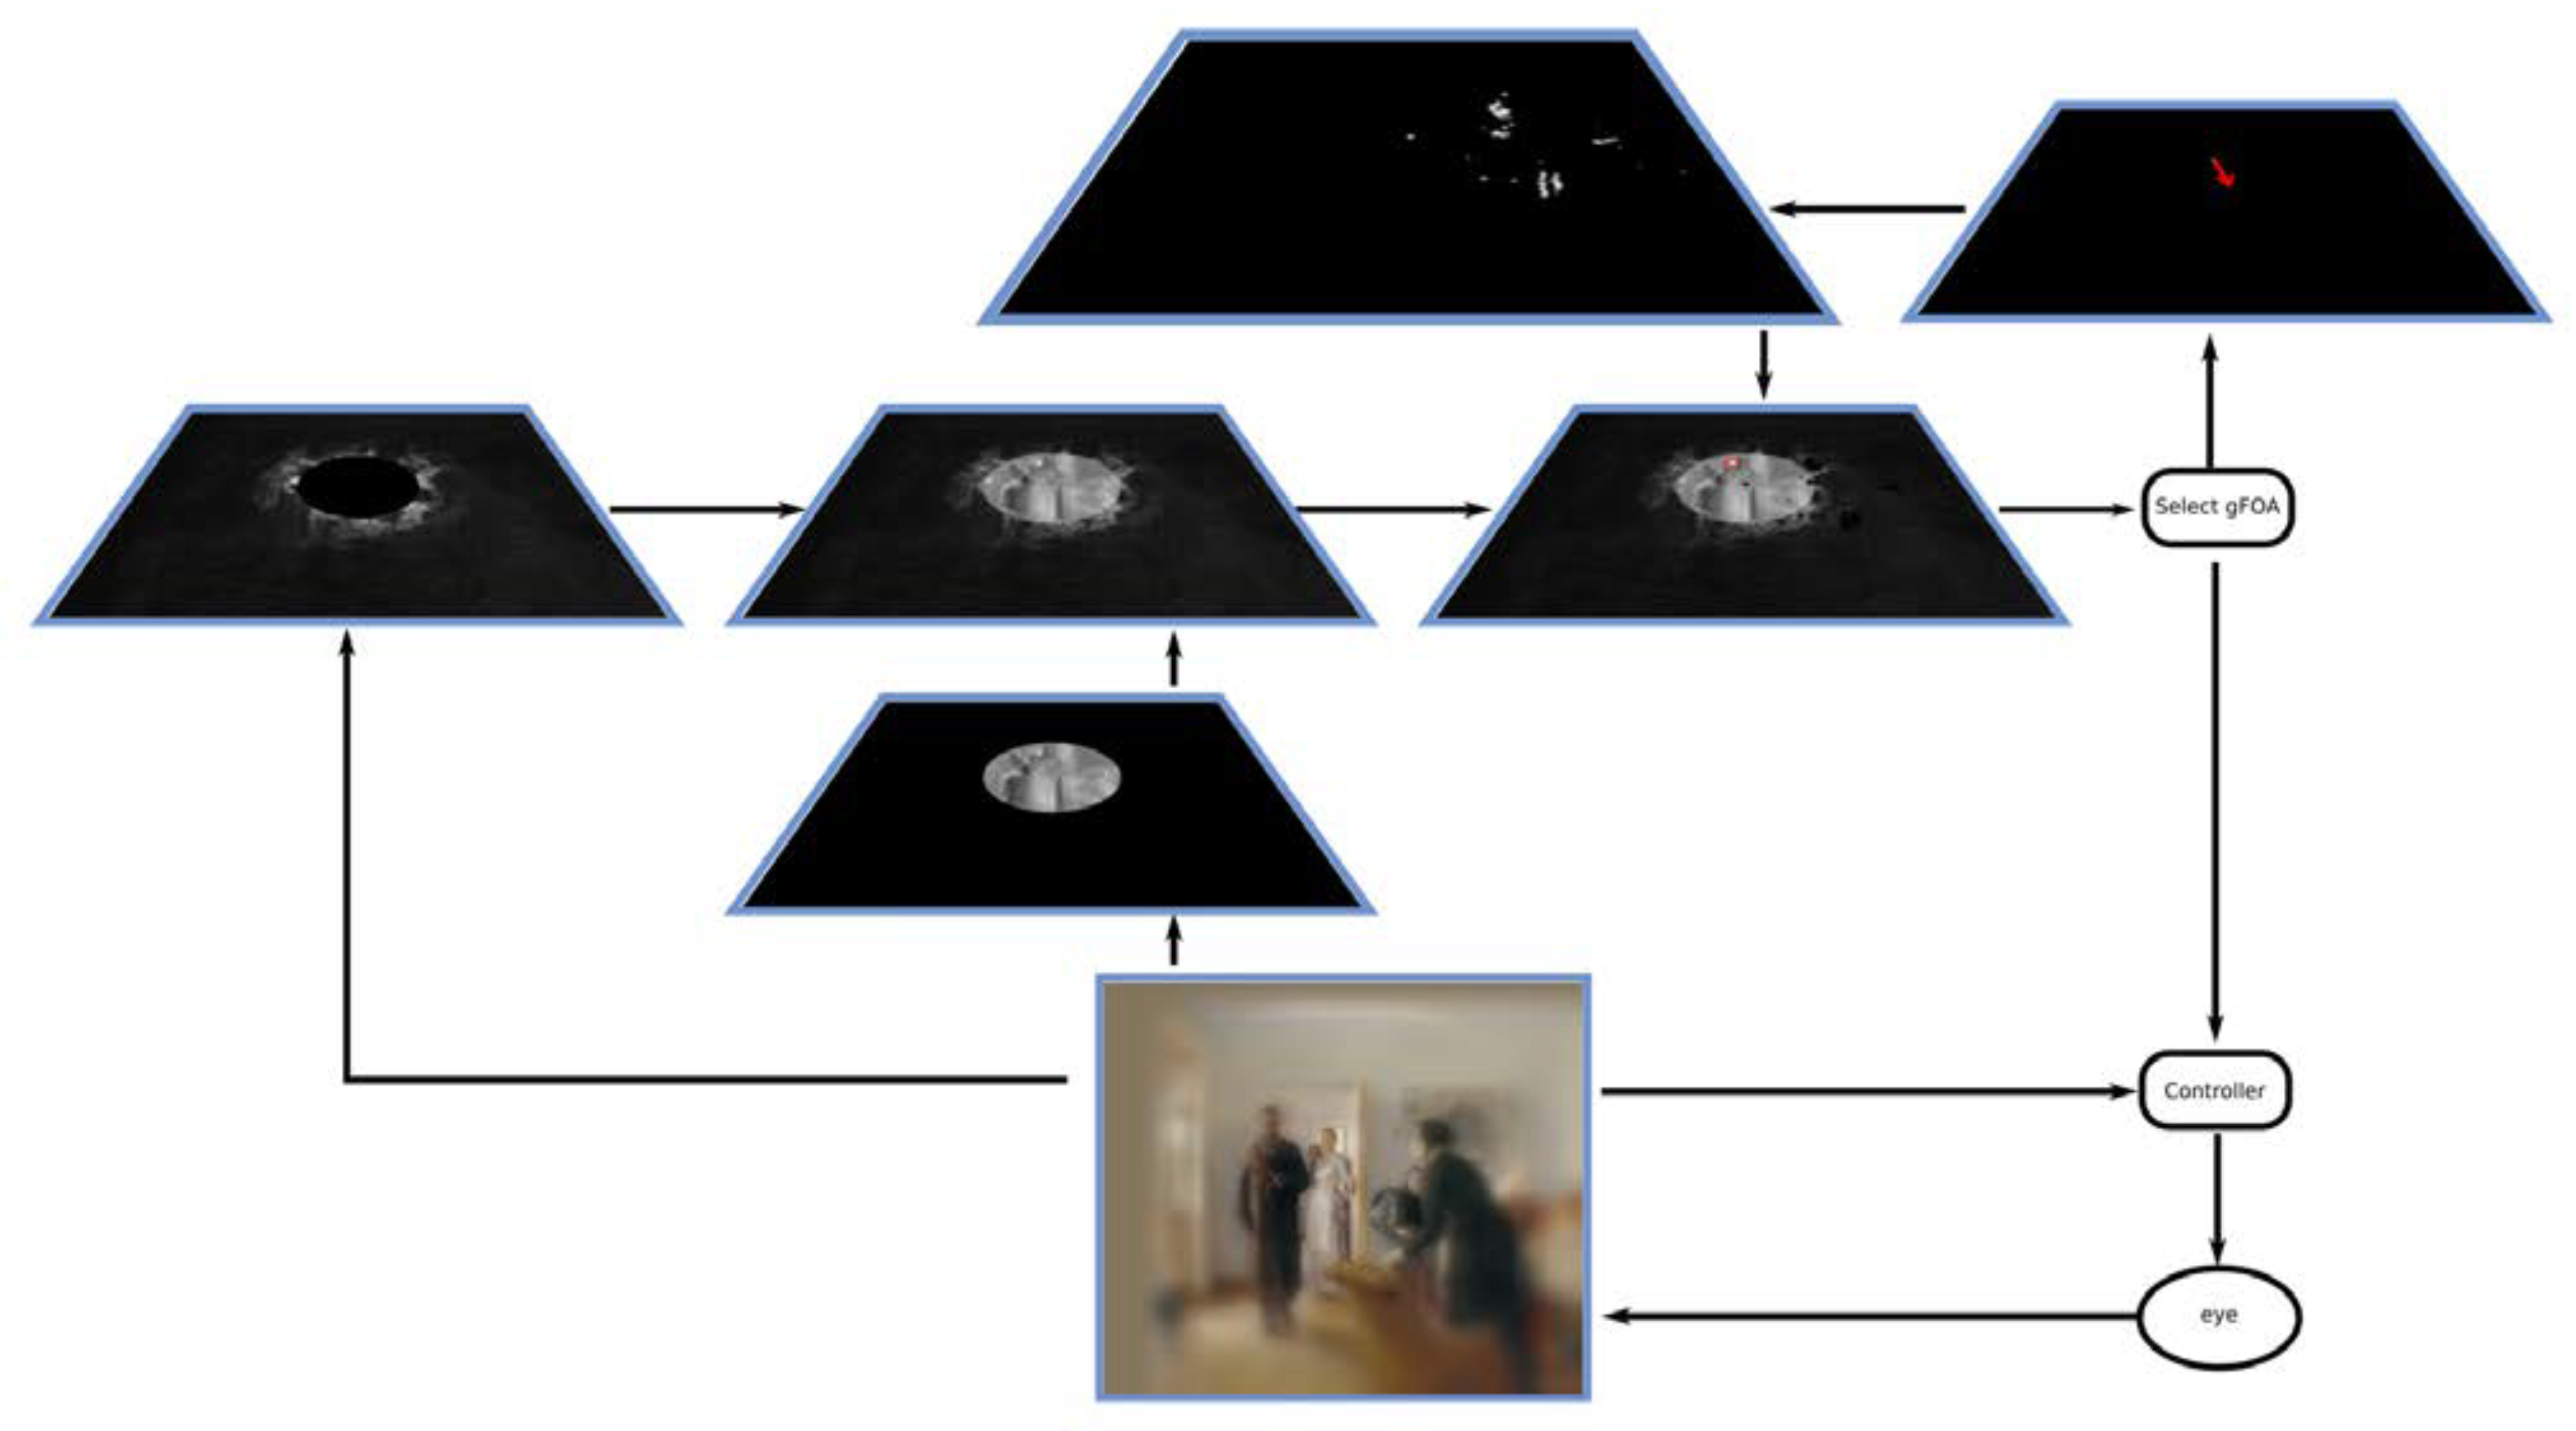
Figure 19 shows a snapshot of the contents of the relevant representations during the processing of the scanpaths seen in the top panel of
Figure 16, specifically the 284th fixation in the sequence of 720. An accompanying video shows fixations 283 293 including this one. It is important to note that although this demonstration depicts sequentially changing representations, the reality of the system is that representations and changes to them have a continuous and dynamic nature. Our depiction is intended to make clear the temporal progression and is accordingly simplified.
The peripheral attention map shows the result of the AIM algorithm on the periphery of the visual field (>25° eccentricity). The central attention map shows the results of the template matching within the central visual field. The two are combined in the conspicuity map. The priority map has the interesting representation of the modulated conspicuity map, with the modulation coming from the fixation history map. Selection of the next fixation occurs using this map and in this example, is shown with a small red oval. The fixation history map shows the locations that have been previously fixated, and as seen in the video is updated to always be centered at the point of gaze. There are no task influences in this example, but it would be easy to imagine the effect of very simple ones, such as ‘prefer stimuli in the top left of the image’ (locations not in the top left quadrant would appear with reduced brightness). The resulting representation a complex interplay of location preference, history of previous fixations with decaying IOR, and remapping of coordinate systems could provide insight into how these key aspects of eye movement behavior combine. The receptive field remapping shows the update vector (the red arrow) that is applied to all positions of the fixation history map.
The model is not dependent on the use of our particular saliency model, AIM, or on the method for computing the central focus. Other saliency methods or other categorization systems can be inserted into the overall architecture and their results examined. In fact, it would be expected that improvements to its components would lead to better overall performance.
Each of the depicted representations stands as a prediction for the patterns of responses of some potential neural correlate. It may be that the particular suggestions we present above as correlates are not the correct ones, but from a functional point of view, these representations do seem to suffice for the task. It is not common that realistic depictions of the contents of intermediate representations within a complex visual computation can be so inspected. But that is exactly the point here. Our explicit computational approach (as opposed to other approaches that may be less deterministic) permits us to observe how a representation evolves, how changes in input affect it, how each relates to the others, and how decisions are made based on them.
Conclusions
We have presented a novel view of the functional relationship among visual attention, interpretation of visual stimuli, and eye movements. The focus has been on one component, how selection is accomplished for the next fixation. We provided arguments that a cluster of conspicuity representations drives selection, modulated by task goals and history. The model embodies a hybrid of early and late attentional selection. In comparison to the algorithm embodied by the saliency map model (
Koch & Ullman 1985;
Itti & Koch 2001;
Itti et al. 1998), which has enjoyed tremendous utility in practice and popularity as an element of important models, might seem overly complex. In fact, their model is embedded within ours STAR subsumes it. For visual stimuli where early selection might suffice (Recall Marr’s assumption on p. 97 of his classic volume, when describing grouping processes and the full primal sketch. He says, “our ap-proach requires that the discrimination be made quickly to be safe, in less than 160ms and that a clear psychophysical boundary be present” (
Marr 1982). This is the assumption that must be true in order to ensure that early selection will suffice. The problem is that this represents only a small part of the normal everyday visual experience), where there is little competition among different kinds of stimuli, where fixation history can be safely ignored, and where physical constraints such as photoreceptor distributions and the boundary problem in a hierarchical representation can be ignored (possible if early selection suffices and all stimuli of relevance are presented foveally), STAR should behave much like a standard saliency map model. After all, it includes one of the standard benchmark models, AIM, as an integral component. The reality is that the exceptions to these assumptions are many and represent most of normal everyday perception. Further, as was pointed out above, an early selection model alone may not suffice for all stimuli even if Marr’s basic assumption (
Marr 1982) is true (such as the non-target stimuli of Thorpe). And for those, STAR proposes a solution where the saliency map model has none.
Generally, our goals are quite similar to those of
Tatler et al. (
2011), who also critique the single-image saliency map view. They derive a new model based on reward maximization and uncertainty reduction that can easily be considered a “sister view” to ours in that they begin with an analysis of the assumptions underlying the saliency map model. However, they consider different aspects to those we do, and put less emphasis on more basic components, like physical architecture. They introduce learning and reward issues as solution, which are beyond the scope of our work and in fact, are higherlevel concepts that we do not need at this point in our development. These are, however, relevant for future work and it would be a productive exercise for the “sisters” to meet and become better acquainted. On the other hand, it is important to point out that our perspective shows that we believe the problems with the saliency map view are of a more fundamental nature.
The performance differences between STAR and saliency map models can be attributed to a number of factors. A simple difference is the inclusion of IOR with decay in STAR. This can be easily added to other salience map models but does not suffice on its own to make the result competitive to STAR, as our test has shown. Likely the difference with greatest impact is the combination of early and late selection strategies and perhaps it is the inclusion of late selection that gives STAR an appearance of purpose, as can be observed in the human scanpaths. A third difference is that the modulation of the representation from which selection is made is from a source representation larger than the visual field, thus acting as a kind of short-term memory. This modulation further contributes to the appearance of purpose since generated fixations reflect the memory of sequences of previous fixations. Fourthly, we include a realistic representation of retinal input with a novel photoreceptor distribution transform (described in the Appendix). This differs from other models that use the uniform distribution that accompanies digital images. At the very least, it is important to investigate the impact when comparing to human eye movement patterns. Finally, in STAR, each fixation brings a new conspicuity ranking within the visual field whereas in the standard saliency model, the ranking is unchanged by subsequent fixations. There, no new image elements appear as a result of fixation, something that does not correspond to real eye movements.
We provide a unique solution to covert fixations. Covert fixations are typically considered as changes to attentional focus without eye movements, and as mentioned previously, are usually discerned by the inference that since an experimental subject is correctly performing a task that is not at the point of fixation they must be attending to that location. The only eye movements allowed are typically those within one or two degrees of the fixation point. This long-held view poses problems when one moves to a finer level of descriptive abstraction: how is the drastic change in spatial acuity dealt with and do those allowed small eye movements have any meaning? In STAR, there are two forms of fixation change that fall within the classic view just described. A true covert fixation is one where the target is not near the fovea, where the task-specific need for spatial resolution is sufficiently low, and where the observer has the choice as to how to fixate that target. An attentional microsaccade is an eye movement that is small (up to 1-2° visual angle as normally defined), to a target where high spatial resolution is important to the task and the observer has the choice as to how to fixate the target. These are in contrast to corrective microsaccades where the observer has no choice and which occur automatically in order to maintain the center of the fovea where the attentional system wants it to be (i.e., to correct for errors due to drift, noise or other misplacements). In all other cases, a normal saccade (an overt fixation change) is executed to achieve the attentional change. This view implies that past research on covert fixations may need to be reexamined.
Timing of computations and communications across this network of representations is important, and one temporal constraint has already been mentioned. As a general rule, when two representations are combined into a third, it is required that the computations that determine them complete before the computation that determines their combination begins. Looking at the visual hierarchy first, and following the ST process (
Tsotsos 2011), ST priming occurs in advance of a stimulus and needs about 100ms to be put in place via a top-down pass of the hierarchy. ST selection of the cFOA occurs as soon as the first feedforward pass completes (about 150ms after stimulus onset), and the ST Recurrent Localization process occurs after ST Selection and requires time equivalent to the time for a downward traversal through most of the hierarchy (about 100ms).
Boehler et al. (
2009) show convincing MEG evidence of this downward traversal. While all of this is occurring, the computation of the peripheral attention map can begin as early as when V1 representations appear on the first feedforward pass after stimulus presentation. The computation of the conspicuity map can begin as soon as the cFOA is available, roughly just after the feedforward pass. Finally, the attentional sample, as mentioned earlier, should be available once the gFOA is computed and the decision to move the eye is made. Future work will test this timing pattern experimentally.
One of Kowler’s research questions remains intriguing, namely, how do we maintain the percept of a clear and stable world despite the occurrence of saccades? On its own, STAR does not provide an answer, however, it may point in a promising direction. It is likely true that in order to maintain the percept of a stable world, the processing of each scene snapshot created by each saccade must leave something behind. That is, each snapshot is not processed independently of the others and the percepts extracted are not discarded. They must contribute to an accumulation of percepts in some manner so that the stable world we feel we see is continually constructed and updated. This implies some form of visual short-term memory. The specification of STAR includes elements of this kind (see Tsotsos & Kruijne 2014) although they are in early stages of development and currently far from providing what Kowler seeks. In what has been presented here, the Fixation History Map and the Attentional Sample play roles to this end in that the former provides a memory of locations fixated over a visual region larger than the retina and the latter provides the visual details extracted for each of those fixations. These representations are integral components of the overall perceptual system in that their contents directly impact what is perceived next. The joint action of representing what has been seen and using that representation to affect what is seen next seems important for moment-to-moment stability of perception. There is still far to go but we suspect elements of these kinds will be important contributors to answering Kowler’s question.
A complete specification of STAR is far beyond the scope of this paper (but most elements can be found within
Zaharescu et al. 2004;
Bruce & Tsotsos 2009;
Tsotsos 2011;
Wloka 2012;
Wloka & Tsotsos 2013;
Rothenstein & Tsotsos 2014; and Tsotsos & Kruijne 2014). Even so, some components remain work for the future (such as the box labeled ‘controller’ of
Figure 10 or the specific representations of the endogenous influences of that figure). In addition, this demonstration of STAR’s performance is admittedly less than ideal. In a subjective way, one can easily see similarities between STAR and human fixation scanpaths. However, neither the similarities nor the differences are quantified and this will hopefully be remedied very soon. Nevertheless, the demonstration features not only its ultimate output, fixations, but perhaps more importantly, a magnifying glass into what exactly all of the representations that contribute to that output might look like, something not seen in other models. These stand as predictions for potential functionality in corresponding neural correlates.
It is important to be appropriately careful about the various neural correlates of algorithmic representations described in this paper. Many brain areas have been found to have multiple functions (for example, area V6A to which we connect to our central attentional field see
Galletti et al. 2010). Attentional shifts of the form that would be evident in our central attentional field have been observed not only in monkey V6A but also in humans (
Ciavarro et al. 2013). Although aspects of attentional behavior were found, other dimensions of behavior were also detected. In this particular case, one could imagine this area not only representing visual attentional influences but also integrating attentional influences from other sensory modalities into a coherent view, which then goes on to drive selection as we describe. Other brain areas we mention have also been found to contain representations for other functions. Our correspondences are not meant to imply a single function to any particular area, but rather to suggest one function among others.
STAR provides a substrate for a richer exploration of how attention and eye movements are related than possible with other models because it is explicitly designed to be an integrative framework. It delivers what we stated as a goal in the beginning: additional levels of detail to the conceptual springboard provided by Kowler and Krauzlis. It is a fully computational framework that can be tested with real images (and image sequences) with no hidden representations or statistically inscrutable elements, generating fixations that can be fully analyzed and providing the full sequence of representations than can also be inspected, analyzed and used to drive experimental testing. It is certainly the case that the specific representations presented will require many refinements; however, the framework offers the ability to understand why those refinements will be needed.
