Abstract
In this article, we attempted to examine the issue of the existence of differences in eye move-ment of school-age students as they solve tasks of different difficulty levels in the sciences and natural sciences (computer science, mathematics, physics, biology). Catego-ries of the task’s difficulty level were established on the basis of two types of criteria: subjective (an evaluation made by the subjects) and behavioural (connected to the correct-ness of their solution). The relationships of these criteria with the visual activity parame-ters, which were considered to be indicators of mental effort, were identified. An analysis of the data obtained enabled the observation of discrepancies in categorizing difficulties of the tasks on the basis of subjective and behavioural criteria. A significant and strong corre-lation was noticed between task difficulty level, determined by the percentage of correct answers, and the fixation parameters, although such a relationship with the blink parame-ters was not found. There was no correlation of the activity of the eye movement parame-ters, considered to be mental effort indicators, with a student’s opinion about the task’s difficulty level. On the basis of the investigations made, it can be stated that the fixation duration average can be taken as an index of the difficulty level of the task being solved.
Introduction
Problem solving process
The task-solving process is conditioned by several factors. It depends on both a field of knowledge and the type of task and knowledge required as well as the skills and experience of the person solving the task. Solving tasks in mathematics, computer science and subjects in the natural sciences (biology, chemistry and physics) requires considerable mental activity, which is connected to both an appropriate analysis of content (text and other elements, e.g., diagrams, formulas and charts) the activation of reasoning processes at an appropriate level and the use of operational logic. The level of difficulty increases when a task includes atypical elements, including: the requirement to select more than one correct answer; an excess, deficit or ambiguity of data; and a requirement to solve a task in a way that differs from the typical methods used. As Nęcka and associates (2013) note, a division of problems according to simple-complex categories should be distinguished from a division of easy-difficult problems, and the level of complexity of a mental model that adequately describes a problem’s structure and its solution process is considered to be the most important criterion of problem complexity. While the difficulty of the problem they describe in terms of cognitive effort needed to solve the problem.
Processes or cognitive resources that are activated or used while solving problems, which can be indexes of a level of their difficulty, are connected with the concept of cognitive load. In the literature, different terms (cognitive load, mental workload, cognitive effort, mental effort) and definitions of this concept (Chandler & Sweller, 1991; Pass & van Merrienboer, 1994) are used. Young and Stanton (2001) described this idea in the following way:
‘The mental workload of a task represents the level of attention resources required to meet both objective and subjective performance criteria, which may be mediated by task demands, external support, and past experience’.
Both internal and external factors have an influence on the cognitive load level. The former are linked with the mental effort that is required by information processing, taking its structure and complexity and specificity to a particular field into account, whereas the latter are connected with the way in which the information is presented (Sweller, 1994). An important issue in determining the level of a task’s difficulty is the measurement of the cognitive load level. May and associates divided the measures used by researchers into three main groups: subjective, concerning an individual evaluation of the load degree connected with task performance (mostly according to the accepted scale); behavioural, connected with the quality of task performance (e.g., speed, accuracy, correctness); and physiological, which include the measurements of heart rate, breath or neuro-imagining techniques (ERP, PET, fMRI) and eye-tracking methods (May et al., 1990). Owing to the development of test equipment that until now was used mainly in medicine, psychology and biological sciences, there are new possibilities for the application of physiological measurements in educational investigations. More and more frequently in research, which has been conducted in recent years, specialized equipment, such as that for recording eyeball movements, has been utilized by projects aiming to understand broadly defined learning process (Lai et al., 2013). In the scope of the sciences and natural sciences, among others, different aspects of the task-solving process have been explained using this technique, (Suppes et al., 1983; Hegarty et al., 1992; Verschaffel et al., 1992; Tai et al., 2006; Nugrahaningsih et al., 2013; Stolińska et al., 2014; Andrzejewska et al., 2015), including an evaluation of the difficulty level of mathematical problems (Susac et al., 2014).
Eye movement parameters as indicators of mental effort
Eye-tracking technology. Learning is mostly connected with the perception and processing of stimuli from the environment. The most important sense (providing the most information) is sight, and that is why an eye activity became a subject of interest for neuro-educators. Visual perception activities are responsible for the analysis, synthesis and interpretation of images conveyed from the retina by optic nerves to the visual centre in the cerebral cortex. The attention system decides to select an object and to direct the eyes to it on average three times a second. As a result, eye tracking is considered to provide a precise reflection of the interactions between the cognitive processes and the visual external stimuli (Soluch & Tarnowski, 2013).
Eye-tracking is the process of measuring of eye activity. Most eye-trackers use infrared light from diodes LEDs to illuminate the eye. Systems typically use the relation between the corneal reflection, and the center of the pupil to identify eye’s position (gaze direction).
Generally, eye trackers can be divided into two types: remote and head-mounted. A head mounted solution is a good choice for field studies. The laboratories used stationary systems and an integrated GUI provides real-time information on a screen of researchers.
Technical specifications of devices are diverse. Traditional sampling rates is 60 Hz, but some new systems provide up to 1250 Hz. High frequency measurement does not guarantee its accuracy—the work must always be started with calibration of the device. A calibration procedure is required to compute the mapping between the measurements and the eye orientation (Ramanauskas, 2006). During a calibration session, the participant fixates on 7-13 points on the screen while the eye-tracker monitors the eye.
Over the last twenty years, neurophysiologic and eyetracking techniques have been used frequently as measurement methods of cognitive overload indexes in testing the attention processes of drivers and pilots and also in different problem-solving situations (Poole & Ball, 2005; Tsai et al., 2007; Rosch & Vogel-Walcutt, 2013). From an overview of the eye tracking of these investigations, the most frequently used eye-tracking measures were pupil dilation, a blink frequency, blink duration, a count of fixations and fixation duration. Fixation is a state in which eyes fix on the object observed. The length of the single fixation duration depends on information processing and is approximately 150 msec to 1500 msec (Steinman, 2004) although, for example, while reading it is 200–250 msec (Rayner, 1998). Between the fixations there is a saccade—a quick stepwise eyeball movement connected with changes in the sight focus points.
Fixations and saccades. Longer fixation duration on the image area is connected with difficulty in interpreting the information present or a greater involvement in its exploration (Just & Carpenter, 1976; Francuz, 2013). By contrast, the image elements that are comprehensible and those that do not contribute significant semantic informativeness are characterized by a shorter fixation duration (Henderson & Hollingworth, 1998). This regularity was also confirmed by many eye-tracking investigations, in which the participants solved problems in the scope of mathematics and physics. On this basis, it was found that the more complex the problem, the longer the duration of fixation or the greater their count (Rayner, 1998). It was noticed that the average fixation duration was longer when pictures of abstract character were viewed compared to figurative pictures, which indicates that the abstract pictures are subjected to deeper visual processing and can be a source of a stronger cognitive involvement connected with more difficult perception and interpretation of those works (Bałaj & Szubielska, 2014). In another research found that no relationship was shown between the fixation duration and the difficulty of the task of analysing the information presented in pictures (Backs & Walrath, 1992). Therefore, the relationships between the fixation parameters and the cognitive load indexes are not unequivocal, and they can depend on the type of task and conditions in which a task is performed. Researchers Goldber and Kotval (1999) used a fixation-saccade ratio as the index, which provided information about prevalence of the information processing processes in relation to searching. The parameter connected with saccade eye movement, the maximum value of the saccade rate (Di Stasi et al., 2010) that decreases with an increase in a number of stimuli processed, was considered to be sensitive to changes in the cognitive load. However, while considering this index, it should be taken into account that the maximum rate of the saccade reaction decreases at approximately 1.5 grades per second [°/sec] for each year over 20 years of age (Ober et al., 2009). Thus, the studies should be conducted among people in the determined age range.
Blinks and pupil dilation. By constructing an overview of the investigations on cognitive overload Poole and Ball (2006) found, that not only were the parameters of fixation and saccade considered, but the pupil dilation and frequency of blinks were also considered to be important in the experiments and indexes of information processing. This simultaneously indicated the susceptibility of those measures to the external factors, such as lighting conditions and an experimental limitation resulting from this fact. It was determined that in fixed lighting conditions with an increase in the difficulty of the task performed, the eye increased in diameter and there was a decrease in the count of blinks. Additionally, a high frequency of blinks can indicate tiredness.
In the investigations conducted in the last years, it can be noticed that there is an increasing interest in these parameters, pupil dilation change especially is a popular oculo-metric index of cognitive overload. Some researchers maintain that pupil size is a credible measure, even when lighting conditions are not tightly controlled (Halverson et al., 2012). An interesting index of the cognitive overload based on calculating slight transitory pupil dilations is Index of Cognitive Activity (ICA), developed by Marshall (2002; 2007).
Blinking is a natural reflex which may, as proven by the most recent research, plays an important role (apart from eye movement) in the information processing. Three types of eye blinks have been identified: reflexive, voluntary, and endogenous. Reflexive blinks are an instinctive reaction to the airborne pollution and a natural reflex to the noise that instills fear in people. Voluntary blinks are fully controlled, conscious movements to express acceptance, while endogenous blinks are due to perception and information processing, for example during speaking or reading. The more attention required by a task, the fewer endogenous blinks occur (Orchard & Stern, 1991).
The frequency of blinking is usually constant for each person and it ranges from 3 to 25 times per minute, yet it may increase in response to the external factors (such as humidity and ambient temperature) (Schaefer et al., 2009).
Also mental effort may radically change the frequency of blinks—a conversation and verbal prompts can increase the rate of blinking. However, there are some activities that definitely lower that frequency. It has been noted that reading decreases the frequency of blinks (Stern et al., 1994).
Also, Oh et al., (2012) observed that when the difficulty of the task varied, participants performed blinks just before and just after the periods of maximum difficulty. In general, blink rate decreases when more attention is required to perform a task. Nevertheless, other researchers claim that the higher blink rate was only in a mental arithmetic task, and this relationship was not found in a process of reading a text. In their research, the two tasks were of different nature in terms of the structure of information processing system (Tanaka & Yamaoka, 1993). They conclude that the changes in a task should bear no effect on the relationship between blink rate and task difficulty. The researchers infer that the result for blink amplitude indicated that this measure was a valid index of arousal level. All these findings indicate that blinks may be related to visual information processing.
Existing studies conclude that determining the level of cognitive load on the basis of blink parameters, such as the blink frequency and duration, is disputable. In this light, different conclusions were drawn by the researchers taking measurements of the cognitive overload of drivers and pilots (Recarte et al., 2008; Veltman & Gaillard, 1998). Therefore, an application of the parameters of blinks and pupil reaction for measuring the level of cognitive overload requires further study.
Methods
This paper’s purpose
On the basis of the above literature overview, the following research problems have been formulated:
- How do school-age students evaluate task difficulty level, and how does this evaluation correlate with the percentage of correct answers as a behavioural criterion of the difficulty?
- Do the tasks being solved differentiate the visual activity parameters of the tested persons?
- What are the relationships (correlations) between the eye activity parameters, the evaluation of the task difficulty level and the percentage of the correct answers provided by the school-age students?
- Are there any differences in evaluating the difficulty level of tasks, correctness of their solutions and the selected characteristics (parameters) of the eye movement between the differentiated groups of the tested school-age students?
Participants
52 students in the third form of the lower secondary school, including 25 girls and 27 boys, took part in the experiment. The measurement particulars of 4 persons were rejected for technical reasons, and 48 cases qualified for further analysis. Among the students selected, there was a group of prize winners of a physics competition—students showing above average aptitude in sciences (high GPA), and this group consisted of 16 persons and was marked as Competition students. Other persons formed a group that was called Non-Competition students. It was assumed that the “gifted” students would assess the tasks as easier. Since the researchers sought correlation between the subjective assessment and the parameters of eye movement, such decision seemed substantiated. The eyesight of the subjects was normal or corrected to normal, and all of them gave written consent to participate in the experiment.
Procedure
Considering that factors such as stress, time pressure or noise, and others coming from the environment can influence the cognitive load of an individual, the experiment eliminated or minimized them. Before and after the basic examination (eye-tracking), the students held conversations with members of the research team, during which they were informed of the experiment’s course. Some aims of the conversations were to reduce stress level, induce a positive attitude in the subjects and motivate them to get involved in the task-solving process. After the conversation, the students filled out the questionnaires.
The subjects solved tasks in the sciences and natural sciences: mathematics (MATH1, MATH2), physics (PHYS1, PHYS2), computer science (ALG1, ALG2) and biology (BIO). Polya (1973) believes that solving the text exercises requires certain thought operations that take place in a few stages, and the first key phase, which decides the success in solving a task, is understanding. Some researchers distinguish this stage from the entire process of task solving and ascribe a separate measurement of the mental effort to it (Kester et al., 2005). The tasks solved in the experiments were designed in such a way that the scope of the content was adapted from the curricula of the particular subjects at a lower secondary school education level. These were not abstract problems, but similar to those the students had to solve at school. This allowed to establish the differences in difficulty in the opinion of the very students (and not solely the experiment administrators). Moreover, the formulated task content was illustrated with appropriate charts, diagrams and other necessary graphic elements that not only substantively supplemented a verbal description, facilitating the understanding of the text for students, but they also performed a stimuli motivating function and encouraged solving of the task.
Each test was individually designed. The proper eyetracking experiment was performed by providing introductory instruction, and then calibration and other activities were conducted to ensure the appropriate performance of the measurements. During the experiment, all persons were provided equal environment conditions, such as temperature and sound-proofing. During the experiment, the tasks the students solved without the aid of stationary were presented on the subsequent slides. Each task required an analysis of the content of the instruction and appropriate illustration. The time for task solving was not limited, and each student worked at his/her own speed. The sequence of the tasks was the same. The subjects indicated actions by a mouse click and orally provided their answers.
Eye-tracking apparatus
In the experiment, an eye-tracker from the firm of Senso Motoric Instruments iViewX™Hi-Speed500/1250 was used, and it records a stream of data with time resolution of 500 Hz, recording parameters such as coordinates (coordinates x i y) of the sight position, pupil dilation (a relative and absolute measurement), and parameters of saccades and fixations. Spatial accuracy of the equipment is 0.1°, the calculation delay is less than 0.5 msec, and the system delay is less than 2 msec. The interface structure used in this system enables keeping the head motionless without limiting the subject’s field of vision. The results were processed using SMI BeGazeTM 2.4 software.
Results and discussion
To analyse the measurement data, researchers used an analysis of variance with a repeated measurement where the type of task was a factor (intra-group) of the repeated measurement, and the status of the tested student was an intergroup factor. The dependent variables were the evaluation of the difficulty level of the tasks by the students, the correctness of a task solution and the selected characteristics of eye movement.
An evaluation of the difficulty level of the tasks by the students
The students evaluated the level of difficulty of the task being solved by answering a questionnaire, in which they gave an answer to the question: Evaluate in the scale from 0 to 10 (where 0—very easy, 10—very difficult) to what extent the tasks you solved were easy/difficult. To avoid mistakes, each of the tasks were presented in a miniature form of the original slide in the questionnaire. The task’s difficulty level was measured using Likert’s eleven-point scale, and on this basis the following categories were determined (see Table 1).

Table 1.
The assumed categories of the task difficulty level.
On the basis of the values of basic descriptive statistics (see Table 2), it can be stated that among the task presented, none was categorized into the two extreme categories: very easy or very difficult. The students found the algorithmic task difficult (ALG2 mean=6.35), and according to them, one of the tasks in physics (PHYS1 mean=3.71) and one mathematical task (MATH1 mean=3.83) were easy.
Table 2.
An evaluation of the task difficulty level by the students (N=48).
The analysis of variance showed that differences in evaluating the difficulty level of the particular tasks are significant [F(6,276)=8.09, p < 0.001], and the Scheffe’s test (p < 0.01) confirmed the difference’s significance between algorithmic task ALG2 and all others, except task ALG1, which was significantly more difficult than task PHYS1 (p=0.033).
The results are presented in Figure 1, where the differences between the differentiated groups of the subjects are also shown, and they also turned out to be significant [F(1,46)=29.08, p < 0.001]. The average students (NonCompetition mean=5.41) considered the tasks much more difficult than the competition laureates (Competition mean=2.99).
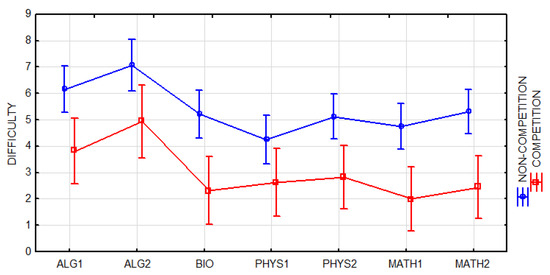
Figure 1.
An evaluation of the task difficulty level—differences between the groups: Competition and Non-Competition students.
Answer correctness as an indicator of the task difficulty level
The second criterion that was taken into account was the results obtained by the students (the behavioural criterion). The task’s difficulty was linked to the percentage the correct answers provided. The difficulty scale used for the task is presented in Table 3.
Table 3.
The assumed categories of the task difficulty level.
As shown in Table 4, the lowest percentage of correct answers was provided for the task in mathematics MATH1 - 25%, and a very near value was provided for the algorithmic task ALG1 - 27%. In the group of difficult tasks, there was also a second mathematical task MATH2 - 38%. The highest percentage of the correct answers were found for the biology task BIO - 76% and the second algorithmic task ALG2 - 63%.
Table 4.
The percentage of the correct answers as a criterion of the task difficulty level (N=48).
The analysis of variance showed that there were significant differences in the number of correct answers within particular types of tasks [F(6,276)=9.28, p < 0.001], and the Scheffe’s test confirmed significant differences in the results obtained by the subjects between the BIOL task and all others (p<0.01), except ALG2 (p=0.784), which was significantly easier than ALG1 or MATH1 (p<0.01).
The percentage of the correct answers in the average students group (Non-Competition mean=0.31) was more than two times lower than that in the laureate group (Competition mean=0.72). This difference was significant [F(1,46)=39.835, p < 0.001]. The differences between the groups in terms of particular tasks are presented in Figure 2. As can be seen, the highest discrepancies are observed in the tasks in the field of physics (PHYS1: Non-Competition mean=0.18, Competition mean=0.88, PHYS2: Non-Competition mean=0.24, Competition mean=0.82), which seems to be understandable, considering how the groups were divided.
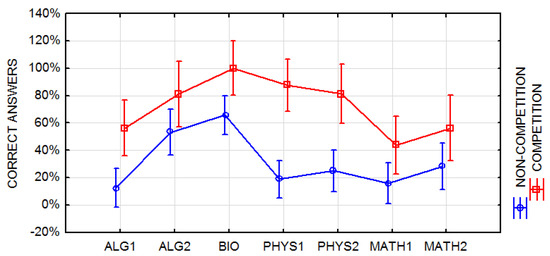
Figure 2.
The percentage of correct answers—differences between the groups: Competition and Non-Competition students.
The results obtained on the basis of this indicator turned out to be inconsistent with ones obtained according to the subjective criterion discussed earlier (compare with Figure 3). The greatest differences were in the case of the algorithmic ALG2 task, which, according to the students, was the most difficult, although it obtained the second highest indicator of correct answers. A similar contradiction occurred in the case of mathematical task MATH1, which obtained the lowest percentage of correct answers but in the students’ opinion was one of the two easiest tasks.
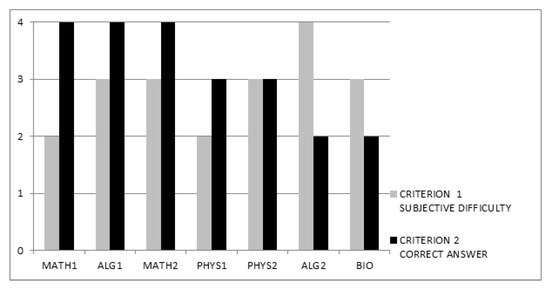
Figure 3.
The task difficulty level according to the determined criteria.
The divergences obtained are compatible with the results of other studies in which the subjective (here criterion 1) and behavioural (here criterion 2) measures were used. While analysing this problem in their work, May and associates (1990) emphasized that although in many investigations the significant correlations were obtained from the subjective evaluation indicators of workload when the tasks were solved, they did not frequently correlate with the objective measures (the obtained results).
The fact that while solving the tasks, the students selected the correct answer from a list of available categories, or in the case of the second criterion, both the number of the categories and whether the task answer was single or multiple choice, also determined its difficulty.
Tasks (MATH1, MATH2, ALG1) that were the most difficult according to the second criterion required the indication of two correct answers out of four. The moderately difficult tasks (PHYS1, PHYS2) were in the form of a single-choice question with 5 distractors. The easy tasks required indicating one answer out of two (ALG2) or four (BIO). Therefore, a distribution of the results obtained according to the second criterion (the answer correctness) reflects the task difficulty level that also results from the assumed number of distractors.
The correlation between the mean evaluation of the difficulty level of the whole task set and the percentage of the correct answers provided by the students was moderately strong r=-0.40 and statistically significant (p<0.05). The sign of this coefficient means that the higher the student evaluated the difficulty level of the task being solved, the lower the percentage of correct answers he/she obtained.
The oculomotor parameters as indicators of mental effort
The eye activity parameters, which, according to the literature overview on this subject, are considered to be indicators of information processing processes and cognitive overload, are connected with the following: pupil dilation, blinks and fixations. It has been assumed that value differentiation of these parameters can be an indicator of the differential level of task difficulty. Because during the experiment no tight control of the lighting conditions was provided, blink parameters—Blink Frequency ([count/sec]), Blink Duration Average ([msec]), Blink Count—and the fixation parameters—Fixation Duration Average ([msec]) and Fixation Frequency ([count/sec])—were selected as dependent variables for further analysis.
A disadvantage of using subjective methods is undoubtedly the fact that these methods are limited only to evaluating conscious aspects (elements) of the tasks being solved, and neglect the information processing aspects, which have an automatic character, but they load the cognitive system (May et al. 1990). Considering the above statement, a question was formulated to identify whether the differences that were found between the tasks and the groups (the students and the competition laureates) in the results obtained by the subjective and behavioural measures would also be identified by the eyetracking parameters.
Blinks. In the blink parameter analysis, a stage of the experiment in which the subjects rested while listening to relaxing music was also included. In the case of the blink frequency (Blink Frequency [count/sec]), the analysis of variance showed that there were significant differences between the particular tasks [F(7,322)=2.114, p=0.042], and the HSD Tukey test (p=0.022) confirmed the significance of the difference between the first (ALG1 mean=0.24) and last (MATH2 mean=0.39) task. A tendency toward an increase in the blink frequency average in the subsequent tasks and its higher value during the relaxation in relation to the previous task can be seen in Figure 4. This regularity is probably a sign of visual apparatus tiredness, which progresses while the subsequent tasks are being solved. It was also observed in other research (Fukuda et al., 2005). The blink frequency increases in situations of a decrease or lack of visual stimuli was also confirmed in other investigations, and this fact was interpreted in the following way: it seems that you may blink more frequently because in this specific situation, it will not be connected with the loss (omission) of visual information (Nakano et al., 2009; Ledger, 2013).
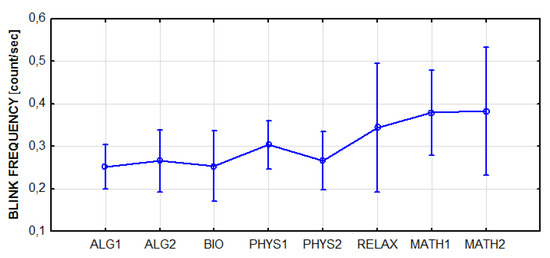
Figure 4.
The blink frequency—a distribution of the mean values for the particular tasks and the relax time.
The ordinary students (Non-Competition mean=0.34) blinked more frequently on average than the competition participants (Competition mean=0.27), although these differences were not significant [F(1,46)=1.107, p=0.298].
The average blink duration was a strong differentiator of the relax phase. The mean values of this parameter (Blink Duration Average [msec]) while solving tasks ranged from 188 msec (for task ALG2) to 212 msec (for task MATH2), but in the relax time they were found to be longer and lasted 313 msec on average. The variance analysis [F(7,322)=15.294, p<0.001] and Scheffe’s test (p<0.001) showed that there were significant differences between the relax phase and the stages of solving the particular tasks for that parameter. During proper solving of the tasks, the blink duration average was similar. Therefore, it was not a parameter dependent on the type of task. No differences between the distinguished groups were observed [F(1,46)=1.373, p=0.247]. The results obtained are presented in Figure 5.
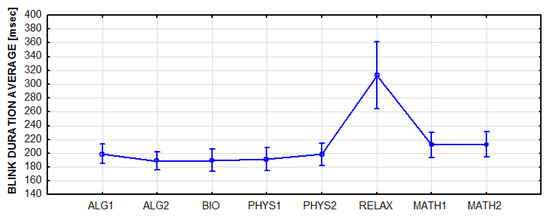
Figure 5.
The blink duration average—a distribution of the mean values for the particular tasks and the relax time.
In the case of the blinks count, the variance analysis showed that there were no significant differences between the particular tasks [F(7,322)=1.835, p=0.080] and between the average students and the competition laureates [F(1,46)=0.642, p=0.427]. Thus, this parameter of eye activity does not depend on the type of task being solved and participation status in the experiment (see Figure 6).
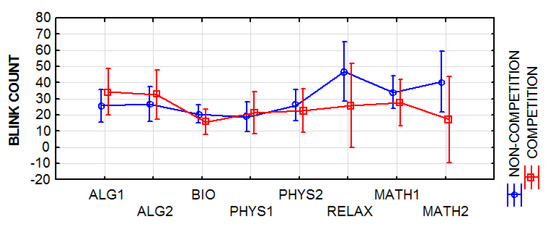
Figure 6.
The blink count—a distribution of the mean values for the particular tasks and the relax time.
Fixations. The fixation duration average was significantly differentiated for the particular tasks [F(6,276)=65.084, p<0.001].
The highest value of this parameter can be observed in the case of the task MATH1 (mean=293.04 msec). This is the result in which the Scheffe’s test deviates and is statistically significant (p<0.001) from all other tasks. Undoubtedly, while solving this task the subjects showed the highest processing level of data registered by the eye (see Figure 7).
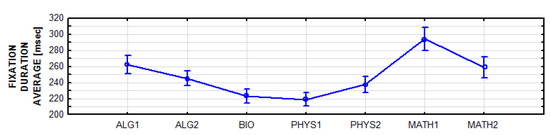
Figure 7.
The fixation duration average—a distribution of the mean values for the particular tasks.
The mean value of the parameter in question was very similar (almost equal) in both groups tested [F(1,46)=0.001, p=0.976]—(Non-Competition mean=247 msec) and (Competition mean=248 msec); therefore, both the students and the laureates showed a comparable level of visual information processing.
Similar results, indicating a differentiating status of task MATH1, were obtained for the parameter of fixation frequency [count/sec] (compare Figure 8), the value of which definitely decreased in this task and can be interpreted as a prevalence of the processing processes over the searching of a visual scene. The variance analysis showed significant differences within the particular tasks [F(6,276)=72.49, p<0.001] and a lack of differences between the groups in question [F(1,46)=0.009, p=0.976].
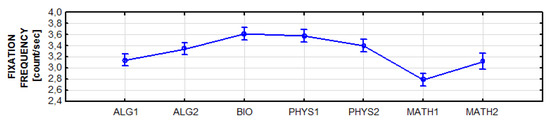
Figure 8.
The fixation frequency—a distribution of the mean values for the particular tasks.
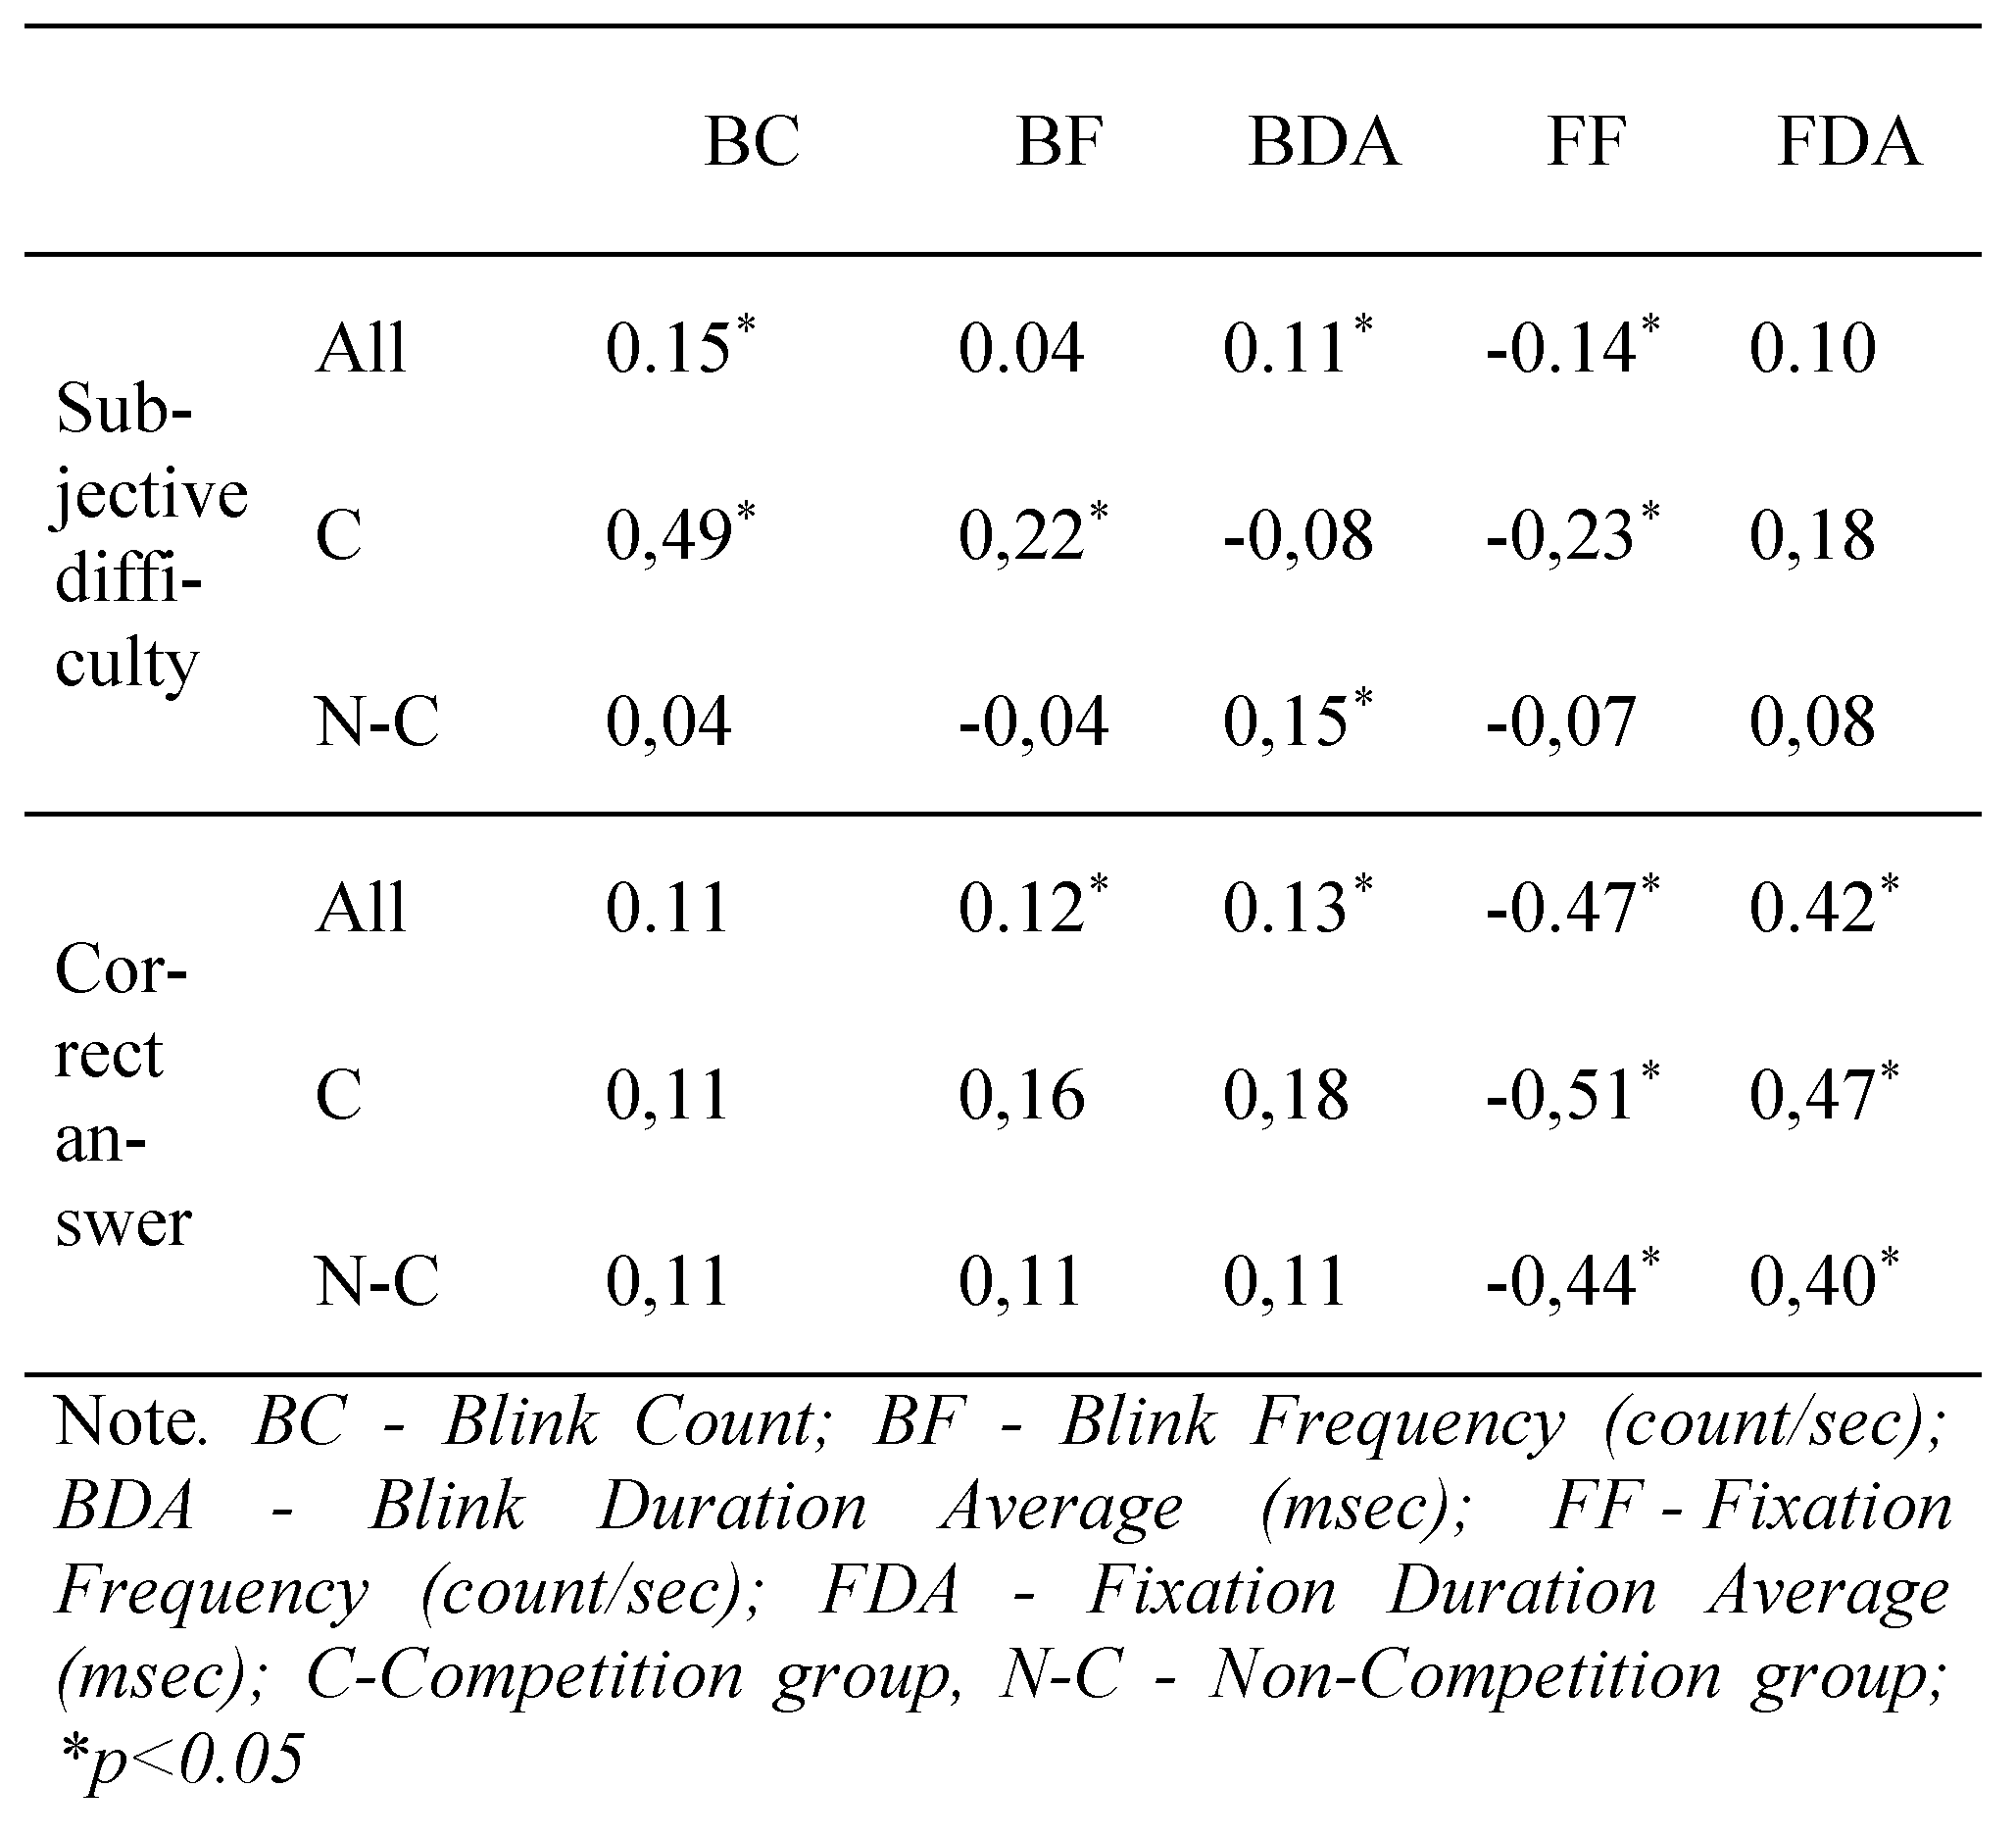
Correlations. Looking for relationships between the eye-tracking parameters and the criteria discussed earlier, in the first step, correlations between the task difficulty level evaluation (criterion 1) and the obtained results (criterion 2) and the eye-tracking parameters discussed above (Blink Count, Blink Frequency, Blink Duration Average, Fixation Frequency, Fixation Duration Average) were investigated.
As presented in Table 5, the correlations of the fixation and blink parameters with the opinion of the all students about the task difficulty level (criterion 1) are rather weak, and they only turned out to be significant in some cases. However, three parameters displayed differences within the tested groups; they consisted in Blink count and their frequency as well as the frequency of fixation—within the Competition group the correlation for blink count factor is both significant and quite strong (r=0.49).
Table 5.
The Pearson’s correlation coefficient for the selected eyetracking parameters and the evaluation of the task difficulty level and the results obtained.
The negative value of the coefficients of the difficulty level of the tasks measured according to criterion 2 (answer correctness) and the fixation frequency (r=-0.47) should be interpreted as a decrease in the oculomotor activity in the situation of an increasing level of task difficulty. There was simultaneously a positive correlation of this parameter and the fixation duration average (r=0.42), and this indicator was determined to be a measure of the level of involvement in data processing (compare Table 5).
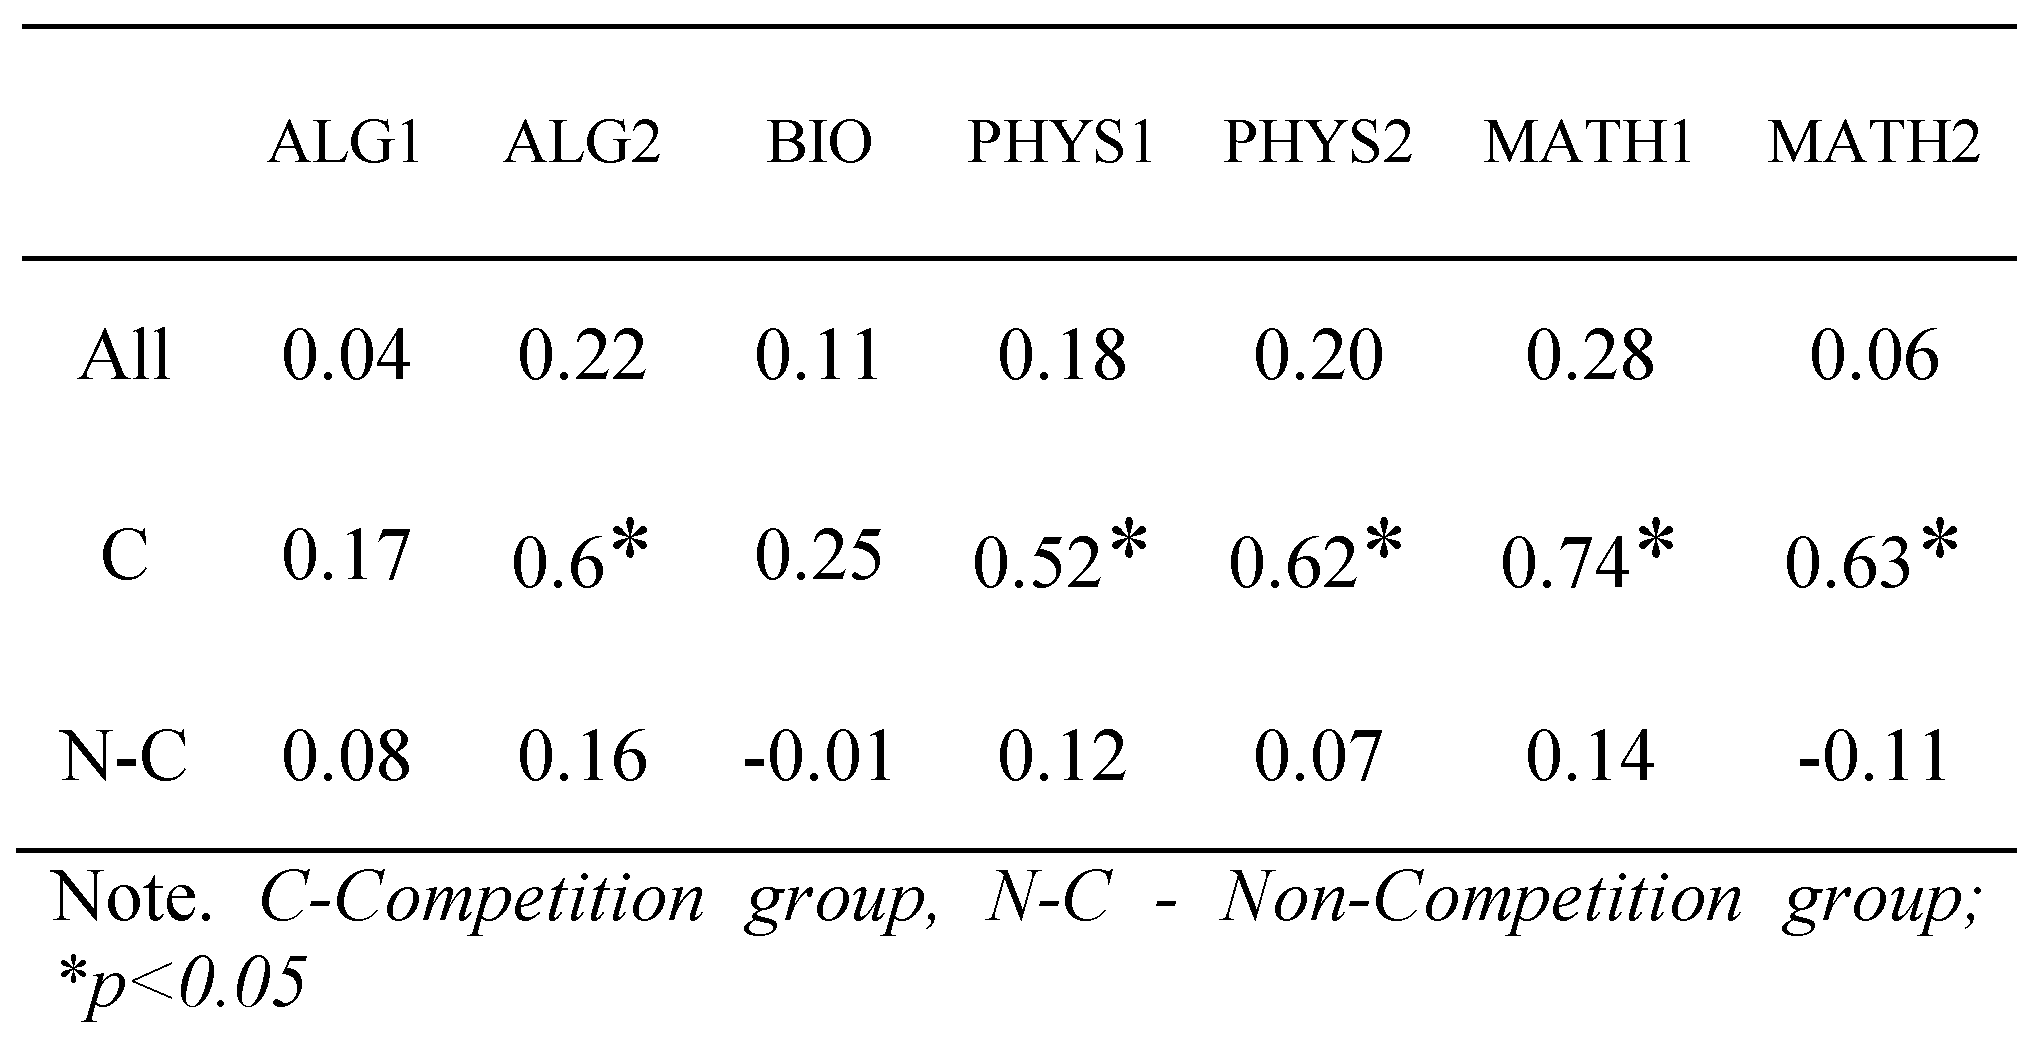
A significant and quite strong (r=0.49) correlation of the Blink Count and the subjective level of difficulty within the Competition group inspired the authors to check the correlation coefficients of those parameters as noted in the particular tasks. As shown by the results listed in Table 6, the obtained coefficients for almost all tasks in the Competition group (except two) displayed high values, indicating strong interdependence of the discussed parameters. At his point, it should be noted that the Blink count in both groups was relatively strongly and significantly correlated with the time of performing the task (Competition r=0.67, Non-Competition r=0.43, p<0.05).
Table 6.
The Pearson’s correlation coefficient for the Blink Count parameter and the evaluation of the task difficulty level for the particular tasks.
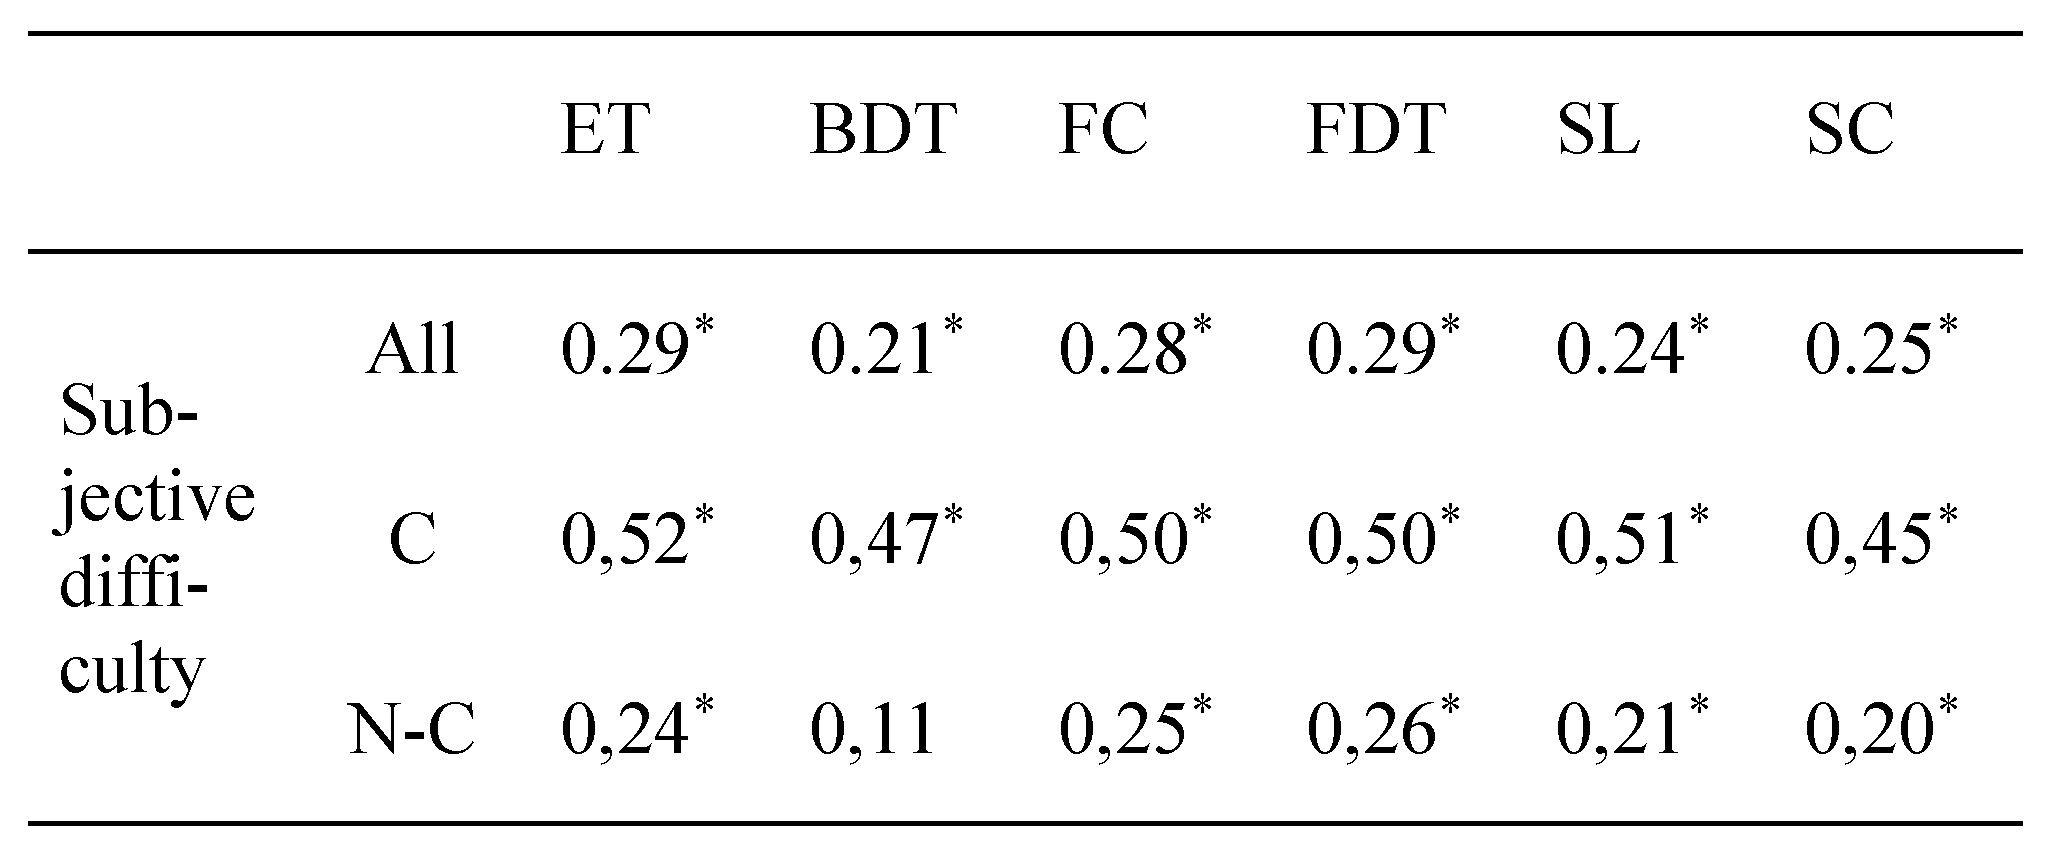
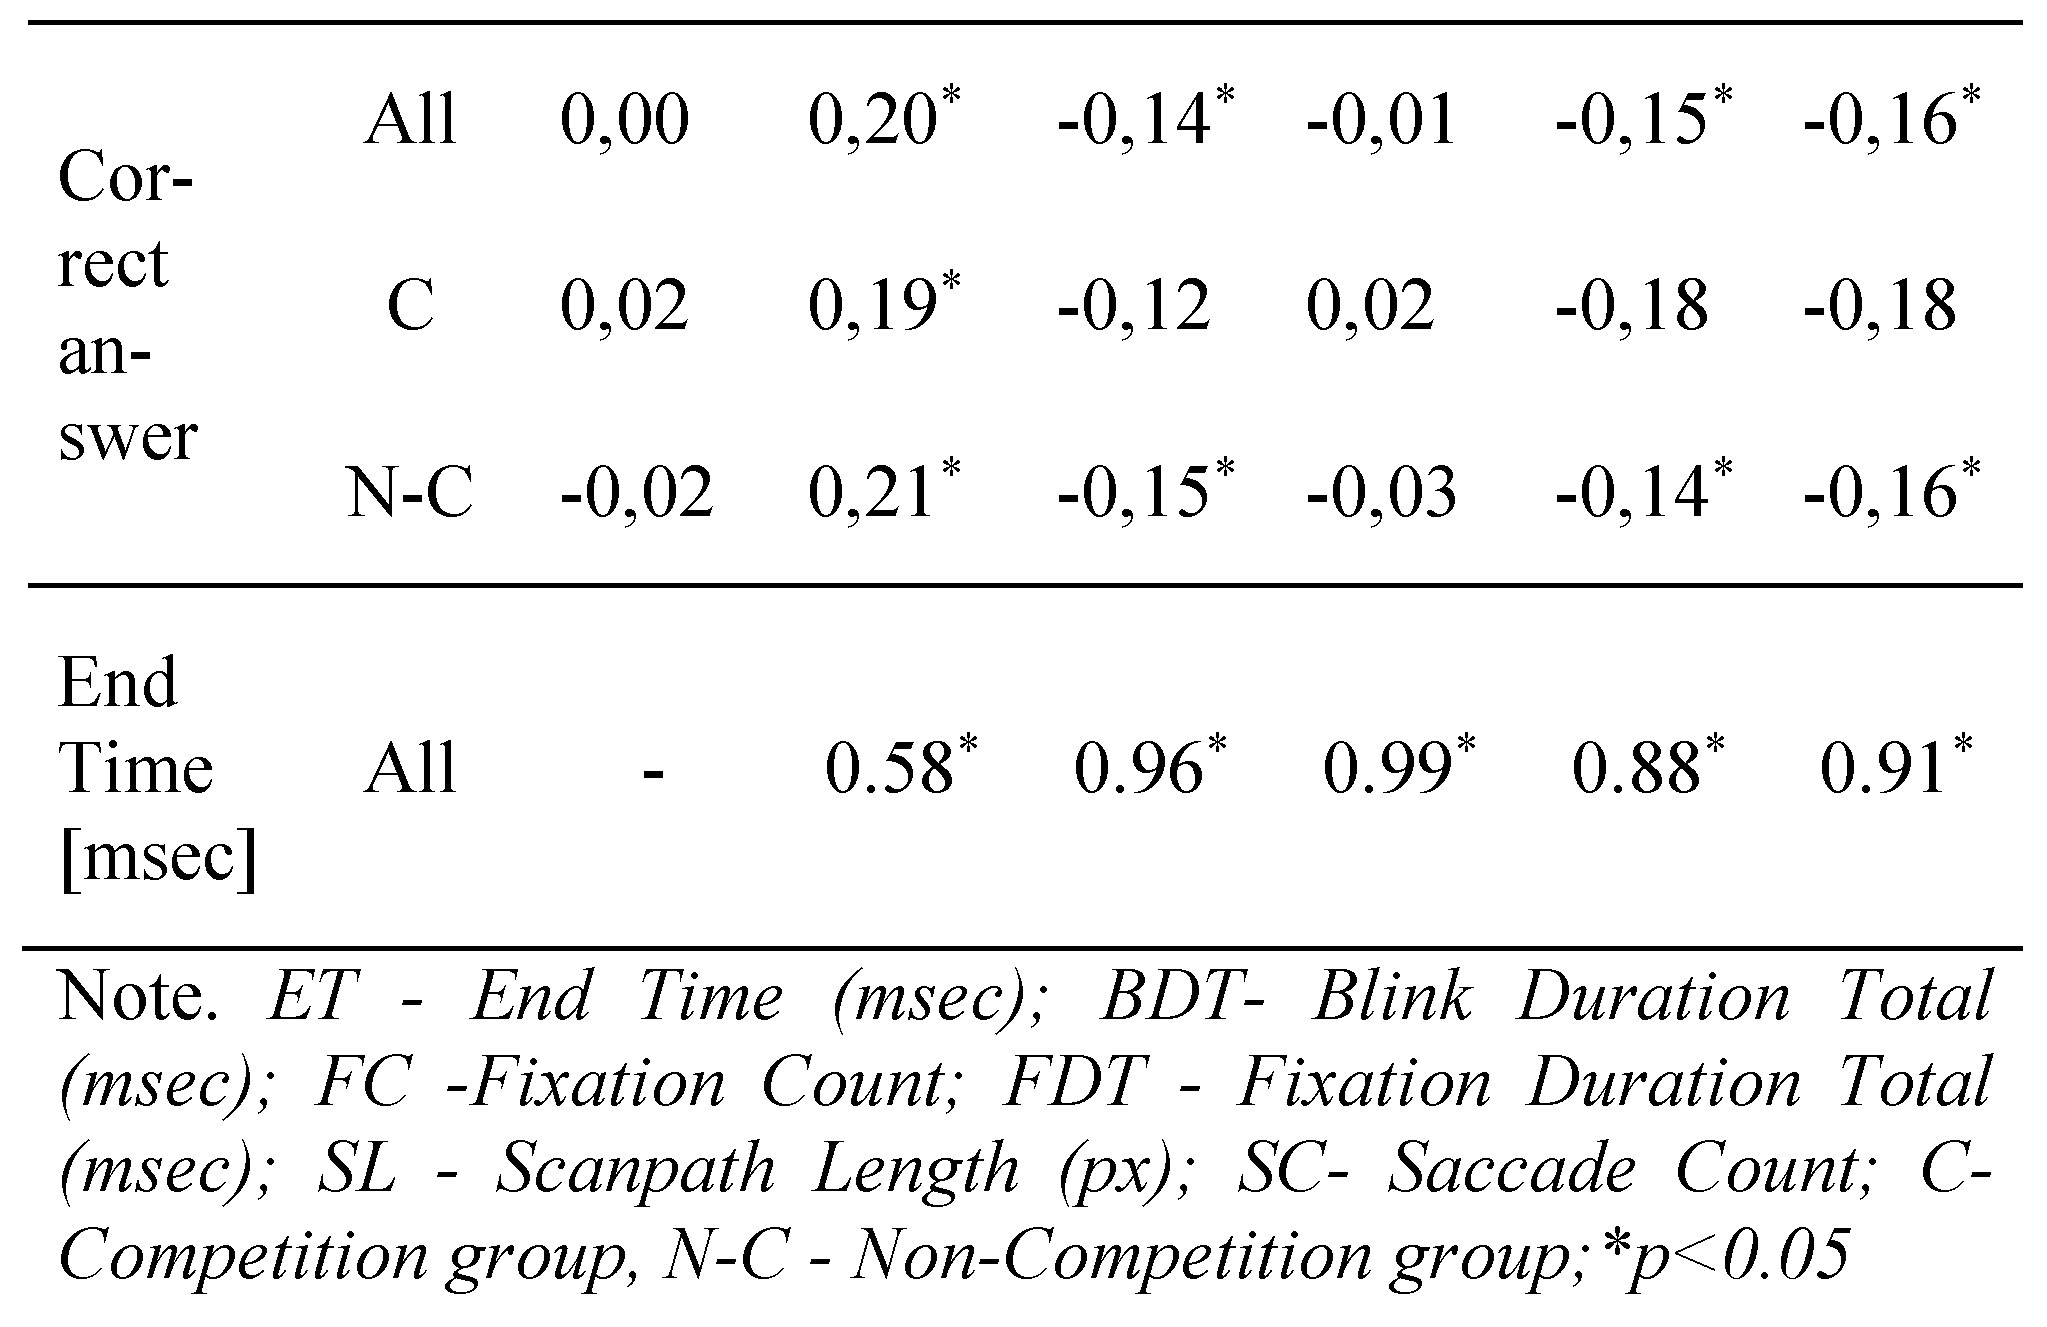
Which other eye-tracking parameters correlate the strongest with the task difficulty criteria in question? On the basis of Table 7, it can be stated that there are no strong relationships between the subjective evaluation of the task difficulty level made by the students and the eye movement indicators for all of the experiment participants. Just like in the previous cases, the differences were found among the tested groups and the correlation was much stronger in the Competition group.
Table 7.
The Pearson’s correlation coefficient for the selected eyetracking parameters and the evaluation of the task difficulty level and the results obtained.
The parameters that for all subjects correlate positively and for which the correlation coefficient value is over r=0.2 are task performance time, scan path length, total fixation duration, total blink duration, a count of fixations and a count of the saccades. It should be emphasized that all those parameters were strongly positively correlated with task solving duration (the correlation coefficient in the range from r=0.58 to r=0.99). This relationship between the scan path length and the total fixation duration is presented in Figure 9. The analysis showed no differences among the groups in terms of the second criterion Blink Duration Total was the only parameter among the tested batch whose coefficient correlation value with Criterion 2 reached r= 0.2
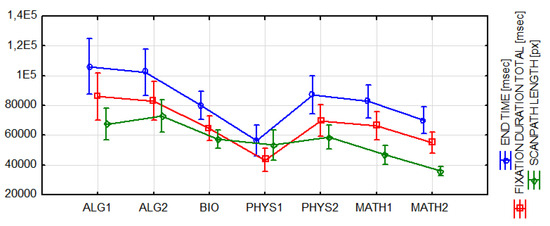
Figure 9.
A comparison of the selected eye-tracking parameters for the particular tasks.
The finding, which seems to be justified, is a statement that the task-solving time and the derived eyetracking parameters are indicators of the task difficulty level, which correlates positively with the subjective evaluation of the task difficulty level provided by the students.
Conclusions
To sum up the obtained results, it should be stated that by using the measures mentioned (subjective feelings of the students and the index of task solvability), other classifications of the task difficulty level were obtained and in the case of two tasks, they turned out to be extremely different. Moreover, no correlation between eye movement activity parameters, considered to be an indicator of mental effort, and the opinion of all the students about the task difficulty level was observed. It should be noted that there were differences in groups of parameters of Blink count, which was significantly and strongly correlated with the opinion on the level of difficulty of majority of the solved tasks.
A correlation (significant and not strong) occurred in the case of the opinion of the students and task-solving time and the derived eye-tracking parameters. There was a significant and rather strong correlation between the task difficulty level determined on the basis of the percentage of correct answers and the fixation parameters, whereas such a relationship was not observed for the blink parameters. An analysis of the results showed a presence of significant differences in the distinguished groups (the average students and the competition laureates) in the scope of the first two criteria—the average students found tasks more difficult, and the percentage of the correct answers among them was two times lower than among the competition laureates.
It seems that each task difficulty measure in question (subjective evaluation, an objective result of solution correctness and an activity of the vision apparatus) concerns another dimension of the phenomenon examined. The subjective evaluation is connected with the individual’s perception of a specific task, which is influenced by many factors, among which the knowledge and skills of the student are the most important. The obtained result (answer correctness) verifies (negatively or positively) the individual’s opinion, and it seems to be the most objective measure of task difficulty. Eye-tracking measures were taken that were thought to be indicators of the mental effort, which in many investigations were analysed in the situation of the differentiated difficulty levels of different types of tasks. This idea was described earlier in the literature overview.
The cognitive overload has a multi-dimensional character, and the studies note the sensitivity of different classes of the eye activity parameters (including blinking, a pupil reaction, the eye movement parameters) to its different specific aspects (Chen et al., 2011). The performed analysis of the blink parameters did not allow for the drawing of unequivocal conclusions about the levels of difficulty of the tasks being solved. The blink duration average, except at the relax stage, was not significantly differentiated while solving specific tasks. A tendency toward a blink frequency that increased as time progressed (experiment duration) may be connected with increasing tiredness of the visual apparatus. The differentiation of the blink count value in the scope of the particular tasks was not significant, and it was moderately strongly, positively correlated with the time of performance of the particular tasks. The obtained results do not indicate that the variability of blinks is not directly connected with the task’s difficulty level, and the results are compatible with the conclusions of other researchers (Brouwer et al., 2014). They support the thesis that the blink parameters depend on the task specificity and unique processes of information processing connected with it (Takana & Yamaoka, 1993). Sensitivity of the blink parameters appears, first of all, in the case of problems in the character of a change detection task or a vigilance task, in which input stimuli appear in the vision field (Neumann & Lipp, 2002). Considering the obtained correlations of eye-tracking measures and the criterion of the task solution correctness, the fixation duration average may be treated as an indicator of the difficulty level. Those results are compatible with the results of other experiments in which the above values of this parameter were confirmed in the situations of increased cognitive load (Chen et al., 2011; Debue & Leemput, 2014).
It should be emphasized that determining the task difficulty level is an important educational issue, which is relevant when constructing scaling and grading criteria. It is especially significant when verification is not a reproduction of memorized information, but the solving of tasks that requires information processing at a higher level and involves different cognitive mechanisms.
Appendix A
The example tasks analysed in the article.
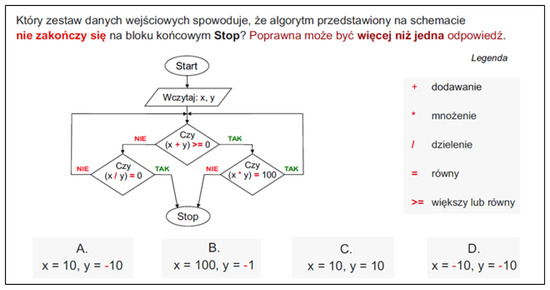
Figure 10.
Task ALG1.
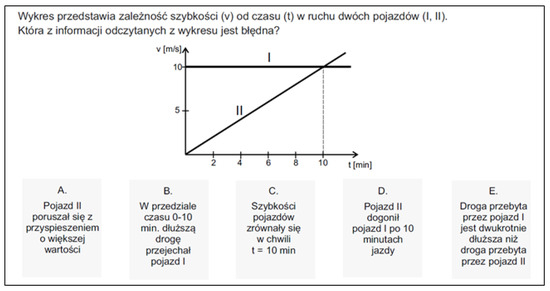
Figure 11.
Task PHYS1.
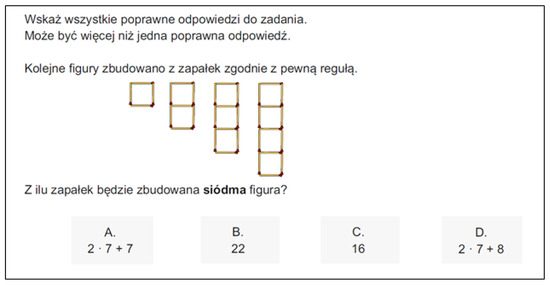
Figure 12.
Task MATH1.
References
- Andrzejewska, M.; Stolińska, A.; Błasiak, W.; Peczkowski, P.; Rosiek, R.; Rożek, B.; Sajka, M.; Wcisło, D. Eye-tracking verification of the strategy used to analyse algorithms expressed in a flowchart and pseudocode. Interactive Learning Environments 2015. [Google Scholar] [CrossRef]
- Backs, R. W.; Walrath, L. C. Eye movement and pupillary response indices of mental workload during visual search of symbolic displays. Applied Ergonomics 1992, 23(4), 243–254. [Google Scholar] [PubMed]
- Bałaj, B.; Szubielska, M. The influence of catalog description listening on visual scanning of paintings. In Widziane inaczej. Z polskich badań eyetrackingowych (pp.77-90); Grucza, S., Płużyczka, M., Soluch, P., Eds.; IKL@ Wydawnictwo Naukowe Instytutu Kulturologii i Lingwistyki Antropocentrycznej: Warszawa, 2014. [Google Scholar]
- Brouwer, A.; Hogervorst, M. A.; Holewijn, M.; van Erp, J. B. F. Evidence for effects of task difficulty but not learning on neurophysiological variables associated with effort. International Journal of Psychophysiology 2014, 93, 242–252. [Google Scholar]
- Chandler, P.; Sweller, J. Cognitive Load Theory and the Format of Instruction. Cognition and Instruction 1991, 8(4), 293–332. [Google Scholar]
- Chen, S.; Epps, J.; Ruiz, N.; Chen, F. Eye activity as a measure of human mental effort in HCI. In Proceedings of the International Conference on Intelligent User Interfaces; 2011. [Google Scholar] [CrossRef]
- Debue, N.; Leemput, C. What does germane load mean? An empirical contribution to the cognitive load theory. Frontier in Psychology 2014, 5, 1099. [Google Scholar] [CrossRef]
- Di Stasi, L.; Marchitto, M.; Antoli, A.; Baccino, T.; Cañas, J. Approximation of on-line mental workload index in ATC simulated multitasks. Journal of Air Transport Management 2010, 16(6), 330–333. [Google Scholar]
- Francuz, P. Imagia. In W kierunku neurokognitywnej teorii obrazu; KUL: Lublin, 2013. [Google Scholar]
- Fukuda, K.; Stern, J.A.; Brown, T.B.; Russo, M.B. Cognition, blinks, eye-movements, and pupillary movements during performance of a running memory task. Aviation, Space, and Environmental Medicine 2005, 76(7), C75–C85. [Google Scholar]
- Goldberg, H. J.; Kotval, X. P. Computer interface evaluation using eye movements: Methods and constructs. International Journal of Industrial Ergonomics 1999, 24, 631–645. [Google Scholar]
- Halverson, T.; Estepp, J.; Christensen, J.; Monnin, J. Classifying Workload with Eye Movements in a Complex Task. In Proceedings of the Human Factors and Ergonomics Society Annual Meeting; 2012. [Google Scholar] [CrossRef]
- Hegarty, M.; Mayer, R. E.; Green, C. E. Comprehension of Arithmetic Word Problems: Evidence From Students’ Eye Fixations. Journal of Educational Psychology 1992, 84(1), 76–84. [Google Scholar]
- Henderson, J. M.; Hollingworth, A. Underwood, G., Ed.; Eye Movements During Scene Viewing: An Overview. In Eye Guidance in Reading and Scene Perception; Elsevier; Oxford, 1998; pp. 269–294. [Google Scholar]
- Just, M. A.; Carpenter, P. A. Eye fixations and cognitive processes. Cognitive Psychology 1976, 8, 441–480. [Google Scholar]
- Kester, L.; Kirschner, P.A.; van Merrienboer, J. J. G. The management of cognitive load during complex cognitive skill acquisition by means of computer-simulated problem solving. British Journal of Educational Psychology 2005, 75, 71–85. [Google Scholar] [CrossRef] [PubMed]
- Lai, M. L.; Tsai, M. J.; Yang, F. Y.; Hsu, C. Y.; Liu, T. C.; Lee, S. W.; Lee, M. H.; Chiou, G. L.; Liang, J. C.; Tsai, C.C. A review using eye-tracking technology in exploring learning from 2000 to 2012. Educational Research Review 2013, 10, 90–115. [Google Scholar] [CrossRef]
- Ledger, H. The effect cognitive load has on eye blinking. The Plymouth Student Scientist 2013, 6(1), 206–223. [Google Scholar]
- Marshall, S. P. The Index of Cognitive Activity: Measuring Cognitive, Workload. In Proceedings of the 7th IEEE Conference on Human Factors and Power Plants; 2002. [Google Scholar] [CrossRef]
- Marshall, S. P. Identifying cognitive state from eye metrics. Aviation, Space and Environmental Medicine 2007, 78(5), B165–B175. [Google Scholar]
- May, J. G.; Kennedy, R. S.; Williams, M. C.; Dunlop, W. P.; Brannan, J.R. Eye movement indices of mental workload. Acta Psychologica 75 1990, 75–89. [Google Scholar] [CrossRef]
- Nakano, T.; Yamamoto, Y.; Kitajo, K.; Takahashi, T.; Kitazawa, S. Synchronization of spontaneous eyeblinks while viewing video stories. Proceedings of The Royal Society B 2009. [Google Scholar] [CrossRef]
- Neumann, D.L.; Lipp, O. V. Spontaneous and reflexive eye activity measures of mental workload. Australian Journal of Psychology 2002, 54(3), 174–179. [Google Scholar] [CrossRef]
- Nugrahaningsih, N.; Ricotti, S. Gaze Behavior Analysis in Multiple-Answer Tests: An Eye Tracking Investigation. International Conference on Information Technology Based Higher Education and Training (ITHET); 2013. [Google Scholar] [CrossRef]
- Nęcka, E.; Orzechowski, J.; Szymura, B. Psychologia poznawcza; Wydawnictwo Naukowe PWN: Warszawa, 2013. [Google Scholar]
- Ober, J.; Dylak, J.; Gryncewicz, W.; Przedpelska-Ober, E. Sakkadometria-nowe możliwości oceny stanu czynnościowego ośrodkowego układu nerwowego. Nauka 4 2009, 109–135. [Google Scholar]
- Oh, J.; Jeong, S.-Y.; Jeong, J. The timing and temporal patterns of eye blinking are dynamically modulated by attention. Human Movement Science 2012, 31, 1353–1365. [Google Scholar] [CrossRef]
- Orchard, L. N.; Stern, J. A. Blinks as an index of cognitive activity during reading. Integrative Physiological and Behavioral Science 1991, 26(2), 108–116. [Google Scholar] [CrossRef]
- Paas, G.W.C.; van Merrienboer, J. J. G. Variability of worked examples and transfer of geometrical problem-solving skills: A cognitive load approach. Journal of Educational Psychology 1994, 86, 122–133. [Google Scholar] [CrossRef]
- Polya, G. How to solve it; Princeton University Press: Princeton, 1973. [Google Scholar]
- Poole, A.; Ball, L. J. Ghaoui, C., Ed.; Eye Tracking in HCI and Usability Research. In Encyclopedia of Human-Computer Interaction; Idea Group: Pennsylvania, 2006; pp. 211–219. [Google Scholar]
- Ramanauskas, N. Calibration of videooculographical eye-tracking system. Electronics and Electrical Engineering 2006, 8(72), 65–68. [Google Scholar]
- Rayner, K. Eye movement in reading and information processing: 20 years of research. Psychological Bulletins 1998, 124(3), 372–422. [Google Scholar]
- Recarte, M. A.; Pérez, E.; Conchillo, A.; Nunes, L.M. Mental Workload and Visual Impairment: Differences between Pupil, Blink, and Subjective Rating. The Spanish Journal of Psychology 2008, 11(2), 374–385. [Google Scholar] [PubMed]
- Rosch, J. L.; Vogel-Walcutt, J. J. A review of eye-tracking applications as tools for training. Cognition, Technology & Work 2013, 15(3), 313–327. [Google Scholar]
- Schaefer, T. M.; Schaefer, A. R.; Abib, F. C.; José, N. K. Comparative study of the blinking time between young adult and adult video display terminal users in indoor environment. Arquivos Brasileiros de Oftalmologia 2009, 72(5), 682–686. [Google Scholar] [CrossRef]
- Steinman, R. M. Chalupa, L. M., Werner, J. S., Eds.; Gaze control under natural conditions. In The Visual Neurosciences; MIT Press: Cambridge, 2004; pp. 1339–1356. [Google Scholar]
- Stern, J.A.; Boyer, D.J.; Schroeder, D. Blink rate: A possible measure of fatigue. Human Factors 1994, 36(2), 285–297. [Google Scholar]
- Soluch, P.; Tarnowski, A. O metodologii badań eyetrackingowych. Lingwistyka Stosowana 7 2013, 115–134. [Google Scholar]
- Suppes, E.; Cohen, M.; Laddaga, R.; Anliker, J.; Floyd, R. A procedural theory of eye movements in doing arithmetic. Journal of Mathematical Psychology 1983, 27, 341–369. [Google Scholar] [CrossRef]
- Susac, A.; Bubic, A.; Kaponja, J.; Planinic, M.; Palmovic, M. Eye movements reveal students’ strategies in simple equation solving. International Journal of Science and Mathematics Education 2014, 12(3), 555–577. [Google Scholar] [CrossRef]
- Sweller, J. Cognitive load theory, learning difficulty and instructional design. Learning and Instruction 1994, 4, 293–312. [Google Scholar]
- Stolińska, A.; Andrzejewska, M.; Błasiak, W.; Pęczkowski, P.; Rosiek, R.; Rożek, B.; Sajka, M.; Wcisło, D. Nodzyńska, M., Cieśla, P., Różowicz, K., Eds.; Analysis of saccadic eye movements of experts and novices when solving text tasks. In New Technologies in Science Education; Wydawnictwo Naukowe Uniwersytetu Pedagogicznego: Kraków, 2014; pp. 21–29. [Google Scholar]
- Tai, R.H.; Loehr, J.F.; Brigham, F.J. An exploration of the use of eye-gaze tracking to study problem-solving on standardized science assessments. International Journal of Research & Method in Education 2006, 29(2), 185–208. [Google Scholar]
- Tanaka, Y.; Yamaoka, K. Blink activity and task difficulty. Perceptual and Moto Skills 1993, 77(1), 55–66. [Google Scholar]
- Tsai, Y-F.; Viirre, E.; Strychacz, C.; Chase, B.; Jung, T-P. Task performance and eye activity: Predicting behavior relating to cognitive workload. Aviation, Space, and Environmental Medicine 2007, 78(5), B176–B185. [Google Scholar] [PubMed]
- Young, M.S.; Stanton, N.A. Karwowski, W., Ed.; Mental workload: Theory, measurement, and application. In International encyclopedia of ergonomics and human factors: Volume; Taylor & Francis: London, 2001; Volume 1, pp. 507–509. [Google Scholar]
- Veltman, J.A.; Gaillard, A.W.K. Physiological workload reactions to increasing levels of task difficulty. Ergonomics 1998, 41, 656–669. [Google Scholar] [PubMed]
- Verschaffel, L.; De Corte, E.; Pauwels, A. Solving compare problems: An eye movement test of Lewis and Mayer’s consistency hypothesis. Journal of Educational Psychology 1992, 84, 85–94. [Google Scholar]
Copyright © 2015. This article is licensed under a Creative Commons Attribution 4.0 International License.