Introduction
Web pages are typically made up with visual elements such as menus, headers and footers. These elements allow users to complete their tasks. For example, users can navigate within web pages by using the menus. In order to investigate how users interact with these visual elements, many researchers (i.e., academic/usability researchers and usability evaluators) prefer to conduct eye tracking studies. These studies reveal which visual elements are fixated and which paths are followed (Holsanova, Rahm, & Holmqvist, 2006; Yesilada, Jay, Stevens, & Harper, 2008; Albanesi, Gatti, Porta, & Ravarelli, 2011; Hejmady & Narayanan, 2012; Eraslan, Yesilada, & Harper, 2014). For example, Gossen, Hö bel, and Nü rnberger (2014) conducted an eye tracking study and investigated how children interact with search engines. Their findings illustrate that children typically experience difficulties in estimating the relevancy of a search result. Therefore, they suggest that search engines should be improved to support children to find the most relevant results.
Eye tracking studies supplement other usability methods, especially the Retrospective Think Aloud method where users are asked to verbalise their performance after they complete their tasks (Guan, Lee, Cuddihy, & Ramey, 2006). A study conducted by Guan et al. (2006) illustrates that when users encounter difficulties in completing their tasks, they verbalise their performance at a very abstract level. Hence, when users are asked to complete more complicated tasks, scanpath analysis becomes more crucial to understand their real performance. Besides this, scanpath analysis is likely to be more valuable for exploratory tasks in comparison with goal-directed tasks. For goaldirected tasks, various metrics can be used, such as the task completion time. However, there is no specific goal in exploratory tasks, thus researchers can benefit from scanpath analysis to understand how users explore web pages. Groner, Siegenthaler, Raess, Wurtz, and Bergamin (2009) propose a multifunctional usability analysis approach that consists of eye gaze analysis, verbal reports, log file analysis, retrospective interviews and performance characteristics (such as failure and success). They applied their approach to an eLearning module of the Moodle learning management system (
http://moodle.com) to investigate how users interact with the module. Their findings suggest that users experience difficulties in navigating the module because of a large amount of visual information on a page. To improve the navigation, they suggest to include less information on the start page and provide a table of contents that gives a direct access to other parts.
When users read web pages, their eyes become relatively stable at certain points which are referred to as fixations. A series of fixations represent their scanpaths on the web pages.
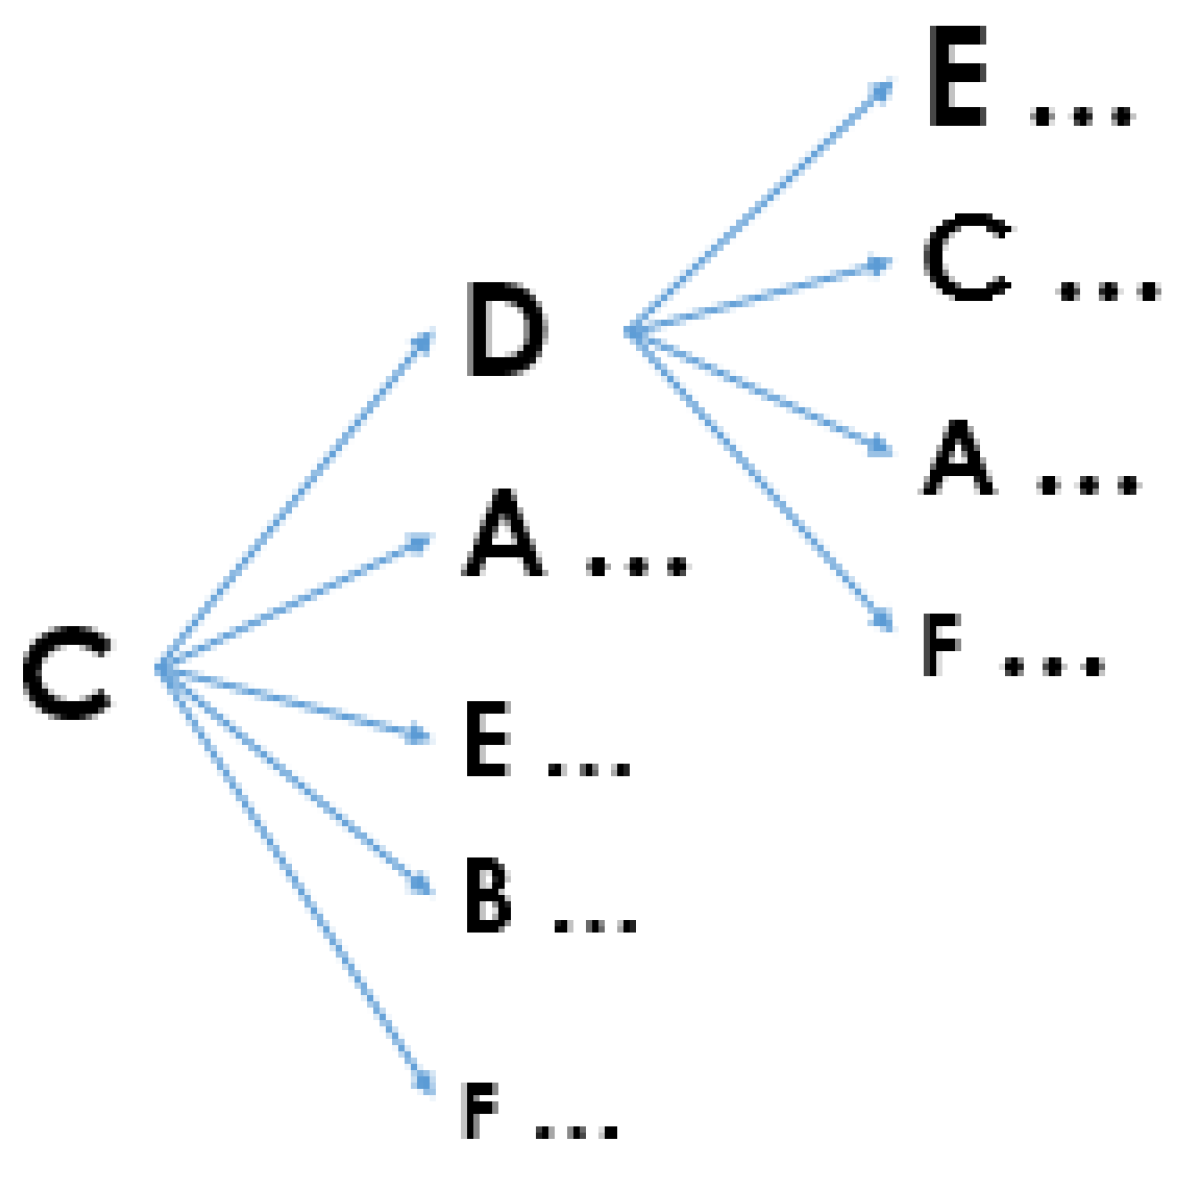
Figure 1 shows an example of a scanpath of a particular user on the HCW Travel web page which is segmented into its visual elements (Brown, Jay, & Harper, 2012; Akpinar & Yeşilada, 2013). As can be seen from this figure, fixations are illustrated with circles where larger circles are used for longer fixations. The user here fixated the visual elements B, D, C and E respectively. Therefore, the scanpath is represented as BDCE.
The scanpath theory of Noton and Stark (1971a, 1971b) suggests that a user establishes his or her own scanpath on the first visit to a visual stimulus and then follows the same scanpath, with some variations, on the following visits to the visual stimulus. It also suggests that the scanpaths are not similar between different users on a particular visual stimulus, and between different visual stimuli for a particular user. As web pages are repeatedly visited visual stimuli, both Josephson and Holmes (2002) and Burmester and Mast (2010) tested this theory with web pages. However, they recognised that the scanpath theory could not be fully supported on web pages. In particular, they recognised that the users typically followed various scanpaths on a particular web page instead of a single scanpath as suggested by the scanpath theory. Josephson and Holmes (2002) also recognised many cases where the most similar scanpaths on a particular web page were from different users instead of the same user. The scanpaths can also be affected by user tasks and different individual factors, such as a gender and user expertise (Eraslan & Yesilada, 2015; Underwood, Humphrey, & Foulsham, 2008).
A number of techniques have been suggested in the literature to visualise user scanpaths for analysing them in an exploratory and qualitative way (Räihä, Aula, Majaranta, Rantala, & Koivunen, 2005; Blascheck et al., 2014). These techniques have already been comprehensively reviewed by Blascheck et al. (2014). Apart from the scanpath visualisation techniques, there are also different techniques that could be applicable to eye tracking data for analysing user scanpaths, which are correlated with visual elements of web pages, in a more detailed way. These techniques can typically be used for calculating a similarity/dissimilarity between a pair of scanpaths, computing transition probabilities between visual elements, detecting patterns within given scanpaths and identifying a common scanpath for multiple scanpaths. To make the best use of available data, researchers should select an appropriate technique for their studies. At this point, it is crucial for them to know the strengths and limitations of these techniques. This article, therefore, initially explains how these techniques work. It then provides an analysis and critical evaluation of their strengths and weaknesses supported by data from an eye tracking study.
Although there are several review articles in this field, they mainly focus on a specific set of techniques which can be used for a particular objective, for example, techniques to compare two scanpaths (Le Meur & Baccino, 2013; Anderson, Anderson, Kingstone, & Bischof, 2014). Additionally, some of these techniques are summarised in the related work sections of existing publications (Duchowski et al., 2010; Mast & Burmester, 2011). Furthermore, Holmqvist et al. (2011) published a book on eye tracking methodologies which also introduced some of these techniques.
To the best of the authors’ knowledge, this article is the most comprehensive review and analysis of the techniques which can be used to compare and correlate (i.e., computing transition probabilities between visual elements, finding patterns, identifying common scanpaths, etc.) not only two scanpaths but also more than two scanpaths. It makes a contribution to eye tracking research on the web by guiding researchers to choose an appropriate technique and revealing some directions to address the limitations.
In order to investigate both the strengths and limitations of these techniques, we evaluated them with an eye tracking dataset from a study conducted with twelve users by Brown et al. (2012). We then criticised the techniques based on the results, this meant we used a data-driven approach to investigate, compare and contrast the techniques.
Scanpath analysis is relevant to all studies with the aim of analysing sequential patterns on visual stimuli. Specifically, it can be used for investigating the differences between the sequential patterns of different user groups on web pages, such as male and female groups (Eraslan & Yesilada, 2015). In addition, it can be conducted for recognising the search efficiency of users. For example, longer scanpaths can be interpreted as less efficient searching (Ehmke & Wilson, 2007). Scanpaths can also be analysed to identify common sequential patterns that can be used for different objectives. In particular, common patterns can be a guide to re-engineering web pages to make them more accessible on small screen devices by allowing users to directly access firstly visited visual elements without a lot of scrolling and zooming (Akpınar & Yeşilada, 2015).
The remainder of this article firstly explains our methodology to evaluate the scanpath analysis techniques, secondly revisits them along with their strengths and limitations based on our evaluation, and finally discusses and criticises the techniques to provide some directions to address their limitations.
Methodology
In order to investigate both the strengths and limitations of the scanpath analysis techniques on web pages, we decided to evaluate them with a third-party eye tracking dataset. In other words, we decided to use a dataset that was not previously used to evaluate any of these techniques. In addition, the data was not originally collected for this purpose. Therefore, in this article, we re-evaluated the techniques with the same dataset. This made the evaluation more objective to compare and contrast the techniques.
We unfortunately could not evaluate three of these techniques as highlighted in Table 2.
ScanMatch technique works with a grid-layout page segmentation by default (see Figure 2) (Cristino, Mathôt, Theeuwes, & Gilchrist, 2010). It also allows to apply another type of segmentation by associating each pixel to a particular segment. However, there may be some spaces between segments (see
Figure 1). In other words, some pixels may not be associated with a particular segment. Because of this limitation of
ScanMatch technique, it could not be applied to the dataset. Besides this, the T-Pattern Detection technique is not publicly available, and therefore it could not be applied to the dataset (Magnusson, 2000). As the Multiple Sequence Alignment technique is described at a very abstract level with the lack of details, it could also not be applied the dataset (Hembrooke, Feusner, & Gay, 2006). However, we still analyse these techniques based on their given descriptions.
Dataset
As also stated by Shen and Zhao (2014), there is no publicly available eye tracking dataset on real web pages. Although we also asked some other researchers in related fields (
chi-web@listserv.acm.org) whether they have eye tracking datasets to share with us, we could not find any appropriate dataset. Fortunately, we have an eye tracking dataset from a study conducted by Brown et al. (2012) in March 2010. They are members of our Interaction Analysis and Modelling Lab at the University of Manchester. This study aimed to investigate how users interact with dynamic content on web pages. In this study, the participants sat in front of a 17” monitor with a built-in Tobii x50 eye tracker and the screen resolution of 1280 × 1024. The HCW Travel web page (see
Figure 1) was shown to the participants and their eye movements were recorded.
The participants were asked to read the latest news from the HCW Travel Company and then click on the link for the special offers. This meant they required to fixate certain visual elements on the web page in a particular order. Specifically, they needed to fixate the element E that includes the latest news, and then fixate the element D that contains the link to see the special offers. Since the latest news were shown next to the Latest News title and the link for the special offers was labelled as Special Offers, the participants could find the related visual elements by only scanning the web page. Twelve people participated in the eye tracking study.
These were students and staff at the University of Manchester ranging between the ages of 18 and 45. We noticed some problems with the results of the eye tracking recordings for two participants as they were distracted, and therefore we had to eliminate their data from our evaluation process. Although the sample size is small in this eye tracking study, it is still good enough in illustrating the strengths and weaknesses of the scanpath analysis techniques. Having small dataset is even better in clearly explaining how these techniques work and comparing them.
Visual Elements
In our evaluation, we used the extended and improved version of the
Vision Based
Page
Segmentation (VIPS) algorithm (
http://www.eclipse.org/actf/downloads/tools/eMine/build.php) to segment the HCW Travel web page into its visual elements because it automatically discovers visual elements and correlates them with the underlying source code which is important for further processing of web pages (Akpinar & Yeşilada, 2013). In particular, when scanpaths are correlated with these visual elements, they can then be used for the purpose of re-engineering of web pages (Yesilada, Harper, & Eraslan, 2013).
The VIPS algorithm segments web pages based on the selected segmentation level where smaller visual elements are identified with higher levels. As the 5th level was determined as the most successful level with approximately 74% user satisfaction, we used the 5th level for our evaluation (Akpinar & Yeşilada, 2013).
User Scanpaths in Terms of Visual Elements
Once the visual elements were discovered, we exported the eye tracking data of the ten users and correlated their fixations with the visual elements to construct their individual scanpaths in terms of the visual elements. To achieve this, we used the width, height, x and y coordinates of the visual elements and the x and y coordinates of the fixations. We then simplified the individual scanpaths by abstracting consecutive repetitions as stated in the literature (Brandt & Stark, 1997; Jarodzka, Holmqvist, & Nyströ m, 2010). For example, AABBBCC becomes ABC after the abstraction.
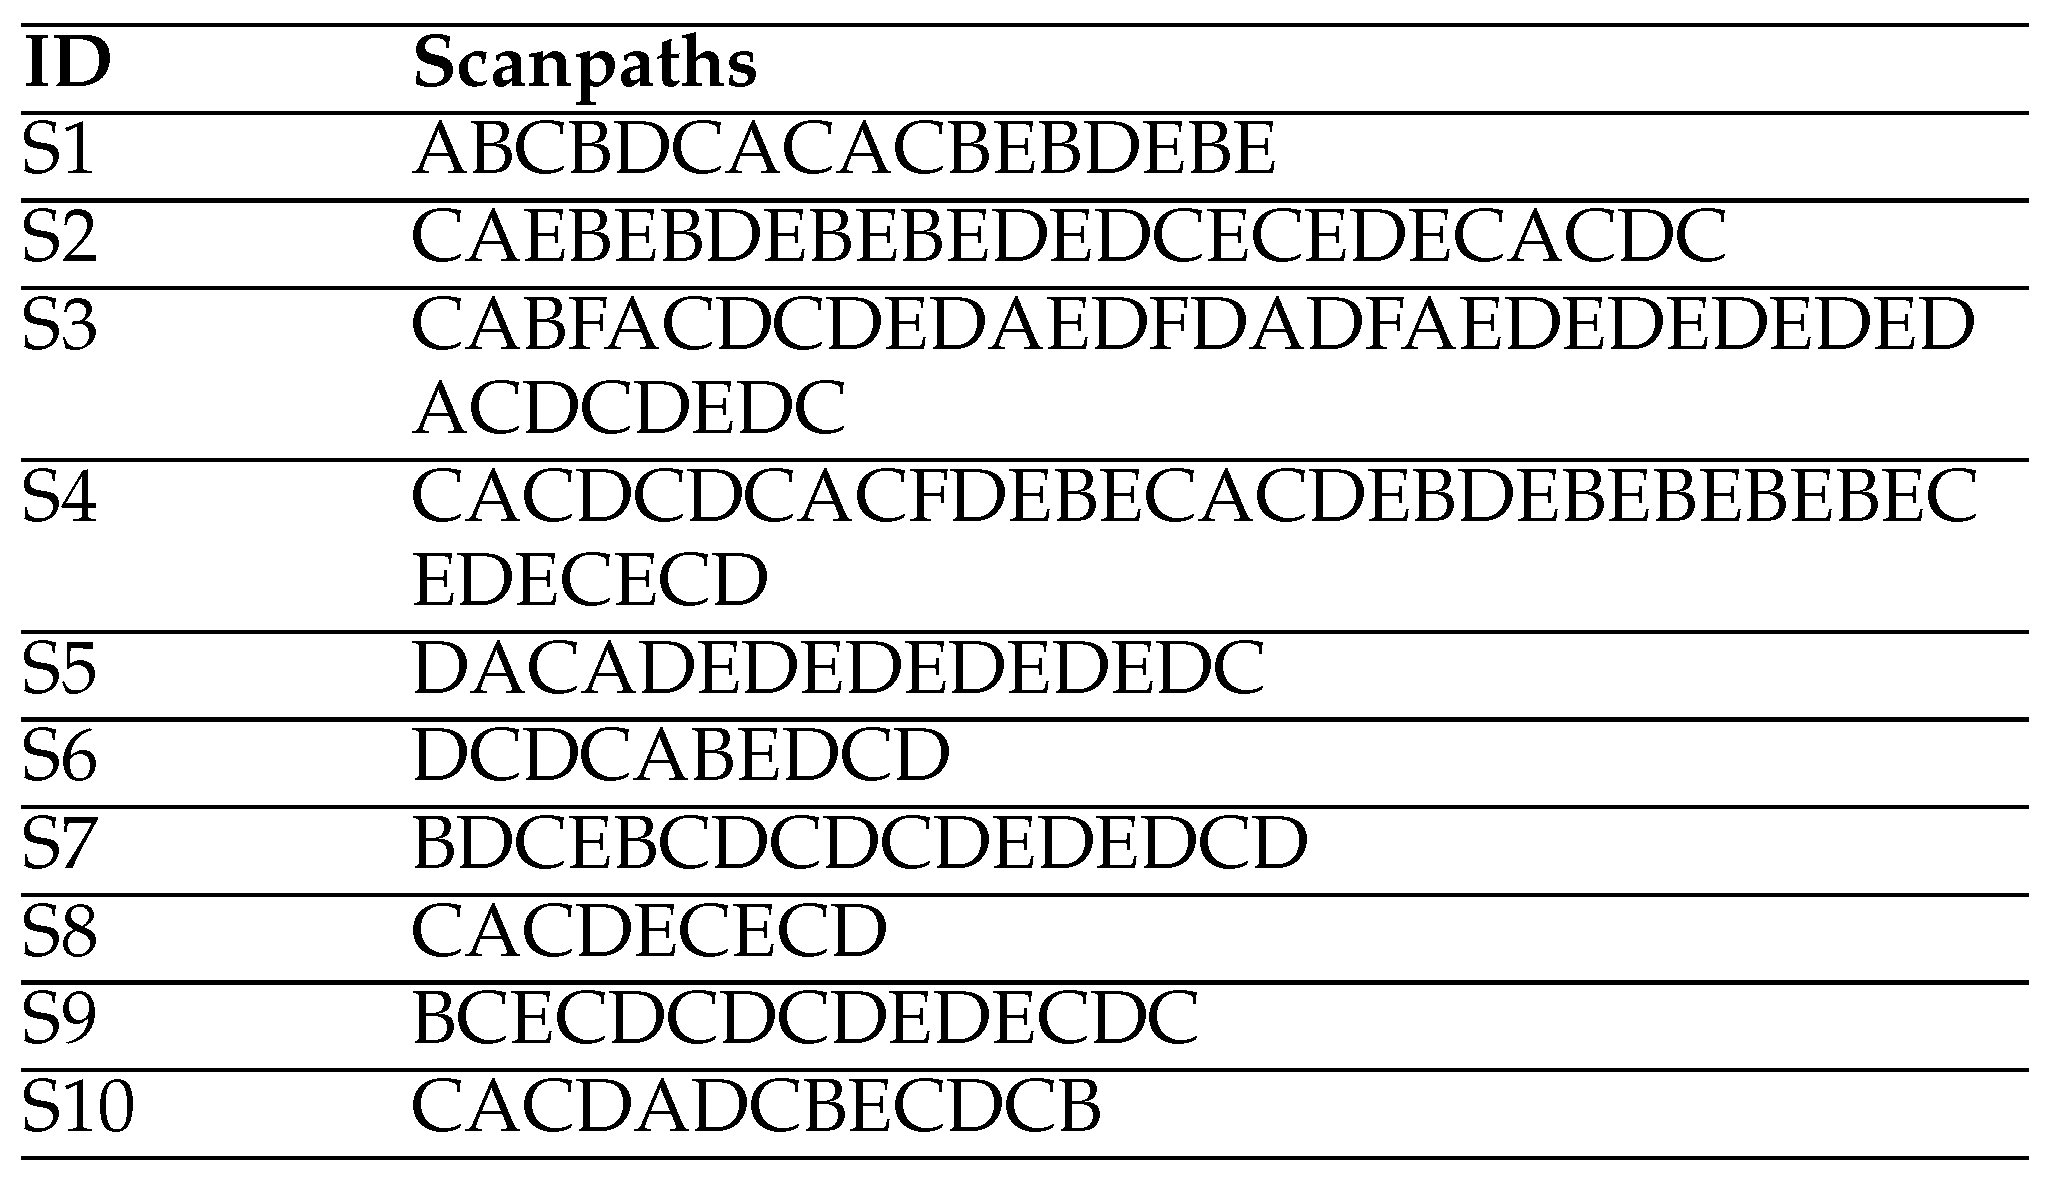
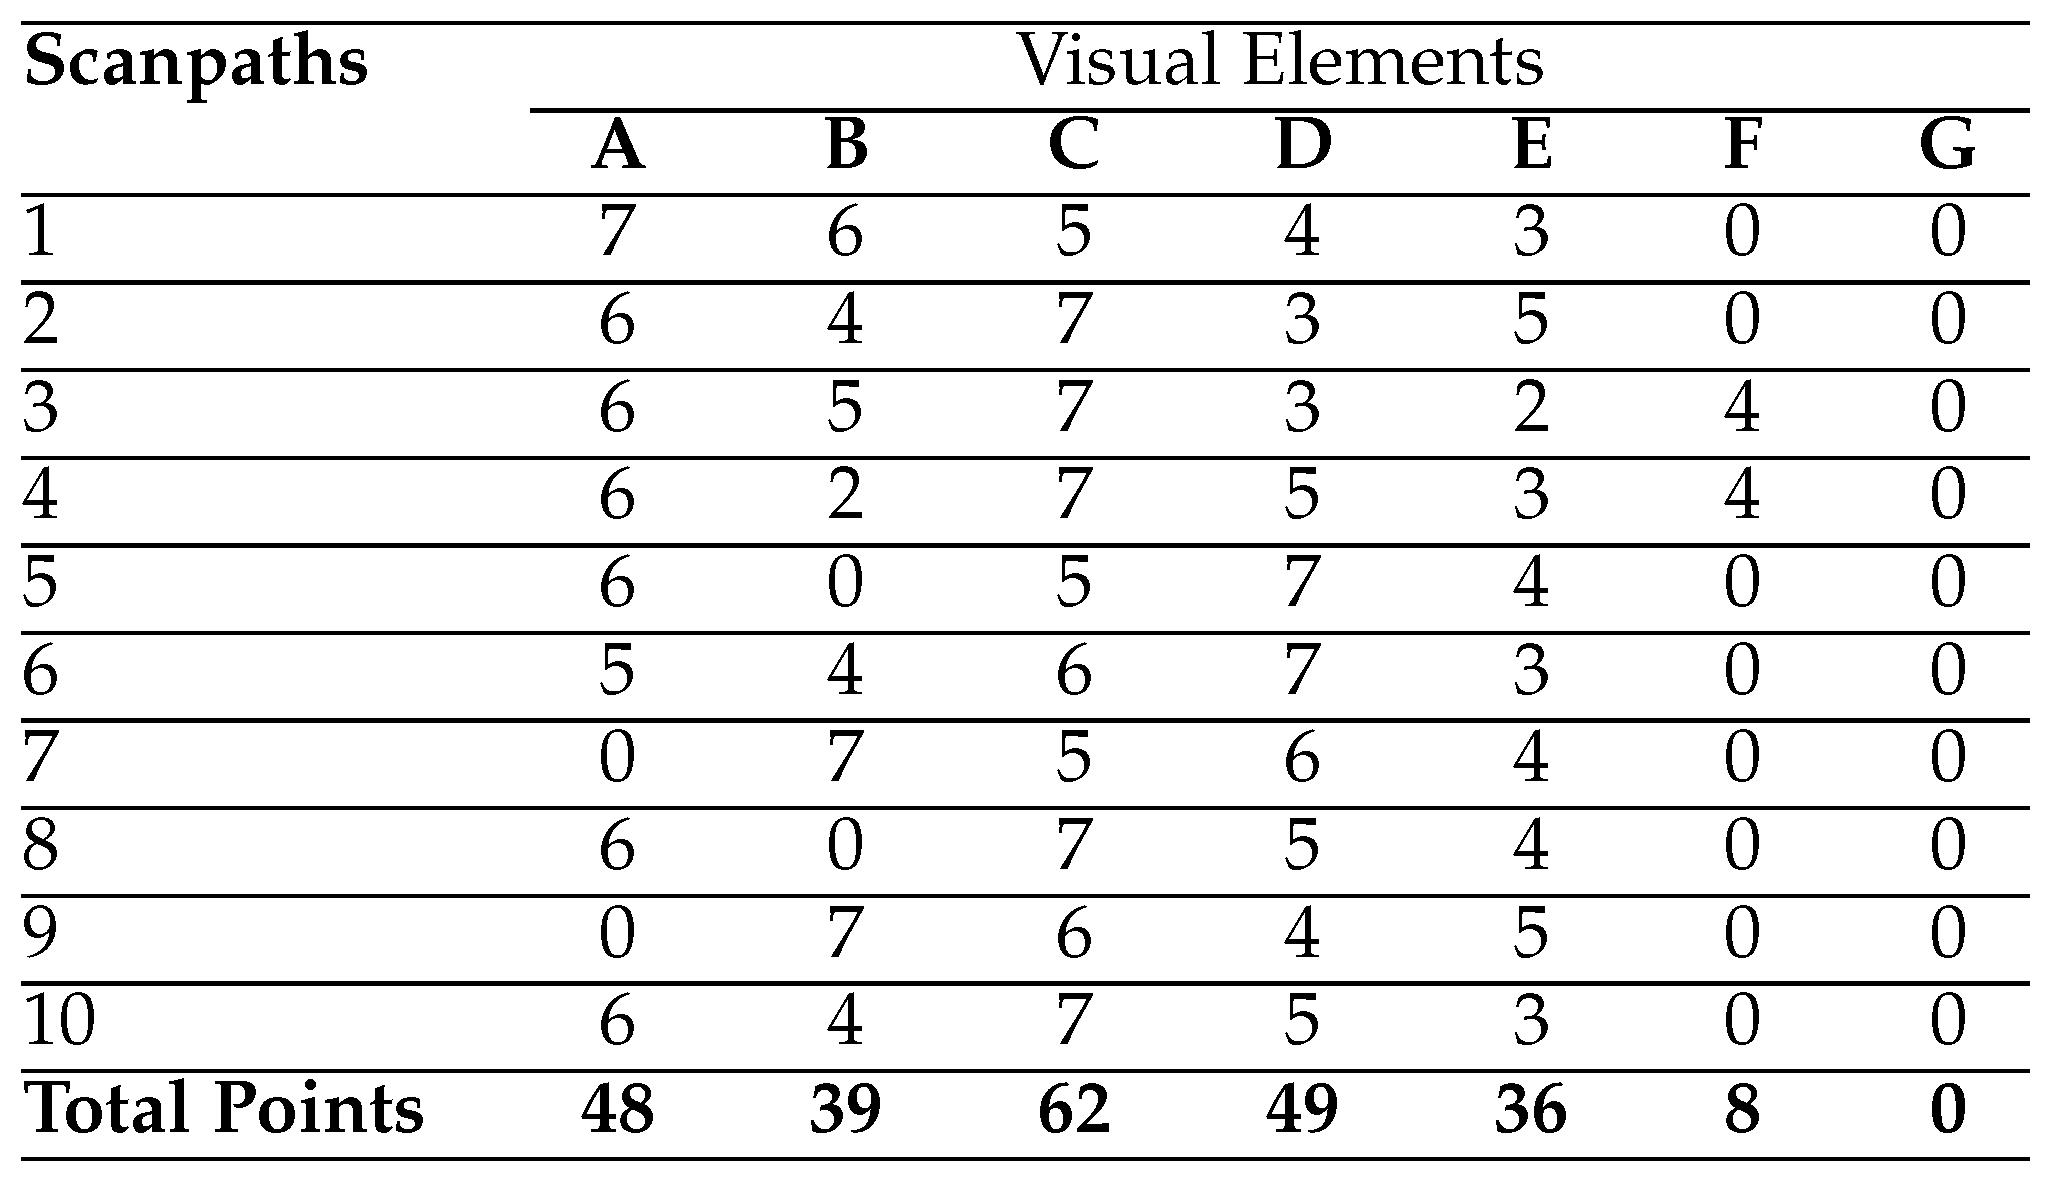
These ten individual scanpaths on the HCW Travel web page are listed in
Table 1 (Yesilada et al., 2013; Eraslan, Yeşilada, & Harper, 2013). As can be seen from the table, the participants followed slightly different paths to complete their tasks. For instance, the third and fourth participants fixated more visual elements to complete their tasks in comparison with the participants six and eight (Yesilada et al., 2013).
When the individual scanpaths were ready, we evaluated the scanpath analysis techniques with them. The following section revisits the techniques along with their strengths and limitations based on our evaluation.
Scanpath Analysis Techniques
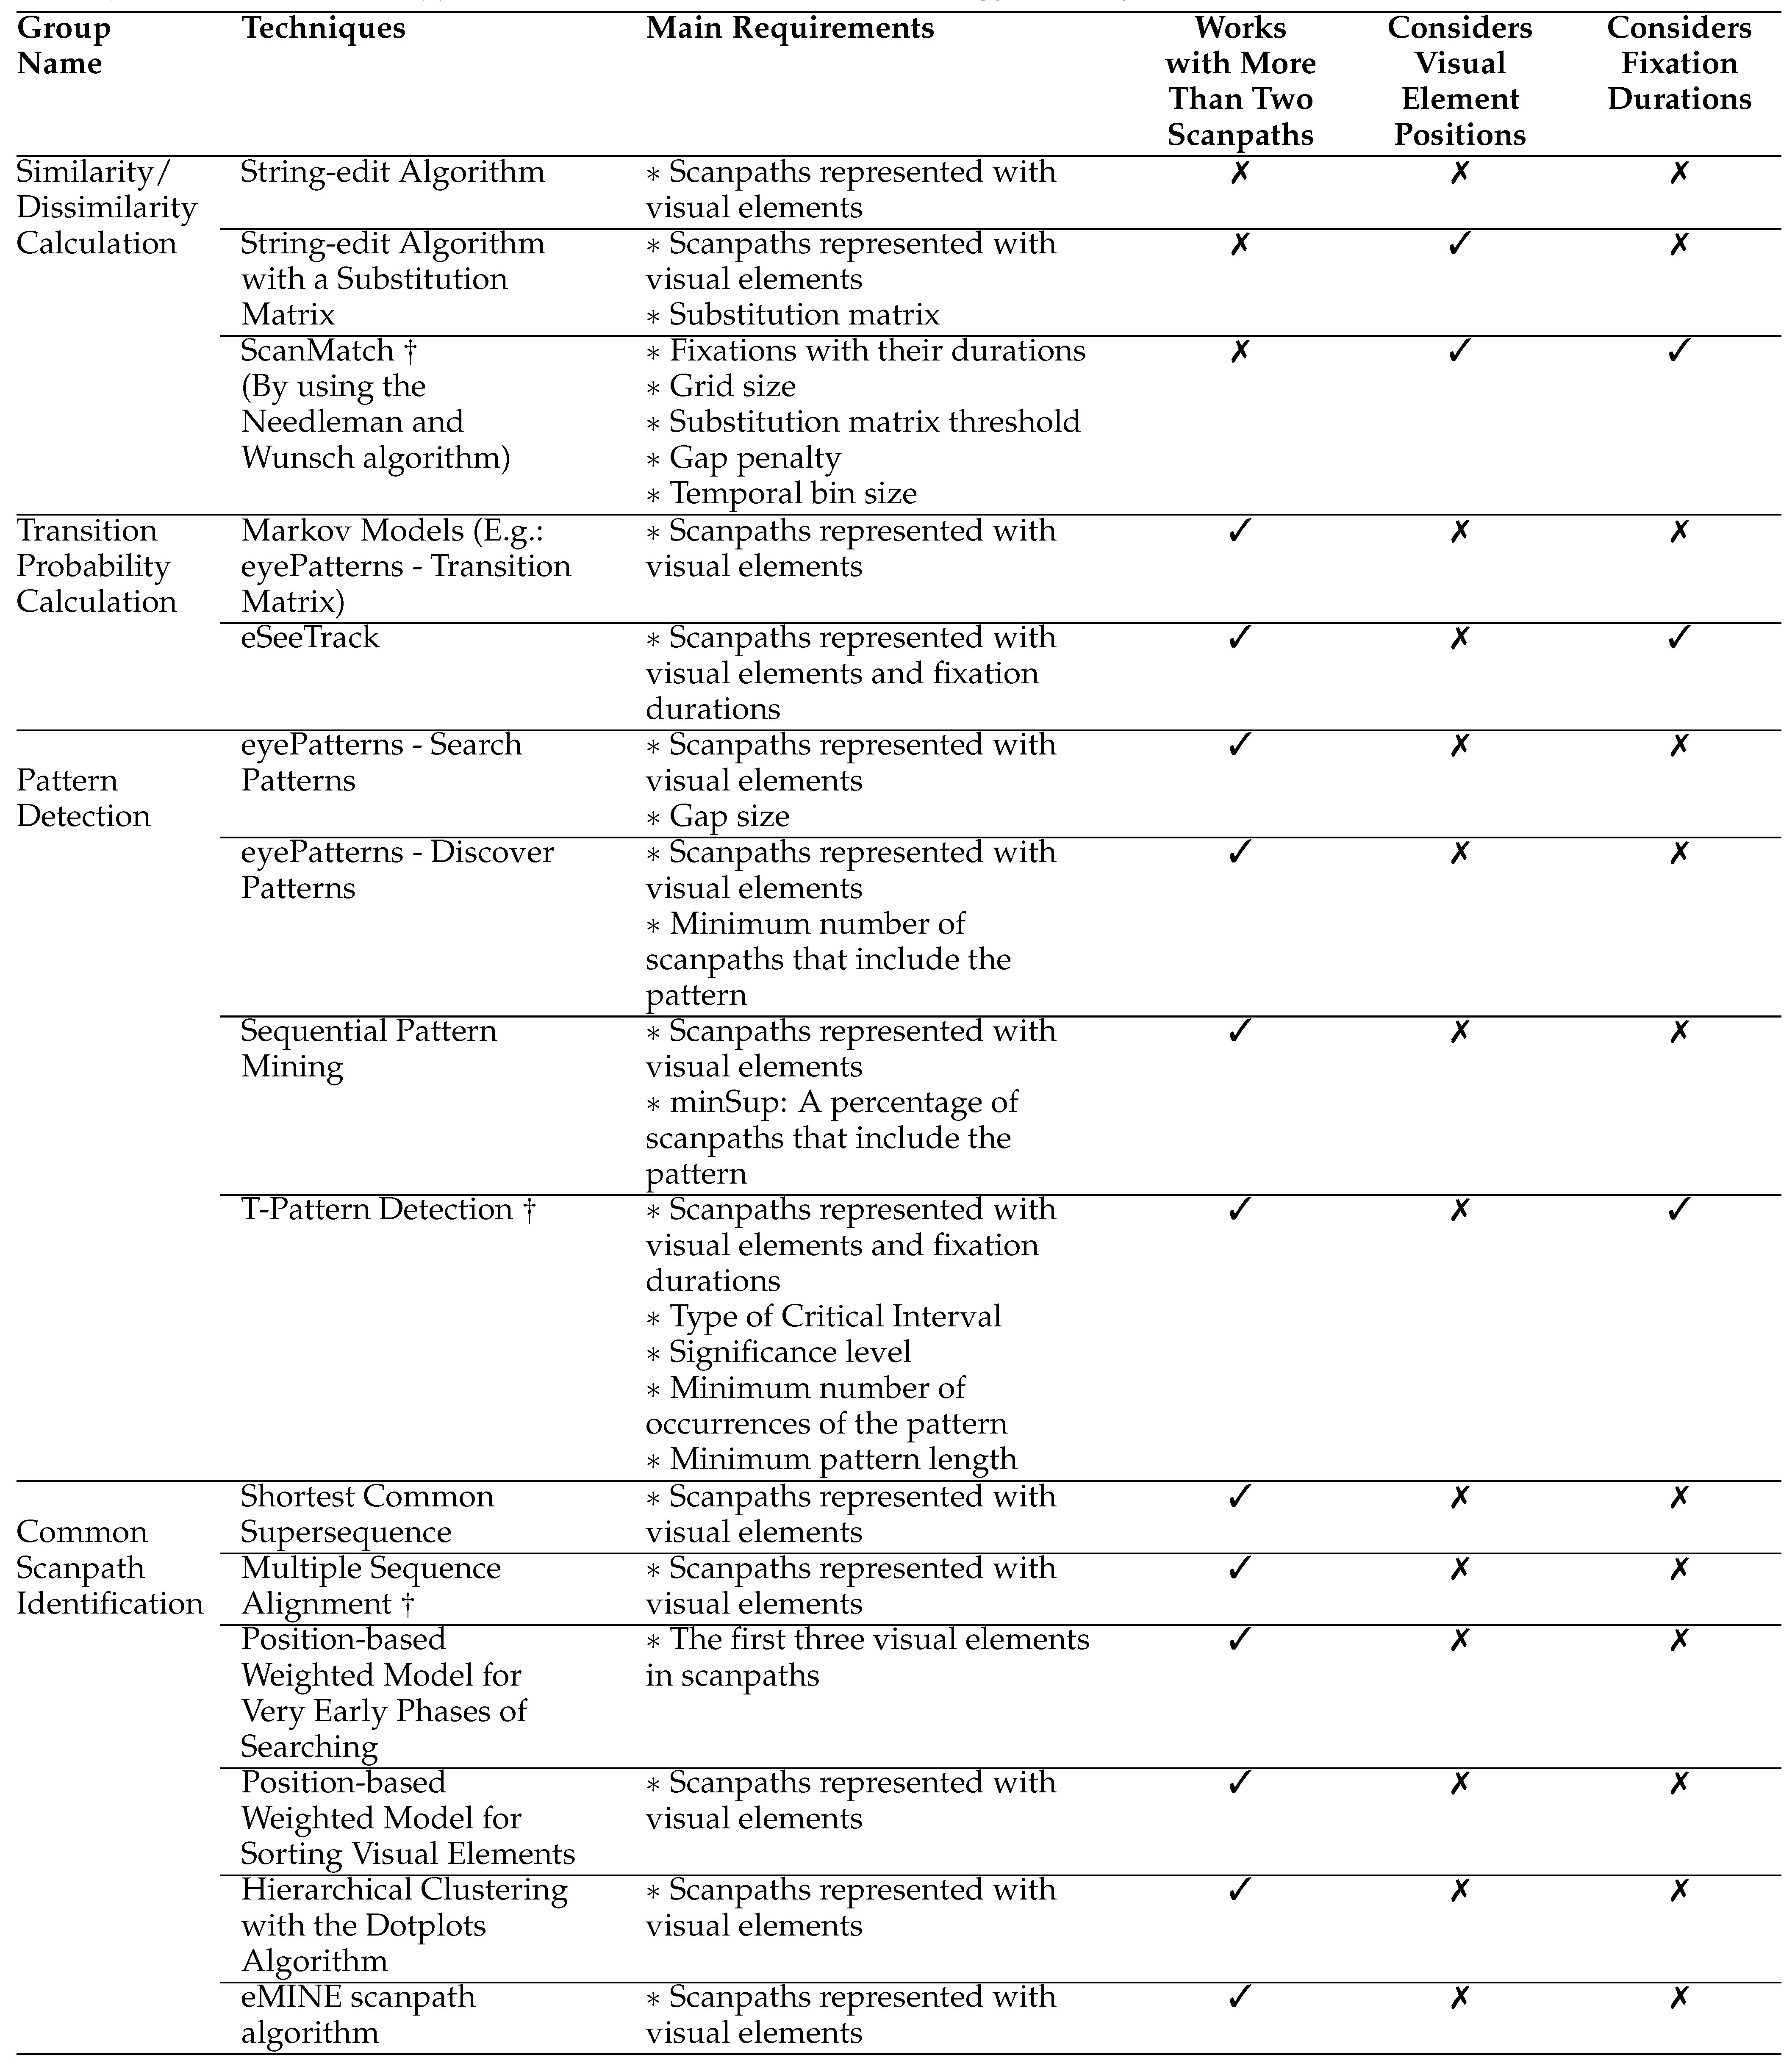
In this article, we classify the scanpath analysis techniques into four main groups according to their goals. These groups are as follows: (1) Similarity/Dissimilarity Calculation, (2) Transition Probability Calculation, (3) Pattern Detection and (4) Common Scanpath Identification.
Table 2 shows an overview of this classification. Specifically, the table represents the groups along with their techniques. For example, it represents that
eMINE scanpath algorithm belongs to the group of common scanpath identification (Eraslan et al., 2014). The techniques within the same group mainly have the same goal but not necessary to have the same analysis approach. In particular, in the common scanpath identification group, one approach suggests to apply a hierarchical clustering with the Dotplots algorithm (Goldberg & Helfman, 2010) whereas another approach (
eMINE scanpath algorithm) suggests to use the String-edit algorithm and the Longest Common Subsequence technique together for a hierarchical clustering (Eraslan et al., 2014). In addition, Table 2 shows the main requirements for each technique to be able to run them. For example,
eMINE scanpath algorithm only requires a number of scanpaths that are represented in terms of visual elements.
Table 2 also shows whether or not the techniques can work with more than two scanpaths at the same time. As shown in the table, the scanpath analysis techniques are typically designed to produce results for more than two scanpaths, except of the techniques from the similarity/dissimilarity calculation group. In that group, the techniques work in a pairwise manner which means they can work with only two scanpaths at the same time. Moreover,
Table 2 illustrates if the techniques consider fixation durations and the positions of visual elements on web pages. Most of the techniques tend to ignore fixation durations while analysing scanpaths. However, it is widely accepted that fixation duration is associated with the depth of processing and the ease or difficulty of information processing (Velichkovsky, Rothert, Kopf, Dornhö fer, & Joos, 2002; Follet, Meur, & Baccino, 2011). Furthermore, they usually do not consider the positions of visual elements on web pages. However, eye movement lengths are shorter between close visual elements in comparison with the visual elements which are distant from each other.
There are also a number of techniques with a reductionist approach. In this context, we refer to the reductionism as an oversimplification of multiple scanpaths with the loss of some important information. Thus, the reductionism is associated with detecting patterns and identifying common scanpaths. We articulate the reductionism as follows: (1) When an algorithm is likely to lose a shared visual element because of its position in individual scanpaths, it is classified as reductionist. (2) When an algorithm is intolerant of small deviations within individual scanpaths (especially, ignoring the visual element fixated by the majority), it is also classified as reductionist.
This section revisits and investigates all of these techniques in depth based on our evaluation.
Similarity/Dissimilarity Calculation
A number of techniques are available to compare two scanpaths to determine a similarity or dissimilarity between two scanpaths. These techniques are as follows: the String-edit algorithm (Heminghous & Duchowski, 2006), the String-edit algorithm with a substitution matrix (Takeuchi & Habuchi, 2007), and ScanMatch technique (Cristino et al., 2010). As these techniques do not focus on generating common scanpaths, the reductionism is not applicable for this group.
String-edit Algorithm. The Levenshtein Distance algorithm, which is commonly known as the String-edit algorithm, has been widely used for comparing a pair of scanpaths represented in a string format (Privitera & Stark, 2000; Josephson & Holmes, 2002; Pan et al., 2004; Heminghous & Duchowski, 2006; Underwood et al., 2008; Duchowski et al., 2010; Eraslan et al., 2014; Eraslan & Yesilada, 2015). When user scanpaths are correlated with visual elements of web pages, they are represented in a string format. Therefore, this algorithm can be applied to calculate the distance (i.e., dissimilarity) between two scanpaths by transforming one of them to another with a minimum number of editing operations which are referred to as insertion, deletion and substitution. The minimum number of operations represent the distance between the scanpaths. Albeit the String-edit algorithm is designed to compare a pair of scanpaths, it can be applied to more than two scanpaths in a pairwise manner. Therefore, the most similar scanpaths to a particular scanpath can be identified.
Equation 1 mathematically formalises how to calculate the similarity between a pair of scanpaths as a percentage by using their String-edit distance (Underwood et al., 2008). First of all, the distance (
d) is divided by the length of the longer scanpath (
n) to calculate a normalised score for preventing any possible inconsistencies that can be caused by different lengths. The normalised score is then subtracted from one and finally multiplied by 100.
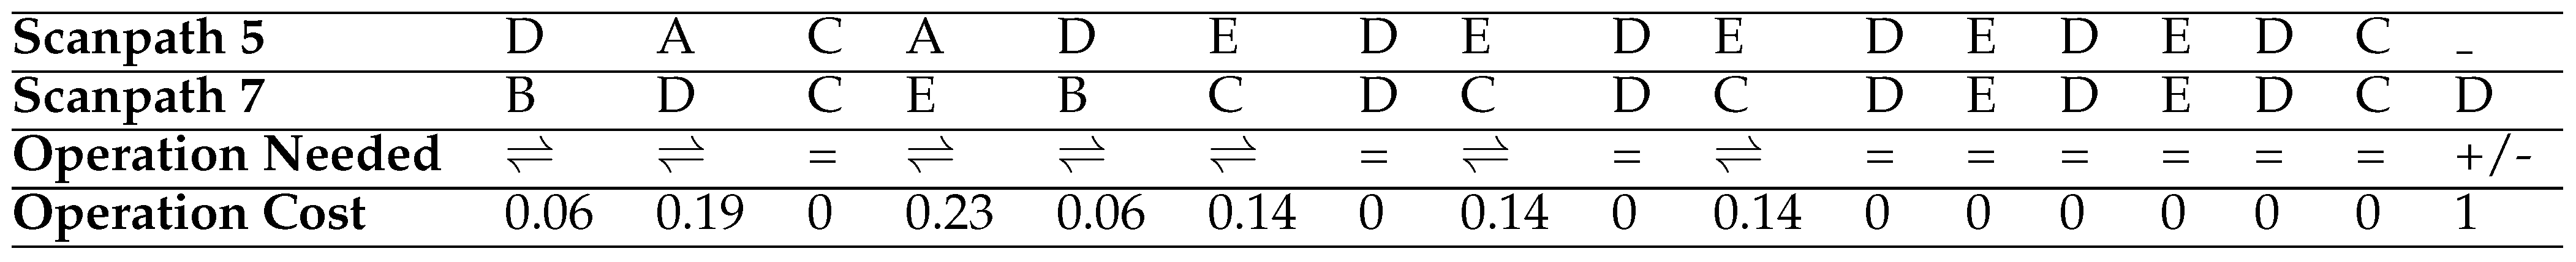
Table 3 illustrates how the String-edit algorithm works with the fifth and seventh scanpaths in
Table 1 and aligns them as an illustration. As seen from the example, 8 operations are required in total (1 insertion/deletion + 7 substitutions) to transform one to another. The distance therefore between these scanpaths is calculated as 8 by this algorithm.
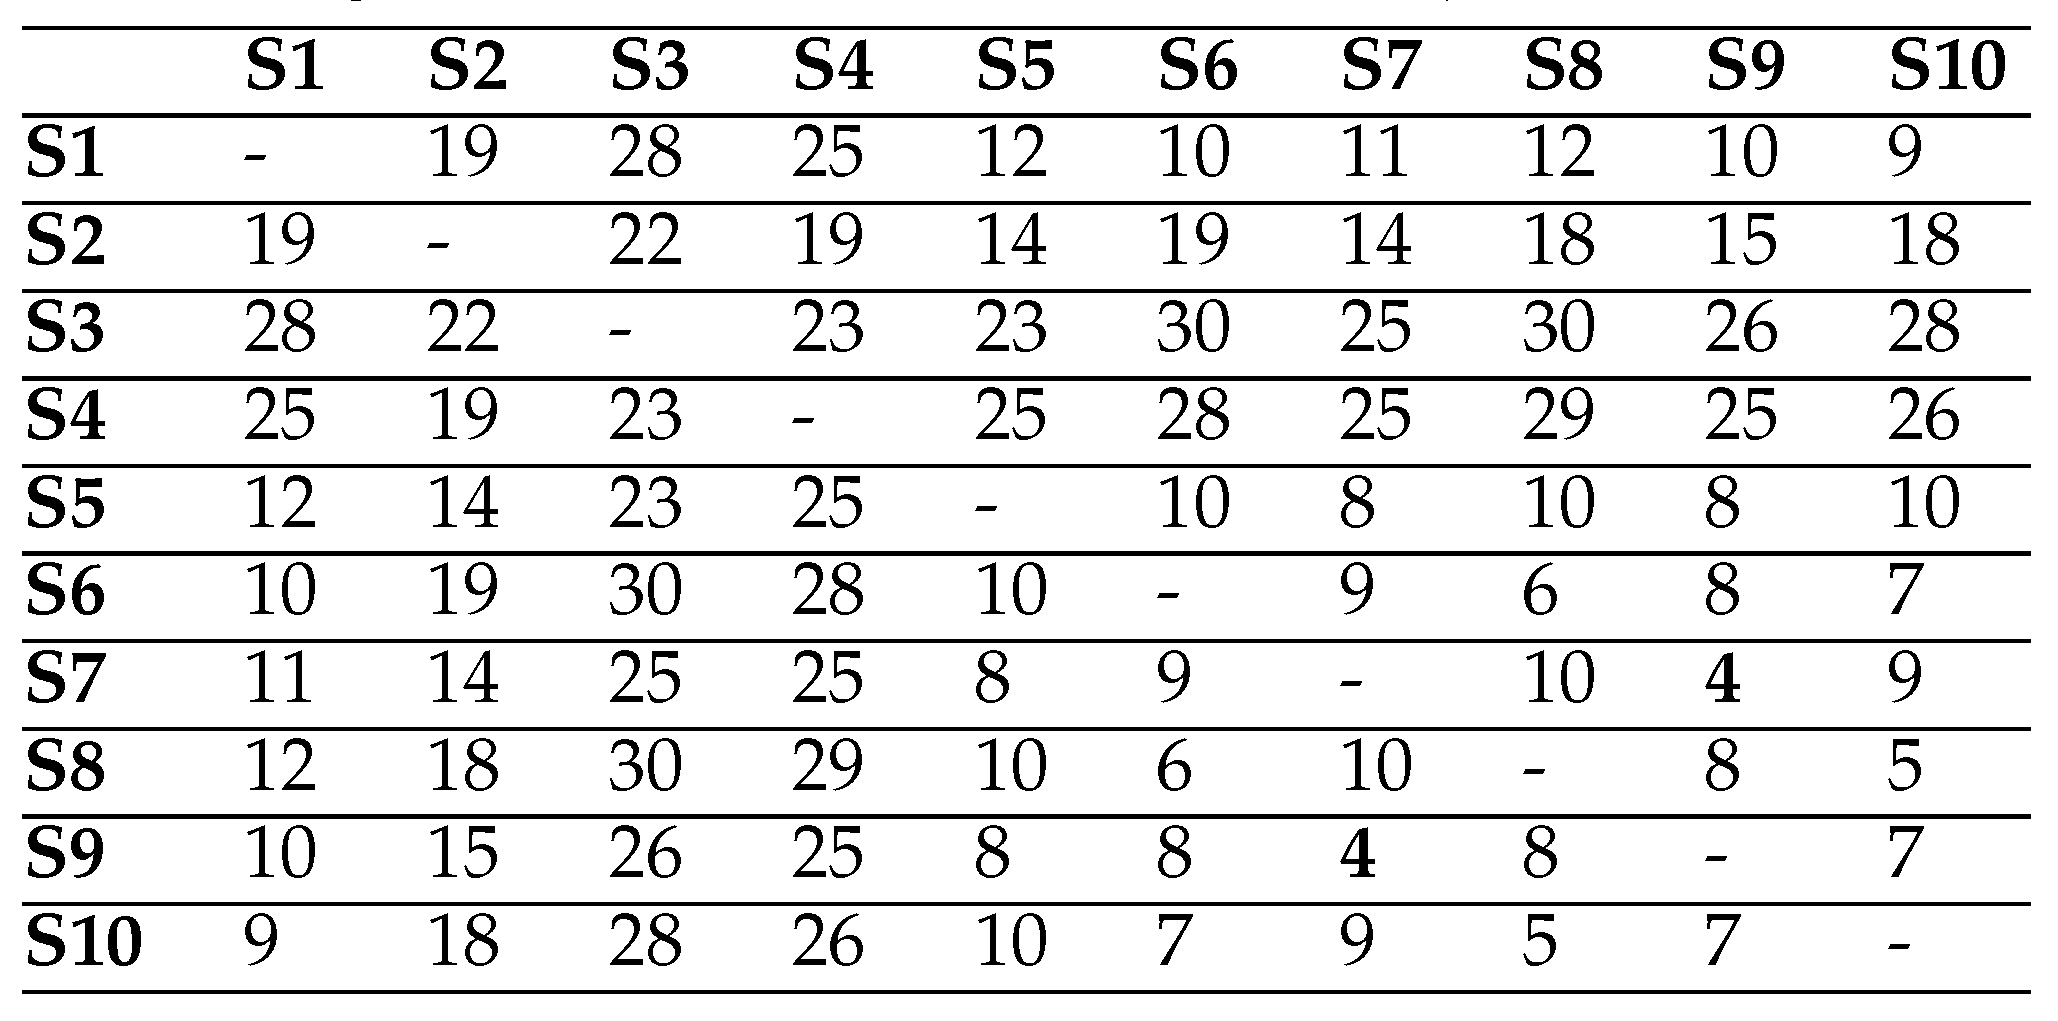
When the String-edit algorithm is applied to the scanpaths in
Table 1 with a pairwise manner, the matrix shown in
Table 4 is created which illustrates the distances between the scanpaths. According to this matrix, the most similar scanpaths are the seventh and ninth scanpaths because their distance (4) is the lowest in comparison to others.
As mentioned above, the similarity between two scanpaths based on the String-edit distance can be calculated as a percentage. For example, the distance is calculated as 8 between the two scanpaths in
Table 3. As the length of the longer scanpath is equal to 17, the distance is firstly divided by 17, and therefore the normalised score is calculated. When this score is subtracted from one and then multiplied by 100, the similarity between the scanpaths is calculated as 52.94%.
Even though the String-edit algorithm has been widely used and it can easily be applied to scanpaths, the algorithm has some important drawbacks. In particular, the algorithm does not consider fixation durations while it is calculating a distance between two scanpaths. Besides this, the algorithm does not consider the positions of visual elements on a web page. For example, the cost of substituting the element B with the element E is not different from the cost of substituting the element B with the element G on the HCW Travel web page. However, as can be seen from Figure 1, the element B and the element E are very close to each other whereas there are five different elements between the element B and the element G. It means that the eye movement between the element B and the element E is shorter than the eye movement between the element B and the element G.
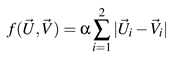
String-edit Algorithm with a Substitution Matrix. By default, the cost of all the operations used by the String-edit algorithm is equal to one. However, the substitution costs between visual elements may not be the same because they may be different in size and the geometrical distances between them can also vary. In other words, the substitution cost should be lower for closer visual elements because eye movements between those visual elements are shorter. To counteract with this, a number of different approaches have been suggested in the literature (Josephson & Holmes, 2002; Takeuchi & Habuchi, 2007). In particular, Takeuchi and Habuchi (2007) propose to use an Euclidean Distance or a City Block Distance to construct a substitution cost matrix. Equation 2 below illustrates the Euclidean Distance formula and Equation 3 shows the City Block Distance formula to calculate a substitution cost between two visual elements
and
where
and
are x and y coordinates of the centre of the visual element
and α is a type of normalisation parameter (Takeuchi & Habuchi, 2007). Takeuchi and Habuchi (2007) take this normalisation parameter as 0.001. The substitution costs between visual elements are calculated in a pairwise manner and then stored in a matrix. The substitution cost matrix can then be used with the String-edit algorithm.
When the Euclidean Distance is used to construct a substitution matrix for the HCW Travel web page, the matrix shown in
Table 6 is constructed. The matrix can then be used with the String-edit algorithm to calculate a distance between a pair of scanpaths on the HCW Travel web page by minimising the cost. Therefore, as illustrated in
Table 5, the distance (namely, the total operation cost) between the fifth and seventh scanpaths in
Table 1 is calculated as 1.96.
Albeit this version of the String-edit algorithm considers the positions of visual elements on a web page while it is determining a distance between a pair of scanpaths, it still does not consider fixation durations.
As stated above, the String-edit algorithm has been widely used in the literature. In particular, Heminghous and Duchowski (2006) developed an application with the String-edit algorithm called iComp. This application segments an image into its areas of interest (AoIs) by using fixation distribution over the image as suggested by Santella and DeCarlo (2004). Once the scanpaths are represented in terms of the AoIs, the application applies the String-edit algorithm to compare the scanpaths. Instead of automatic AoI detection, the evaluators and the users can also identify AoIs according to the evaluation goals or research questions (such as Holsanova et al. (2006)). Josephson and Holmes (2002) also used the String-edit algorithm to organise scanpaths into smaller groups based on their similarities between each other. Furthermore, Underwood et al. (2008) investigated the differences between expert and novice users while they were viewing the visual stimuli in the context of Engineering and Civil War by using the String-edit algorithm.
ScanMatch. Instead of calculating the distance between two scanpaths, Cristino et al. (2010) use the Needleman and Wunsch algorithm to directly calculate the similarity between two scanpaths by using a substitution cost matrix and a gap penalty. They call their approach
ScanMatch (
http://seis.bris.ac.uk/˜psidg/ScanMatch/). In this approach, the substitution costs are inversely related to the Euclidian distance where the lowest cost is assigned to a pair of visual elements that are the farthest from each other. In addition, there is a threshold value that represents the cut-off point for determining whether the substitution cost is positive or negative. The threshold value can be adjusted to ensure that the alignment is only applied to visual elements within the variability of the saccade amplitudes. The gap penalty can also be changed. Instead of using the substitution matrix generated by
ScanMatch technique, a different type of a substitution matrix can also be introduced by a researcher.
The scanpath analysis techniques typically do not take fixation duration into consideration. Thus, Cristino et al. (2010) suggest repeating elements in individual scanpaths based on their fixation durations. To achieve this, an appropriate duration (namely, temporal bin size) should be defined for repeating these elements proportionally to the fixation durations. For example, if the duration is defined as 50 milliseconds and the visual element C is fixated for 200 milliseconds by a user, his or her scanpath will include four (200/50=4) consecutive visual element C (...CCCC...). Takeuchi and Matsuda (2012) tested this approach with an eye tracking study by using the String-edit algorithm and a substitution matrix. They suggest that better results can be achieved by taking this approach into account for scanpath comparison.
ScanMatch technique is mainly designed for analysing user scanpaths on visual stimuli segmented by a grid-layout.
Figure 2 shows an example of a 5 × 5 grid-layout segmentation with
ScanMatch technique where each element is represented with one upper-case letter and one lower-case letter. The grid size can be adjusted and then user scanpaths can be represented with the segments.
ScanMatch technique also allows to use a different segmentation but each pixel should be associated with a visual element. As there were some spaces between visual elements generated by the extended and improved version of the VIPS algorithm (see
Figure 1),
ScanMatch technique could not be applied the dataset that is described in the Methodology section.
Both the durations of fixations and the positions of visual elements on web pages are considered here. However, the subjectivity level of the results can be an important issue here as there are many parameters that need to be configured. The configurations of those parameters can easily affect the results.
Transition Probability Calculation
Markov Models (West, Haake, Rozanski, & Karn, 2006) and eSeeTrack technique (Tsang, Tory, & Swindells, 2010) are categorised under the transition probability calculation group as they determine transition probabilities between visual elements. The reductionism is not again applicable to this group.
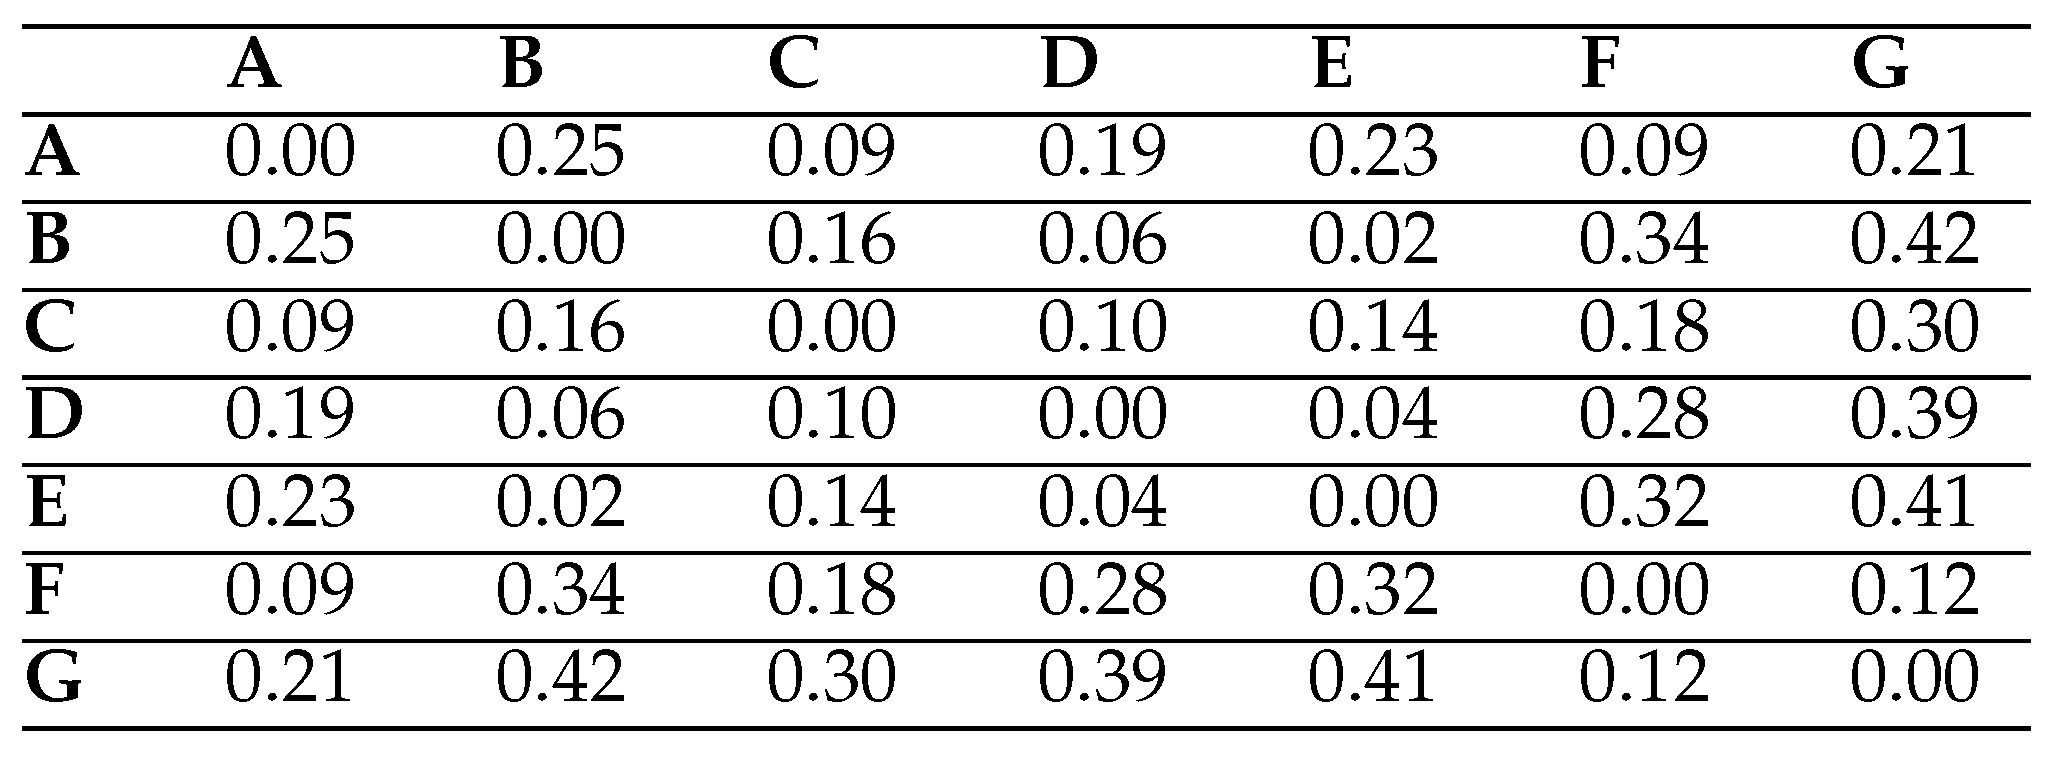
Markov models. In order to calculate transition probabilities between visual elements, Markov models have been used with some variations (West et al., 2006; Chuk, Chan, & Hsiao, 2014; Kang & Landry, 2015). These models can be applied to user scanpaths correlated with visual elements of web pages to generate a transition matrix which holds transition probabilities between visual elements. This matrix can then be used to recognise which visual element can be next and can be before a particular element with their probabilities.
Table 7 shows a transition matrix generated for the scanpaths in
Table 1 by using the scanpath analysis tool of West et al. (2006) called
eyePatterns (
http://eyepatterns.sourceforge.net/) (Yesilada et al., 2013; Eraslan et al., 2013). This matrix includes a positive integer number and two percentages in each cell. The number illustrates the number of transitions from a visual element in a row to a visual element in a column. In addition, the percentages show row and column probabilities respectively where the row probabilities are related to the next visual elements, and the column probabilities are associated with the previous visual elements. For example, as highlighted in
Table 7, there are 11 transitions from the visual element A to the visual element C in total, and the transition probability from element A to element C is calculated as 55.01%. Moreover, the probability of fixating element A just before element C is calculated as 23.92%.
As also stated in the literature, Markov models are incapable of identifying whether or not there is a typical scanpath for multiple scanpaths (Abbott & Hrycak, 1990; Josephson, 2010). For example, it could be assumed that the starting point is the visual element C for the scanpaths in
Table 1 as it is firstly fixated by most of the users. According to the transition matrix in
Table 7, users are more likely to fixate the visual element D after the visual element C. They are then more likely to fixate the visual element E and then the visual element D again. It continues as CDEDED..., and therefore a number of considerable questions arise, especially what the ending point should be and which probabilities should be used. Furthermore, the durations of fixations and the positions of visual elements on web pages are not used while creating the transition matrix.
eSeeTrack. There is another analysis tool called eSeeTrack which visualises eye tracking data based on the segments of visual stimuli by using a timeline and a tree visualisation (Tsang et al., 2010). The timeline illustrates a sequence of fixations based on visual elements for each user. Each fixation is represented as a coloured band, and the width of the band represents the duration. As a result, the long fixations can be recognised in the timeline. Moreover, the tree visualisation allows recognition of transitions between segments for multiple users where higher probabilities are highlighted with larger sizes.
An example of the tree visualisation is illustrated in
Figure 3. Even though fixation durations are considered by
eSeeTrack, the positions of visual elements on visual stimuli are not taken into consideration. Similar to Markov models,
eSeeTrack is not able to identify whether or not there is a typical scanpath for multiple scanpaths.
Instead of calculating transition probabilities between visual elements of web pages, some other techniques have also been suggested in the literature to detect patterns within multiple scanpaths. These techniques are revisited and investigated in the following section.
Pattern Detection
The pattern detection techniques range from searching for a particular pattern to detecting all patterns with the number of matches. This group consists of eyePatterns analysis tool (West et al., 2006), the Sequential Pattern Mining algorithm (Hejmady & Narayanan, 2012) and the T-Pattern Detection technique (Magnusson, 2000).
eyePatterns-Search Patterns. When people want to check whether a particular pattern exists within given scanpaths or not, they can use
eyePatterns analysis tool (West et al., 2006). For example, on the HCW Travel web page, the participants were asked to read the latest news from the company and click on the link for the special offers. They, therefore, needed to fixate the visual elements E and D respectively to complete their tasks successfully. When the pattern ED is searched in their scanpaths, the analysis tool provides the results shown in
Table 8.
According to these findings, the pattern ED is not seen in all of the scanpaths. However, as these participants completed their tasks successfully, it is expected to see this pattern in their scanpaths. The participants might not complete their tasks directly, so there could be other visual elements between the visual elements E and D. Hence, this analysis tool also has an option (namely, gap size) to make the search more flexible by allowing other visual elements between the desired visual elements (maximum five elements), such as allowing to find the pattern ED in the scanpath CACDEC
EC
D (S8 in
Table 1).
While eyePatterns analysis tool is searching for sequential patterns in given scanpaths, it does not check the durations of fixations and the positions of visual elements on web pages. Moreover, if there are more than five elements between the desired two elements, the two elements cannot be combined to be detected as a pattern.
eyePatterns–Discover Patterns.
eyePatterns analysis tool can also be used to discover patterns within multiple scanpaths based on the defined pattern length (West et al., 2006). When it is applied to a number of scanpaths with a particular length, it lists the patterns with how many times they are seen in the paths and how many scanpaths are inclusive of the patterns. Hence, when this tool is applied to the scanpaths on the HCW Travel web page with the default length 4, the discovered patterns are listed as shown in
Table 9. For example, the pattern EDED is seen ten times but in four out of ten scanpaths.
This tool does not have a tolerance for extra visual elements within patterns while discovering them. It means it cannot discover the pattern EDED in the scanpath BCECDCDCDEDECDC because of the visual element C. Because of this reason, this tool is reductionist while discovering patterns. In other words, it is likely to detect no pattern or very short patterns that are not helpful for understanding users’ behaviours on web pages. In addition, this tool does not consider the durations of fixations and the positions of visual elements on web pages during the discovery of patterns.
Sequential Pattern Mining. The Sequential Pattern Mining (SPAM) algorithm has also been used to identify patterns within multiple scanpaths (Hejmady & Narayanan, 2012). Although this algorithm was originally developed for detecting frequent patterns in a sequence database (Ayres, Flannick, Gehrke, & Yiu, 2002), it can also be applied to user scanpaths correlated with visual elements of web pages. In contrast to eyePatterns analysis tool, the SPAM algorithm has tolerance to extra visual elements within patterns while discovering them. To find the patterns that are included in all the scanpaths, the minsup parameter, the percentage of scanpaths that include the pattern, should be set to one (or 100%) (Fournier-Viger et al., 2014).
When the SPAM algorithm is applied to the scanpaths in
Table 1 to detect patterns that are seen in all the scanpaths, it finds CDED and DCED as the longest patterns (Fournier-Viger et al., 2014). In contrast, as seen in
Table 9,
eyePatterns analysis tool cannot detect any pattern with the length four which exists in all the scanpaths. Similar to
eyePatterns analysis tool, the SPAM algorithm does not pay attention to the durations of fixations and the positions of visual elements on web pages. This algorithm has also a reductionist approach. Specifically, when the individual scanpaths VWXYZ, VWYZ and VXWZY are available, the patterns VWY and VWZ are identified as the longest patterns which are seen all the scanpaths. However, the elements V, W, Y and Z exist in all the scanpaths.
T-Pattern Detection. T-Pattern Detection, which stands for Temporal Pattern Detection, is another approach that has been used to detect patterns within user scanpaths (Burmester & Mast, 2010; Mast & Burmester, 2011; Drusch & Bastien, 2012). It was originally developed by Magnusson (2000) in the area of behavioural science for analysing social interaction but now it can be used in different areas (Mast & Burmester, 2011). For example, this approach was used by Borrie, Jonsson, and Magnusson (2002) to analyse the movements of the ball and the players in some soccer matches. As the T-Pattern Detection technique is now a commercial product (
http://www.noldus.com/theme/t-pattern-analysis), researchers need to pay for using it in their studies.
T-Pattern detection requires a behaviour sequence which is coded in terms of the occurrences of event types with their times (Magnusson, 2000). The event type represents the beginning or ending of some particular behaviour such as starting to fixate the visual element A (Magnusson, 2000). As also stated by Burmester and Mast (2010) and Mast and Burmester (2011), two event types are defined as a T-Pattern if they meet the following two conditions:
According to Magnusson (2000), there are two possible types of distribution which are called Critical Intervals: Fast and Free Critical Intervals. As also stated by Burmester and Mast (2010) and Mast and Burmester (2011), for the Fast Critical Interval type, the event type
A should occur relatively quickly before the event type
B. In contrast, for the Free Critical Interval type, the event type
A can occur before the event type
B within a defined time interval but the time distance between the type
A and the type
B should be relatively similar.
Figure 4 shows the difference between the Fast and Free Critical Intervals with an example (Mast & Burmester, 2011).
As a result of an iterative process, each T-Pattern can be combined with another event type or T-Pattern to create a longer T-Pattern (see an example in Figure 5) (Magnusson, 2000; Mast & Burmester, 2011). A T-Pattern with n components can be represented as follows: X1 [d1, d2]1 X2 [d1, d2]2 ... Xi [d1, d2]i Xi+1... Xn where [d1, d2] represents the critical interval (Magnusson, 2000).
This technique uses the significance level parameter while generating T-Patterns (Magnusson, 2000). This parameter is related with critical intervals and it influences the number of event types in TPatterns (Magnusson, 2000). When the significance level decreases, less and shorter patterns are detected (Magnusson, 2000). The T-Patterns can also be filtered by using various criteria such as the minimum pattern length, the minimum number of occurrences of the pattern (Magnusson, 2000).
The T-Pattern Detection technique has many different parameters, and the detected patterns can be affected based on the adjustments of these parameters. As a consequence, the subjectivity level of the results can be a problem. By using strict values, the technique can also become reductionist, especially with the Fast Critical Intervals. As illustrated in
Figure 4, the pattern AB may not be detected as a T-Pattern because of the Fast Critical interval. Likewise to the majority of the scanpath analysis techniques (see
Table 2), the T-Pattern Detection technique does not consider the positions of visual elements on visual stimuli. However, the durations of fixations are used for detecting T-Patterns.
Common Scanpath Identification
As presented above, different techniques have been used to detect patterns within user scanpaths. These techniques can detect more than one pattern for given scanpaths. For example, the SPAM algorithm provides CDED and DCED as the longest patterns for the scanpaths in
Table 1. In contrast to these techniques, different techniques are also available to identify one scanpath for representing the entire group which is typically known as a
common scanpath. This group includes the following techniques: the Shortest Common Supersequence technique (Räihä, 2010), the Multiple Sequence Alignment technique (Hembrooke et al., 2006), the Position-based Weighted Models of Sutcliffe and Namoun (2012), the Position-based Weighted Models of Sutcliffe and Namoun (2012), Hierarchical Clustering with the Dotplots algorithm (Goldberg & Helfman, 2010) and
eMINE scanpath algorithm (Eraslan et al., 2014).
Shortest Common Supersequence. One of these techniques is the
Shortest
Common
Supersequence (SCS) technique (Räihä, 2010). According to Räihä (2010), the sequence P can be a supersequence of the sequences S1 and S2 if the deletion of zero or more characters from P can provide S1 and S2. When this technique is repeatedly applied to the scanpaths in
Table 1, it provides the scanpath shown in Example 1.
Example 1. The common scanpath of the Shortest Common Supersequence Technique for the scanpaths in Table 1 A E B C E B D C F A D C A D C F D E B D A E B D F As can be clearly seen from the common scanpath, this technique has considerable weaknesses. In particular, it provides a quite longer scanpath compared to the individual scanpaths. For example, the average length of the individual scanpaths in
Table 1 is equal to 19.9 (Standard Deviation: 10.61) but the common scanpath for those scanpaths consists of 63 visual elements including repetitions. In contrast to the reductionism, this technique provides an unnecessarily complicated result. Furthermore, the common scanpath is not supported by the majority. For instance, it includes the visual element F four times but this visual element is only included by the third scanpath three times and fourth scanpath only once. Neither the durations of fixations nor the positions of visual elements on web pages are used by the SCS technique.
Multiple Sequence Alignment Technique. Hembrooke et al. (2006) propose to use the multiple sequence alignment technique to identify an average scanpath for multiple users. In other words, they suggest to align repeatedly a scanpath with another scanpath in the list of scanpaths until a single scanpath is left in the list that represents their average scanpath. However, the technique is not described in depth and they have not evaluated this technique with any subsequent study yet.
When two scanpaths are aligned, their shared visual elements can be lost because of their positions in the scanpaths. For example, two scanpaths are aligned in
Table 3. Although the first scanpath starts with the element D and the second scanpath has the element D in the second position, the element D is lost in the result of the alignment. Therefore, this technique becomes reductionist because of the alignment process. The durations of fixations and the positions of visual elements on web pages are not taken into consideration here.
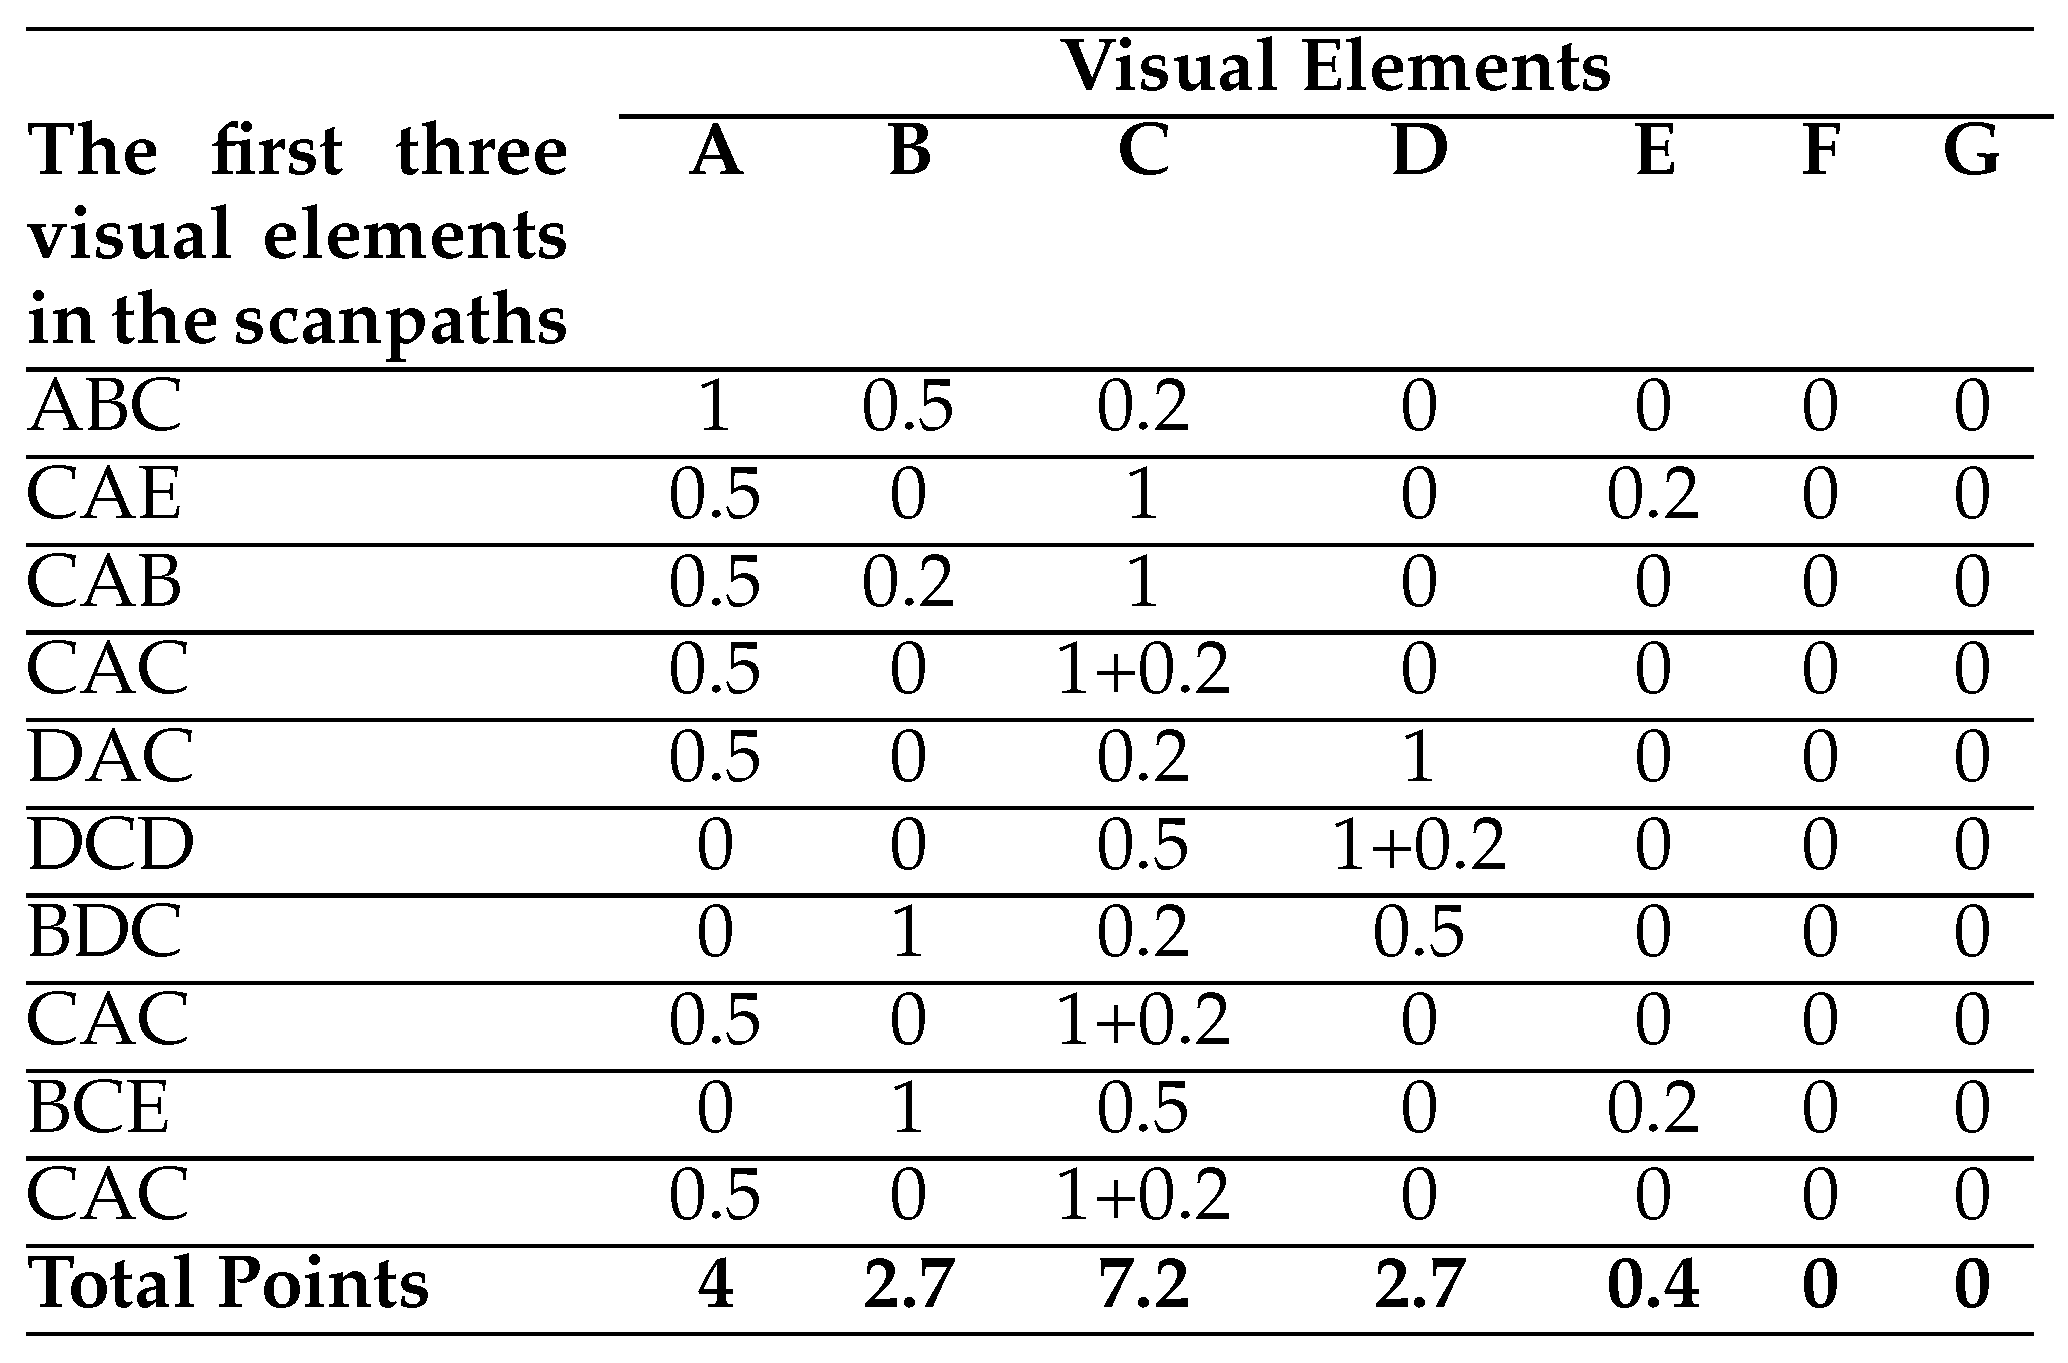
Position-based Weighted Models. Sutcliffe and Namoun (2012) use a position-based weighted model to investigate where users focus in very early phases of their searches on web pages. They firstly segment web pages by using a 3 × 3 grid-layout segmentation, and then find the corresponding segments of the first three fixations of users on the web pages. They then give one point to the first segments, 0.5 points to the second segments and 0.2 points to the third segments. After this, they calculate the total point for each segment and sort them by the total points in descending order.
When the position-based weighted model of Sutcliffe and Namoun (2012) is applied to the scanpaths in
Table 1 (see
Table 10), the initially visited visual elements on the HCW Travel web pages are identified as follows: C (7.2 points), A (4 points), B (2.7 points), D (2.7 points), E (0.4 points). This model only concentrates on very early phases of searching on web pages. Moreover, there cannot be any repetition in the common path but users can fixate the same visual element more than once. As this model only focusses on the first three visual elements in individual scanpaths and none of the visual elements are excluded, the reductionism is not applicable here.
Holsanova et al. (2006) applies a similar approach to analyse reading paths and reading priorities on newspaper spreads. They firstly divide a newspaper spread into its AoIs and then rank them based on the first visits of the AoIs by users (Holmqvist et al., 2011).
The HCW Travel web page has seven visual elements. Thus, when the position-based weighted model of Holsanova et al. (2006) is applied to the scanpaths in
Table 1 by giving 7 points to the firstly visited visual elements and no point to the non-visited visual elements, the sequence of the visual elements for all the scanpaths is identified as follows: CDABEFG.
Table 1 shows the points for each visual element in each scanpath. Although the same AoI can be visited several times by users, the repetitions are not taken into consideration by this approach. Besides this, some AoIs may not attract users but none of the AoIs is excluded in their model. Therefore, the reductionism is not also applicable for this model.
Both of the position-based models of Sutcliffe and Namoun (2012) and Holsanova et al. (2006) do not consider the durations of fixations and the positions of visual elements on visual stimuli.
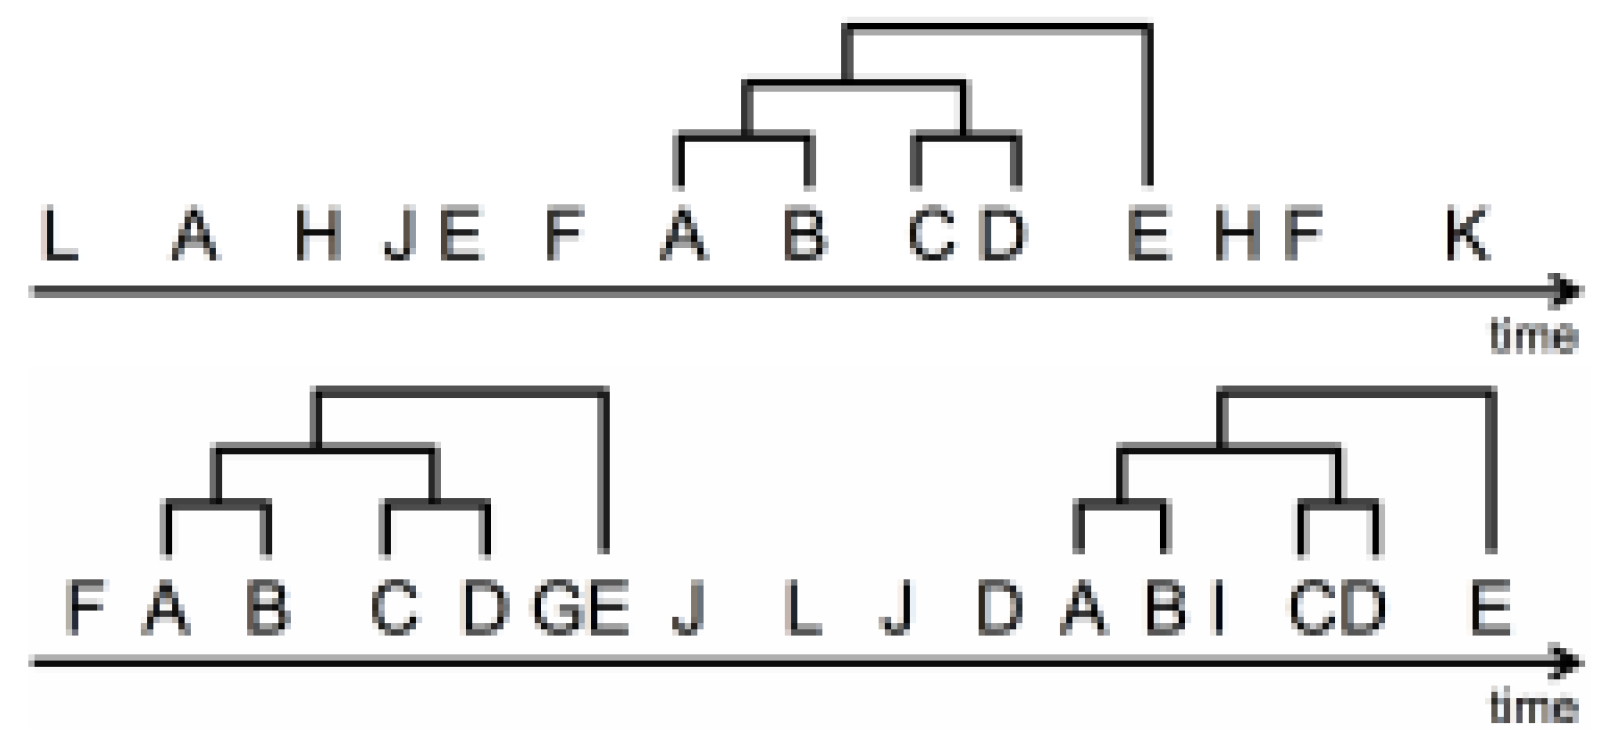
Hierarchical Clustering with the Dotplots algorithm. The Dotplots algorithm is also suggested by Goldberg and Helfman (2010) for clustering multiple scanpaths hierarchically to identify their common scanpath. The algorithm was originally developed for the purpose of comparing two biological sequences (Krusche & Tiskin, 2010).
Figure 6 illustrates how this algorithm works with the seventh and ninth scanpaths in
Table 1 as an example (Eraslan et al., 2013). As can be seen from this example, it uses a two-dimensional matrix. One scanpath is written horizontally (S7) and another one is written vertically (S9). When the same visual elements are matched, their intersections are marked with dots. The dots are then used to find the longest straight line as a shared scanpath. As shown in
Figure 6, BCCDCDDED, which is represented by a solid line, can be found as a shared scanpath of the seventh and ninth scanpaths in
Table 1 To hierarchically cluster multiple scanpaths with the Dotplots algorithm, the two most similar scanpaths are selected from the list of scanpaths by using the Dotplots algorithm and then the selected scanpaths are merged. Next, the merged scanpath is added to the list of scanpaths and then the selected two scanpaths are removed. This process is repeated until only one scanpath is left in the list that represents the common scanpath. In order to merge two scanpaths, they suggested two different ways: (1) Identifying a shared scanpath of two similar scanpaths by using the Dotplots algorithm (2) Assigning one of the two similar scanpaths to the merged scanpath. The second way is related to the selection of one of the individual scanpaths as a common scanpath that is a debatable idea as users might follow different paths to complete their tasks (see Figure 9).
Figure 7 shows how the scanpaths in
Table 1 are hierarchically clustered with the standard Dotplots algorithm by using the first way of merging. It is also used by Albanesi et al. (2011) and they call the result a dominant path.
As can be seen from
Figure 7, only visual element C is identified as a common scanpath for the scanpaths in
Table 1 with this hierarchical clustering. It is mainly caused by the Dotplots algorithm. It can be recognised from
Figure 6 that illustrates how the Dotplots algorithm finds the shared scanpath of two scanpaths. Although the dashed line can provide a longer shared scanpath in comparison to the solid line, it cannot be detected because of the disconnections. Hence, this algorithm makes the hierarchical clustering reductionist at the end. Besides, neither the durations of fixations nor the positions of visual elements on web pages are used by this approach to identify a common scanpath.
eMINE Scanpath Algorithm. Eraslan et al. (2014) propose another algorithm called
eMINE scanpath algorithm (
http://emine.ncc.metu.edu.tr/software.html) to address the problem of being reductionist. This algorithm is comprised of some of other techniques. It firstly chooses the two most similar scanpaths from the list of scanpaths with the String-edit algorithm. The
Longest
Common
Subsequence (LCS) technique is then applied to these two scanpaths to find their common scanpath (Chiang, 2009). After that, the chosen two scanpaths are removed from the list and then their common scanpath is added to the list. This process is repeated until there is a single scanpath in the list. The single scanpath is then abstracted to provide the common scanpath. When this algorithm is applied to the scanpaths in
Table 1, it provides CDED as a common scanpath (see
Figure 8) (Yesilada et al., 2013).
eMINE scanpath algorithm tries to address the reductionist problem of the Dotplots algorithm by using the String-edit algorithm and the LCS technique together instead. However, it still uses a hierarchical clustering and that means some visual elements can be lost at the intermediate levels. Because of this reason,
eMINE scanpath algorithm is still likely to produce very short common scanpaths which are not useful for further processing of web pages. Assume that the individual scanpaths S6: DCDCABEDCD, S8: CACDECECD and S10: CACDADCBECDCB are available (see
Table 1). First of all, the individual scanpaths S8: CACDECECD and S10: CACDADCBECDCB are merged as S (8,10): CACDCECD. When S6: DCDCABEDCD is merged with S (8,10): CACDCECD, CDCECD is identified as a common scanpath. As can be seen from this example, although the visual element A is shared by the three individual scanpaths, it is not included in the common scanpath. Similar to other techniques to identify a common scanpath for multiple scanpaths (see Table 2),
eMINE scanpath algorithm does not consider the durations of fixations and the positions of visual elements on web pages.
Discussion
To support researchers in identifying salient web page features, eye tracking software products typically provide heat maps showing those parts of web pages which are mostly fixated by users (
http://www.tobii.com/). However, these maps are not designed to illustrate user scanpaths. These products also allow the visualisation of scanpaths along with gaze plots (see an example in
Figure 1). Visualisations based on gaze plots are simple individual scanpaths displayed together. These have a limited benefit in evaluating a website in terms of generalisability. When there are multiple scanpaths, these plots become useless because it is difficult to distinguish them (see an example in
Figure 9). While there are other visualisation techniques (Räihä et al., 2005), these also become complicated to analyse as the number of users increase.
This article analyses the techniques which can be used to compare and correlate multiple user scanpaths. For instance, the techniques of the similarity/dissimilarity calculation group can be used for comparing scanpaths of two different user groups to investigate whether they follow different paths to complete a particular task (Eraslan & Yesilada, 2015). Moreover, the techniques of the transition probability calculation group can be used for investigating the efficiency of the arrangements of elements (Ehmke & Wilson, 2007). Furthermore, the techniques of the pattern detection and the common scanpath identification groups can be applied to user scanpaths and then the results can be used for re-engineering web pages to allow a direct access to firstly visited visual elements (Yesilada et al., 2013; Akpınar & Yeşilada, 2015).
While all methodologies have a pros and cons (see
Table 2), it is worth discussing some of the more notable limitations, along with suggestions for their mitigation.
Pre-processing: Eye tracking data typically consist of a large number of fixations, however, some of the fixations may not be meaningful. For example, involuntary eye movements may occur due to the oculomotor system (Cornsweet, 1956). Since scanpaths are correlated with visual elements of web pages by using fixations, meaningless fixations should be eliminated from the eye tracking data to reduce the variance. For example, our analysis showed that eyePatterns analysis tool cannot discover the pattern EDED in the scanpath BCECDCDCDEDECDC because of the element C. However, the element might be present due to a meaningless fixation. Therefore, eye tracking data should be pre-processed to ensure that meaningless fixations are excluded for improving the quality of the data. The key is identifying ‘meaningless’ fixations in a well found manner.
In the literature, there are researchers who remove the fixations if their durations are below a particular threshold. For example, Rämä and Baccino (2010) eliminated the fixations with a duration less than 100 milliseconds from their studies. However, different approaches exist for a duration that is needed to extract information from a display (Rayner, Smith, Malcolm, & Henderson, 2009; Glö ckner & Herbold, 2011). In particular, Rayner et al. (2009) suggest that users require at least 150 milliseconds for each fixation to process a display normally. However such generalisations can be a problem because web pages can differ in their degrees of complexity. Therefore, the duration needed to extract information can be different from one page to another. The duration can also be affected by individual factors, such as gender (Pan et al., 2004). When a pre-defined threshold is used for eliminating meaningless fixations, eye tracking data can be biased in some way. Instead of using a predefined threshold, a new value can be determined for each page by analysing the data. In particular, researchers can benefit from analysing user fixations on target areas to identify the minimum duration that is needed to achieve the target.
Cognitive Processing: It is widely accepted that fixation duration is related to the depth of processing and the ease or difficulty of information processing (Velichkovsky et al., 2002; Follet et al., 2011). To take cognitive processing into account, fixation durations should be carefully considered. However, the majority of the scanpath analysis techniques do not consider fixation durations (see
Table 2). For example, our analysis showed that
eMINE scanpath algorithm provides CDED as a common scanpath for the scanpaths in
Table 1 but it does not illustrate which element has the longest time.
As also mentioned above, there are researchers who eliminate fixations based on a particular duration, even though they might have some information content. Researchers should also give their attention to fixation durations while they are analysing scanpaths. In particular, they should determine how much time is typically needed to complete the task that they want to ask their users. When a particular user completes the task in an unexpected duration, the user’s data should be analysed to investigate the reasons.
Reductionist Approach: Our analysis showed that scanpath analysis techniques tend to be reductionist while discovering patterns and identifying common scanpaths. In other words, the common scanpaths/patterns are likely to be unacceptably short which is not helpful for understanding users’ behaviours on web pages. In particular, the common scanpath/pattern may not include the visual element shared by all individual scanpaths and/or the visual element included by the majority of the scanpaths. For example, the common scanpath identified by eMINE scanpath algorithm for the individual scanpaths DCDCABEDCD, CACDECECD and CACDADCBECDCB does not include the element A even though it is included in all of the individual scanpaths (See the details in eMINE Scanpath Algorithm section). A technique with a reductionist approach may also identify no common scanpath/pattern or a common scanpath/pattern with a single element. Since a single element does not illustrate a sequence, it is not helpful for understanding sequential behaviours of users on web pages. This problem can be addressed by taking the following suggestions into consideration.
The commonly visited visual elements should be included in the common scanpaths/patterns. Hence, researchers should firstly identify these elements and ensure that these visual elements are included in the common scanpaths/patterns.
The firstly visited visual elements should be located at the initial positions of common scanpaths/patterns. For instance, if the visual element C is firstly visited by the majority of the users, it should be located at the beginning of the common scanpath/pattern.
Small deviations should be allowed from strict sequentiality in some cases. In particular, there can be some visual elements that are fixated by all users but in a slightly different order. Researchers should ensure that these visual elements are also included in the common scanpaths/patterns.
Even though this article focuses on the web, the scanpath analysis techniques have also been used in different domains. For example, Hejmady and Narayanan (2012) applied the SPAM algorithm to identify visual attention patterns of programmers when they debug programs with an Integrated Development Environment (IDE). Another example from Hejmady and Narayanan (2012) who used a position-based model to analyse entry points and reading paths of readers on newspaper spreads. As the techniques revisited can be applied to all static visual stimuli, researchers from different domains can also benefit from this article.
In order to analyse and compare the scanpath analysis techniques, we used the eye tracking data of ten users. Even though the dataset is small, it is useful to illustrate the pros and cons of the techniques. The techniques can also be analysed and compared with a larger dataset in the future. However, when the sample size increases, the variations are also likely to increase. Therefore, the techniques may experience some problems to deal with these variations, especially the techniques that try to detect patterns or identify common scanpaths. In particular, they may not able to provide any result because of the variations.
Finally, in this article, we unfortunately could not apply some of the techniques to the dataset. For example, the implementation of the T-Pattern Detection technique is not publicly available (Magnusson, 2000). We believe that the implementations of the scanpath analysis techniques should be available for research/testing purposes to support eye tracking research.
Conclusions
Scanpaths correlated with visual elements of web pages can be analysed by using different techniques. Each of these techniques has its strengths and weaknesses and the researchers should pick those which are the most appropriate for the task at hand. While this article combines and revisits these techniques, and investigates their strengths and weaknesses by evaluating them with a third-party eye tracking dataset, all possible situations cannot be tested (see the Methodology section). This article also classifies the scanpath analysis techniques according to their goals as shown in
Table 2, and by so doing, allows researchers to focus directly on the techniques that are suitable for their scanpath analysis on web pages. The main concluding remarks are listed below.
The String-edit algorithm is useful and straightforward to determine the similarity between a pair of scanpaths as a percentage (Underwood et al., 2008). However, when researchers pay attention to the distances between visual elements on web pages, they should create a substitution cost matrix based on the distances and then integrate the matrix into the String-edit algorithm (Takeuchi & Habuchi, 2007).
When researchers want to investigate transition probabilities between visual elements of web pages, they should consider a transition matrix as it clearly illustrates the transition probabilities (West et al., 2006).
eyePatterns analysis tool is publicly available and it helps researchers to search for a particular pattern within given scanpaths by allowing some gaps between the visual elements within the pattern (West et al., 2006).
When researchers want to detect repetitive patterns within multiple scanpaths, they should use the T-Pattern Detection technique that provides a number of different parameters for them to configure according to their goals (Magnusson, 2000). However, the implementation of the T-Pattern Detection technique is a commercial product.
If an oversimplification can be a problem for researchers while they are identifying patterns and common scanpaths for multiple scanpaths, they should avoid using the techniques with a very reductionist approach.
It is widely accepted that fixation durations have a relationship with the depth of processing and the ease or difficulty of information processing (Velichkovsky et al., 2002; Follet et al., 2011). Therefore, when researchers want to consider cognitive processing, they should pick the techniques that use fixation durations based on their goals. For example, they should use ScanMatch technique to compare a pair of scanpaths (Cristino et al., 2010).
To make the ideal use of available eye tracking data, researchers should select an appropriate technique for their studies. In order to do so, they should be aware of the strengths and weaknesses of the alternatives and this article aims to support that.


