This section describes these three steps in more detail, and an evaluation of the algorithm is discussed in the next section.
Symbol lattice expansion
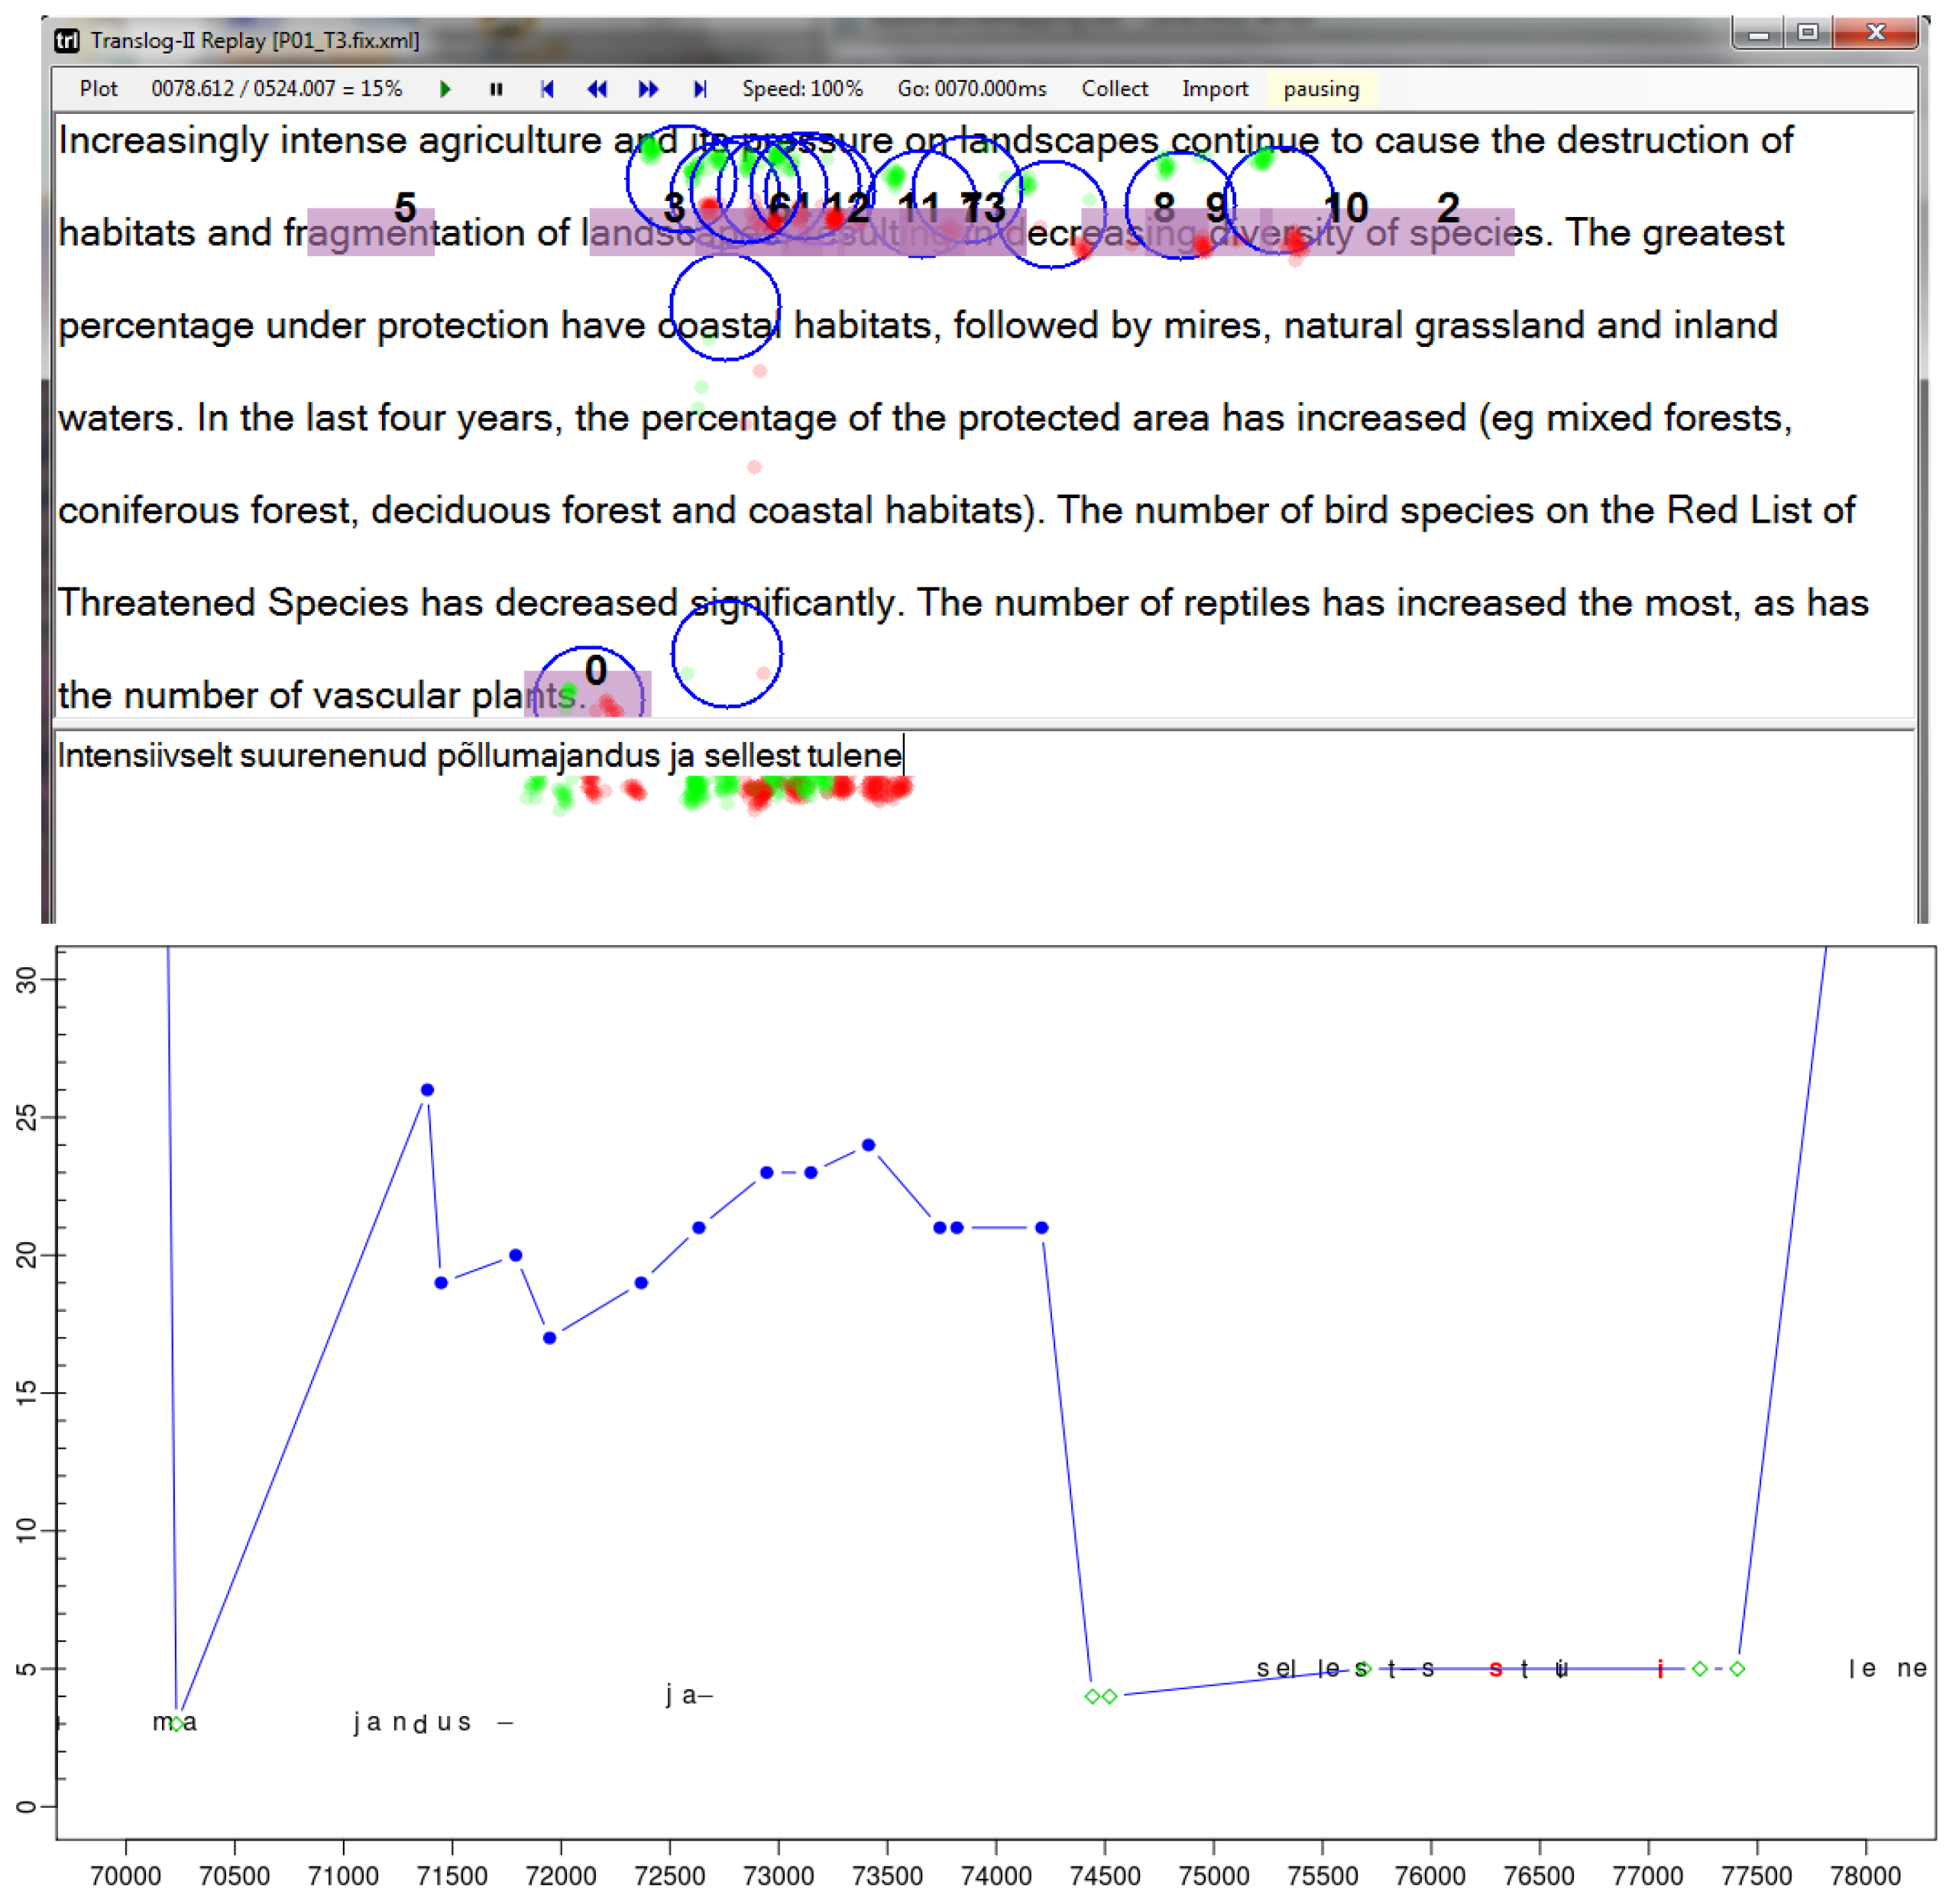
In the second step, the sequence of "naïve" fixation-to-symbol mappings (as in
Figure 1) is projected into a lattice of several possible correct symbol locations above and below the current fixation on the text. Then a dynamic programming algorithm applies a number of heuristics to find the best path through the lattice, based on the distance in characters, in words and in pixels between successive fixations, so as to smooth the gazing path according to observations reported in the literature.
Figures 3a to 3d illustrate this process based on the sequence of fixations and keystrokes between time stamps 70.000 and 73.000 in
Figure 1 and
Figure 2. It illustrates the re-mapping of the fixation path in
figure 1 (bottom) to the path plotted in
figure 2 (bottom). Additional fixations are computed from the gaze sample points, in the following way:
- -
compute the fixation center only from the left eye gaze samples
- -
compute the fixation center only from the right eye gaze samples
- -
compute the fixation center from the average of the left and the right eye gaze samples
The fixation centers are then mapped onto the closest nearby character in the source or target window, a so-called fixation-to-symbol mapping. There are thus three different fixation-to-symbol mappings average, left and right, depending on which fixation they are based on. In addition, a character is retrieved in the line above the uppermost fixation-to-symbol mapping (up), and a character is retrieved in the line below the lowest fixation-to-symbol mapping (down). In this way, five fixation-to-symbol mappings are generated in addition to the original one, which may, however, partially overlap with these additional mappings.
While
Figure 1 (bottom) shows the naïve average fixation,
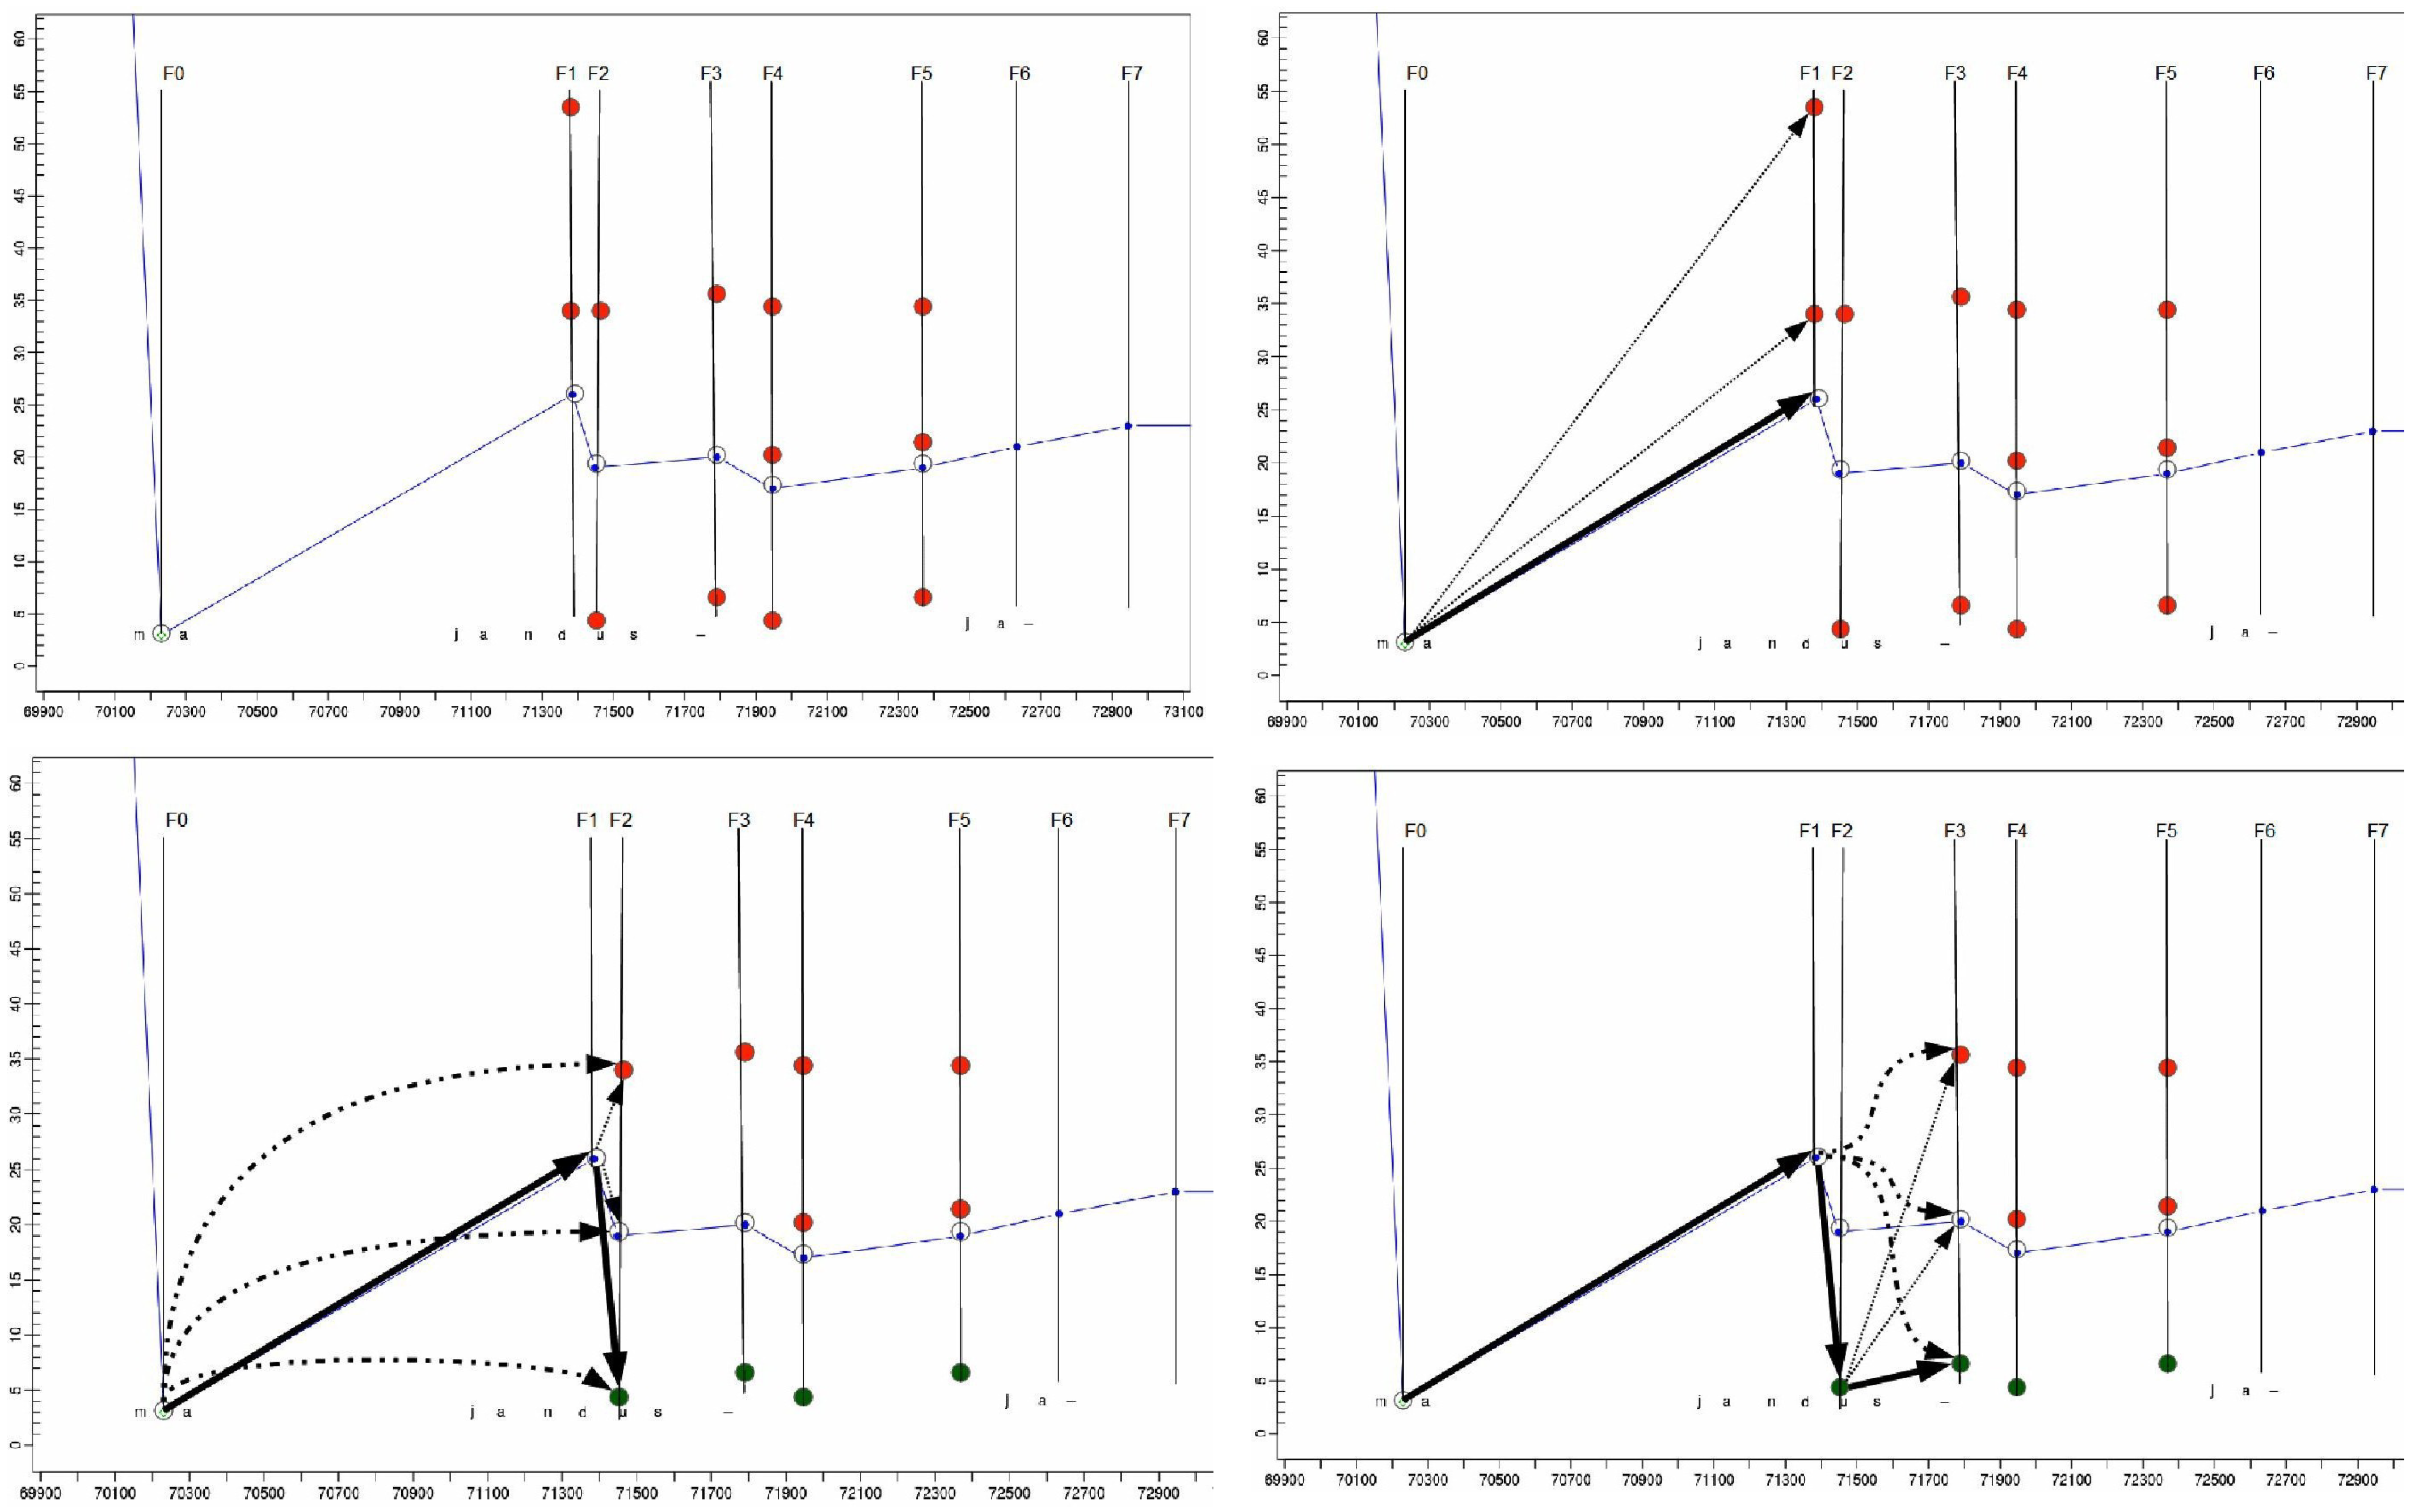
figure 3a shows the same situation, where the original naïve fixation-to-symbol mapping path is plotted (in blue) and additionally re-computed fixation-to-symbol mappings are represented as dots on the vertical fixation time line
Ft.
Figure 3a shows the projection of fixations on the lines above and below the naïve default mapping. For fixation time
F1, two additional fixation-to-symbol mappings are generated in the lines below the naïve mapping (in the progression graphs the words further down in the text appear higher in the graph), while for fixations times
F2 and
F3 fixation-to-symbol mappings are generated in the lines above and below the default naïve mapping. Note that different fixation-to-symbol mappings at one fixation time may also be distributed in different windows. For instance, a
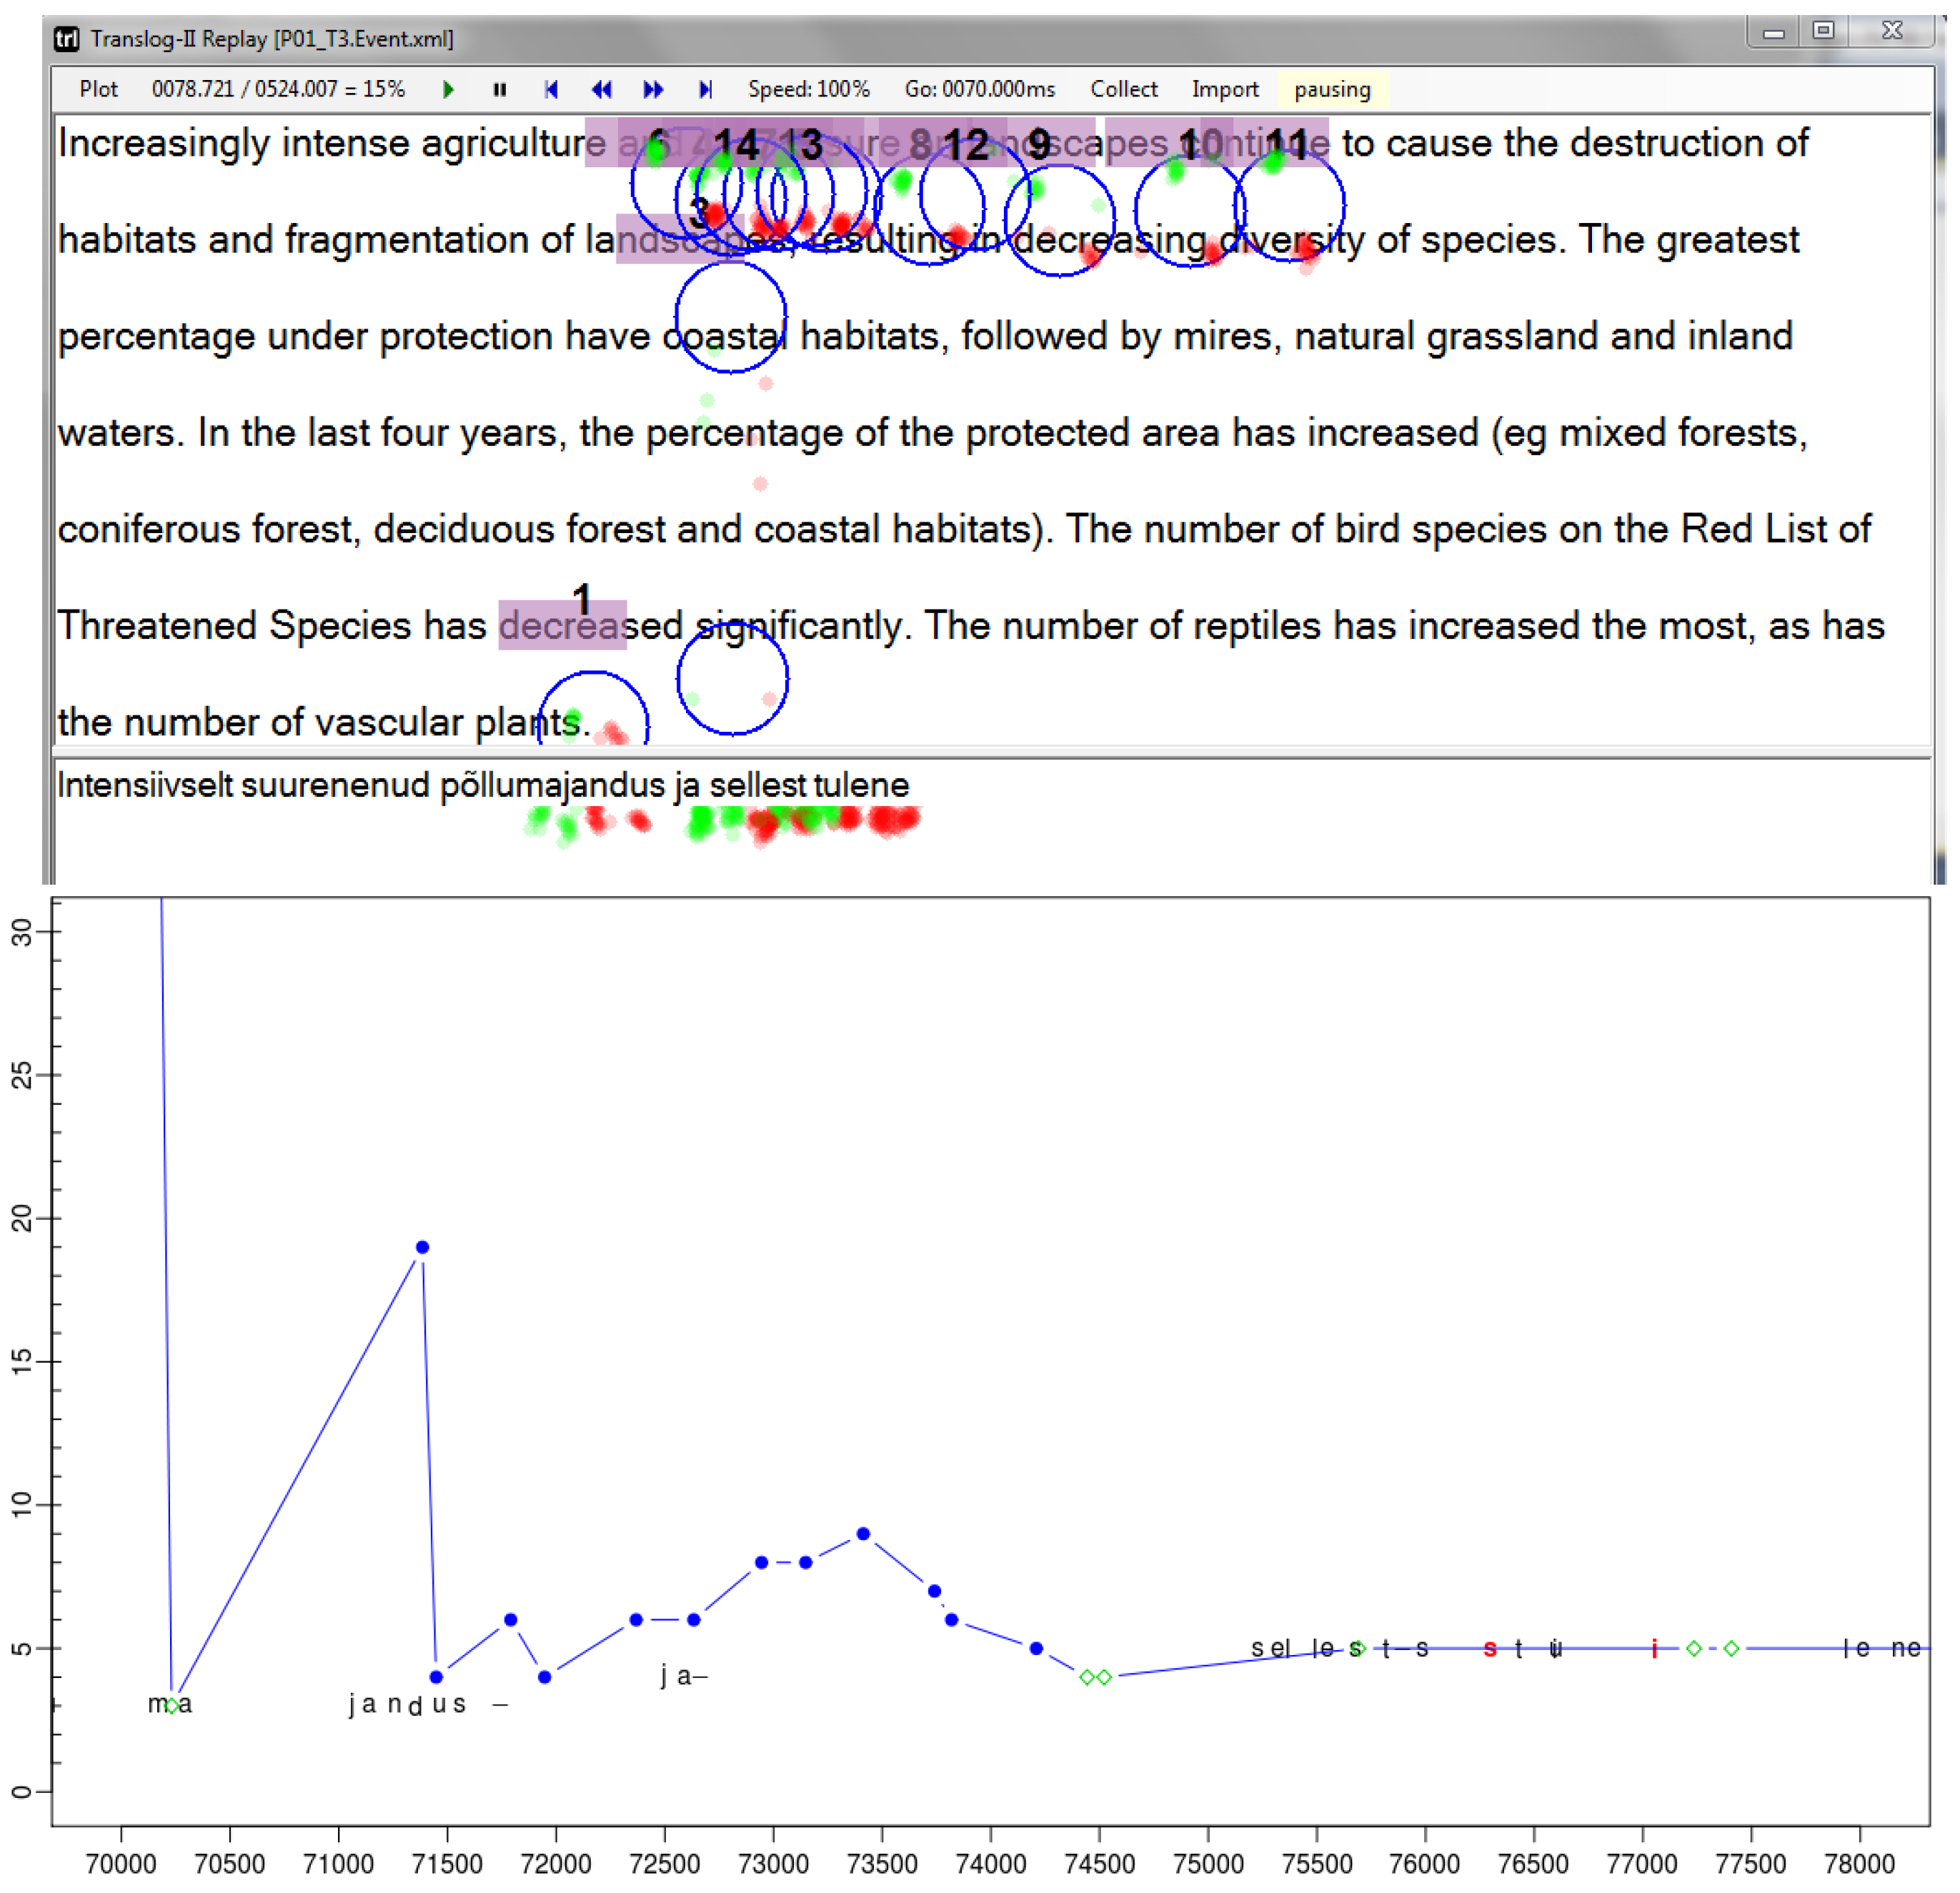
down re-mapping of the fixation numbered
0 in
Figure 1 (top) at the bottom of the source window may be re-located in the top of the target window, while the
up alternative would appear in the source window, e.g. on
decreased, as shown in
figure 2 (top), where the same fixation is numbered 1.
Symbol lattice smoothing: same window
In the third step a path through the lattice of possible fixation-to-symbol mappings is re-computed based on the minimum penalty score of the distances between successive nodes. Assuming that a fixation-to-symbol mapping
n is consolidated for a given fixation time
Ft, a penalty score for each possible fixation-to-symbol mapping
m at the next fixation time
Ft+1 and its fixation center
f is computed by summing up a number of features as described below. The fixation-to-symbol mapping
m with the lowest penalty score is then consolidated.
Figure 3b shows the links to the three possible successor nodes, where the link in bold represents the strongest connection with lowest penalty score. We use two variants of the algorithm, one in case both fixations are recorded in the same window, and another method, described below, if
n and
m are in different windows.
Different features are considered when computing the penalty scores between successive nodes, depending on whether the two successive fixation mappings occur in the same window, or whether the gaze moves from the source window to the target window or vice versa. In case two successive fixations occur in the same window (i.e. the source or target window), we assume that a sequence of text is being read so that the eyes probably move forward over the text. In case the eyes move from one window to the other, we assume that the eyes move (close) to the translation of the sequence that was previously looked at in the other window. In this subsection we formalize the former case of text reading in one window and the next section tackles the case of window switching.
According to (
Rayner, 1998), during “normal” reading the eyes can jump distances of around 5 to 15 characters along the text from left to the right, often skipping short function words. As drift of gaze data is presumably quite rare, we suspect that the gaze sample points which are received from the eye tracker, and thus the center of the various fixations that we compute from them, are close to the characters and words which are actually read. In addition, we assume that translators read a piece of text (in the source or the target window) which is close to the sequence currently being translated. These considerations are formalized in the following four functions:
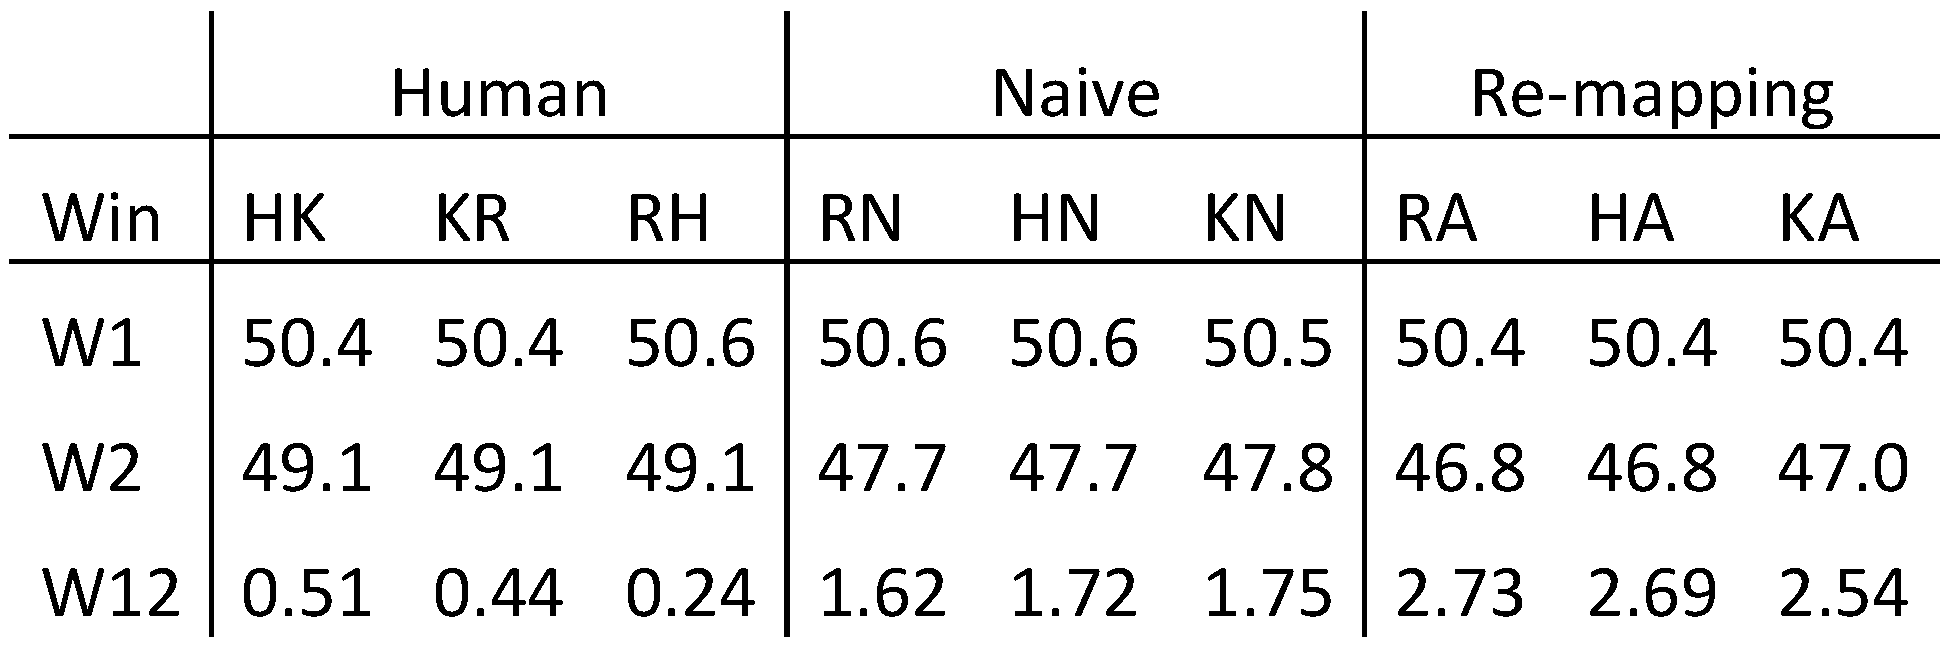
![Jemr 06 00010 i001]()
where n and m represent two fixation-to-symbol mappings, f is the fixation center of m, K=6 is approximately the average length in characters of (English) words, z=24 is the size of the characters on the screen that we used in these experiments, and l is the cursor position of the last character that was typed in the target window.
The Source Text word Id STID(.) is computed based on the alignment between the source and target text. Words in the source and target target text are numbered, and the alignment information allows us to know the Source Text word Id for each target word in the translation. This information can be linked to the keystrokes which actually produce the target words and the target text. An algorithm described in (Carl, 2013) describes how Source Text word IDs for keystrokes and fixations are computed from the alignments.
Between each consolidated fixation-to-symbol mapping
n at time
Ft and every possible successor node
m at the following fixation time
Ft+1, a penalty score is computed as shown in equation (5):
![Jemr 06 00010 i002]()
Since sometimes the eye may slip up or down a line or two (particularly when switching between the two windows) we also compute the penalty score between the consolidated node
o at the preceding fixation time
Ft-1 and the successor mapping
m, so as to lessen the impact of the current mapping potentially being a slipped fixation on the gaze path, as shown in equation (6) :
![Jemr 06 00010 i003]()
This situation is depicted in
figure 3c. There is one consolidated node
n at fixation time
F1 which is connected to all three possible successor nodes
m1..3 at fixation time
F2. These connections are represented by fine dotted lines. In addition, there are connections from the consolidated node
o at fixation time
F0 which link to the three possible fixation-to-symbol mappings in
F2. These links are represented by dashed curved connectors. There are thus six penalty scores for the three nodes
m1..3 in
F2. The node with the lowest penalty is consolidated. The link to the previous consolidated fixation mapping in
F1 is plotted in bold arrows in
Figure 3c. Even though the distance to its immediate predecessor node in
F1 is quite large, the bottom node
m in
F2 was consolidated due to the similar Source Text word Id which it shares with the consolidated fixation-mapping node in
F0 and its proximity to the previously typed character. The algorithm iterates through the expanded fixation-to-symbol mapping lattice. Once a fixation-to-symbol mapping is consolidated, the penalties of the next fixation nodes are computed as shown in
Figure 3c and so on until the end of the lattice is reached.
Symbol lattice smoothing: different window
As mentioned previously, penalty scores are computed slightly differently if the two successive fixation-to-symbol mappings are distributed in different windows. Since shifting attention from one window to another window (i.e. switching between two texts) is different from usual reading behaviour, we do not assume that eyes move in jumps of around 10 characters, and omit the cursor distance penalty function
C(.). Rather, the eyes seek to retrieve the translation of the word that was looked at (or worked on) in the other window, and thus the value
STID(n) of one fixation will be similar to
STID(m) of the following fixation. That is, penalty scores increase as the two successive fixations-to-word mappings return a different
STID(.) in both windows:
![Jemr 06 00010 i004]()
The last keystroke distance
L(.) and the Fixation-symbol distance
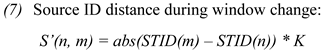
P(.) as in equation (3) and (4) remain the same also when changing windows. For sequences of fixations which imply window changes, we thus introduce two functions, analogous to the case in which the eyes stay in the same window, in which
S’LP1(n, m, f) computes the penalty scores for immediate successive nodes and
S’LP2(o, m, f) computes the penalty scores for two nodes distance:
![Jemr 06 00010 i005]()
Systematic error correction
The brain usually prefers visual input from one eye which is referred to as the dominant eye. Accordingly, fixations computed with the gaze data of the dominant eye correspond more precisely to the visual input and hence reveal more accurately what the brain was actually processing. According to wikipedia (
http://en.wikipedia.org/wiki/Ocular_dominance), approximately two-thirds of the population is right-eye dominant and one-third left-eye dominant. As outlined above, we compute
left,
right and
average fixation-to-symbol re-mappings. Since we do not know the eye dominance of our participants, the
left and the
right fixation-to-symbol mappings take into account the fact that the preferred visual input may be on the left or right eye respectively, while the
average takes the average over both eyes. We can expect that the
left,
right, or
average mappings do not change from one fixation to the next: the dominant eye does not change from one fixation to another.
In addition, we frequently observe instances of gaze drift, where the observed gaze data is a line below or above the one that we think it is plausible to assume the person was actually reading. The
up and
down fixation-to-symbol re-mappings take into account such systematic gaze drifts by simulating a shifting of the observed fixation a line up or down. Since gaze data does not usually drift within short periods of time from the line above to the line below, we assume that the
left,
right,
average,
up and
down fixation re-mappings are stable over stretches of time. To take this constraint into account, the fixation-symbol distance penalty
P(f,m) from equation (4) is relaxed if two successive fixations mappings have the same re-mapping values, as in equation (10):
![Jemr 06 00010 i006]()
where ReMap(x) returns one of the values up, down, left, right or average, according to the way in which the fixation-to-symbol mapping was computed.


