Next Article in Journal
16th European Conference on Eye Movements
Previous Article in Journal
The Global Effect: What Determines Where the Eyes Land?
 
 
Journal of Eye Movement Research is published by MDPI from Volume 18 Issue 1 (2025). Previous articles were published by another publisher in Open Access under a CC-BY (or CC-BY-NC-ND) licence, and they are hosted by MDPI on mdpi.com as a courtesy and upon agreement with Bern Open Publishing (BOP).
Article

Time-Dependent Changes in Viewing Behavior on Similarly Structured Web Pages

by
Kai Kaspar
,
Frank Ollermann
and
Kai-Christoph Hamborg
University of Osnabrück, 49074 Osnabrück, Germany
J. Eye Mov. Res. 2011, 4(2), 1-16; https://doi.org/10.16910/jemr.4.2.4
Published: 30 November 2011

Abstract

:
This article focuses on the impact of observation time and web page structure on viewing behavior. 63 subjects observed similarly structured pages of a popular commercial internet shop. Eye movements were recorded and analyzed regarding several saccade parameters, the individual fixation distribution by means of a progressive entropy approach, and the within- as well as between-subject congruency of fixation distributions. Our results show that viewing behavior significantly changed while subjects observed individual web pages. In contrast, we only found little evidence for a change in eye movements across web pages and hence for an attention-related schema building. In this context, we also provide an example of the impact of web page elements’ position on fixation probability.

1. Introduction

When users visit several similarly structured and designed web pages or revisit previously observed pages, the pages’ specific structure and design layout successively becomes familiar. In this context, questions about consequences on the users’ viewing behavior arise. Cockburn and McKenzie (2001) pointed out that web page revisitation is a highly prevalent activity; about 81% of pages have been previously visited by users as shown in their longitudinal study. As a central mechanism that is supposed to mediate the potential impact of stimulus structure on eye movements the concept of a perceptual schema is used by several authors. In the context of scene perception, for example, (e.g. Loftus & Mackworth, 1978; Friedman, 1979; Henderson, Weeks & Hollingworth, 1999) longer fixation durations have been attributed to a deeper visual analysis of objects in a scene that are semantically inconsistent with the familiar scene schema (Castelhano, Mack, & Henderson, 2009). However, the definition of the schema construct is not unambiguous and some authors use it synonymically with the gist of a visual scene (e.g. Casthelano et al., 2009; Underwood & Foulsham, 2006). To avoid misunderstandings we define the term “schema” according to Chalmers (2003) as a mental picture of the visual information gathered previously. In this context, the distinction between changes in viewing behavior over time, i.e. when observing a single stimuli, and systematic changes in eye movements across multiple viewings is an important issue. Both the effect of observation time on viewing behavior (e.g. Antes, 1974; Tatler, Baddeley, & Gilchrist, 2005) as well as changes in eye movements across repeated image presentations (e.g. Brockmole and Henderson, 2006; Foulsham and Underwood, 2008; Underwood, Foulsham, & Humphrey, 2009; Harding and Bloj, 2010; Kaspar and König, 2011, in press) have been investigated concerning complex scenes so far.
Both aspects of a temporal change in viewing behavior regarding web pages have been thus far neglected. Although it seems to be self-evident in terms of a schema building process that users somehow adapt their attentional behavior to the structure of an interactive product across multiple viewings, only a few detached studies have so far investigated if adaptation to web pages on the level of eye movement behavior emerges. Two recent studies examined the course of attention when web pages were presented repeatedly by analyzing scanpaths. Josephson and Holmes (2002) investigated the scanpaths on three very different web pages, which were presented repeatedly on three days, with inconclusive results. Only for some subjects did the data indicate the development of scanpaths that resemble each other across multiple observations. Instead, most similar scanpaths were found across subjects indicating a strong influence of stimulus properties on users’ attention. Moreover, this study was only of descriptive nature, since appropriate significance tests were not available for the applied type of eye movement analysis (optimal matching analysis; c.f. Holmes, 1997). Burmester and Mast (2010) used a different approach (T-pattern method; c.f. Magnusson, 2000) to analyze scanpaths across the repeated presentation of similarly structured web pages. They also found mixed results showing that there were often several different scanpaths shown by single persons. However, some subjects seemed to build up idiosyncratic scanpaths that occurred recurrently, but which were not primarily formed on the first exposure to a web page.
With respect to the cited findings, the present study takes up the question of potential changes in viewing behavior during repeated exposure to identical (Joseph & Holmes, 2002) or, at least, similarly designed web pages (Burmester & Mast, 2010). However, a different approach for analysis of eye-tracking data was used to investigate whether the findings on this issue previously reported are due to the narrow focus on scanpaths. The present study and corresponding analyses were not directed towards the congruency of concrete scanpaths, but rather to the same question that has been asked in both of the aforementioned studies: is there evidence for a time mediated attentional adaptation to web pages on the level of eye movement parameters? In more detail, we were interested in both a potential change in viewing behavior over time when observing a single web page as well as systematic changes in eye movements across multiple web pages as a signature of schema building.
Overall, results of previous research concerning the impact of web experience on schema building as well as eye movement parameters are controversial. Chalmers (2003) stated that many computer users have trouble learning and remembering information presented on a screen and that they do not have the ability to form a schema as indicated by disorientation with the human-computer interface. In contrast, Bernard (2001; 2002) showed that web users have general expectations about where to find specific pieces of information on web pages, but some studies did not find significant advantages for the common left-hand side placing of menus on web pages (e.g. Kalbach & Bosenick, 2003; Faulkner & Hyton, 2011), as also suggested for web page design by Nielsen (1999). Literature on eye movement behavior on web content showed that in general internet users initially locate their attention to the upper left of a webpage during the first seconds of viewing (e.g. Buscher, Cutrell & Morris, 2009, Betz, Kietzmann, Wilming & König, 2010) and that little inter-subject variance is observable during the initial phase of observation. However, the type of webpage (e.g. news, web search engines, or shopping) was found to significantly affect viewing behavior (Ollermann, Hamborg and Reinecke, 2004; Pan, Hembrooke, Gay, Granka, Feusner & Newman, 2004), but research also showed that web users can form an impression of a Web site in as little as 50 milliseconds (Lindgaard, Fernandes, Dudek, & Brown, 2006) and that users even rapidly adapt to an unexpected screen layout (McCarthy, Sasse, & Riegelsberger, 2003).
To conclude, results regarding the impact of web experience on users’ orientation and attention on web pages and research on scanpath formation are controversial (Joseph & Holmes, 2002; Burmester & Mast, 2010). Moreover, no clear evidence has been provided showing how viewing behavior on web pages is related to different eye movement parameters. The present study was conducted to bridge this empirical gap by analyzing several state-of-the-art gaze parameters in the field of scene perception. The present approach should vanquish some limitations of previous studies and illustrate an alternative approach to scanpath analyses in the context of web page observation.
In accordance with current websites, the web pages used were consistent regarding navigation bars, menus, and visual design, but varied in the products they offered. We selected a browsing task in which subjects were asked to search for offers that may be of interest to them. Thus, the present study should be of high ecological validity with respect to usual web browsing.
We hypothesized that web users learn the structure of the visual input and hence adapt their viewing behavior to the stimulus material. More specific, we hypothesized:

Within web page hypotheses (H1):

H1a: As suggested by findings of Ollermann et al. (2004) we expected increasing fixation durations over time while observing a web page as well as a decrease of saccade length. Longer saccades are necessary to extensively scan the web page in the initial phase of observation.
H1b: Since the length of saccades do not necessarily correlate with the extent of scanned image regions, we additionally analyzed the spread of fixation density maps and expected a more locally oriented focus of attention later in time.
H1c: According to the finding that users initially locate their attention to the upper left of a webpage and neglect the right side of web pages during the first seconds of viewing (Buscher, Cutrell & Morris, 2009, Betz et al., 2010), we expected a specific temporal course of the attentional focus on single web pages.
H1d: Finally, the inter-subject variance of fixation distributions should increase with observation duration. Attention is expected to be more stimulus-driven at the beginning of web page observation, whereby top-down mechanisms such as individual interest should be more influential later in time as suggested by verbal reports gathered in the context of scene perception (Kaspar & König, 2011).

Across web pages hypotheses (H2):

H2a: In accordance with findings of changes in viewing behavior on repeatedly presented complex scenes (Kaspar & König, 2011), a schema building across structurally similar designed web pages should be expressed by a decrease of saccade length (c.f. also Kaspar & König, in press) paralleled by longer fixation durations.
H2b: The concept of contextual cueing (Chen, 2002) suggests that learned visual cues such as the universal structure of all present web pages may reduce the novelty of subsequent pages, which in turn leads to sucessively more efficient exploring behavior at later presented pages of a web site i.e. a strengthened focus on interesting regions. Supported by corresponding findings in the field of scene perception (Kaspar & König, 2011; Kaspar & König, in press), we expected subjects to show less flat fixation density maps for later observed web pages.
H2c: Furthermore, participants should successively learn that some web page regions are of little interest for them. Consequently, a more and more systematic temporal course of the observer's attentional focus should be detectable across web pages on the individual level.
H2d: Finally, such a successivly primed temporal course of the individual attentional focus should also lead to an increase in the variance of inter-subject fixation distributions.

2. Method

Experimental Protocols

Participants. 63 subjects participated who were unaware of the purpose of the study. We used a sample with high variance in age to allow generalization to a wide range of internet users since some previous studies revealed age-cohort effects on viewing behavior (Grahame, Laberge, & Scialfa, 2004; McPhee, Scialfa, Dennis, Ho, & Caird, 2004; Acik, Sarway, Schultze-Kraft, Onat, & König, 2010). Subjects’ age was normally distributed with a mean of 31.7 years (range: 14-63; SD=12.76). All participants had normal or corrected-to-normal vision. They signed a written consent form to participate in the experiment. The study conformed to the Code of Ethics of the American Psychological Association, to the Declaration of Helsinki, and to applicable national guidelines.
Stimuli. Six web pages from a popular commercial internet shop (Bertelsmann Online Library) served as stimuli. On each page products of a certain category were offered (e.g. DVDs, computer games or books). Each web page was divided into a product description area in the center of the page with web page specific content (central region) and a surrounding navigation area (peripheral region). As Figure 1 shows, all web pages had the same navigation bars at the top, menus with links to specific product classes on the left and right side, as well as a central region depicting products of the current category (left-aligned). The homepage (web page 1) differed from the following five product presentation pages in a two-column format in the central region. Every web page contained fixed elements (background elements and navigation bars) as well as varying ones (specific links and symbols in the menus as well as the current products offered). Images had a resolution of 1280x1024 pixels.
Apparatuses. Stimuli were presented on a 19-inch Belinea Type 106075 CRT Monitor (Belinea, Germany). Screen distance was approximately 45cm and display resolution was chosen to fit the image resolution of 1280x1024 pixels, refresh rate was 75Hz. No headrest was used in order to facilitate normal viewing behavior. Participant’s eye movements were recorded by an Eye-Link I system (SR Research, Ontario, Canada), which used infrared pupil tracking at a sampling rate of 250Hz and compensates for head movements. In order to calibrate the system participants made saccades to a grid of 9 fixation spots on the screen, which appeared one by one in a random order. Eye position data was collected binocularly and analyzed for the eye which produced better spatial accuracy; a calibration error below 0.5° visual angle. To control for slow drifts in measured eye movements after each stimulus presentation, a fixation spot appeared in the middle of the screen. Fixations and saccades were detected and parameterized automatically by the eye-tracker. The first fixation of each trial was excluded from analysis since its localization was an artifact of the preceding fixation spot used for drift correction. The timings of eye movements were extracted automatically from raw data along with the coordinates of saccade and fixation start- and end-points by the Eye Link I system. Further analysis of data was conducted by using MATLAB (MathWorks, Inc.).
Eye Tracking Procedure. Before the eye tracking session started all participants first filled out a short questionnaire asking for demographic information. The room was darkened during the eye-tracking session in which each participant saw consecutively all six web pages of the shop’s website. Subjects were instructed to observe the web pages and to look for interesting offers. This instruction was selected to encourage a browsing mode for the following reasons: (1) in contrast to a searching mode users are in an free viewing mode with less precise intentions as also realized in the study of Burmester and Mast (2010) in which participants were instructed to “freely explore whatever is of interest” (p.8). Moreover, Kaspar & König (2011) also used a free-viewing condition to investigate the time-dependent course of attention on complex scenes. (2) A specific task may directs participants’ attention to specific elements on the web pages and would hamper the general impact of the low-level cues and structure on the attention we were interested in (for a deeper discussion of high-level versus low-level influences on overt attention see e.g. Hamborg, Bruns, Ollermann & Kaspar, in press; Kaspar & König, in press). (3) As pointed out by Burmester and Mast (2010), browsing “was considered a common activity on the webpages used as stimuli.” (p8). Finally, subjects were also told not to click on any links in order to ensure comparability with the study of Josephson & Holmes (2002). Presentation duration was 12sec. for each page which is comparable with other web page studies (e.g. 15sec. in Josephson & Holmes, 2002; 12sec. in Betz, Kietzmann, Wilming, & König, 2010; 10sec. in Burmester and Mast, 2010). The presentation sequence was the same for all subjects and corresponded to the internal structure of the internet shop to achieve high ecological validity and to allow some special analyses. Each participant began at the homepage of the shop and was automatically navigated through the shop pages according to the sequence of tabs in the navigation bar. After the experiment, participants were informed of the purposes and details of the experiment.

Data Analysis

In the scope of our hypotheses, eye-tracking data was analyzed for (1) the mean fixation duration (H1a & H2a), (2) the mean saccade length as an indicator for the visual step size used by subjects to scan the web pages (H1a & H2a), (3) the individual fixation distribution by means of a progressive entropy analysis indicating the amount of subject’s visual exploring behavior (H1b & H2b) and (4) the congruency of fixation maps across time (H1c & H2c) as well as between subjects (H1d & H2d).
Saccade parameters. We excluded the first fixation of each trial because the localization and duration were artifacts of the preceding fixation spot used for drift correction. Fixations whose duration was beyond two standard deviations from the grand mean or below 40ms (c.f. Rayner; 1998; Henderson & Hollingworth, 1999) were also excluded. This limits the potential influence of outliers and biases in results. Fixation duration was calculated by the eye tracking system online. Saccade length was operationalized by the Euclidean distance between two consecutive fixations marked by their two-dimensional coordinates in image space.
Individual fixation distribution. To measure the extent of web page exploration, we selected an approach that, on the one hand, prevents definitions of regions of interest and specific or erroneous assumptions about the relationship between them. This measure was intended to be interpreted independently of other eye movement parameters. Hence, the spread of fixation distributions was analyzed independently of specific geometrical arrangements. For this, we employed the concept of entropy (c.f. Acik et al., 2010; Kaspar & König, 2011). The fixation distribution map of a subject s viewing a certain web page w was convolved with a Gaussian kernel to produce a corresponding fixation density map (FDM). The full width at half maximum (FWHM) of the Gaussian kernel defining the size of the patch was set to 1° of visual angle. The entropy E was calculated with the standard MATLAB (MathWorks, Inc.) function according to Jemr 04 00009 i001 whereby x indicates the image space. Higher entropy values indicate a more spread out distribution and hence indicate a more exploratory viewing behavior (see Figure 2). Extreme values occur for singular distributions (minimum) and a flat distribution (maximum).
In the next step, we applied a straightforward bootstrapping technique to the entropy values. We decided to do so, since estimators of entropy are generally influenced by sample sizes (i.e. Hausser & Strimmer, 2009), and in the domain of eye-tracking data by few fixations (Wilming, Betz, Kietzmann, & König, in press). No general unbiased estimator is available at this point in time although this instance has been in question for several decades (c.f Miller, 1955). The bootstrapping approach was carried out as following (see also Kaspar & König, 2011): We randomly sampled 30 fixation points out of all fixations made on a web page by a single subject and calculated the corresponding entropy value. This was done with 100 repetitions and finally the mean entropy Ē(w, s) for subject s on web page w was computed. Fixation distribution maps constituted by a fixation number lower than 30 (4.8%) were excluded from bootstrapping analysis because a too small target number for down-sampling would lead to a large loss of power. At the end, this procedure results in a valid comparison of entropy measures of different sample sizes.
In order to check whether changes in the spread of fixation distributions was accompanied by changing saccade lengths, we computed a frequency analysis of saccade lengths (c.f. Casthelano et al., 2009; Kaspar & König, in press) to clarify whether the relative frequency of short/long saccades changed over time and across web pages. For that purpose, all saccades were assigned to one of twenty categories each containing saccades of a specific length (category 1: saccade length ≤ 1° visual angle; category 2: saccade length >1° and ≤ 2°; …; category 20: saccade length >19°).
The temporal course of the attentional focus. We partitioned the overall number of fixations made by a single subject with respect to the temporal occurrence of fixations. For each subset of fixations, the congruency of two FDMs was calculated. The analysis was initially done for the first ten fixations, then the next ten fixations, and so on. The procedure was always the same:
We first generated FDMs with a Gaussian Kernel of 3° visual angle (FWHM). This patch size models an attentional focus which size was chosen to provide an appropriate granularity of the web page partition independent of the image structure. We validated the results at the end by also using a visual angle of 1° and 2°. In fact, patch size does not affect relations between FDMs, only absolute correlation values depend on it.
In the second step, inter-correlations between FDMs of two successively presented web pages were calculated separately for each subject by applying standard MATLAB (MathWorks, Inc.) function according to Jemr 04 00009 i002 
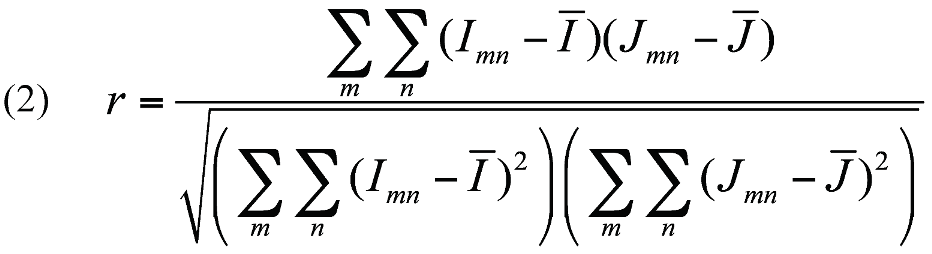
where m is the number of rows and n depicts the number of columns constituting the web pages. I and J indicate the FDMs of the web pages being correlated.
In the third step, all correlations were normalized by applying Fisher's z-transformation to allow averaging as suggested by several authors (e.g. Silver & Dunlap, 1987; Strube, 1988), though this transformation substitutes an underestimation when averaging correlation coefficients by a small overestimation when averaging corresponding z values (Hunter & Schmidt, 2004). However, this upward bias is of no importance in the present case since we focused on the relation between correlations of different FDMs and absolute correlation coefficient depends on selected visual angle as described above. Moreover, Fisher’s z transformation yields normal distributed data and rescales the correlation coefficient into an interval scale (Thorndike, 2007) and hence allows parametric testing.
After z-transforming correlation coefficients, all means of z values were tested against zero by computing one-sample t-tests to check for significant congruencies between FDMs of successively presented web page. Alpha-level was Bonferroni-adjusted due to multiple testing.
Finally, to test whether congruency of web pages’ FDMs increased across web pages, mean correlations between FDMs of successively presented web pages were statistically compared. For that purpose a univariate analysis of variance (ANOVA) for repeated measures was calculated.
This procedure was done for all subsets of fixations. Furthermore, we produced FDMs containing the first (second, third, etc.) ten fixations of all subjects to visualize the temporal relocation of the attentional focus in general (1° visual angle FWHM for a fine grained visualization).
Inter-subject variance of fixation distributions. To quantify to which extent the fixation distributions of subjects s overlap one another, the inter-subject variance of FDMs V(w) for web page w was calculated by Jemr 04 00009 i003 
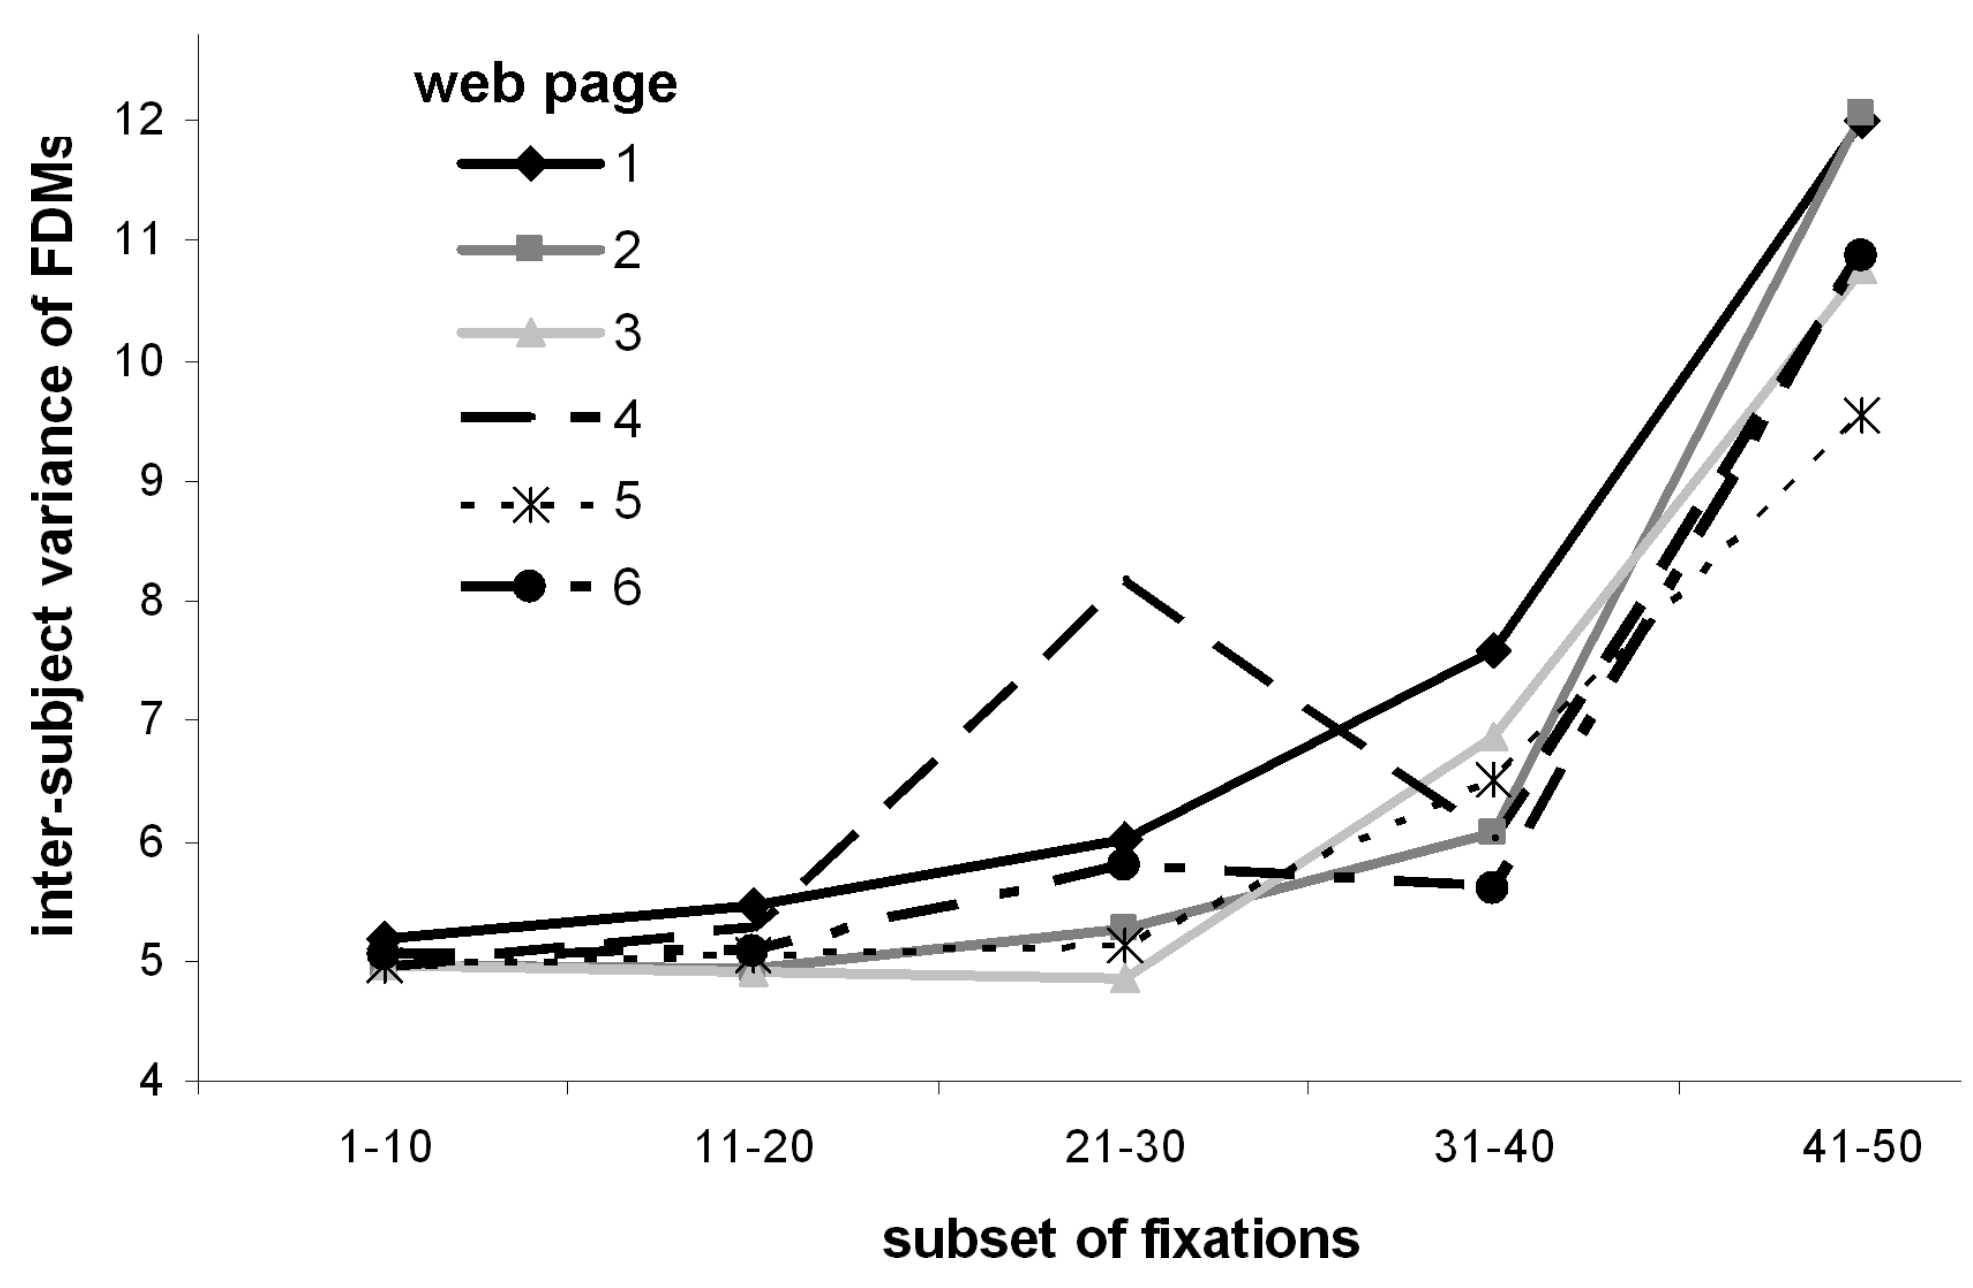
(c.f. Kaspar and König, 2011). This calculated how much the fixation behavior of subjects deviated from the average fixation behavior of subjects on a specific web page w. The higher V(w), the more variance between individual fixation distributions exist and the lower the inter-subject reliability of fixation distributions. In accordance with the analysis of the temporal course of the attentional focus described above, V(w) was calculated separately for the same subsets of fixations.

3. Results

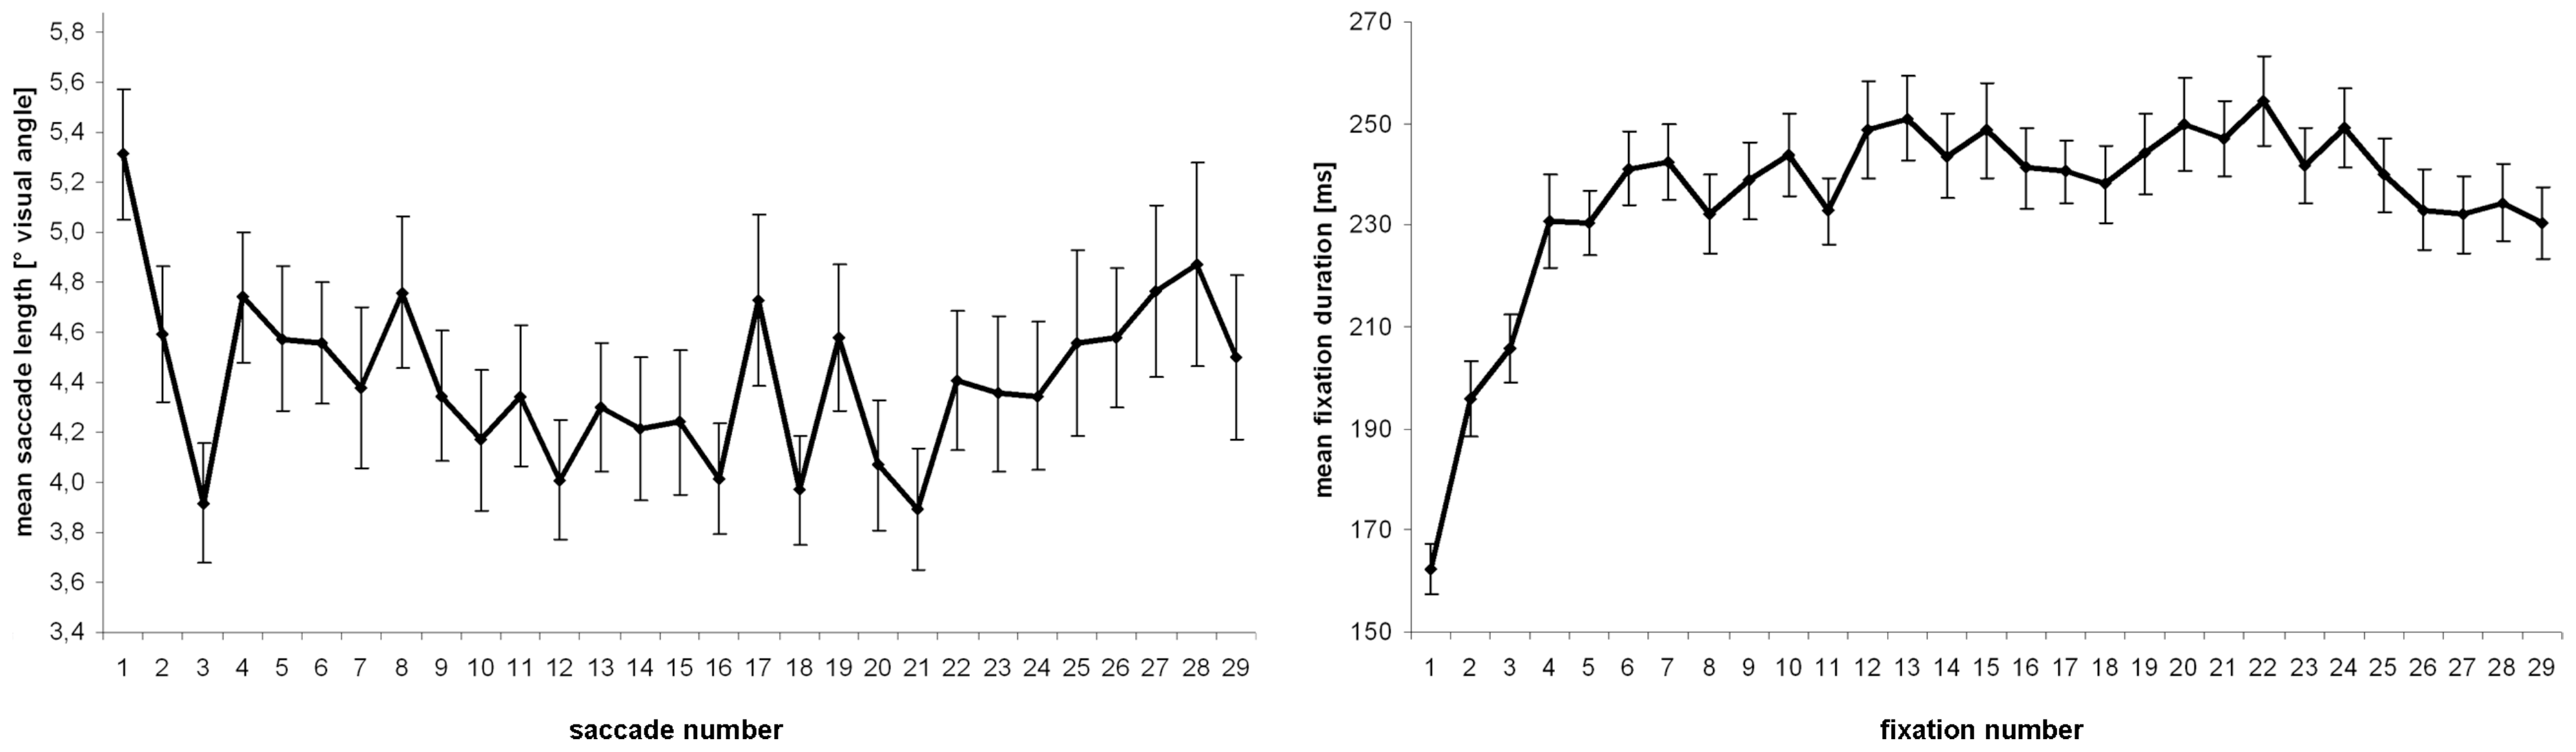
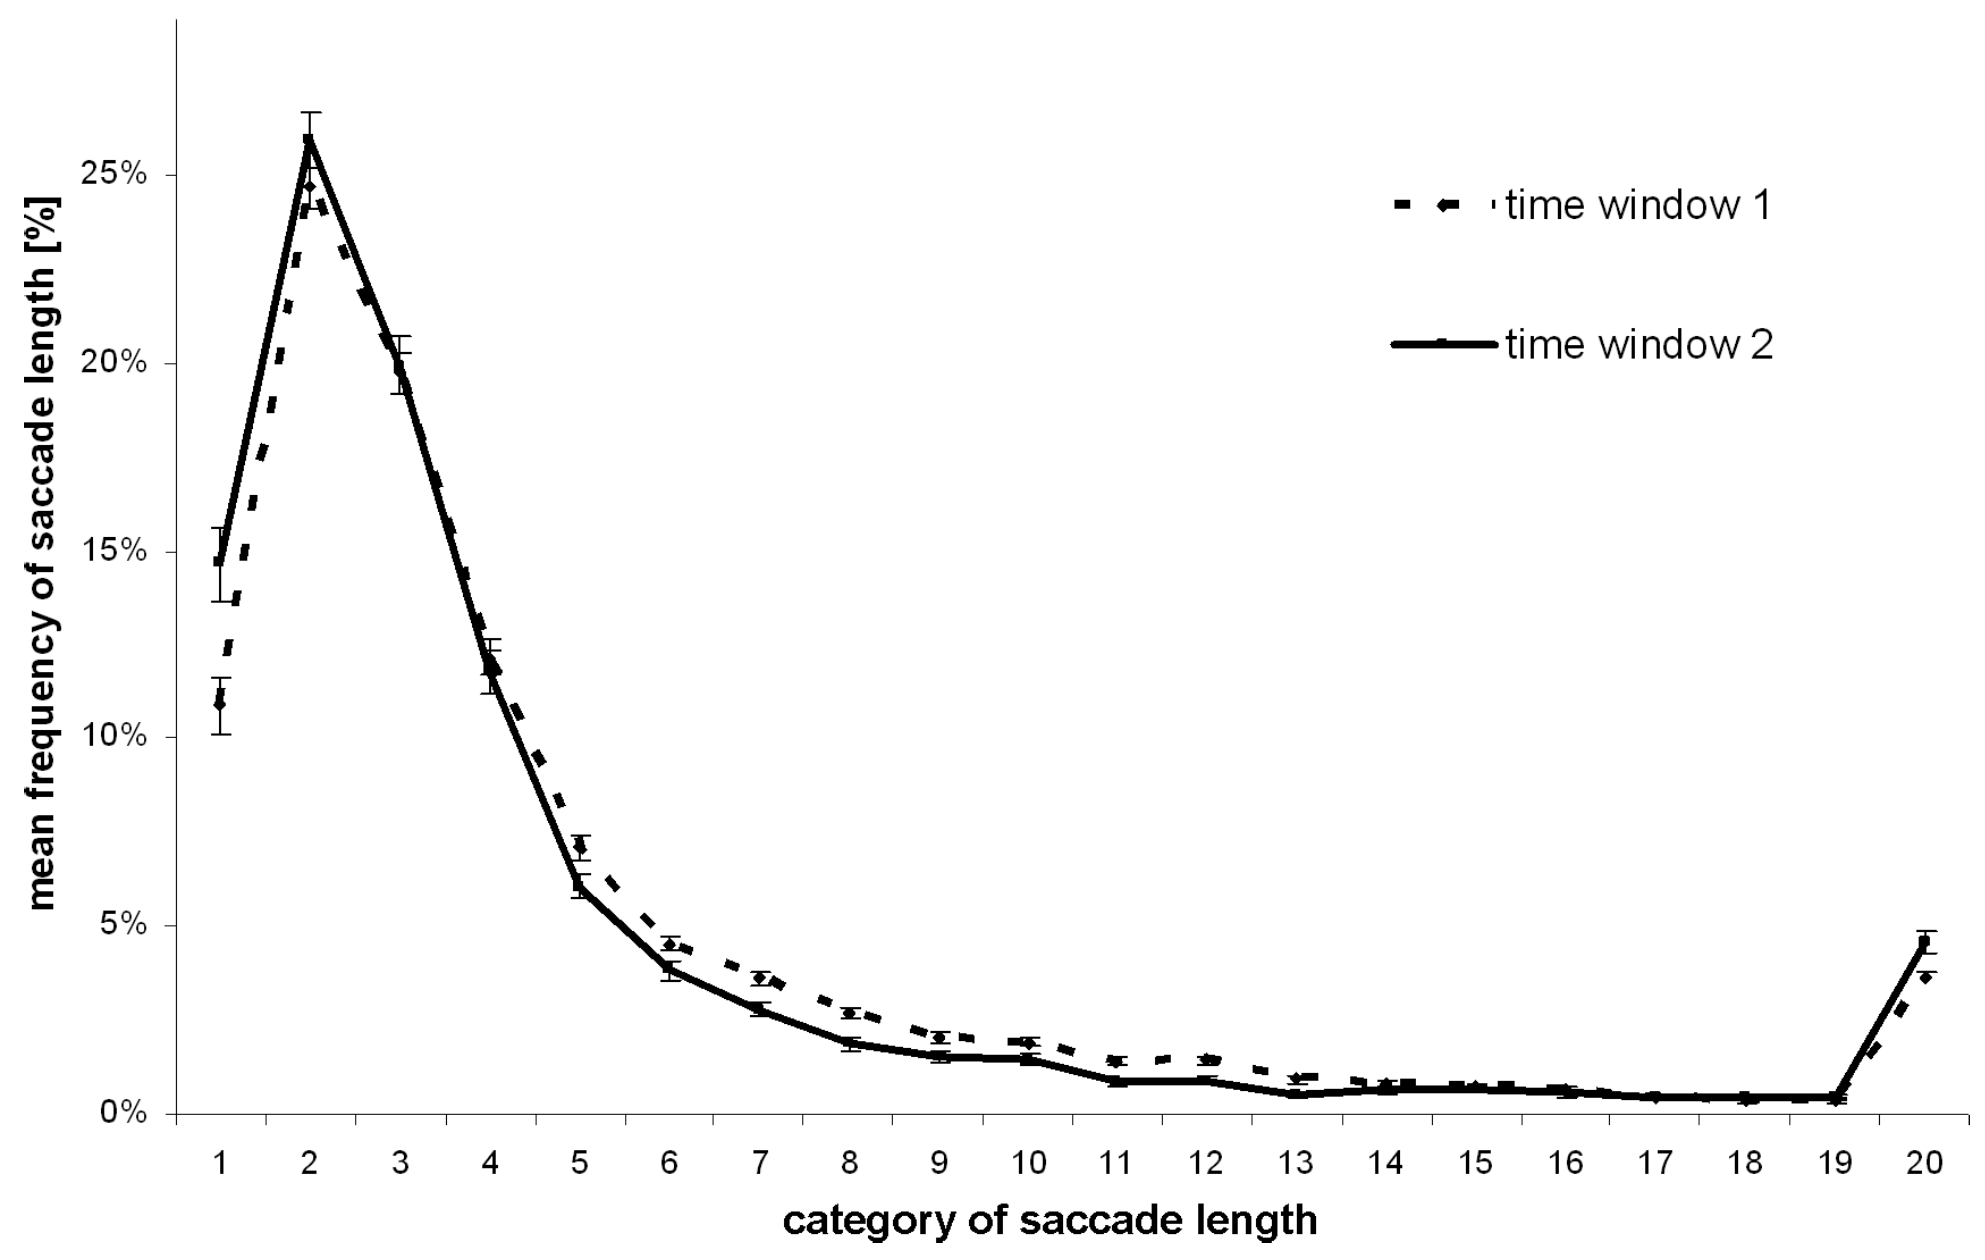
Saccade parameters and entropy

We expected a decrease in saccade length as well as an increase of fixation duration during the observation of one web page (H1a) as well as across similarly structured web pages (H2a). Additionally, individual fixation distributions measured by means of entropy (see formula 1) were expected to decrease over time on individual web pages (H1b) and across web pages (H2b) indicating a more local focus of attention. This result pattern was defined as one central indicator for changes in viewing behavior and would be a clear hint, on the one hand, for a more local scanning of single web pages later in time, and, on the other hand, for a schema building process across web pages leading to a more efficient exploration of later presented pages.
The observation time of one web page (12 seconds) was divided into two time windows of 6 seconds each in order to allow the investigation of a time effect on saccade parameters and the visual explorativeness, i.e. on entropy.
To check the predictions, we first computed a multivariate analysis of variance (MANOVA) for repeated measures to consider potential dependencies between eye movement parameters. The design was 2x6 (time window x web page) with saccade length, fixation duration, and entropy as dependent variables. In case of significant multivariate effects, univariate ANOVAs (Greenhouse-Geisser applied) were subsequently computed to scrutinize significance of each dependent variable separately. This two-step procedure is the most common and accepted method for interpreting the results of a MANOVA (c.f. Tabachnick & Fidell, 2007).
Saccade length (H1a & H2a). The 2x6 MANOVA revealed a significant main effect of the factor “time window” [Wilk’s lamda=.486, F(3, 46)=16.241, p<.001, ηp2=.514] as well as for the factor “web page” [Wilk’s lamda=.381, F(15, 34)=3.683, p<.001; ηp2=.619], but no interaction between the two [Wilk’s lamda=.681; F(15, 34)=1.062, p=.424, ηp2=.319]. In contrast to H1a, univariate testing for saccade length revealed no significant difference between both time windows [F(1,62)=.209, p=.649, ηp2=.003] (Figure 3A). However, a significant difference between web pages was found [F(4.589, 284.548)=4.188, p<.01, ηp2=.063] (Figure 3B). Bonferroni-adjusted t-tests for pairwise comparisons of factor levels showed significant differences in saccade length between web page 1 (homepage) and web page 4 (p<.05), between pages 3 and 4 (p<.05) as well as a nearly significant difference between pages 2 and 3 (p=.07). This change in saccade length did not match the successive decrease across web pages as predicted in hypothesis H2a. On a fine-grained level we additionally analyzed the saccade length for the first 29 saccades by means of a 6x29 ANOVA (web page x actual fixation number). The analysis was limited to 29 saccades due to missing data with higher saccade number. As Figure 4 (left side) illustrates, no effect of the actual saccade number on saccade length was found [F(17.512, 1085.717)=1.384, p=.133, ηp2=.022], although a temporal minimum at the third saccade was observable. Hence, overall saccade lengths were quite constant over time. This observation was independent of the actual web page [no interaction effect: F(35.816, 2220.687)=1.204, p=.190, ηp2=.019]. The effect of the current web pages on saccade length was exactly replicated for the first 29 saccades [p<.001].
Fixation duration (H1a & H2a). A 2x6 ANOVA (time window x web page) concerning the duration of fixations revealed significantly longer durations in the second time window than in the first as predicted in H1a [F(1, 62)=37.056, p<.001, ηp2=.374] (Figure 3C), but in contrast to H2a no differences between web pages were found [F(4.127, 255.845)=.177, p=.953, ηp2=.003] (Figure 3D). The analysis of fixation duration was also deepened for the first 29 fixations by a 6x29 ANOVA (web page x actual fixation number) showing that fixation duration increased rapidly and reached an asymptotic level at the 6th fixation [F(13.757, 839.191)=7.956, p<.001, ηp2=.155] (see Figure 4 right side). This effect was independent of the web page [no interaction effect: F(36.369, 2218.504)=.932, p=.586, ηp2=.15]. As above, no differences in mean fixation duration between web pages was found for the first 29 fixations [p=.938].
Entropy and visual step sizes (H1b & H2b). The spread of fixation distributions in terms of entropy (formula 1) significantly differed between the first and second time window with higher values in the first one [F(1, 48)=16.152, p<.001, ηp2=.252] (Figure 3E). Thus, subjects’ attentional focus was more globally oriented during the first 6 seconds and changed to a more local mode in the second half looking at the web pages as predicted in H1b. Entropy also differed between web pages [F(3.811, 182.940)=2.966, p<.05, ηp2=.058] (Figure 3F). However, post-hoc t-tests revealed an increase of subjects’ individual fixation distributions across web pages instead of the predicted decrease (H2b): Entropy on web page 1 (homepage) was significant smaller than on subsequently presented web pages 3 and 5 (both p<.05).
In order to check whether the difference in entropy between both time windows derived from different visual step sizes, a frequency analysis of saccade lengths was computed. An effect on entropy may be caused by different visual step sizes that are used to scan the images, but higher entropy does not necessarily coincide with longer saccades. For that purpose, all saccades were assigned to one of twenty categories according to length. The absolute number of saccades of different lengths was transformed to percent values (c.f. Cathelano et al., 2009; Kaspar and König, in press). This was done separately for both time windows. A 2x6x20 ANOVA (time window x web page x saccade length) was calculated for statistical testing. The main interest of this analysis was to look for differences in saccade length frequency and its interaction with the actual time window. The frequency of saccade lengths differed significantly [F(3.460, 214.522)=447.418, p<.001, ηp2=.878]. Not surprisingly, short saccades occurred more often than long saccades (Figure 5).
However, saccade length frequencies differed between both time windows [F(5.723, 354.827)=29.793, p<.001, ηp2=.325] as depicted in Figure 5. Subjects used relatively more short saccades in the second time window. That is, web pages were observed with longer saccades at the beginning in order to scan the pages more extensively as also indicated by higher entropy values (Figure 3E). When web pages became more familiar subjects changed their visual step size to scrutinize regions of interest and consequently entropy decreased. Importantly, this interactional effect was independent of the actual web page observed [three-way interaction: F(21.246, 1317.240)=.909, p=.580, ηp2=.014] and hence this strategy did not change across repeated observations of structurally identical web pages. Saccade length frequencies were finally moderated by the actual web page, but effect size was very small in contrast and no clear structure was detectable [F(17.852, 1106.836)=2.056, p<.01, ηp2=.032].
To sum up, these results do not indicate a substantial adaptation of viewing behavior to similarly structured web pages across multiple viewings (across web pages hypothesis H2). Fixation durations did not change across pages, the length of saccades did not show the expected continuous decrease and entropy values even increased. Consequently, when observing a series of web pages being part of a website, subjects do not show a successively efficient exploring behavior in terms of a primed focus on interesting regions at later pages. Observers significantly adapted their viewing behavior to individual web pages over time (within web pages hypothesis H1). This is supported by longer durations of fixations in the second time window due to an initial increase after web page onset. The mean length of saccades did not change over time, but the frequencies of saccade lengths did change: subjects used short saccades more frequently later in time to scrutinize regions of interest. This assumption is additionally supported by a significant decrease in the spread of fixation distributions from the first to the second half of observation time.

The time course of the attentional focus (H1c & H2c)

To see whether subjects adjust their attentional focus to web pages in a specific sequence, we separately analyzed subsets of fixations according to the temporal domain. First, we analyzed to which amount subjects’ FDMs of two successively presented web pages fit together (i.e. FDMs of web pages 1 vs. 2, 2 vs. 3, 3 vs. 4, 4 vs. 5 and 5 vs. 6; see formula 2), whereby only the first ten valid fixations were considered. Fischer’s z-transformed correlations between two successive FDMs were computed separately for each subject. Then these correlations were averaged across subjects to get the mean congruency of FDMs which was subsequently tested against zero by one-sample t-tests (Bonferroni-adjusted alpha level applied). Regarding the first ten fixations, the congruency of FDMs differed significantly from zero [all t(62)>7.411, all p<.001] (Figure 6, very left column, bottom row). Hence, fixated regions correlated positively between successive web pages. Given this congruency of fixated regions, we tested whether the extent to which this overlap changed across web pages. For that purpose, the pairwise correlations between FDMs were statistically tested against each other by repeated measures ANOVA (Greenhouse-Geisser applied).
Regarding the first ten fixations, a significant increase in the correlation between FDMs of successively presented web pages revealed with a temporary maximum in congruency between FDMs of web pages 3 and 4 [F(3.173, 196.711)=6.980, p<.001, ηp2=.101]. For each web page, we produced FDMs containing the first ten fixations of all subjects to visualize the attentional focus in general (see Figure 6, very left column).
For the next ten fixations (11-20; see Figure 6, second column) no significant change was found regarding the congruency between FDMs of successive web pages [F(2.545, 155.264)=.531, p=.632, ηp2=.009], but the FDMs’ congruency differed significantly positively from zero [all t(62)>2.624, all p<.01]. However, congruencies were much smaller than for the first ten fixations.
The next ten fixations (21-30) revealed no significant change in the congruency of FDMs [F(2.978, 181.659)=.406, p=.747, ηp2=.007], but they differed positively from zero [all t(62)>2.873, all p<.01].
For the fourth interval of ten fixations (31-40), again there was no significant change in z-transformed correlations between FDMs of consecutively presented web pages was found [F(1.903, 112.268)=1.677, p=.193, ηp2=.028], whereas the mean congruency between the FDMs of web pages 4 and 5, as well as between web pages 5 and 6, differed significantly positively from zero [both t(60)>2.774, both p<.01].
No significant change in z-transformed correlations was found [F(1.049, 29.378)=.901, p=.355, ηp2=.031] with respect to the fifth interval (41-50), but mean z-transformed correlations between FDM of web pages 4 and 5 as well as between web pages 5 and 6 differed positively from zero [maximal t(39)>1.437, all p>.159].
For all following fixations (>50) no further statistical testing was applicable due to missing data. However, FDMs containing all fixations of subjects providing more than 50 fixations were constructed to illustrate the spatial bias towards the lower border of the screen.
This result pattern shows that the time-dependent relocation of subjects’ attentional focus on a single web page remained stable across web pages (c.f. Figure 6). Participants started with a dominant left bias of fixations concentrated on the upper half of on each web page. Fixations successively spread out to the right. The lower half of web pages was focused on later in time. Fixation distributions of the different web pages were positively correlated over time, and this congruency increased across web pages even for late fixations. This indicates an increasingly primed sequence of the time-dependent changes in attentional focus across web pages, but this effect was especially pronounced for the first ten fixations after web pages’ onset.

Inter-subject variance of fixation distributions (H1d & H2d)

As Figure 6 suggests, the inter-subject variance of fixation distributions on individual web pages increased over time. To quantify this observation, the inter-subject variance of FDMs (see formula 3) was calculated separately for each subset of fixations. Figure 7 shows that the overlap between subjects’ fixation distributions decreased significantly across the subsets of fixations independently of the web page [Friedman-test: χ2 (4)=19.333; p<.001. The inter-subject variance was maximal in the fifth interval of fixations (41-50). Consequently, subjetcs observed strong overlapping web page regions at the beginning, but switched their attention to different regions later in time. Although no statistical testing of the predicted decrease of inter-subject variance in observed regions was applicable, at least no clear rank order of variance values was detectable via visual inspection of Figure 7.

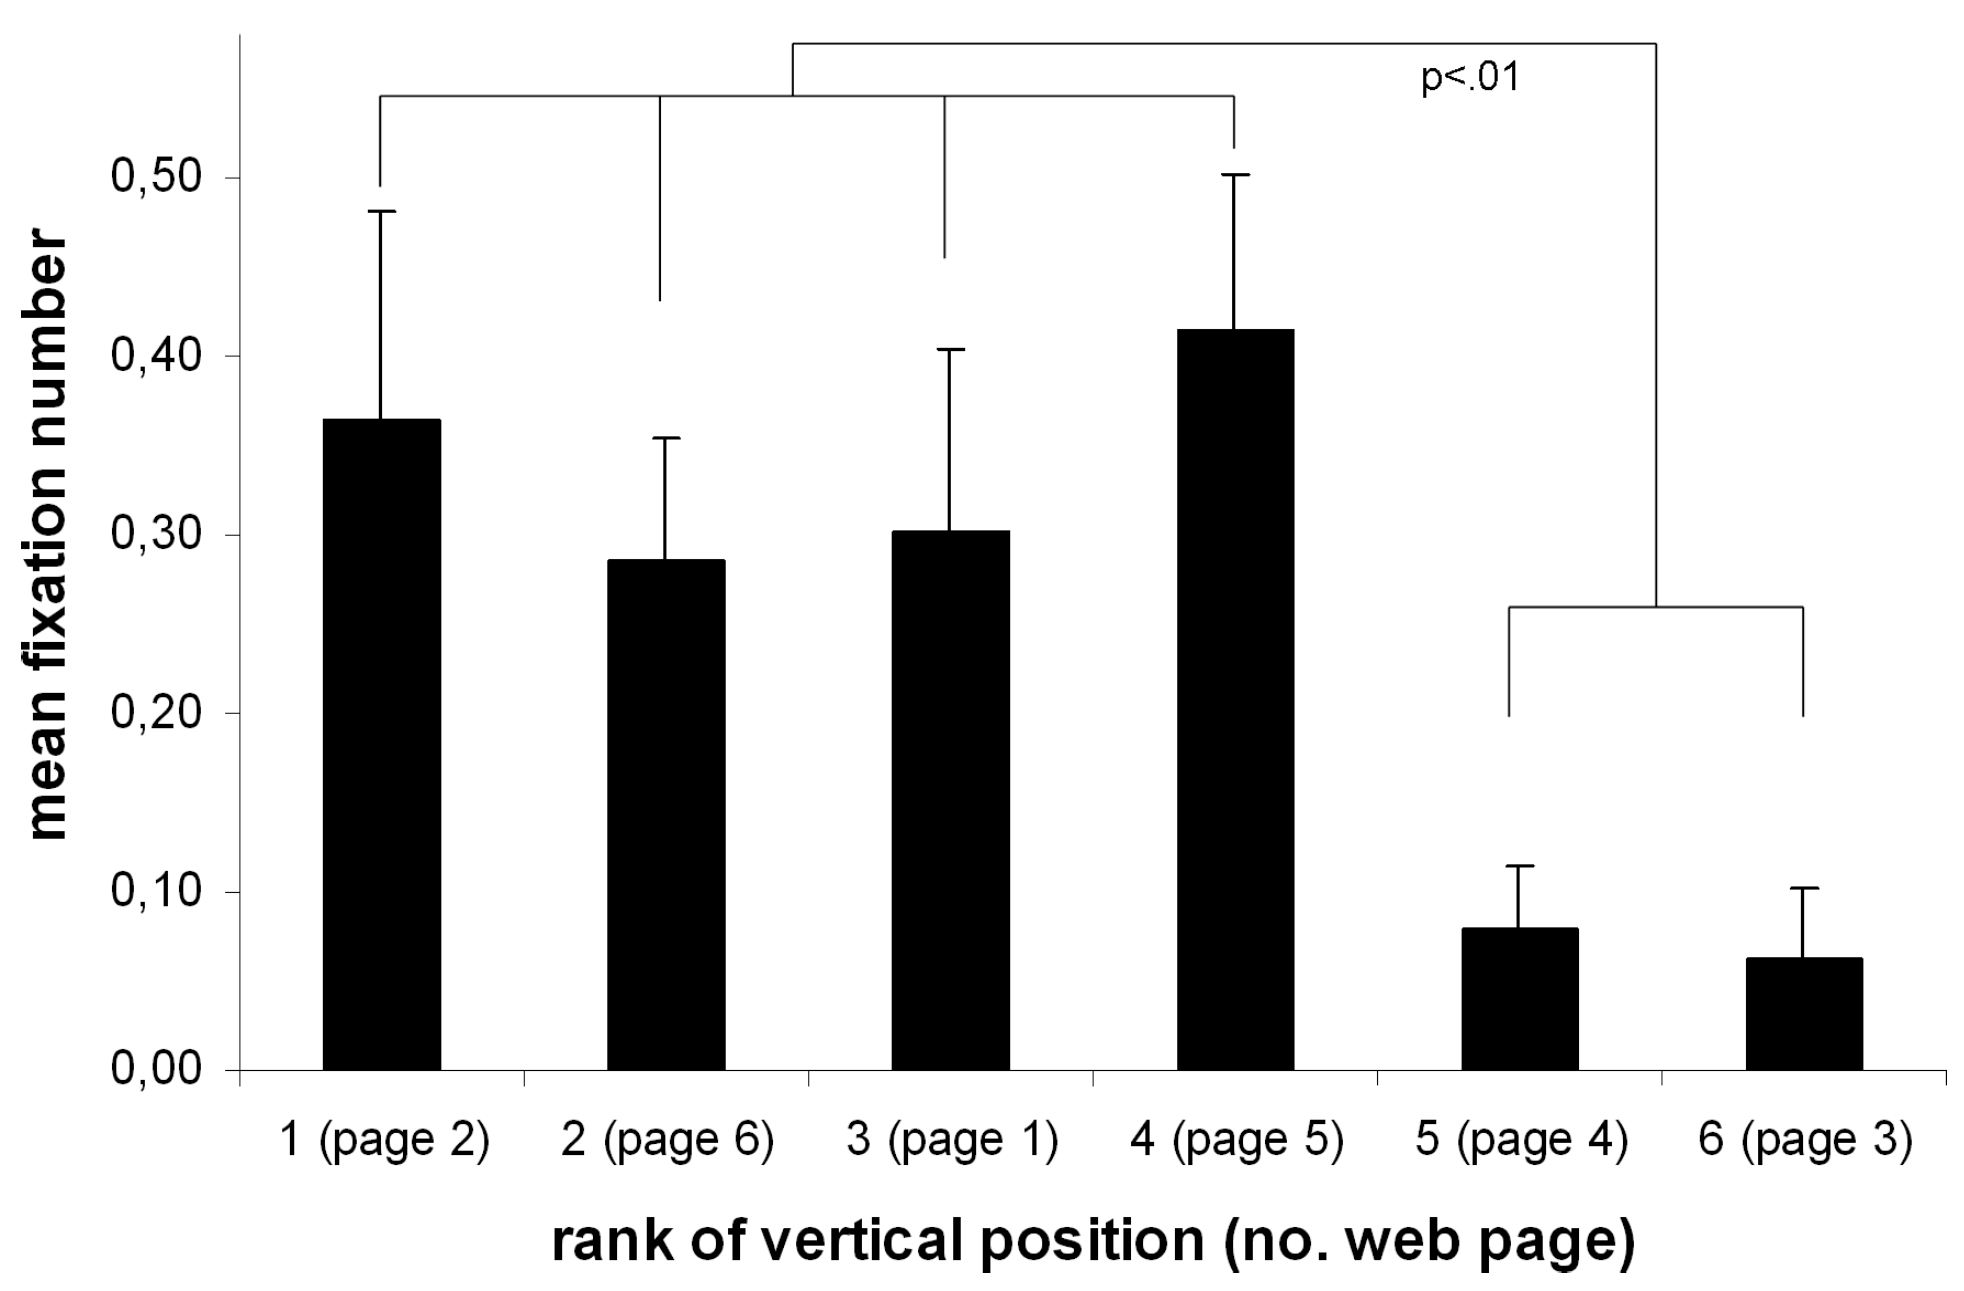
The influence of elements’ vertical position on fixation frequency (exploratory analysis)

As suggested by the result above (c.f. Figure 6), subjects tended to shift their attentional focus to the lower half of a web page later in time. This leads to the question ofwhether the vertical position of a web page element affects fixation probability. To acquire additional evidence for this time-dependent effect, we analyzed the number of fixations on a selected visual element (a banner ad with the size of 4.7°x 1.6°) which changed only its vertical (i.e. not its horizontal) position across web pages. Although web pages differed in content, the banner was placed on each web page. The element was always positioned under the horizontal midline, but the vertical position differed between pages (range of 9° visual angle).
We calculated the number of fixations made on the banner on each web page. Pages were ranked according to the vertical position of the banner from the upper to the lower border of the screen. The banner was placed near the lower border on web pages 3 and 4., the vertical position of the banner was nearer to the horizontal midline on the other web pages. The mean frequency across pages 3 and 4 was statistically contrasted to the frequency averaged across the other four web pages. The banner was fixated on fewer times on pages 3 and 4 than on the other pages as depicted in Figure 8 [Wilcoxon-test: Z=-2.755, p<.01]. Although the number of fixations did not continuously decrease with increasing vertical distance between the banner and the horizontal midline of the screen, fixation probability was significantly smaller when the banner was placed near the lower border of the screen. Importantly, this spatial effect is linked to a temporal effect; regions near the lower edge of the screen were scanned relatively late during web page observation as shown in Figure 6.

4. Discussion

The present study investigates how viewing behavior on a single web page changes over time as well as across a series of similarly structured web pages. Surprisingly little research has previously addressed this issue. In this article we focused on several eye movement parameters and used an analytical approach that has not been practiced in this field before but is expected to enhance the evidence in this field of research.
First we found significant changes in subjects’ fixation duration and entropy measures indicating a habituation process over time while viewing an individual web page. Subjects’ attentional focus became more locally orientated later in time accompanied by a higher frequency of short saccades used to scan the pages. In contrast, after web page onset, the relative number of short saccades was smaller and subjects scanned the web pages more extensively as indicated by a more spread out fixation distribution. However, the mean length of saccades did not change over time, but the relative frequencies of short and long saccades did. The effect size and signature of this saccade length distribution is very similar to those found by Castelhano et al. (2009) with respect to the effect of different viewing tasks on eye movements under natural conditions. They also found short saccade lengths between 1° and 2° visual angle to occur most frequently. In contrast, Kaspar and König (in press) found a continuous decrease in the frequency of specific saccades with increasing length.
Moreover, fixation duration increased with time and reached an asymptotic level (ca. 240ms) after six fixations independent of web page content. These results suggest that subjects scrutinized specific high-interest regions after becoming increasingly familiar with a web page. The resulting pattern goes hand in hand with a specific sequence in which subjects relocate their attentional focus on a web page. Subjects generally began in the upper left quadrant and subsequently switched their attentional focus to the right side as well as to the lower half of web pages; regions near the lower edge of the screen were scanned relatively late while viewing a web page. The temporal course of attention was constant across web pages, which lead to a further interesting observation: the probability of fixating on a specific advertising element was significantly lowered when the ad was positioned near the lower border of the screen. A strong clustering of fixations in the upper left was also demonstrated by previous studies (e.g. Buscher et al. 2009, Betz et al., 2010). Hence it seems to be a general tendency possibly derived from a universal design of most of pages in the web (c.f. Nielsen, 1999).
Finally, the inter-subject variance of fixation distributions decreased across subsets of fixations independent of the web page. Subjects observed strong overlapping web page regions after onset, but switched their attentional focus to different regions later in time. The impact of salient web page elements seemed to be higher when initially viewing the web page, wheras subjects later switched their attention more to regions of individual interest. These results are also supported by previous findings of Hamborg et al. (in press), who found that highly salient banner ads on web pages attract attention primarily during the first few seconds of observation time. Moreover, in another study, 84% of subjects reported a strategy to focus on certain image regions of interest when natural scenes have become more familiar due to multiple observations (Kaspar and König, 2011), and about 18% of subjects also reported the impression that salient regions or objects seem to attract attention automatically after stimulus onset.
In contrast to the significant change in viewing behavior on individual web pages over time, we did not find strong evidence for a substantial change in eye movement behavior across several similarly designed web pages. This does not necessarily mean that no cognitive schema building emerges, as suggested by Chalmers (2003), who stated that many computer users have trouble learning and remembering information presented on a screen and that they do not have the ability to form a schema. With respect to eye movement signatures, we found mixed evidence for a perceptual schema formed by subjects across web pages. In the present study neither saccade parameters nor entropy showed the predicted changes across web pages. Rather we found a non-hypothesized result with respect to entropy quantifying the spread of fixation distributions, namely an increase of entropy across web pages. In contrast to this result the development of a cognitive schema of a website’s structure should have led to a more efficient visual search and hence a decrease of entropy values. In contrast, the spatial-temporal course of the attentional focus on later observed web pages was slightly primed by the preceding pages. Fixation distributions of different web pages were positively correlated, whereby this congruency increased across web pages even for late fixations (see Figure 6). This increase, however, was fairly small.
Hence it seems that subjects can utilize the acquired knowledge about the structure and the design of a website in order to direct their attention on its pages. In the present case, however, subjects’ attention was obviously more stimulus driven as was suggested by findings of Betz et al. (2010). Web pages differed regarding the type of products being offered. Apparently the instruction to search for interesting offers introduced a browsing mode in subjects that enforced the impact of the salient web page content. The stable impact of low-level image properties on fixation behavior across repeated image presentations under free viewing conditions was also found by a recent study of Kaspar and König (in press).
Although no statistical procedure was applicable to test potential differences in the inter-subject variance of fixation distributions between web pages, we found no indications for a systematic change across web pages via a descriptive analysis. If the universal structure of the used website had evoked a schema building process with respect to viewing behavior, this should have led to a systematic decrease of inter-subject variance in observed web page regions. This was, however, not the case.

5. Conclusion

To sum up, temporal changes in eye movement parameters are large on a single web page, but not across similarly structured pages. Consequently, we did not find evidence for a substantial habituation to web pages across multiple viewings on the level of eye movement parameters. Of course, this result could be due to the free viewing search task used in the study. Effects may be different for other tasks, for example when subjects are instructed to interact with a website instead of just to look at it. Further research should reveal potential task dependency effects in the context of repeated web page viewing. Task dependency of overt attention is generally known in the field of attention research (Triesch, Ballard, Hayhoe, & Sullivan, 2003; Nelson, Cottrell, Movellan, & Sereno, 2004; Rothkopf, Ballard, & Hayhoe, 2007; Einhäuser, Spain, & Perona, 2008; Betz et al., 2010; Hamborg et al., in press), but to our knowledge no study yet exists that investigates this issue in the context of repeated viewing of identical or similarly designed web pages. It is important to deepen this research since it is much more ecologically valid than the singular web page observation that is used in most eye tracking studies.
In addition to potential task effects, future studies should also address the question whether a more substantial adaptation of web users’ viewing behavior to the structure of web pages could arise if users were confronted more frequently with the pages than in the present study. Perhaps, the observation of six pages was too small of a sample to induce a stronger schema building process.

6. References

  1. Acik, A., A. Sarwary, R. Schultze-Kraft, S. Onat, and P. König. 2010. Developmental changes in natural viewing behavior: bottom-up and top-down differences between children, young adults and older adults. Frontiers in Perception Science 1: Article 27. [Google Scholar]
  2. Antes, J. R. 1974. The time course of picture viewing. Journal of Experimental Psychology 103, 1: 62–70. [Google Scholar] [CrossRef] [PubMed]
  3. Bernard, M. L. 2001. Developing schemas for the location of common web objects. Proceedings of the Human Factors and Ergonomics Society-45th Annual Meeting; pp. 1161–116. [Google Scholar]
  4. Bernard, M. 2002. Examining user expectations for the location of common E-Commerce web objects. From http://www.surl.org/usabilitynews/41 /web_object-ecom.asp (Retrieved Nov. 7, 2011).
  5. Betz, T., T. C. Kietzmann, N. Wilming, and P. König. 2010. Investigating task-dependent top-down effects on overt visual attention. Journal of Vision 10: 1–14. [Google Scholar] [CrossRef] [PubMed]
  6. Brockmole, J. R., and J. M. Henderson. 2006. Recognition and attention guidance during contextual cueing in real-world scenes: Evidence from eye movements. The Quarterly Journal of Experimental Psychology 59, 7: 1177–1187. [Google Scholar] [CrossRef]
  7. Burmester, M., and M. Mast. 2010. Repeated web page visits and the scanpath theory: A recurrent pattern detection approach. Journal of Eye Movement Research 3, 4: 1–20. [Google Scholar] [CrossRef]
  8. Buscher, G., E. Cutrell, and M. R. Morris. 2009. What do you see when you’re surfing? Using eyetracking to predict salient regions of web pages. Proceedings of CHI 2009, 21–30. [Google Scholar]
  9. Casthelano, M. S., M. L. Mack, and J. M. Henderson. 2009. Viewing task influences eye movement control during active scene perception. Journal of Vision 9, 3: 6. http://journalofvision.org/9/3/6/. [CrossRef]
  10. Chalmers, P. A. 2003. The role of cognitive theory in human-computer interface. Computers in Human Behavior 19: 593–607. [Google Scholar] [CrossRef]
  11. Chun, M. M. 2002. Contextual cueing of visual attention. Trends in Cognitive Science 4: 170–177. [Google Scholar] [CrossRef]
  12. Cockburn, A., and B. McKenzie. 2001. What do web users do? An empirical analysis of web use. International Journal of Human-Computer Studies 54: 903–922. [Google Scholar] [CrossRef]
  13. Einhäuser, W., M. Spain, and P. Perona. 2008. Objects predict fixations better than early saliency. Journal of Vision 8, 14: 18. http://journalofvision.org/8/14/18/. [CrossRef]
  14. Faulkner, X., and C. Hayton. 2011. When left might not be right. Journal of Usability Studies 6: 245–256. [Google Scholar]
  15. Foulsham, T., and G. Underwood. 2008. What can saliency models predict about eye movements? Spatial and sequential aspects of fixations during encoding and recognition. Journal of Vision 8, 2: 6. http://journalofvision.org/8/2/6/. [CrossRef]
  16. Friedman, A. 1979. Framing pictures: The role of knowledge in automatized encoding and memory for gist. Journal of Experimental Psychology: General 108: 316–355. [Google Scholar] [CrossRef] [PubMed]
  17. Grahame, M., J. Laberge, and C. T. Scialfa. 2004. Age differences in search of web pages: The effect of link size, link number, and clutter. Human Factors. Journal of the Human Factors and Ergonomics Society 46: 385–398. [Google Scholar] [CrossRef] [PubMed]
  18. Hamborg, K.-C., M. Bruns, F. Ollermann, and K. Kaspar. in press. The Effect of Banner Animation on Fixation Behavior and Recall Performance in Search Tasks. Computers in Human Behavior. [Google Scholar] [CrossRef]
  19. Harding, G., and M. Bloj. 2010. Real and predicted influence of image manipulations on eye movement during scene recognition. Journal of Vision 10, 2: 8. http://journalofvision.org/10/2/8/. [CrossRef] [PubMed]
  20. Hausser, J., and K. Strimmer. 2009. Entropy inference and the James-Stein estimator, with application to nonlinear gene association networks. Journal of Machine Learning Research 10: 1469–1484. [Google Scholar]
  21. Henderson, J. M., and A. Hollingworth. 1999. High-level scene perception. Annual Review of Psychology 50: 243–271. [Google Scholar] [CrossRef]
  22. Henderson, J. M., P. A. Weeks, Jr., and A. Hollingworth. 1999. Effects of semantic consistency on eye movements during scene viewing. Journal of Experimental Psychology: Human Perception and Performance 25: 210–288. [Google Scholar] [CrossRef]
  23. Holmes, M. E. 1997. Optimal matching analysis of negotiation phase sequences in simulated and authentic hostage negotiations. Communication Reports 10: 1–8. [Google Scholar] [CrossRef]
  24. Hunter, J. E., and F. L. Schmidt. 2004. Methods of meta-analysis: Correcting error and bias in research findings. Thousand Oaks: Sage Publications. [Google Scholar]
  25. Josephson, S., and M. E. Holmes. 2002. Attention to repeated images on the World-Wide Web: Another look at scanpath theory. Behavior Research Methods, Instruments,& Computers 34: 539–548. [Google Scholar]
  26. Kalbach, J., and T. Bosenick. 2003. Web page layout: A comparison between left-and right-justified site navigation menus. Journal of Digital Information 4. [Google Scholar]
  27. Kaspar, K., and P. König. 2011. Overt attention and context factors: The impact of repeated presentation, image type, and individual motivation. PLoS ONE 6, 7: e21719. [Google Scholar] [CrossRef] [PubMed]
  28. Kaspar, K., and P. König. in press. Viewing behavior and the impact of low-level image properties across repeated presentations of complex scenes. Journal of Vision. [Google Scholar] [CrossRef]
  29. Lindgaard, G., G. J. Fernandes, C. Dudek, and J. Brown. 2006. Attention Web designers: You have 50 milliseconds to make a good first impression! Behaviour and Information Technology 25: 115–126. [Google Scholar] [CrossRef]
  30. Loftus, G. R., and N. H. Mackworth. 1978. Cognitive determinants of fixation location during picture viewing. Journal of Experimental Psychology: Human Perception and Performance 4: 565–572. [Google Scholar] [CrossRef]
  31. Magnusson, M. S. 2000. Discovering hidden time patterns in behavior: T-patterns and their detection. Behavior Research Methods, Instruments, & Computers 31: 93–110. [Google Scholar]
  32. McCarthy, J. D., M. A. Sasse, and J. Riegelsberger. 2003. Could I have the menu please? An eye tracking study of design conventions. Proceedings of HCI 2003, 8–12. [Google Scholar]
  33. McPhee, L. C., C. T. Scialfa, W. M. Dennis, G. Ho, and J. K. Caird. 2004. Age differences in visual search for traffic signs during a simulated conversation Human. Factors: The Journal of the Human Factors and Ergonomics Society 46: 674–685. [Google Scholar] [CrossRef] [PubMed]
  34. Miller, G. 1955. Edited by H. Quastler. Note on the bias of information estimates. In Information theory in psychology II-B. Glencoe, IL: Free Press. [Google Scholar]
  35. Nelson, J. D., G. W. Cottrell, J. R. Movellan, and M. I. Sereno. 2004. Yarbus lives: A foveated exploration of how task influences saccadic eye movement. Journal of Vision 4, 8: 741a. http://journalofvision.org/4/8/741/. [CrossRef]
  36. Nielsen, J. 1999. When bad design elements become the standard. From http://www.useit.com/ alertbox/991114.html (Retrieved Nov. 11, 2011).
  37. Ollermann, F., K.-C. Hamborg, and Reinecke. 2004. Edited by R. Keil-Slawik, H. Selke and G. Szwillus. Visuelles Orientierungsverhalten bei der Betrachtung von Internetseiten. In Mensch & Computer 2004: Allgegenwärtige Interaktion. München: Oldenbourg Verlag. [Google Scholar]
  38. Pan, B., H. A. Hembrooke, G. K. Gay, L. A. Granka, M. K. Feusner, and J. K. Newman. 2004. The determinants of web page viewing behavior: An eyetracking study. Proc. ETRA ’04: Proceedings of the Eye tracking research & applications symposium on Eye tracking research & applications; pp. 147–154. [Google Scholar]
  39. Rayner, K. 1998. Eye movements in reading and information processing: 20 years of research. Psychological Bulletin 124: 372–422. [Google Scholar] [CrossRef] [PubMed]
  40. Rothkopf, C. A., D. H. Ballard, and M. M. Hayhoe. 2007. Task and context determine where you look. Journal of Vision 7, 14: 16. http://journalofvision.org/7/14/16/. [CrossRef]
  41. Silver, N. C., and W. P. Dunlap. 1987. Averaging correlation coefficients: Should Fisher’s z tranformation be used? Journal of Applied Psychology 72: 146–148. [Google Scholar] [CrossRef]
  42. Strube, M. J. 1988. Averaging correlation coefficients: Influence of heterogeneity and set size. Journal of Applied Psychology 73: 559–568. [Google Scholar] [CrossRef]
  43. Tabachnick, B. G., and L. S. Fidell. 2007. Using multivariate statistics. Boston: Pearson. [Google Scholar]
  44. Tatler, B. W., R. J. Baddeley, and I. D. Gilchrist. 2005. Visual correlates of fixation selection: Effects of scale and time. Vision Research 45, 5: 643–659. [Google Scholar] [CrossRef] [PubMed]
  45. Thorndike, R. M. 2007. Edited by Neil J. Salkind. Fischer’s Z transformation. In Encyclopedia of Measurement and Statistics. Thousand Oaks: Sage Publications: Vol. 2. [Google Scholar]
  46. Triesch, J., D. H. Ballard, M. M. Hayhoe, and B. T. Sullivan. 2003. What you see is what you need. Journal of Vision 3, 1: 86–94. [Google Scholar] [CrossRef]
  47. Underwood, G., and T. Foulsham. 2006. Visual saliency and semantic incongruency influence eye movements when inspecting pictures. Quarterly Journal of Experimental Psychology 59, 11: 1931–1949. [Google Scholar] [CrossRef]
  48. Underwood, G., T. Foulsham, and K. Humphrey. 2009. Saliency and scan patterns in the inspection of real-world scenes: Eye movements during encoding and recognition. Visual Cognition 17, 6–7: 812–834. [Google Scholar] [CrossRef]
  49. Wilming, N., T. Betz, T. C. Kietzmann, and P. König. in press. Measures and limits of models of fixation selection. PloS One 6: e24038. [Google Scholar] [CrossRef]
Figure 1. Screen shot of one web page. All web pages were similar in the depicted structure, but differed in the products being offered. 
Jemr 04 00009 g001
Figure 2. Two Fixation density maps (FDMs) of a single subject s observing a web page w during the first six seconds of presentation (left side) and the following six seconds (right side). Corresponding entropy values are depicted. The data matrix constituting a FDM is the input of the entropy formulae (1). Higher entropy values indicate a more spread out fixation distribution (left side) independent of geometrical arrangements. Absolute entropy values are negligible since they depend on image resolution and the size of the Gaussian kernel used. 
Jemr 04 00009 g002
Figure 3. Main effects of factors “time-window” (upper row) and “web page” (lower row) on eye movement parameters (from left to right: saccade length, fixation duration and entropy). Time window 1 comprises the first six seconds of presentation duration, time window two the following six seconds. For results of the factor “web page,” grey arrows within the diagrams depict the predicted direction of change in eye movement parameters across web pages. All significant effects are denoted. Vertical lines on top of bars indicate standard error of the mean. Significant differences between factor levels (post-hoc Bonferroni adjusted t-tests) are marked. 
Jemr 04 00009 g003
Figure 4. Mean saccade length (averaged across web pages) depicted against the actual saccade number (left side). Mean fixation duration depicted against the actual fixation number (right side). Vertical lines on top of bars indicate standard error of the mean. 
Jemr 04 00009 g004
Figure 5. Mean percentage frequency of saccades on web pages depending on saccade length. Saccades were assigned to one of twenty categories (category 1: saccade length ≤ 1° visual angle; category 2: saccade length >1° and ≤ 2°; …; category 20: saccade length >19°). Vertical lines indicate standard error of the mean. 
Jemr 04 00009 g005
Figure 6. Fixation density maps (FDMs) visualizing the overall fixation distributions of all subjects with respect to web pages (ordinate) and to subsamples of fixations according to their temporal occurrence (abscissa). The lowest row depicts the mean congruency of subjects’ FDMs, which were constituted by the corresponding subsample of fixations. Congruency of FDMs was measured by means of Fisher z-transformed correlations between FDMs of two successively presented web pages (averaged across subjects). Mean z-transformed correlations differing significantly from zero are indicated by asterisks (*** = p<.001; ** = p<.001). Vertical lines on top of bars indicate standard error of the mean. 
Jemr 04 00009 g006
Figure 7. Mean inter-subject variance of fixation density maps (FDMs) with respect to subsets of fixation and separated for the web pages. Each subset includes ten fixations regarding their temporal occurrence after web page onset. Values on the ordinate were scaled up by multiplying with 1011, but absolute values are negligible in general. 
Jemr 04 00009 g007
Figure 8. Mean number of fixations on an advertising element by web page. The vertical (but not horizontal) position of the element varied across web pages. Web pages are ranked (from left to right) according to the vertical position of the ad on the screen (from the upper to the lower border). The corresponding web page number is reported in brackets. Vertical lines on top of bars indicate standard error of the mean. The result of the significance test is marked. 
Jemr 04 00009 g008

