Introduction
When collaborators are not co-located, their ability to work together is reduced. Researchers have been trying for more than three decades to improve the efficiency of work at distance by improving the users experience and by inspiring themselves from and trying to emulate face-to-face interaction. In the early stages of this research, the basic idea was to increase the bandwidth connecting the different locations of the collaborators (
W. Buxton, 1992). This approach is limited, because an increase of bandwidth does not correspond always to an increase of performance, as suggested by
Whittaker et al., (
1993) and
Kraut et al., (
2003).
Nardi (
2005) indicated how bandwidth could be a compound of many different aspects of communication argued to be equally important to study in computer-mediated communication (CMC). We argue that more research in this field should be devoted to: 1) study more basic components of communication, and 2) find valid alternatives for conversation mechanisms that are effective in person but not available in remote collaboration settings.
One of the communicative devices that are seamlessly used by teams interacting face-to-face is deixis. Pointing to an object in space leads the conversation participants to focus attention on that object, with a consequent disambiguation of referent, and an economy of words used. People naturally take advantage of space to sustain their conversation. Instead of going through complex descriptions, we point to objects as this is an efficient mechanism of resolving the references we use while speaking. When the production and reception of our conversation do not happen at the same time, we record our message in a permanent medium (through a written text or audio recording) and we leave clues to our addressee(s) on how to retrieve our words. Signs in a city space communicate directions or positions. They contain only few words or symbols because the place where they are positioned completes their communicative content. Often, this interplay of space and communication happens through maps –a symbolic representation of space, as they are easy to reproduce, manipulate, modify and transport to the places where their information might be mostly needed.
For example, it is common in computer-supported collaborative environment to provide with some shared pointers functionalities, i.e. to allow collaborators to see their peer’s pointer in addition to their own pointer. Thus, if two people have to organize a trip remotely over a shared map, they could make use of such a feature, to reproduce deixis-like gestures. One can move its pointer to a specific place and capture the attention of the other by saying ”That place!”
In such a situation, the operator cannot point directly on a map with its hand and show this gesture to its peer. Therefore a solution is adopted, consisting in a virtual gesture, to overcome this limitation. Despite being an efficient trick, this sort of virtual gestures might differ greatly from an actual movement of the finger over a map while in a face-to-face interaction. We focus on two main reasons why. First, because deixis comes always intertwined with eye gazing. A deictic gesture might be useless if not seen and acknowledged. While face-to-face the conversant using a deictic gesture can monitor with his/her gaze whether the recipient has seen this communicative act, this is not possible at distance, at least with common available technology. Second, because displaying communicative content over a map might modify the linearity of the conversation, shifting from a time-organized flow (e.g., when in person, utterances follow temporally) into a space-organized flow (e.g., text messages might be accessed in a random order).
Remote deixis and gaze awareness
In this section, we report on studies examining the role of remote deixis (henceforth called Explicit Referencing (When an interface is designed to allow a specific user’s message to be visually linked to a region or an artifact in the shared workspace, then we say that it implements Explicit Referencing. Explicit referencing is a general concept that is closely related to several notions such as artifact-centered discourse (
Suthers & Xu, 2002), anchored discourse (
Guzdial, 1997), anchored conversations (
Churchill et al., 2000), or document-centered discourse (
Buckingham-Shum & Sumner, 2001))) on collaborative work at a distance. The relevant contributions can be organized into two categories: studies approaching the problem at a
linguistic level, concentrating on few limited utterance exchanges, and those approaching the problem from the
collaboration level, observing longer interactions during complex tasks. While both approaches contribute to the understanding of human cognition and interaction mechanisms, the difference in the scale of analysis often yields divergent results. While studies targeting the linguistic level focus on the dialogue interchange occurring between two or more interlocutors, studies targeting the collaboration level refer to the shared understanding that is constructed as a consequence of that exchange (
Dillenbourg & Traum, 2006).
Indicating and gazing at linguistic level
Generally, people working together to solve a problem need a shared language to communicate. They also need to coordinate their activities, defining common goals and strategies to achieve them.
Clark (
1996) developed a theory describing how conversational partners develop a shared understanding, by building shared knowledge or common ground. The process of reaching this common ground, called
grounding, is defined as the effort of the conversational partners to share their attitudes, beliefs, expectations and mutual knowledge (
Clark, 1996,
Clark & Shaefer, 1989).
Clark and Brennan (
1991) argue that the effort and the ease required to maintain a common ground throughout collaboration are critically dependent on the features of the media the conversation participants use to communicate. For example, the media can influence the listener’s ability to offer feedback or to provide or seek clarification. The degree of sharedness of a visual space or the possibility of making deictic gestures are features of the communication media that influence the grounding mechanisms. Let us consider a case where two peers are discussing where to meet by mobile phone. The first is guiding the second to a meeting point and is offering detailed information. The second is following this information to reach the first speaker. Without visual contact, the first speaker will tend to use a detailed description of the landmarks with a consequent high effort and nonetheless a high probability of misunderstanding. In a different situation, if the peers share a map over which the first speaker can use deictic gestures, the resulting dialog will be much lighter in terms of number of words used and effort required. All visible elements in the shared visual space become part of the visual information of the task. In a face-to-face collaboration, the grounding process is influenced by the artifacts used during the participants’ interaction and the participants themselves. Their body movements,
proxemics (The term proxemics was introduced by anthropologist Edward T. Hall, in 1959, to describe set measurable distances between people as they interact. The effects of proxemics, according to Hall, can be summarized by the following loose rule: “
Like gravity, the influence of two bodies on each other is inversely proportional not only to the square of their distance but possibly even the cube of the distance between them”), gestures, facial expressions, and gaze all play a role in the establishment of the common ground.
Indicating has fundamentally to do with creating indexes for things. Every indication must establish an intrinsic connection between the signal and its object. The more transparent is this connection the more effective is the act. That is why we cannot use an indication to an object without the originating signal. Finally, indicating an object in space must also lead the participants to focus attention on that object. In other words, anything that focuses the attention is an index.
This implies that effective indicating gestures should attract eye movements. However, gazing is not just a perception device.
Clark and Krych (
2004) highlighted how gazing is a communication device used to designate the person or things the speaker is attending to, or used to monitor the addressees’ understanding while one is speaking. Thus, in order for such a kind of communicative act to be effective, the speaker (or the listener) must be able to register whether the listener (respectively the speaker) gazed at the object of interest. Also, eye gaze as a communicative act is not effective unless the conversant registers that s/he is being gazed and/or that the conversational partner is looking at the objects relevant in the conversation. In this regard, we often talk of
mutual gaze.
Considering the sight of artifacts in the workspace, visual information has been described by
Clark and Marshall (
1978) as one of the strongest sources for verifying mutual knowledge. Visual information can also be used to coordinate the shared language with which objects and locations are described (
Gergle, 2006). For example, if an utterance is ambiguous in a certain context (
e.g., “take the red book on the table”, with multiple reddish books on the same table) this can be easily disambiguated by joining a deictic gesture to the contribution (
e.g., “take that book”), with a subsequent economy of sentence-production and grounding effort.
Communication media limits the visual information that can be shared, with resulting effects in the collaboration process and performance. To test this hypothesis,
Kraut et al. (
2000;
2003) conducted two experiments using a bike-repair task where an expert was guiding a novice repairing a bike under various communication configurations: audio-only, and a second condition where the ‘Helper’ could see a video taken from a camera mounted on the helmet of the ‘Worker’. They had pairs side-by-side in the control condition. Communication was more efficient in the side-by-side condition, where the helper spent more speaking time telling the worker what to do. In the mediated condition, not only were the dialogues longer, but their focus also shifted: more speaking turns were devoted to acknowledging the partners’ messages. Their results indicated that physical tasks could be performed most efficiently when a helper is physically co-present. Having a remote helper leads to better performance than working alone, but having a remote helper is not as effective as having a helper working by one’s side. In some way, it seems that the richer visual information present in the side-by-side condition was valuable for keeping the helper aware of the changing state of the task.
Gergle et al. (
2004) presented a study that demonstrated that action replaces explicit verbal instruction in a shared visual workspace. In their experiment, pairs of participants performed a referential communication task with and without a shared visual space. They performed a sequential analysis of the messages and actions of the different trials, and revealed that pairs with a shared workspace were less likely to explicitly verify their actions with speech (
e.g., provide and seek verbal acknowledgements from the collaborator). Instead, pairs that had access to a shared visual space relied on visual information to disambiguate references used to guide their partner.
Deictic gestures are naturally produced in the visual space shared between collaborators. These are generally combined with messages, as they are used to disambiguate and enrich the linguistic content.
Brennan (
1990,
2004) devised an experimental task where two participants had to interact at distance and coordinate their actions over a shared map in order to park two icon-cars on the parking lot. She showed that the use of a telepointer increased the speed at which the remote collaborators could match the icons, but lowered the accuracy of the final result (
i.e., placing the car over the same parking lot), since both users knew they were close to each other on their screens, while the nontelepointer pairs needed to be more explicit about each detail to be sure they were in the correct location.
When the interface used by the remote collaborator does not support deixis, collaborators often rely on specific communication strategies to explicit the references used in the interaction.
Kraut et al. (
2002), using their helper-worker puzzle task, found that the use of ‘spatial-deixis-terms’, phrases used to refer to an object by describing its position in relation to others, such as “next to”, “below”, or “in front of”, was substantially higher in the absence of a shared visual space, since this was one of the primary ways in which the pairs could describe the layout.
Explicit Referencing at collaboration level
Some studies have investigated the effects of referencing to the shared workspace on collaborative work at a distance: the more the objects referred in a conversation are visible and shared by the peers, the better is the performance in the collaborative task. Van der
Pol et al. (
2006b,
2006a) researched context enhancement for co-intentionality and co-reference in asynchronous computer-mediated communication. The authors developed a tool for linking students’ conversations to documents under discussion. Results indicated that the tool reinforced task-context by providing a frame of reference for the conversation and led to a smaller topic-drift in the answers posted to new topics in the forum. They concluded that for collaborative text comprehension, explicit referencing to task context is more suitable than traditional forum discussion.
Purnell et al. (
1991) found similar results in different settings. They studied the effects of splitting attention between technical illustrations and their descriptors on cognitive resources. Their results suggested that the format of technical illustrations was superior when descriptors were contained within the diagram, as cognitive resources were not required to integrate the descriptors and the diagram. This is referred to as the
split-attention effect (
Chandler & Sweller, 1992).
Mülhpfordt and Wessner (2005) developed
ConcertChat, a chat communication tool in which participants can explicitly refer to other contributions or regions in the shared material. They found that explicit referencing leads to a more homogeneous discourse, i.e. to more homogeneous participation and more participation in parallel discussion threads.
Stahl et al. (
2006) reported similar results using ConcertChat in a math course, highlighting the importance of joint referencing for collaboration. The ConcertChat interface will be explained in more details in the next section, as it is one of the interfaces that will be used in the experiment presented in this paper.
Suthers et al. (
2002;
2003) examined how learners constructed graphical evidence maps, and how these maps were used by learners to support conversation through deixis in face-to-face and online conditions. They developed a system for artifact-centered discourse called Kükäkükä. The results showed that although external representations play important roles as resources for collaboration in both face-to-face and online learning, they are appropriated in different ways. In face-to-face collaboration, deixis was accomplished quite effectively through gesture. Suthers and colleagues explained how gesture is
spatially indexical: it can select any information in the shared visual space, regardless of when that information was previously encountered or introduced. Online collaborators also used external representations for referential purposes, but through verbal deixis and direct manipulation rather than gestural deixis. Verbal deixis in the chat tool was
temporally indexical: it most often selected recently manipulated items.
Bauer et al. (
1999) also worked on the use of telepointers in remote collaboration. They used a repair task where a helper was guiding a worker to fix the problem. They showed that by using an augmentedreality telepointer a remote user can effectively guide and direct the helper’s activities. The analysis of verbal communication behavior and pointing gestures indicated that experts overwhelmingly used pointing for guiding workers through physical tasks. While the use of pointing reached 99% of all cases, verbal instructions were used considerably less. In more than 20% of the cases, experts did not use verbal instructions at all, but relied on pointing alone instead. The majority of verbal instructions contained deictic references like ‘here’, ‘over there’, ‘this’, and ‘that’. Because deictic references are mostly used in connection with and in support of gestures, this finding is a strong indication that participants naturally combined pointing gestures with verbal communication, in much the same way they do in face-to-face conversations.
Gaze awareness at collaboration level
Scholars demonstrated how gaze is connected to attention and, in turn, to cognition.
Grant and Spivey (
2003) argued that attention is not an outcome of cognition but it can help restructure cognition. They report a study of participants solving a radiology problem. The subjects’ eye movements were recorded over an image of a tumor. The authors showed that participants who successfully completed the task were more likely to look at the external part of the tumor image. Then in a second experiment, the authors changed the visual salience of this external part of the image of the cancer, thus affecting the attention of the participants toward that region, and in turn the performance of task completion. These results suggested that eye movement patterns were related with problem solving processes. Comparable results were obtained by
Pomplun et al. (
1996) who showed that specific perceptual interpretations of an ambiguous picture usually correlate with parameters of the gaze-position distributions. Concerning cognition in cooperative settings,
Richardson & Dale (
2005) demonstrated that the degree of coupling between the eye movements of a listener in relation to the eye movement of a speaker was related to the listener’s performance on comprehension questions.
Gaze is related to cognition or the management of interaction, and also more directly to collaboration. The perception of the gaze of the interlocutors is a great source of information for understanding what they are talking about or attentive to.
Colston and Schiano (
1995) studied how observers would rate the difficulty people had in solving problems using gaze information. Observers were basing their estimates on how long the observed participant would look at a particular problem and particularly how long his/her gaze would linger after being told to move on to the next problem. They found a linear relationship between gaze duration of the observed solvers and the difficulty that was rated, indicating that lingering was perceived as a significant factor. This suggests that collaborators use gaze information to infer the cognitive activities of a partner. Indeed this was verified by several research like the study of Brown-Schmidt et al. (2005), who examined how listeners circumscribe referential domains for referring expressions by monitoring the eye movements of their partner as they engage in a referential communication task. They confirmed linguistic theories according to which reference resolution is made through a series of heuristics. More interestingly for this work was the fact that the eye movements of the emitter of a message are used by the listener to restrict the possible interpretations of a referent. The same finding was confirmed in a later study by
Hanna and Tanenhaus (
2003), and more recently by
Hanna and Brennan (
2007).
A more strict relation between gaze and collaborative work was demonstrated by
Ishii and Kobayashi (
1992). They showed that preserving the relative position of the participants and their gaze direction could be beneficial for cooperative problem solving. They used a system named ClearBoard (ClearBoard is a system that allowed users to collaboratively sketch on a shared display while maintaining eyecontact (
Ishii & Kobayashi, 1992;
Ishii et al., 1993)). To test the system they designed an experiment where they used a puzzle called “the river crossing problem”, where missionaries or cannibals should reach the other side of a river according to a series of constraints. As solving the task is highly dependent on understanding where the partner is looking, the use of ClearBoard had a positive impact on the task resolution. A similar setup using halfsilvered mirrors to optically align camera with video screen, was proposed by
Monk and Gale (
2002). Thus, in addition to allowing eye-contact, their system provides the subjects with their partner’s face superimposed onto the visual stimulus which allows them to infer easily what their partner is looking at. Their findings demonstrate a reduction of speech quantity and ambiguity compared to a simpler system where partner’s face were on the side of the stimulus. However, they did not find an improvement of performance over such a control condition. We can hypothesize that the positive effects on language might be annihilated by a negative impact of displaying continuously irrelevant or intrusive information on the stimulus. The same technique of employing half-silvered mirrors was used by
Buxton and Moran (
1990), and named
video tunnelling.
Finally,
Velichkovsky (
1995) highlighted the importance of transferring gaze information at distance for collaborative work. Two participants were asked to solve a puzzle collaboratively. One of them had access to the solution while the other was operating the moves on the target puzzle. While the participants shared the same visual workspace, one of them had access to the key but s/he could not rearrange the pieces. Velichkovsky manipulated the participants’ communication features. In the control condition, the participants could only communicate via voice, while in a second condition, the gaze of the participant who had access to the solution was projected on the workspace of the other. In a final condition, the participant who had access to the solution could use a mouse pointer to show to the other the relevant parts. Both the experimental conditions, transfer of gaze position and pointing with the mouse, improved performance.
Synthesis: research question and hypotheses
In our former work we have shown how supporting deixis in collaborative work at distance, and in the case of chat communication, might result in higher performance (
Cherubini & Dillenbourg, 2007). This paper presents a complementary analysis to our initial results, looking at whether virtual deictic gestures, or Explicit References (ER in short), could influence the coordination of the collaborators’ eye movements (
e.g., participants looking at the same thing at the same time). In this work, we use gaze recurrence, gaze coupling, and
cross-recurrence as synonyms and indication of this coordination.
Particularly, we were wondering whether the availability of virtually transferred deixis would have been acknowledged through gaze even without the presence of a visual feedback channel. Deictic gestures are purely indicative acts, while gazing is first a perception device which can also sometimes be used as an indication device. The possibility of using these communicative devices has an impact on collaboration both when the participants are co-located and when they interact at a distance. Richardson, Dale & Kirkham (2005; 2007) have shown that eye movements of listeners of monologues are linked to those of the speaker over a shared visualization and that the quality of this gaze recurrence has an impact on comprehension. We would like to extend this finding to the case of synchronous collaboration.
We report the results of an experimental study where we analyzed performance and processes of teams who had to organize a music festival on their university campus. They collaborated at a distance using a chat tool and a shared map. We compared experimental conditions where participants could link messages to the map against a control setup where participants could not create these links. We show that while a higher degree of eye coupling has a primal relationship with the collaboration performance, this gaze recurrence is not influenced by the availability of an Explicit Referencing mechanism (see the Results section).
When people interact, deictic gestures help ground the conversation. Instead of using complex descriptions of elements of the context, conversants can simply point at things. This mechanism reduces misunderstandings, which are a natural product of human language. It also reduces the time required to reach a mutual understanding. Many studies report that, even at collaboration level, the possibility of using deictic gesturing or equivalent mechanisms, has positive implications. However, it is important to consider the following:
1. Indicating should help coordinate visual attention. Few studies considered in detail how deixis is intertwined with gaze. At linguistic level,
Clark (
2003) predicted that indicating an object must lead conversants to focus attention on that object. At collaboration level, the use of deictic mechanism was also proven useful to support the collaborators’ work (
Pol et al., 2006a). However, there was little work supporting the idea that virtual gestures could support visual attention in collaborative work at a distance. We therefore posed the following research question:
RQ, do distant collaborators using applications implementing Explicit Referencing look at the shared workspace in a more similar manner than distant collaborators using applications not supporting ER? 2. Gaze is an important component in deixis gesture and more generally in referential communication. Richardson, Dale & Kirkham (2005; 2007) demonstrated that this was true in the case of asynchronous or synchronous interactions with speech. However, when people interact at a distance, the constrained perspective of the conversational partner and the reduced ability to use non-verbal cues might limit the ability of participants to use gaze to frame interaction. Little work focused on synchronous textual interactions at a distance. We therefore posed the following hypothesis: H1, The availability of explicit referencing mechanisms is associated to a higher degree of gaze coupling.
3. Does better eye-coupling means better performance? Richardson & Dale (
2005) demonstrated also that the degree of eye-coupling was related to the listener’s performance on comprehension questions. We were wondering whether this holds true in the case of synchronous interactions at a distance. We therefore posed the following hypothesis:
H2, A higher degree of gaze coupling is associated with higher performance.
Method
To answer our research question and to falsify our hypotheses we designed a controlled experiment. As we will explain next, the availability of the Explicit Referencing mechanism was manipulated. In designing the experiment, we chose to use existing communication applications to maintain a degree of
ecological validity (
Brewer, 2000). Finally, the controlled experiment presented in this work focuses on collaborative settings. It is conducted according to the
interactions paradigm (Dillenbourg, Baker, Blaye, & O’Malley, 1996) (The interaction paradigm (
Dillenbourg et al., 1996) proposed a shift of focus in CSCL research: rather than attempting to discover conditions under which collaboration is beneficial, one could attempt to discover which types of interaction occurring within collaboration lead to better collaboration outcomes and try to elicit these types of interactions).
Task description
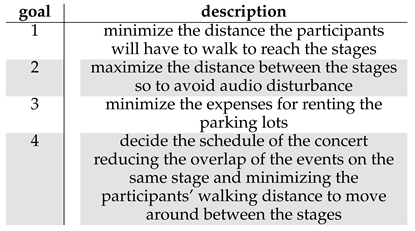
Participant pairs had to collaboratively perform the following task: organize a festival on their university campus, collaborating remotely using a chat tool. Completing the task required deciding which parking lots would be used by the festival attendants, where to position the three stages of the event, and how to allocate six artists to the three available stages. They therefore had to perform a number of optimizations, such as minimizing the distance between the chosen parking areas to the initial stage and between stages according to the schedule of the events. Additionally each parking lot had a different rental price that was somewhat proportional to its capacity. One of the constraints required the subjects to minimize the budget for the concert. Finally, as setting up a concert on a stage required appropriate “sound checks”, subjects had to choose the order of the concerts so as to minimize the waiting time of the spectators, and an appropriate distance among the stages so as to minimize the disturbance of sound checks on concerts already in progress. The four goals that were presented to the participants are summarized in table 1.
The subjects had to position a series of icons on a campus map: a number of ‘P’ signs to mark the active parking lots, three stage icons and six small circled numbers, one for each event to be allocated (part (b) of figure 1). The positions of these icons were not synchronized across the participants’ displays: a subject could not see where the other would position her icons. This task was artificially made complex (
e.g., not WYSIWIS) so as to augment the difficulty in finely positioning the icons between the two screens and so that we could observe how arising conflicts could be solved at a linguistic level and/or with different communication tools. This design was also chosen in order to separate the effect of the
feedthrough (Feedthrough is the information that is given to observers about the activity of other actors. By looking at changes applied to artifacts in the workspace it might be possible to infer intention, location, goals, etc. of the actors. Feedthrough is particularly powerful when it is coupled with consequential communication, namely seeing both the actor and the artifact that the actor is manipulating) (
Dix, 1995;
Gutwin & Greenberg, 1999), and the availability of a shared display on the team’s performance, from that of Explicit Referencing, the focus of this research.
Table 1.
Description of the four goals that the participants had to optimize during the task.
Table 1.
Description of the four goals that the participants had to optimize during the task.
Participants
Sixty students (27 women and 33 men, mean age = 23.5 years, sd = 1.2 years) of the Swiss Federal Institute of Technology in Lausanne volunteered to participate to the experiment. They were selected based on their mother language, their course year, their faculty and their knowledge and use of computers and, in particular, chat applications. All volunteers were native French speakers. we did not recruit participants in the first or the second year of their program as this could effect the level of their knowledge of the campus site and, in turn, on the task performance.
The subjects did not know each other and were randomly matched from different faculties. Students from Architecture or Civil Engineering were excluded as they could have biased the results as they are more used to working with maps. They were recruited using an e-mail call for participation and a short telephone interview, which helped to ascertain that they regularly used a chat application and that they did not have any ocular disabilities (e.g., colorblindness). Each participant was remunerated 30 Swiss Francs (∼18.30 EUR, or ∼24.85 USD).
Participants were randomly assigned to 30 dyads. Fifteen dyads were assigned to each of the two conditions described below.
Apparatus
The members of a pair were each seated in front of identical desktop computers with 17-inch LCD eyetracker displays (maker: Tobii, model: 1750, now called MyTobii D10), and located in two different rooms. The settings of the rooms, the working table and the light conditions were identical. Particularly, we also partitioned off the study space using shelves to reduce distractions from other objects present in the room.
Participants sat unrestrained approximately 60 cm (∼ 24 inches) from the screen. The tracker captured the position of both eyes every 20 ms. The participants went through a 5-point calibration routine. Fixations were detected from raw eye movements (i.e., saccades) using the algorithm implemented by Tobii in ClearView 2.7. This is a simple velocity threshold algorithm (described by Salvucci and Goldberg, 2000 as I-VT) with a velocity threshold of 30 pixels and a minimum fixation duration of 100ms.
Procedure
On arrival, participants were each given an instruction sheet (the materials used in this experiment are available in the appendix A of Cherubini’s PhD thesis, 2008) containing the rules they had to respect in placing the elements on the map, information on how to evaluate their solution, and the principles behind the calculation of the score. After, they were asked to watch a short video summarizing the paper instructions and explaining the particular communication tool they had to use to collaborate. Prior to starting the task, the participants could ask questions to the experimenter if they had any doubts about the video or written instructions they were given.
During the task, each participant had at her disposal: a feedback tool (part (a) of figure 1), a map of the campus (part (e) of figure 1) and a chat application to communicate with the partner. The feedback tool offered a score button (part (v) of figure 1), to display of a number between 0 and 100. This score was computed by comparing the proposed solution with the optimal solution that was calculated once for all the experiments. This tool also presented four graphs that would display four sub-scores one for each goal and the combined team-score. Each graph presented a horizontal red line, representing the maximum score that could be achieved with the given constraints and a vertical red line marking the time limit of the task. The tool also showed the remaining time to complete the task in the bottom-left corner (part (v) of figure 1). This tool also kept a detailed log of the users’ actions (the reader can see an excerpt of this log in appendix B of Cherubini’s PhD thesis, 2008).
The task lasted 45 minutes. As the task required multiple optimizations, we allowed each pair to submit multiple solutions to solve the task, ultimately selecting the best score for each team. Pairs were instructed to find the configuration leading to the highest score and to follow a collaborative paradigm. In fact, the pairs were warned that every time they pressed the score button, the system checked the position of the icons on the two machines. Pairs were told that the number of differences found was detracted from the obtained score. They were also advised to take advantage of the feedback tool and the available time to test the maximum number of different configurations.
At the end of the experiment, the participants were invited to participate in a debriefing session where they could ask questions and discuss the outcomes of the experiment. we conducted the interviews, asking specific questions on their interaction and to record the answers given. In particular, we used this opportunity to record qualitative information on the experiment. we asked whether the participants had any sort of conflict or misunderstanding during the interaction and what strategy they developed to position the icons at the same locations
Independent variables
Our research question is to find out what is the impact of Explicit Referencing in collaborative problem solving at distance. We therefore varied the referencing support for the task-context (i.e., the availability of ER). The design was therefore a standard 2 factorial design, where Explicit Reference (ER vs. noER) was a between-subjects factor. In one condition, participants used MSN, a standard chat application without explicit referencing, while in the second condition, they used ConcertChat, a chat application in which messages can be linked visually to points on the map or to previous messages.
Measures
The pairs were instructed to complete the task collaboratively, trying to minimize the number of mistakes in positioning between the icons on the two machines. We used the highest score achieved during the 45 minutes as the primary measure of task performance. At the beginning of the task, all the pairs were required to move the icons placeholders from the docking location (part (b) of figure 1) to the map. Pairs usually discussed an initial configuration, moved the icons, and pressed the score button. we used the time required to reach this initial configuration of the icons as a second measure of performance.
The main process measure that we explored in this paper is the cross-recurrence. this is a measure that measures the coupling between the gazes (i.e., how similar where the map-reading strategies that participants employed during the resolution of the task). More details on this eye-tracking analysis are given in the next section.
Figure 1.
Experiment setup in the two conditions: (a) feedback tool; (b) icons used during the task; (c) MSN chat message window; (d) reminder of the task goals; (e) map window; (g) ConcertChat chat message window; (k) example of how a stage icon is positioned and two concerts are assigned to that stage; (v) score button and countdown timer; (z) in ConcertChat it is possible to connect the message window to the point of reference with an arrow.
Furthermore, to understand how the pairs performed in different conditions, we explored several features of conversation structure: we looked at the number of words, number of utterances, and structure of turn taking. Also, we analysed the use of linguistic deictics (e.g. “I want to use this parking lot’’) or other strategies of referencing to the shared map like labels (e.g., “Let’s take P200”) and prepositional phrases (e.g., “Place the stage below P450”).
Finally, we measured the mean time required in each trial to compose the messages exchanged. To achieve this goal, we calculated the time from the moment the user started typing the first letter of a message to the moment in which the message was sent to the collaborator. This calculation included the situations in which some characters were erased or entire parts of the message modified. This measure accounted better for effort required to produce a message than the raw number of characters of which the message was composed.
Technical setup
The basic difference between the two experimental conditions was represented by a different communication tool that the participants had to use to communicate and to solve the task.
In ConcertChat (
CoC), visual priority is given to the conversation. Connections to map locations are made by arrows connecting the message from the history panel to the map point (part (z) of
Figure 1), or to other messages in the history pane. Lines are refreshed as utterances move up the chat history (part (g) of
Figure 1) and they disappear with their corresponding message when they reach the top of the history window. However if the user scroll back the history bringing back on view a message containing a reference to the map, then the reference line is visualized again on the shared workspace.
Additionally, CoC allows explicit references to previous messages in the chat history.
The explicit references created with CoC were part of the shared visual space and therefore synchronized on the two machines. However, the icons on each machine
were handled by widget software that kept them on a topmost graphical layer. They were completely separated from the different communication tools tested in the experiment. Finally, the message input field in each of the four interfaces was about the same size.
Cross-recurrence analysis
The goal of the study reported in this paper is to understand whether participants look at the same objects in the same temporal order. This is not easy to compute as what “same object” and “same time” means require a dynamic definition. Understanding which object the user is currently looking at is more complicated than just looking at the x,y coordinates of the eyes over the workspace. It needs to take into account the geometry of all the possible objects at sight (It must be noted that in this study the geometry of all the different polygons of the shared workspace were condensed into a unique fixed threshold). Similarly, the study of eye movements requires a tolerance for delays (e.g. B might be looking the same object two seconds after A). While the former issue was here tackled with a simple radius of tolerance (often called geo-fence), the latter issue was tackled with the analysis described after.
To understand the relation between the eye movements of the speaker and the listener, we used
crossrecurrence analysis (
Eckmann et al., 1987). Crossrecurrence plots permit visualization and quantification of recurrent state patterns between two time series representing the evolution of dynamical systems. This is the technique that
Richardson & Dale (
2005) adopted in a listener’s comprehension task. This analysis is useful as it can reveal the temporal dynamics of a data set without the limitation of making assumptions about its statistical nature. To apply such an analysis, we first build a 2 dimensional matrix called cross-recurrence and in which a cell (
i, j) indicates whether the gaze position of participant A at time
i is close to the gaze position of participant B at time
j.
Figure 2, used by Richardson & Dale, 2005 , gives a graphical representation of this technique (p. 1050):
Each diagonal on a cross-recurrence plot corresponds to a particular alignment of the speaker’s and listener’s eye movement data with a particular lag time between them. A point is plotted along that diagonal whenever the speaker and listener’s eye movements are recurrent–whenever their eyes are fixating the same object. Note that if the speaker and listener are not looking at any object at the same time (they were looking at blank spaces or off the screen or were blinking) this is not counted as recurrence.
On the left side of
Figure 2, the scarf plots of the speaker and the listener are aligned with no time lag. The periods counted as recurrence are shown in black in between these two linear plots, accounting for 20% of the time series. Conversely, on the right side of
Figure 2, the listener’s eye movements are lagging behind the speaker by 2 seconds. Thus, there is a 30% recurrence between them. The recurrence analysis consists in calculating the recurrence of all such possible alignments.
Figure 3.
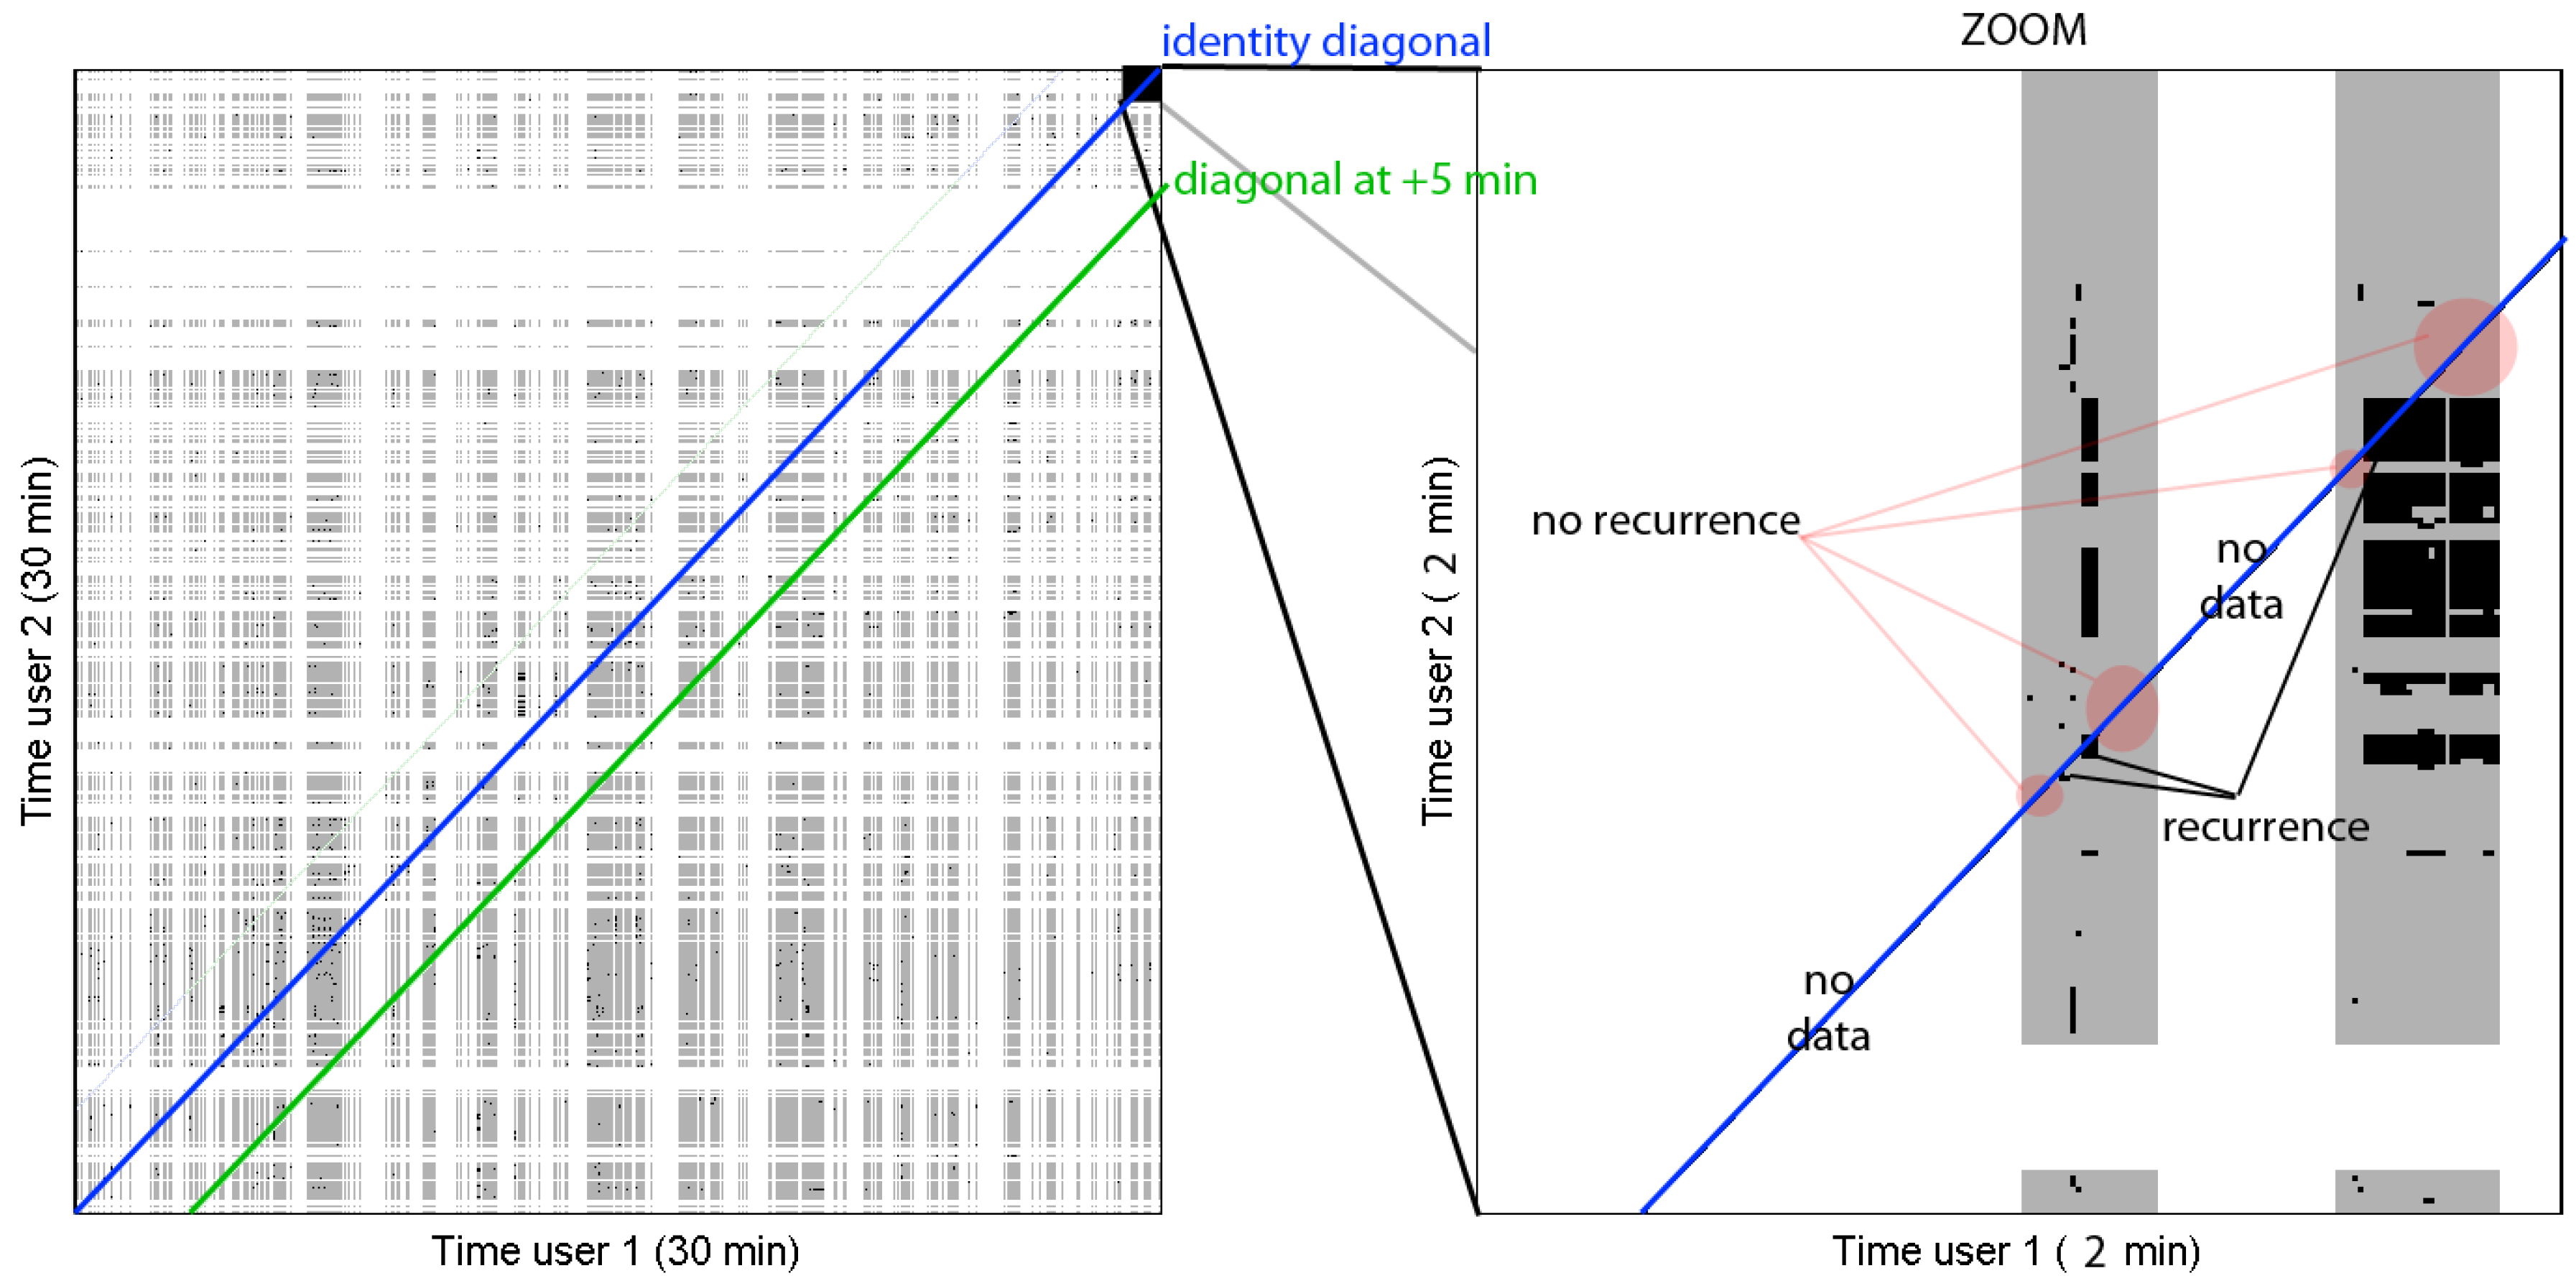
Example cross-recurrence plot of the eye movements of the participants: on the left hand side the matrix plotted for a 30 minutes period. The central diagonal corresponds to a lag of 0 seconds. A segment of 2 minutes is enlarged on the right hand side. Gray areas represent times for which we have readings from both eye-trackers.
Figure 3.
Example cross-recurrence plot of the eye movements of the participants: on the left hand side the matrix plotted for a 30 minutes period. The central diagonal corresponds to a lag of 0 seconds. A segment of 2 minutes is enlarged on the right hand side. Gray areas represent times for which we have readings from both eye-trackers.
Adaptations
While this method appeared to be a valid technique for analysing eye-tracking data collected in a simple stimulus setting, our particular situation required a number of adaptations. First of all, the method of
Richardson and Dale (
2005) was taking into account discreet zones of interest in the shared visual space (The authors subdivided the screen space is six squares containing different visual stimuli. See
http://psych.ucsc.edu/eyethink/eye-chat.html for a description of the experiment. Last retrieved March 2008). Conversely, the map was considered as a continuous space and therefore the recurrence in this situation did not mean being in the same discreet zone at the same time, but rather that the eye movements of the first participant were within a certain pixel distance from those of the second participant and for a particular time interval.
Additionally, while Richardson and Dale analysed asymmetric interactions (e.g., one participant was speaking and the other listening), we had symmetrical interactions between the two participants (the two could be both emitter and receiver of a message). This resulted in different calculations to be done on the cross-recurrence matrix, as explained below.
Also, while they analyzed sequences of interactions of 5−10 minutes using a head-mounted eye-tracker, we analyzed interactions lasting over 45 minutes with an eye-tracking display. Although our system was less invasive, it had the side effect of loosing the tracking of the eyes if the user assumed an undesirable position in front of the display. During the task time, many participants become tired of sitting still and bent down over the table, thus provoking losses of eye-tracking data in the collected dataset (which we named long holes). Additionally, while they were typing their messages they sometimes looked at the keyboard in which case the tracker loose momentarily the position of the eyes (which we named short holes). Therefore, the calculation of the cross-recurrence analysis had to take into account this missing data, a problem that Richardson and Dale did not have to solve. More specifically, we had to distinguish between long and short holes in the dataset: while for the short holes we interpolated fixations as explained in the next subsection, for the long holes we simply flagged the data as missing and we did not use any fragment in the corresponding segment of time for the cross-recurrence analysis.
Finally, we had to normalize the data as the registered cross-recurrence was dependent on the particular strategy that the participants chose. Working on a small portion of the screen increased the chance of two fixations to be considered recurrent, while working on a wider area decreased this level of recurrence by reducing the possibility of accidental overlaps. Therefore, we had to take this factor into consideration to compare the results of different experiments (as explained in the results section).
Analysis procedure
Three steps were required to perform this analysis.
First step. After having identified the fixations from the raw gazes samples using Tobii’s algorithm described by by
Salvucci and Goldberg (
2000), it was necessary to resample the fixation data in order to obtain a continuous time series containing eye-gaze position every 200ms (parameter A). Sampling points that fall during a fixation were simply assigned the position of the corresponding fixation. If no fixation was found for a given time, an interpolation was performed between the preceding and the next fixation, but only if they were separated by time less than 1000ms (parameter B), which was the criteria that we used to distinguish between long and short holes in the dataset. This procedure allows to have less noisy gaze samples than if raw gaze samples were used. Parameters (A) and (B) were chosen in order to have a sufficiently great (and comparable) number of fixation points for each experiment. A ‘hole’ in the dataset with a length shorter than one second could be due to movements of the eyes outside the screen area. So, if the fixations were temporally too distant, no data was taken between them. Moreover, we decided to reject all fixations falling outside of the map because we was looking at recurrence caused by the Explicit Referencing mechanism, which was acting only on the part of the screen displaying the map. Thus, depending on the eye-gaze tracker data quality and the ratio of map fixations, the resulting sampling contained between 10% and 50% of good points.
Second step. The next step was to compute the crossrecurrence matrix based on this sampling. This matrix is computed with equation 1, which has been adapted from Eckmann et al., 1987 in order to ignore the missing sampling points:
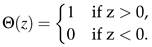
Where i and j are the number of the sampling points, and and are the sampled fixation data for the first and the second participant, respectively. Also, Θ is a step function which returns 1 when its argument is positive and 0 when it is negative (see formula 2).
In formula 1, epsilon represents the threshold under which two fixation points are considered to be recurrent. There is no generally valid method to set this threshold, which is very dependent on the system under consideration (e.g., the size of the objects in the shared workspace). We have chosen to take 30 pixels(which corresponds roughly to a bit more than 1 degree visual angle at the average distance), a measure that is slightly larger than the eye-gaze tracker accuracy when the user sits at 60 cm from the screen and smaller than most of the polygons composing the map used in the experiment.
![Jemr 03 00024 i002]() | (1) |
![Jemr 03 00024 i003]() | (2) |
Third step. these cross-recurrence matrices were used to compute the recurrence rate at different time lags. Indeed, if we compute the ratio of recurrence points along the diagonals in these matrices, they correspond to the recurrence rate at a given time lag (see
Figure 3), the identity diagonal being the recurrence with no time lag. When missing data was present (
e.g.,
CRi,j =−1), it was simply ignored in the computation of the recurrence ratio, which had the effect of increasing noise for the experiments with too few good sampling points. From these values, we plotted the recurrence rate for every time lag between 0 minutes and +5 minutes (see
Figure 4).
Randomized level of eye movements
In order to analyze the curves generated by the cross-recurrence plot explained above, the curves had to be compared with a baseline distribution. This was created by shuffling the temporal order of fixations generated by a certain pair. This randomized series was calculated for each trial, and served as a baseline of looking “at chance” at any given point in time, but with the same overall distribution of looks to the map as in the real collaborations.
Relation of fixation distributions
The resulting graphs showed some inconsistencies: the randomized average recurrence was different than 0; it was different across pairs; and even across those conducted under the same experimental condition. To understand the reasons for this variability, we analyzed the spatial distribution of the sampled eye-gaze points. In order to achieve this, we computed a distribution of fixations over the shared workspace (the points looked at during the whole task) for each participant by subdividing the map area in small cells and by counting the number of fixation points falling in each cell. Then, we computed a distance measure between these two distributions using a discrete version of the Kullback–Leibler divergence (KL in short). This is a non-commutative measure of the difference between two probability distributions P (in this context, the eye movements of participant 1) and Q (in this context, the eye movements of participant 2) (See
http://bit.ly/4wbWiA, last retrieved January 2010) (
Kullback & Leibler, 1951).
Results
Of the original 30 experiments, we discarded 7 recordings of pairs that, for technical problems, were missing logs. For each of the remaining experiments we computed the number of fixations being sampled. This measure was used to further exclude 10 experiments (The word ‘experiment’ here denotes the data of one participant), which had less than a thousand fixations falling on the map during the 45 minutes of the task time. we finally generated cross-recurrence plots for the remaining 13 experiments (MSN: 5; ConcertChat: 7).
Relation between task strategy and gaze recurrence
To measure this relation, we computed a linear regression between the Kullback–Leibler divergence of the fixations-points distributions of the pair and the maximum recurrence. The regression of the maximum recurrence was a good fit, describing 43.8% of the max-recurrence variance ( = 42.0%). The overall relationship was statistically significant (F[1,32]=24.93, p<.001). The Kullback–Leibler score was negatively related with the maximum cross-recurrence (βstd=-.66, p<.001).
The analysis revealed a significant relation between the KL divergence of the eye-gaze points distribution of the two participants and the recurrence rate of the randomized curve for the same experiment. So, we concluded that the difference between randomized recurrence rate of the experiments were due to different strategies employed by the participants in exploring the map. Participants pairs working in a smaller portion of the map could have an higher chance to be looking at the same points of the map compared to participant pairs working on a larger portion of the campus plan. Thus, in order to be able to compare the recurrence rates between different experiments, it was necessary to suppress this intra-experiment effect. This was accomplished by simply subtracting from each experiment’s recurrence distribution the average of the randomized gaze recurrence for the same experiment.
Explicit Referencing and the relation between collaborators’ eye movements
H1, The availability of explicit referencing mechanisms leads to a higher degree of gaze coupling.
The initial question that we addressed was what experimental condition produced the most recurrence between the collaborators’ eye movement.
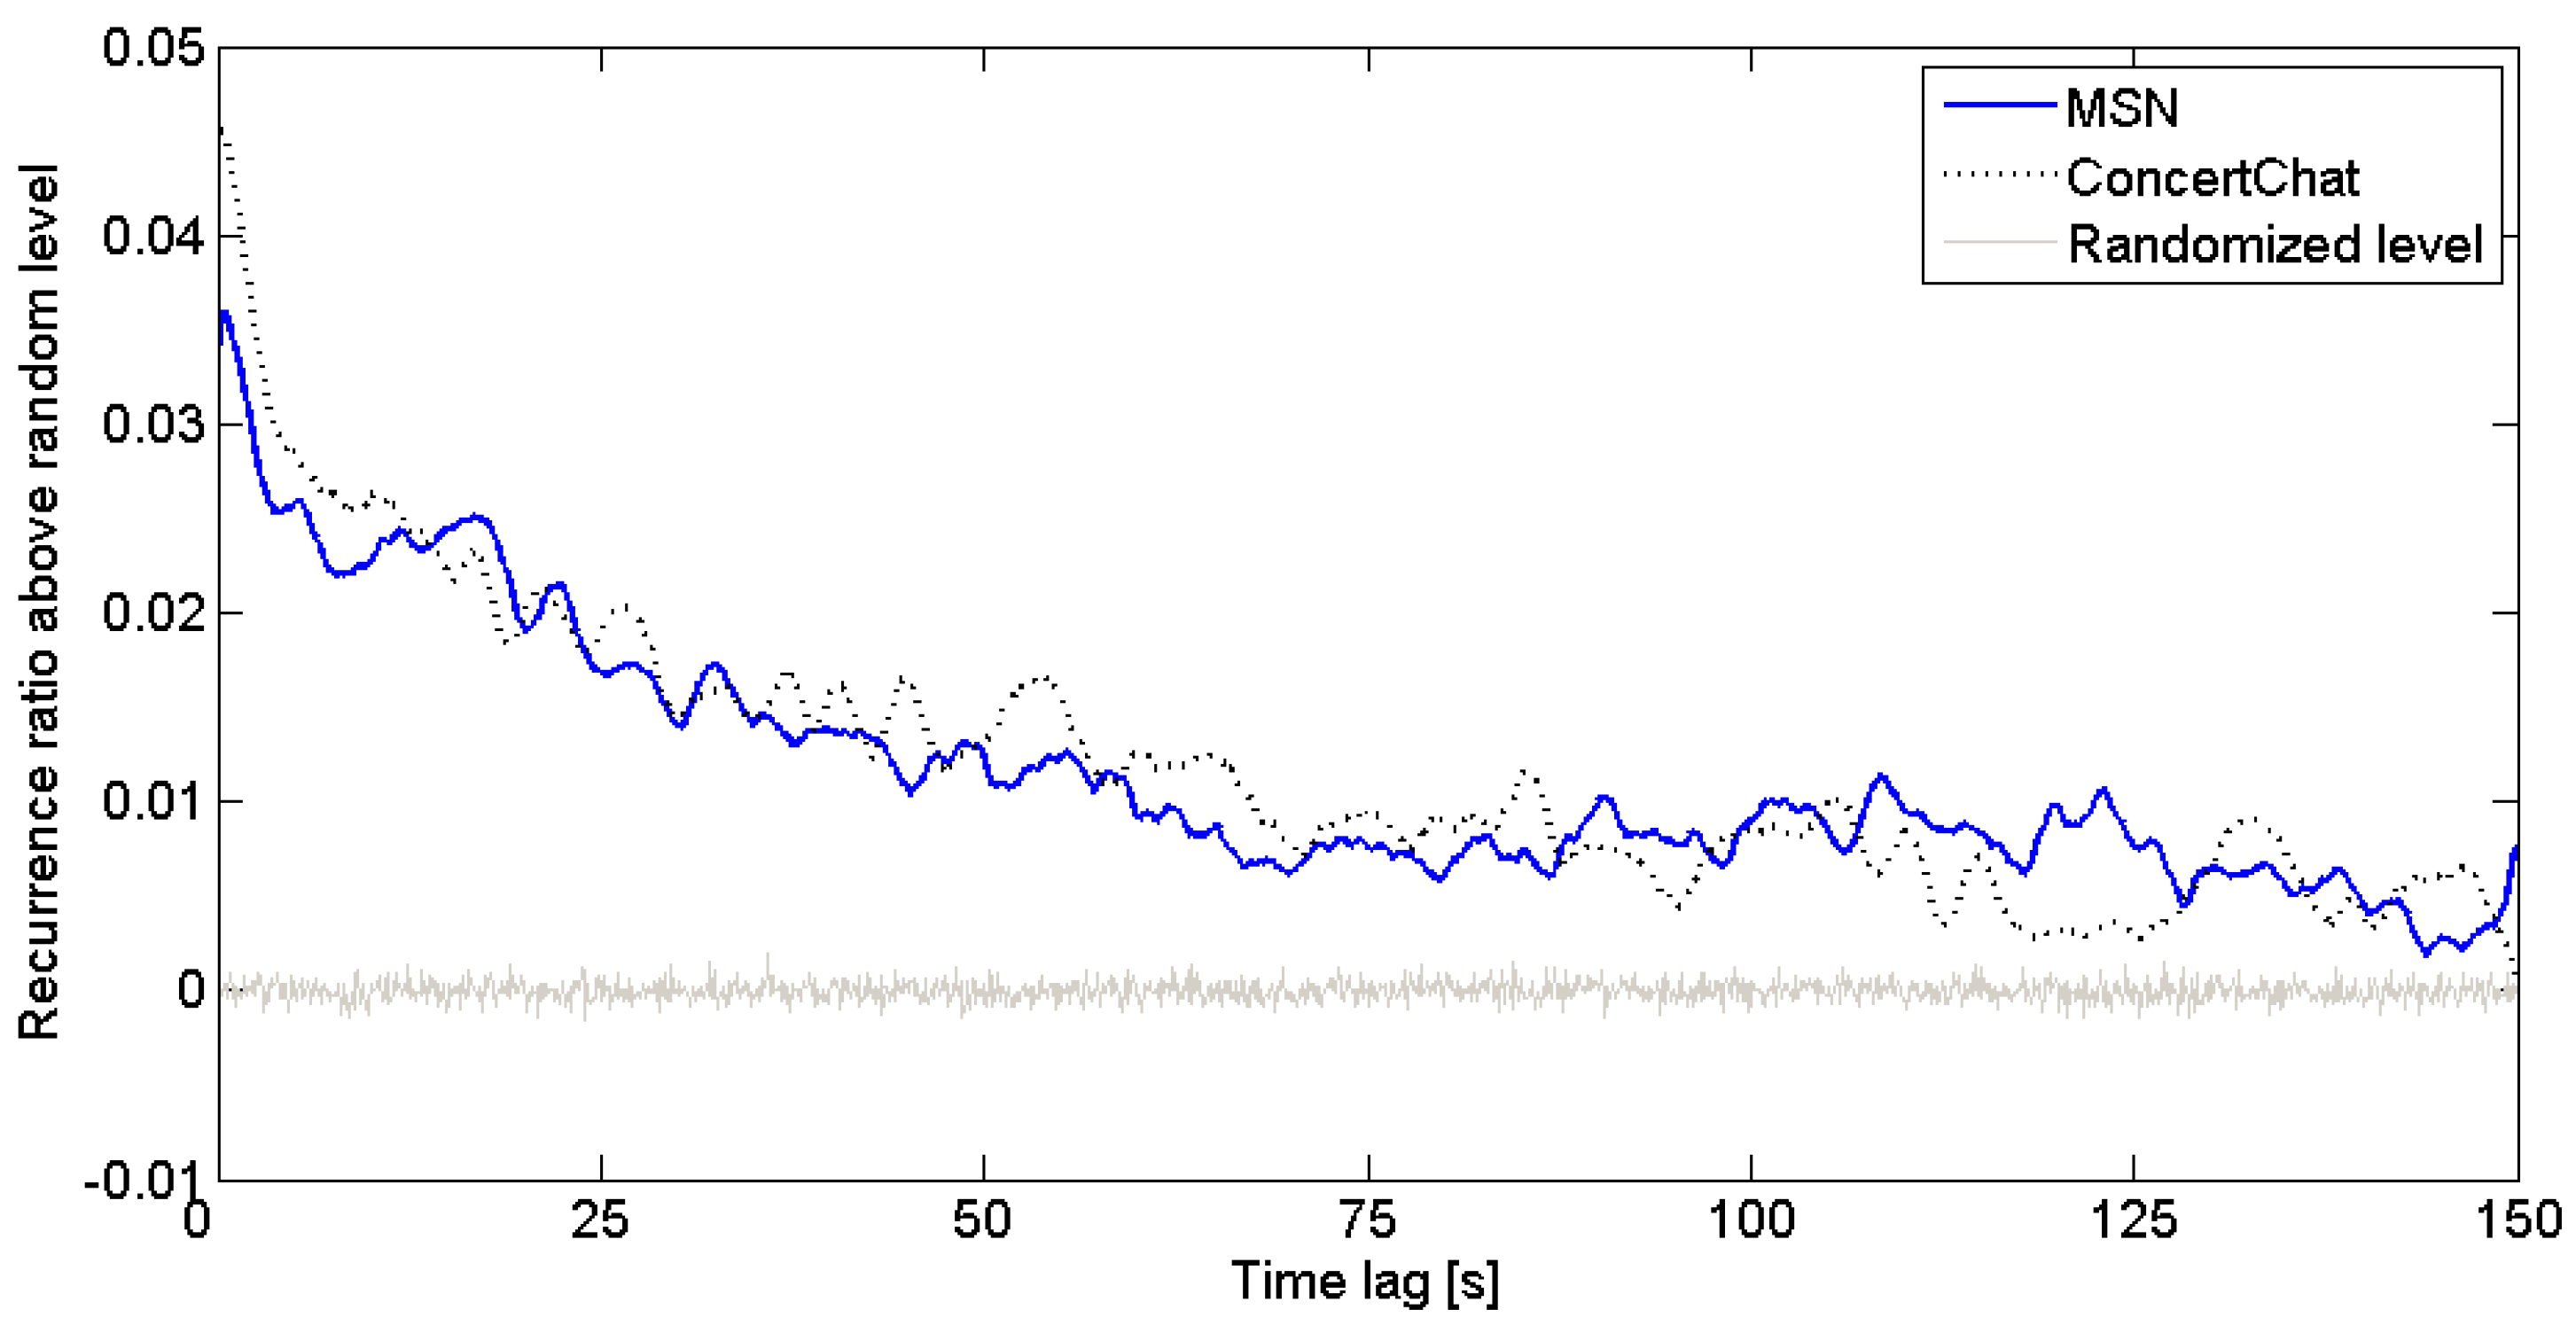
Figure 4 shows the average cross recurrence, corrected with the randomized level (see the explanation in the previous subsections),at different time lags and for each experimental condition.
The differences between the experimental conditions were supported by a 2 (ER–noER) × 91 (lag times) mixed-effects analysis of variance (ANOVA) (lag as a repeated measure factor) that denied a significant effect of the availability of Explicit Referencing, F[1, 10]=.006, p>0.1, ns. This result was not consistent with H1, which was predicting a higher recurrence rate for experimental conditions supporting Explicit Referencing.
Figure 4 also shows a baseline distribution where we calculated the recurrence of eye movements of participants where we shuffled the temporal order of the eye movement sequence, offering a comparison of random looks (
i.e., gray curve oscillating around ‘0%’ recurrence ratio) (As explained in the previous subsections, these randomized curves were originally placed at different levels and then equalized around 0% recurrence level). This contrast shows that the eye movements of the two collaborators are linked within a particular temporal window: between 0 seconds and 1 minute and 30 seconds, the participants are likely to be looking at the same thing at above chance level.
The differences between the real pair and a randomized pair were supported by a 2 (real–randomized) × 91 (lag times) mixed-effects analysis of variance (ANOVA) (lag as a repeated measure factor) that revealed a significant effect of pair type, F[1,22]=11.86, p<.05, and a main effect of lag, F[90,1980]=2.84, p<.001. There was also a significant interaction between the factors, F[90,1980]=3.64, p<.001. This implies that real pairs were looking at the same things at the same time, or with a small lag, at above chance level.
We performed the presented analysis increasing the time lag between the participants up to 10 minutes. However, the most interesting part of the curve was between 0 and 150 seconds.
Figure 6 present visually the peaks of the curves. The maximum values of these smoothed curves are summarized in
Table 2. We obtained these values by calculating the first derivative of the smoothed cross-recurrence curves.
To summarize: these results denied an effect of the availability of the ER mechanism on the amount of gaze coupling reached by the pair. The comparison with the baseline distribution of random looks demonstrates that participants’ gaze movements are coupled. The maximum of gaze recurrence was reached in average with a lag of 0.45 seconds. In other words, in the most frequent cases whenever one of the participants was looking at some points of the map, the other participant was also looking at these points after a delay of about half second.
Table 2.
Summary of the maximum values reached by the smoothed cross-recurrence curves presented in Figure 5.
Table 2.
Summary of the maximum values reached by the smoothed cross-recurrence curves presented in Figure 5.
| | | time lag
(sec.) | Recurrence
ratio max. |
| MSN Chat | MSN | 0.5 | 0.037 |
| ConcertChat | CoC | 0.4 | 0.046 |
Use of linguistic deixis and gaze recurrence
As the task required precise positioning on the shared map, we analyzed the language employed by the participants. We processed each message using an automatic method. The automatic feature extraction was operated using TreeTagger (
Schmid, 1994). The algorithm handled the stemming of each word and the tagging according to the French parameter file (The documentation of these components, as well as the source code of the tagger is available at
http://bit.ly/102aEW, last retrieved January 2010).
Figure 4.
Average cross-recurrence for each experimental conditions.
Figure 4.
Average cross-recurrence for each experimental conditions.
Figure 5.
Average cross-recurrence for each experimental conditions. Here the curves have been smoothed for readability using a moving average.
Figure 5.
Average cross-recurrence for each experimental conditions. Here the curves have been smoothed for readability using a moving average.
Figure 6.
Zoomed portion of the curves reported in
Figure 5 between 0 and 5 seconds.
Figure 6.
Zoomed portion of the curves reported in
Figure 5 between 0 and 5 seconds.
Figure 7.
Scatter plot of the maximum recurrence and the maximum score with the regression line. The curves indicate the mean confidence intervals.
Figure 7.
Scatter plot of the maximum recurrence and the maximum score with the regression line. The curves indicate the mean confidence intervals.
We used three features of the participants’ language to measure how different linguistic devices were used in function with the different media. Those features were the number of prepositional phrases (
e.g., “
on the right hand-side of the parking lot”, “
below the ‘H’-shaped building”, etc.), the number of spatial adverbial clauses that were used as positioning device(
e.g., “
leave the parking icon where it is”) and the number of deictic expressions used(
e.g., “
I placed the second concert here”, or “
move your icon there”).
Table 3 presents the resulting data.
When we manipulated the availability of the Explicit Referencing mechanism, we observed significant differences across these three linguistic features. Participant pairs using tools that implemented an Explicit Referencing mechanism used almost three times fewer of the prepositional phrases than the pairs using tools without ER (ER: m=12.03, sd=8.21 vs. noER: m=30.57, sd=13.04 prepositional phrases per experiment; F[1,58]=43.84, p< .001). On the other hand, participants with ER produced three times more place adverbial clauses than participants with no ER mechanism available (ER: m=15.37, sd=11.13 vs. noER: m=4.37, sd=4.34 adverbial clauses per experiment; F[1,58]=23.54, p< .001). Lastly, participants with ER produced two times more linguistic deictic expressions than participants with no Explicit Referencing tool (ER: m=16.60, sd=11.99 vs. noER: m=6.83, sd=3.26 deictic expressions per experiment; F[1,58]=19.07, p< .001).
Table 3.
Linguistic Spatial Positioning (***p< .001, .p< 0.1).
Table 3.
Linguistic Spatial Positioning (***p< .001, .p< 0.1).
| | ER | noER | P |
| Prepositional phrases | 12.0 | 30.6 | *** |
| Adverbial clauses | 15.4 | 5.0 | *** |
| Linguistic deictics | 16.6 | 6.8 | *** |
As we could not find a direct relation between the experimental conditions and the recurrence of the eye movements, we looked at the relation of this indirect verbal measure of deixis and the maximum gaze recurrence. The maximum recurrence was positively related with the number of deictic expressions used in the messages ( =.11, βstd=.37, p< .05). we did not, however, find a significant relation of the number of deictic expressions with the score ( =−.02, βstd=−.02, p> 0.1, ns).
These results suggests that participants adapt their communication strategy to reduce their grounding effort. Participants using tools implementing ER adapted accordingly their communication reducing prepositional phrases which take more effort to encode and which are more prone to generate mistakes and miscomprehension.
Discussion
RQ, do collaborators using applications implementing Explicit Referencing look at the shared workspace in a more similar manner than collaborators using applications not supporting ER?
Eye movements of collaborators are linked. When we compared the cross-recurrence curves of the different conditions with the randomized ones pairs, we observed that the recurrence peak was not present in these latter, thus suggesting that the visual attention of the pair was indeed coupled (see
Figure 4). The form of the peak gives many cues on the differences between the conditions on the way participants interacted. It is possible to see that the curves reach their maximum around 0.45 seconds (see
Figure 6). However, the recurrence curves presented many local maxima. Smaller peaks at further distance might be due to different categories of messages with longer editing times (
e.g., utterances containing positioning indications in relation to other elements, which would have taken more time to write).
H1, The availability of explicit referencing mechanisms leads to a higher degree of gaze coupling.
We performed the study reported in this paper as we wanted to understand whether the availability of Explicit Referencing had an impact on the way people looked at the shared workspace. To this end, this paper reports the following finding:
the manipulation of Explicit Referencing did not influence the crossrecurrence ratio. While the manipulation of the availability of Explicit Referencing had an effect on the maximum score reached by the pair (
Cherubini & Dillenbourg, 2007), this was not the case for the maximum recurrence of the eye movements registered for each team. This means that pairs interacting at distance over a shared map and communicating with a standard chat application looked at the same areas of the map simultaneously, or with a constant lag, with the same frequency of pairs using a chat application implementing an Explicit Referencing mechanism.
H2, A higher degree of gaze coupling is associated with higher performance.
This study produced a second important finding. The regression reported in the previous section shows that the degree of coupling of eye movements was related to the performance obtained by the pair. This implies that pairs that look more often at the same thing at the same time, or with a constant lag, obtain higher scores, even when people are not co-located. This result extends the findings of
Richardson and Dale (
2005). While they found a correspondence between the degree of crossrecurrence and the scores of a post-hoc comprehension questionnaire on a simple image description task, we measured this relation between cross-recurrence and performance in a much more complex situation which is collaborative problem-solving task. Furthermore, while Richardson and Dale proved this correspondence in the case of oral communication, we could verify the same finding in the case of written communication. Therefore, H2 was verified.
Gazing was a personal and self-directed activity because each collaborator knew that her partner could not see where she was looking. When a participant wanted to invite the partner to look at the same point she was looking at, she used the Explicit Referencing mechanism to circumscribe the referential domain of a message. However, the emitter of one of such enriched messages had no direct indication that these ‘acts’ were subsequently observed by the conversant.
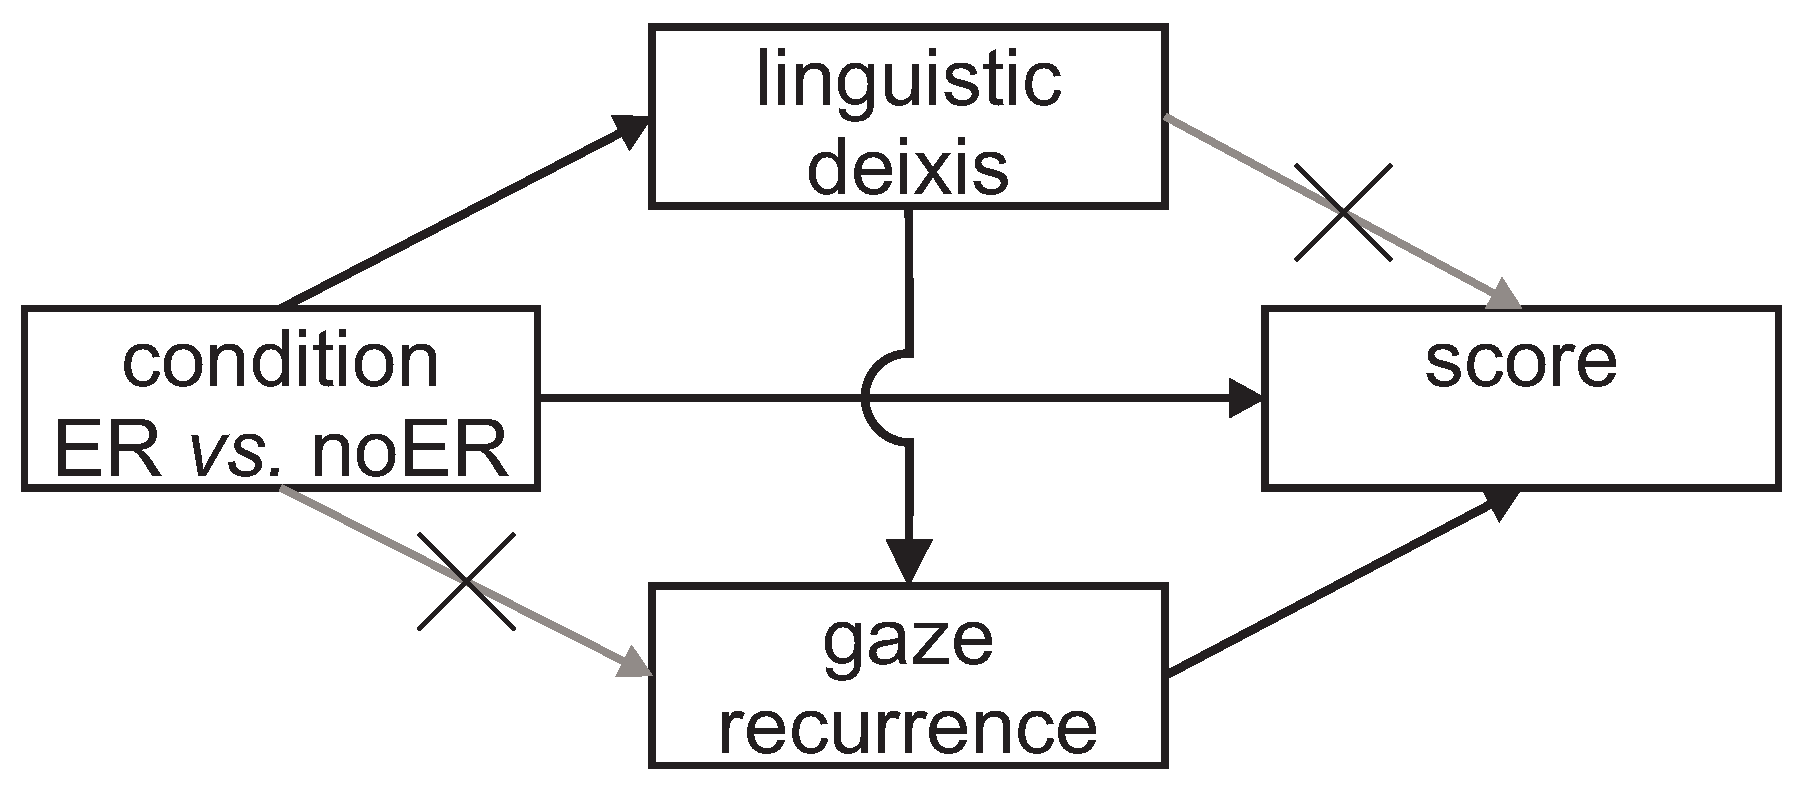
While we did find a relationship between the degree of coupling of the eye movements and the task score, we did not find the same connection between the use of linguistic deixis and task performance (
Figure 8 summarizes the effects found). In the experiment, when participants used linguistic deictic expressions, they affected their partner’s attention, and therefore the places she looked at on the shared display, more than when participants used Explicit Referencing to convey deixis. This suggests that the degree of eye coupling has a primary relationship with task performance, while the frequency of use of deictic gestures, expressed through visual links to the shared display or with text only, has an indirect relation with the collaboration outcomes.
Figure 8.
Significative interactions between the variables analyzed in this experiment. Lines represent significative regression –or correlations– between the connected variables.
Figure 8.
Significative interactions between the variables analyzed in this experiment. Lines represent significative regression –or correlations– between the connected variables.
To put this second finding simply, the more gaze movements of the participants were coupled, the better they performed the task. The reader might be lead to think that this is a perfectly obvious result, which is largely supported by common sense, and that as a concept this underpins most of the work claiming the need for a shared visual space in supporting collaborative work at a distance. However, taken together, the results that we present support the idea, which is not common in the literature, that in our setup this coordination of sight was better achieved through the linguistic channel (supported by the chat application) than through the shared workspace (supported by the map). The reasons why this was the case might be numerous. Here, we suggest three. First, as stated before, the implementations of Explicit Referencing that we used in the experiment did not allow the recipient of a message to explicitly acknowledge that a message was read, as opposed to what happens when people are face to face. In other words, the ConcertChat application did not allow participants to flag the received message as read and share this information with their partners. Second, the production of a message containing a reference to the plan might not have been as effective in capturing the attention of the partner as a linguistic message directed to the management of the interaction. While participants solving the task with MSN had to maintain a constant level of attention in order to coordinate the placement of the icons, those solving the tasks with ConcertChat could rely on clear spatial indications and therefore their attention might have been split to several elements of the interface. Third, this result might be a reflection of the fact that the chat tool tested was particularly poor at constructing Explicit Referencing, although we did register an effect of the availability of ER on performance (
this result was published by Cherubini and Dillenbourg, 2007). The results provided by the analysis presented in this work do not suggest a conclusive explanation on this matter.
As these results stand, they show that pairs that communicated using linguistic ‘shortcuts’ as deictic expressions, were able to attract their partner’s gaze more efficiently, as demonstrated by the higher degree of gaze coupling. This happened independently of the tool they were using to communicate and resulted in higher scores reached by the pair.
Implications for design
Indicating and looking are two intertwined mechanisms that affect collaborative work. When co-located, deictic gestures are used to disambiguate referential expressions, and gazes have the dual nature of perception and communication devices.
At distance, these mechanisms are not possible. Different technological solutions can be implemented to give collaborators the possibility of pointing to portions of the shared display. However, the results reported in this paper show how communication mechanisms interact with each other in complex ways. Sustaining only deictic gestures at distance without returning a visual acknowledgment of these acts might not be as efficient as sharing a visual representation of the gaze of the collaboration partners. On the other hand, many scholars have researched the potential benefits of implementing full gaze awareness in video-mediated conversation (
Vertegaal, 1999;
Monk & Gale, 2002). Unfortunately, we still lack solutions to distinguish when gaze is used as a perception device versus when it is used as a communication device. When face-toface, people are accustomed to distinguishing between these two, but when at distance, these naturally embodied signals are transposed by technological means and their disambiguation might become tedious.
Sharing gazes produced by a participant to perceive elements of the scene might have an overwhelming impact on the collaboration process. When co-located, it is our choice to look at our conversation partner’s eye to infer where is her focus of attention. It is our choice to look at the person we are addressing to make her aware that our utterances are directed at her. When at distance, it becomes the machine’s responsibility to operate this distinction.
Similarly, implementing Explicit Referencing without an acknowledgment feedback might have underwhelming effects on the task. When co-located we can enrich our conversation with deictic gestures to disambiguate conversation information. The speaker can also look at our conversational partners to check whether the gestures that she uses are looked at. When at distance and with the solutions that we tested in this paper, the emitter of a message has no way to monitor whether the recipient has correctly perceived a communicative act. This is less detrimental than in the case of oral communication because the messages are not fully transient but this may be still be a source of misunderstanding.
Gaze does not equate with attention. Showing the gaze of the partner may not be always effective as it does not necessarily reflect attention. Indeed, direct attention is a selective process through which perceived information is filtered for the limited processing capacity of the brain. Phenomena like inattentional blindness (
Inattentional blindness, also known as perceptual blindness, is the phenomenon of not being able to perceive things that are in plain sight. See
http://en.wikipedia.org/wiki/Inattentional blindness, last retrieved November 2010) or inattentional amnesia demonstrate the selective nature of attention. Thus, inferring the focus of attention from eye movements only is a limited approach. A more accurate model of attention can be obtained by looking at multiple physiological signals. Recent research has demonstrated related fixation duration and saccadic amplitudes to different modes of exploring visual images (
Pannasch & Velichkovsky, 2009).
An alternative approach to obtain a more accurate model of attention might consist in combining gaze direction with further evidences of attention coming from different modalities, for example the conversation (
Wood et al., 2006).
Gaze recurrence appears to be a promising marker. The measure that we have adapted in this work, namely gaze cross-recurrence seems to be positively related with team performance. These findings open the possibility of using this parameter to measure the quality of collaboration and eventually to offer a regulation feedback. However, we want to caution that this parameter is biased by many factors that need to be considered carefully. Indeed, as we have shown, gaze crossrecurrence is affected by the work strategy chosen by the collaborators (e.g., focusing on a small part of the screen vs. a larger area). Additionally, this measure is dependent on the complexity of the display and the way information is encoded in it. A poorly designed representation might place high demands on attention and therefore gaze.
Finally, gaze cross-recurrence is influenced by the symmetry of collaboration. Pairs working in parallel on different sub-tasks might have eye movements that cannot be compared. In fact, this marker becomes meaningful only when the participants are dealing with the same aspect of the task (e.g., looking at the same points of the screen at the same time). This naturally occurs under a management of the interaction following a collaborative paradigm but it is not necessarily the case for pairs adopting a cooperative paradigm.
Offering gaze feedback. We discuss here the same issue tackled by
Wood et al. (
2006): the introduction of an artificial feedback can cause usually correlated variables to become decoupled, as the users may adapt themselves in order to take advantage of this artificial feedback. Collaborators whose gaze movements might be transferred to their collaboration partners might learn to direct, more intentionally, their sight to specific spots of the interface with specific deictic purposes. Therefore, monitoring agents trained with patterns of behavior at early stages might register different responses from users after extended periods of use.
Shortcomings. We did not vary the task. In particular, we did not manipulate the need for using spatial references. Also, there were minor differences in the features of each chat application. In particular the surface of the map was slightly smaller in the ConcertChat condition compared to the MSN condition. We tried to compensate this difference reducing accordingly the threshold parameter used to calculate the recurrence. Our methodology should be validated in different domains.
Additionally, we have developed this research in the context of collaborative annotations of maps. Nonetheless, we argue that the findings of this work might be transferred to other domains of application, like, for example, collaborative remote text editing. Finally, we should note that the number of subjects was quite small.
