The Effects of Task Difficulty on Gaze Behaviour During Landing with Visual Flight Rules in Low-Time Pilots
Abstract
:Introduction
Materials and Methods
Participants
Apparatus
Scenario and Task
Data Reduction
Entropy Analysis
 (1)
(1)
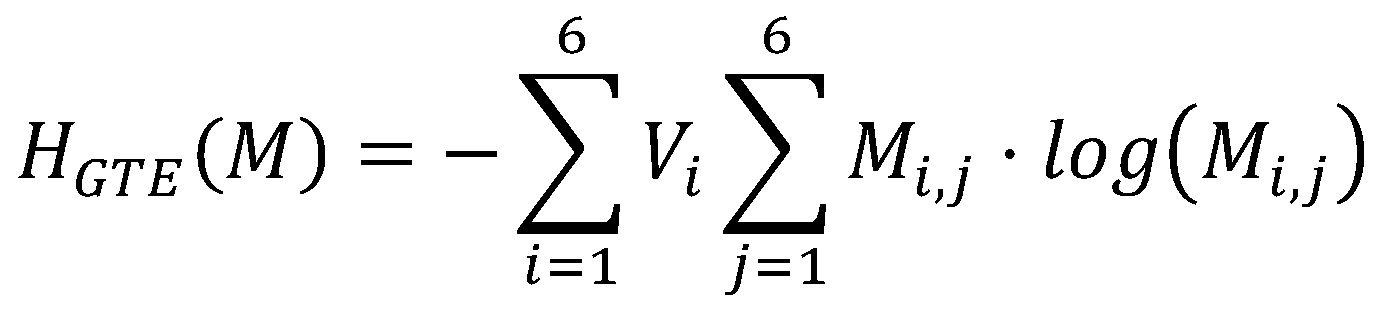 (2)
(2)
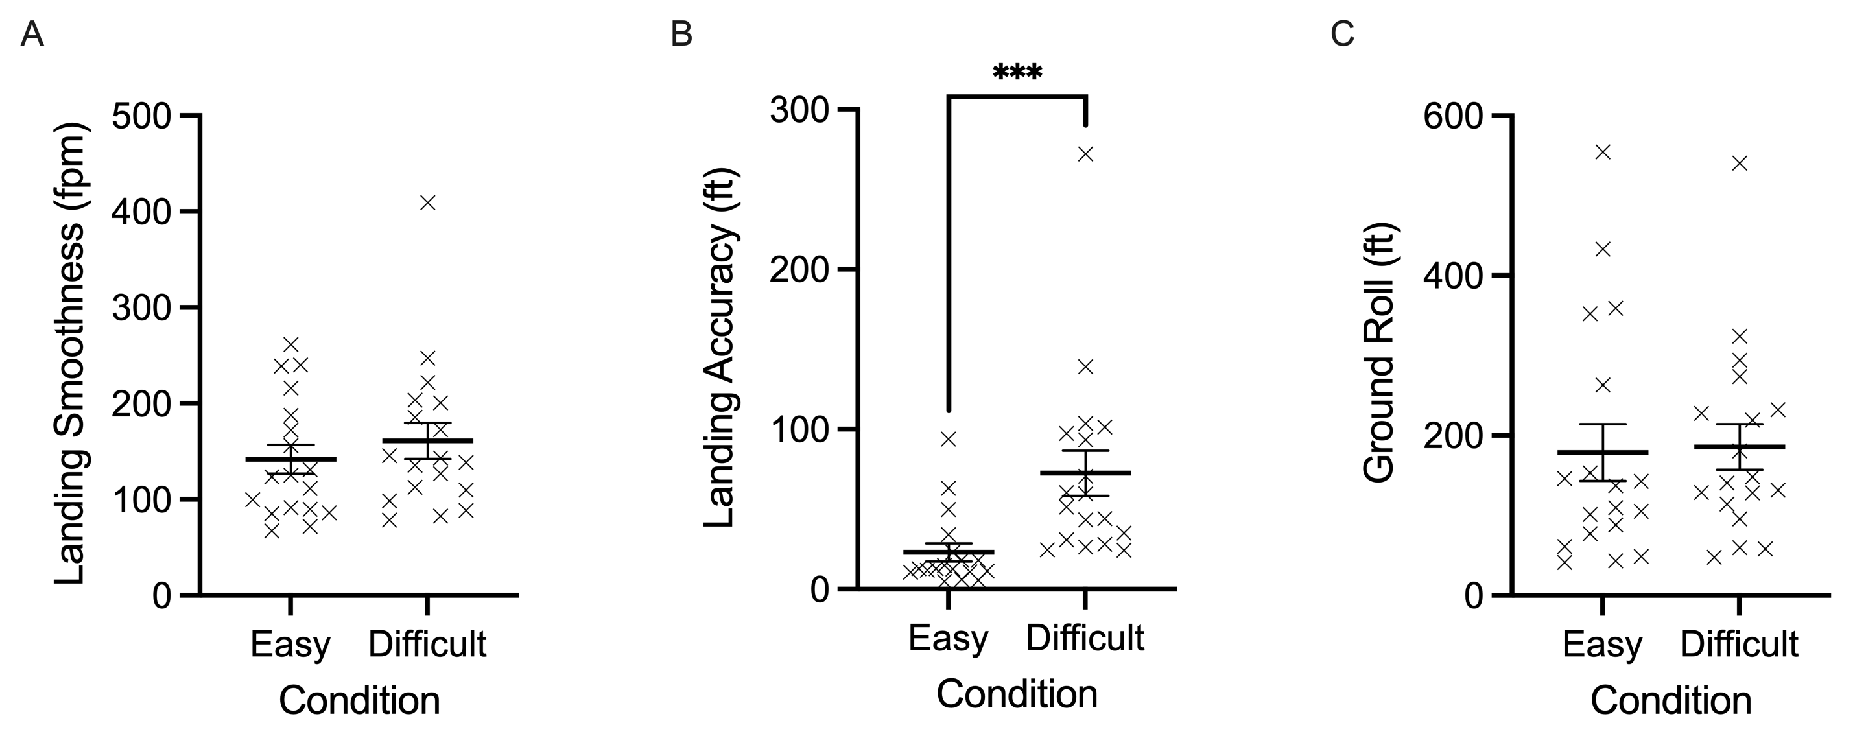
Performance Measures
 (3)
(3)
Results
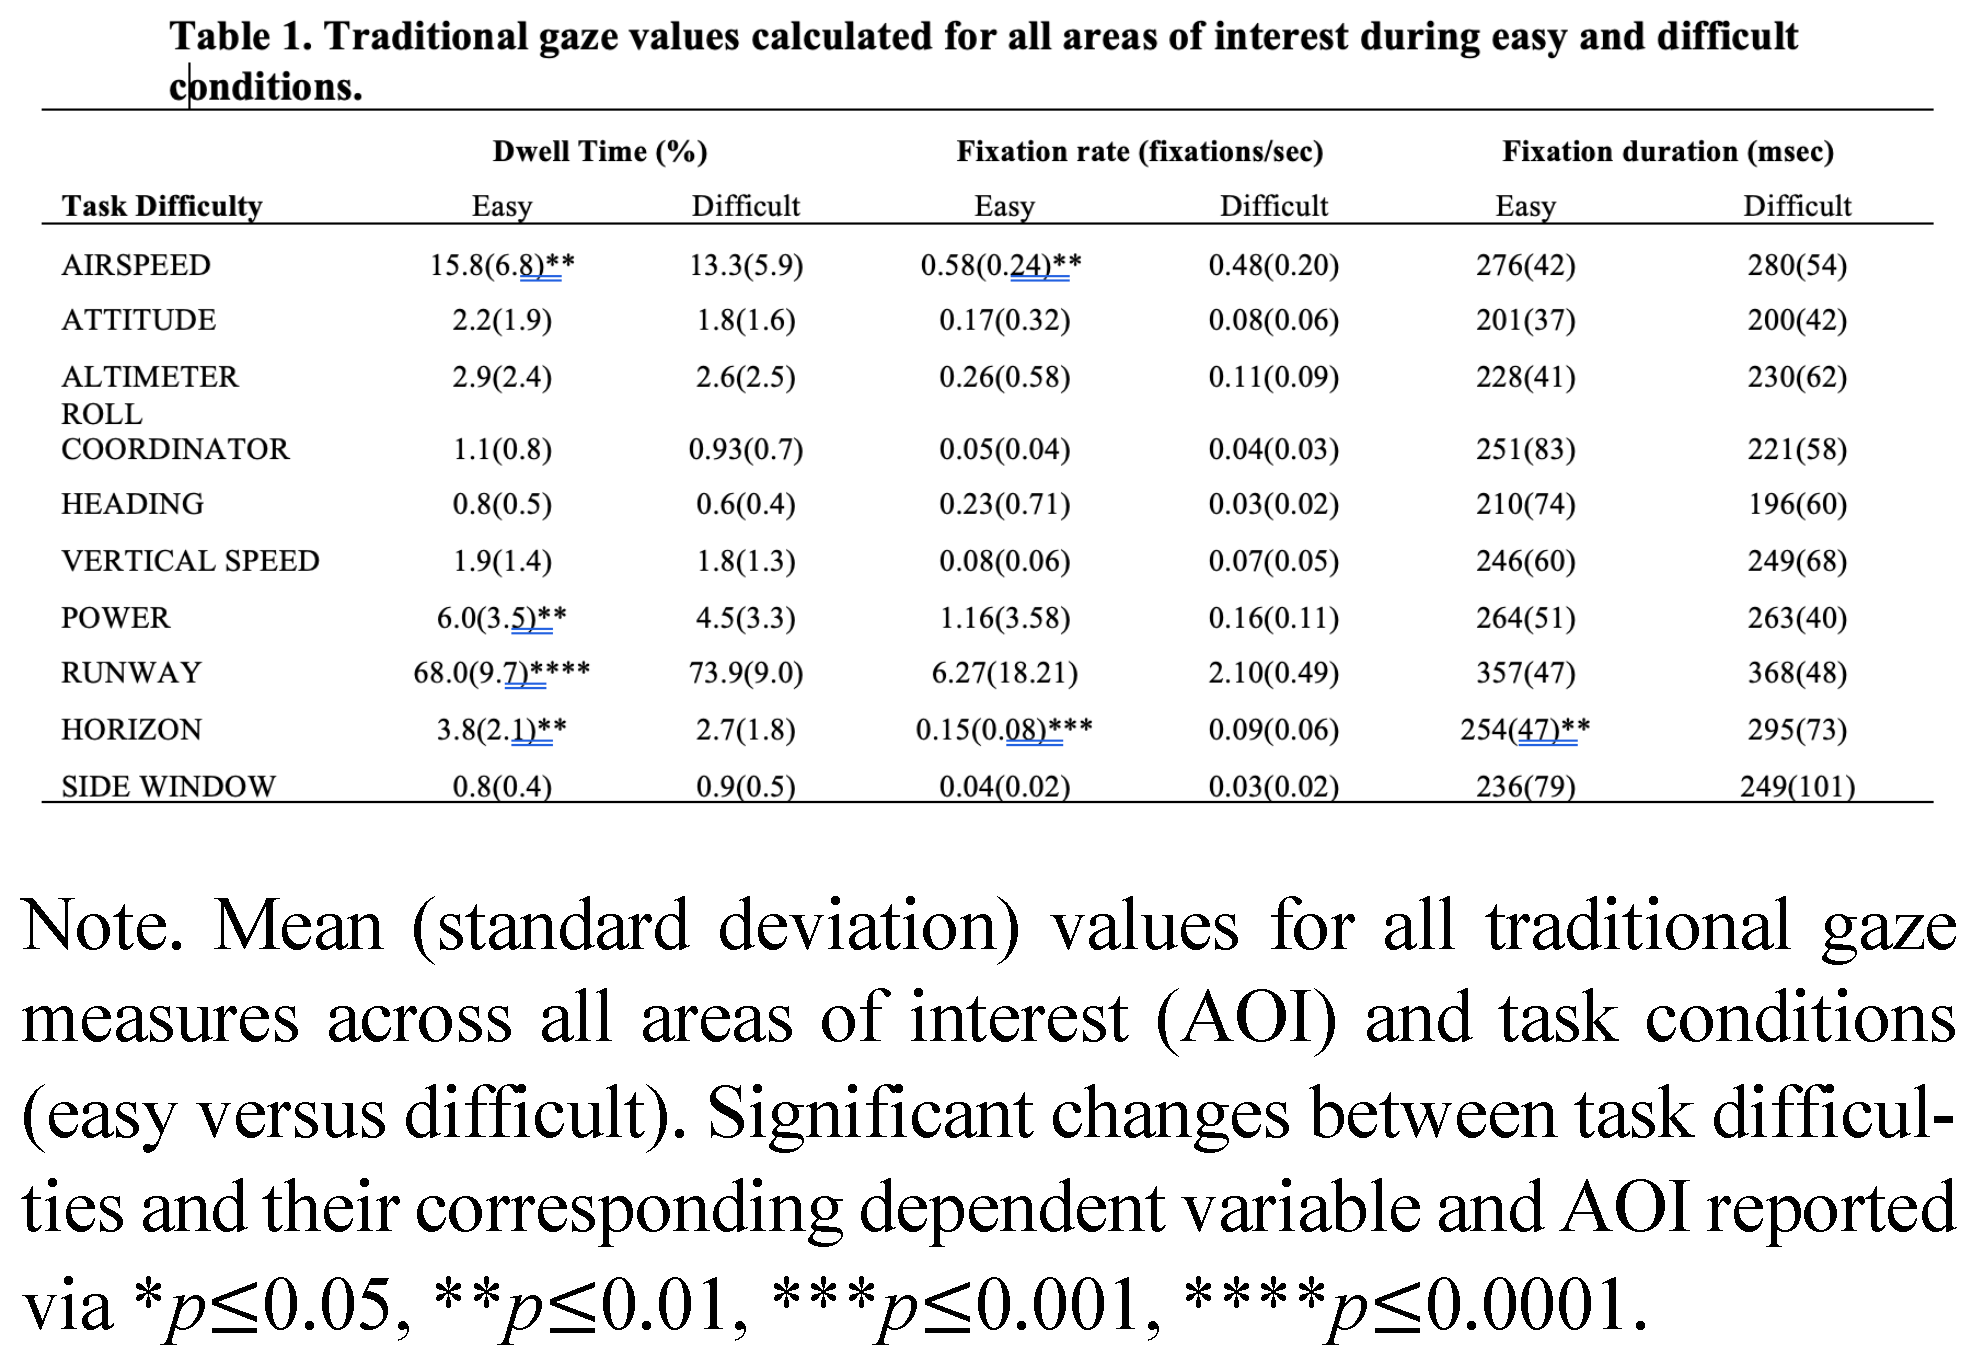
Traditional Gaze Measures
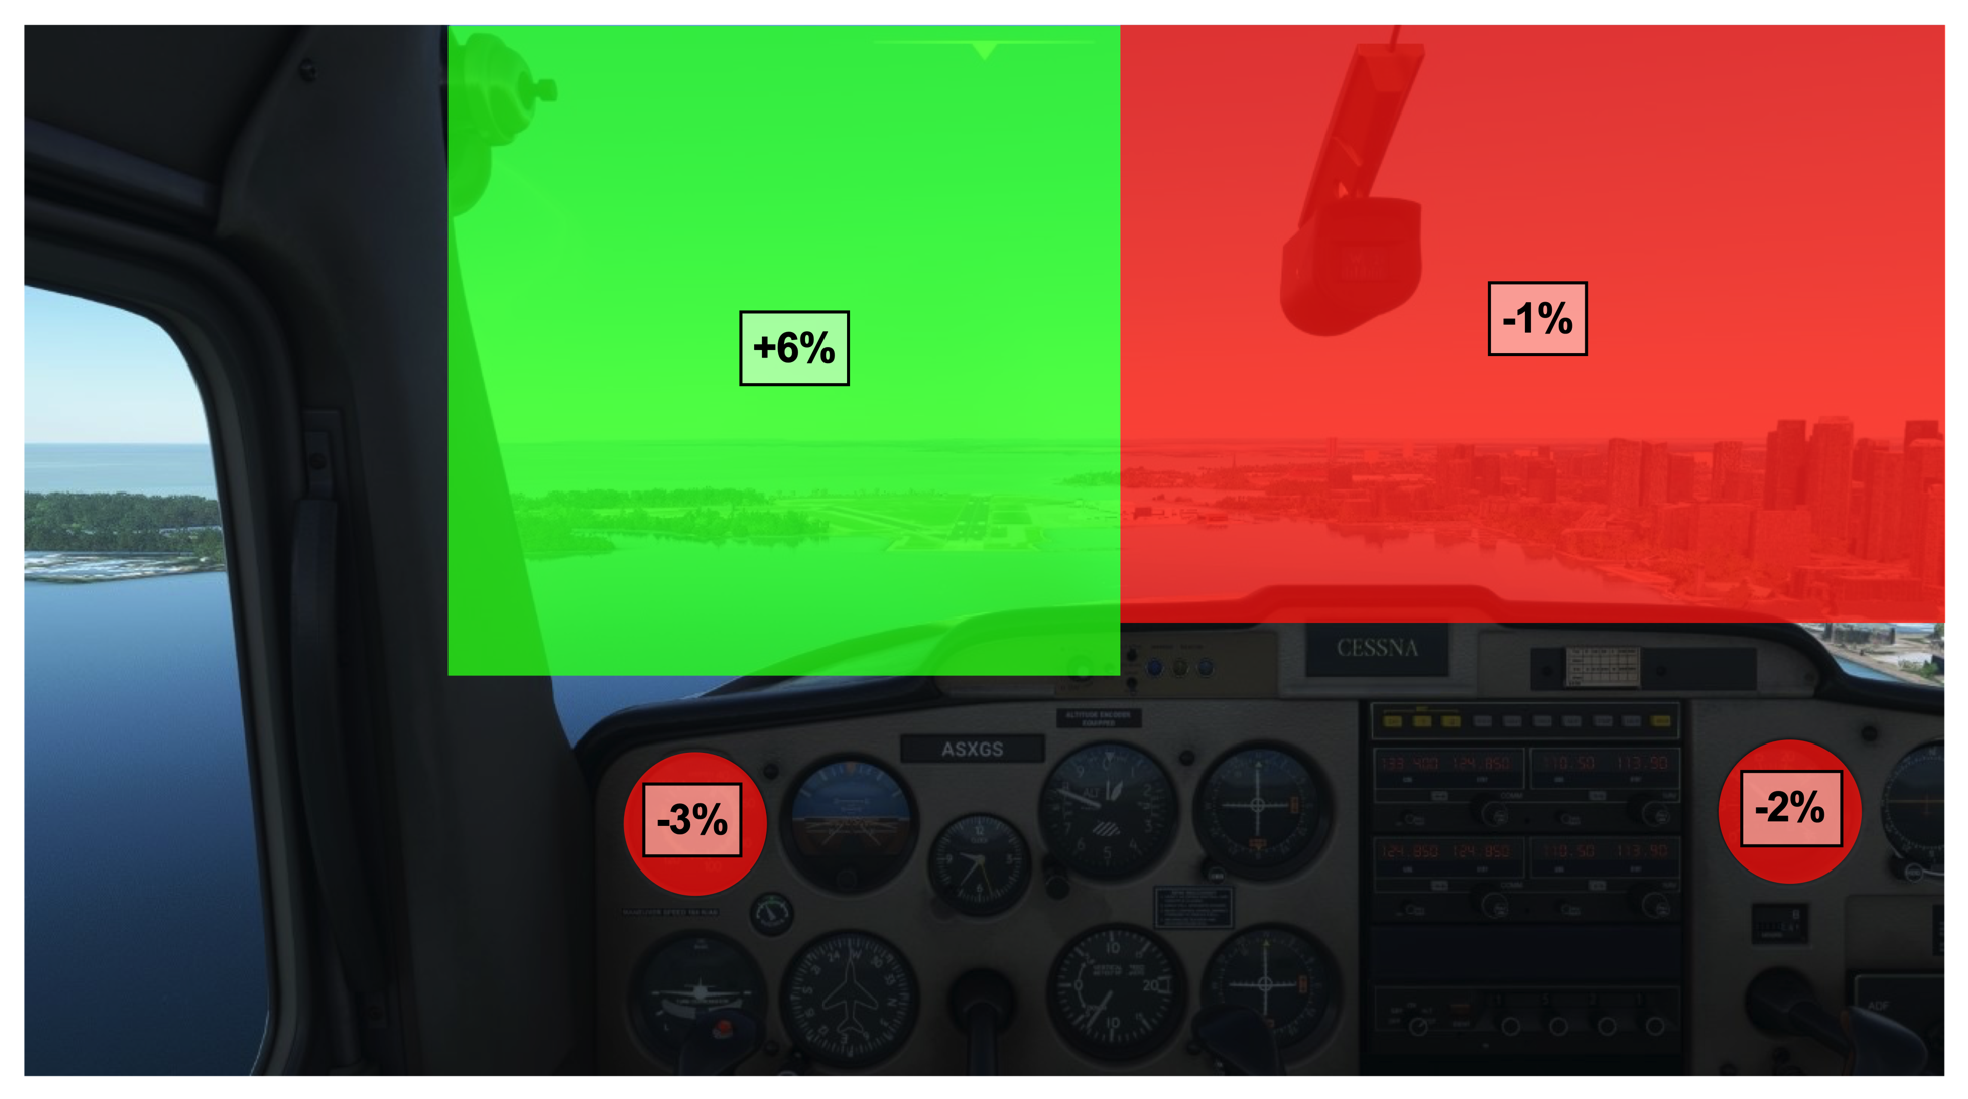
Entropy-Based Measures
Discussion
The Effect of Task Difficulty on Performance
The Effect of Task Difficulty on Pilot’s Gaze Behaviour
Limitations
Conclusions
Acknowledgments
Conflicts of Interest
References
- Abernethy, B. 1996. Training the visual-perceptual skills of athletes: Insights from the study of motor expertise. The American Journal of Sports Medicine 24: S89–S92. [Google Scholar] [PubMed]
- Andrzejewska, M., and A. Stolińska. 2016. Comparing the Difficulty of Tasks Using Eye Tracking Combined with Subjective and Behavioural Criteria. Journal of Eye Movement Research 9, 3. [Google Scholar] [CrossRef]
- Atik, O., and O. Arslan. 2019. Use of eye tracking for assessment of electronic navigation competency in maritime training. Journal of Eye Movement Research 12, 3. [Google Scholar] [CrossRef]
- Ayala, N., A. Zafar, and E. Niechwiej-Szwedo. 2022. Gaze behaviour: A window into distinct cognitive processes revealed by the Tower of London test. Vision Research.
- Allsop, J., and R. Gray. 2014. Flying under pressure: Effects of anxiety on attention and gaze behavior in aviation. Journal of Applied Research in Memory and Cognition 3, 2: 63–71. [Google Scholar]
- Allsop, J., R. Gray, H. H. Bülthoff, and L. Chuang. 2017. Eye movement planning on Single-SensorSingle-Indicator displays is vulnerable to user anxiety and cognitive load. Journal of Eye Movement Research 10, 5: 8. [Google Scholar] [CrossRef] [PubMed]
- Babu, M. D., D. V. JeevithaShree, G. Prabhakar, K. P. S. Saluja, A. Pashilkar, and P. Biswas. 2019. Estimating pilots’ cognitive load from ocular parameters through simulation and in-flight studies. Journal of Eye Movement Research 12, 3. [Google Scholar]
- Batty, M., R. Morphet, P. Masucci, and K. Stanilov. 2014. Entropy, complexity, and spatial information. Journal of Geographical Systems 16, 4: 363385. [Google Scholar]
- Beall, A. C., and J. M. Loomis. 1997. Optic flow and visual analysis of the base-to-final turn. The International Journal of Aviation Psychology 7, 3: 201–223. [Google Scholar] [CrossRef]
- Bellenkes, A. H., C. D. Wickens, and A. F. Kramer. 1997. Visual scanning and pilot expertise: The role of attentional flexibility and mental model development. Aviation, Space, and Environmental Medicine 68: 569–579. [Google Scholar]
- Bisley, J. W., and M. E. Goldberg. 2010. Attention, intention, and priority in the parietal lobe. Annual Review of Neuroscience 33: 1–21. [Google Scholar]
- Boeing. 2021. Statistical Summary of Commercial Jet Airplane Accidents-Worldwide Operations 19592021. https://www.boeing.com/resources/boeingdot-com/company/about_bca/pdf/statsum.pdf.
- Brams, S., I. T. Hooge, G. Ziv, S. Dauwe, K. Evens, T. De Wolf, O. Levin, J. Wagemans, and W. F. Helsen. 2018. Does effective gaze behavior lead to enhanced performance in a complex error-detection cockpit task? PLoS ONE 13, 11: e0207439. [Google Scholar]
- Brown, D. L., H. S. Vitense, P. A. Wetzel, and G. M. Anderson. 2002. Instrument scan strategies of F-117A Pilots. Aviation, Space, and Environmental Medicine 73, 10: 1007–1013. [Google Scholar] [PubMed]
- Burris, K., S. Liu, and L. Appelbaum. 2020. Visual-motor expertise in athletes: Insights from semiparametric modelling of 2317 athletes tested on the Nike SPARQ Sensory Station. Journal of Sports Sciences 38, 3: 320–329. [Google Scholar] [PubMed]
- Cao, S., S. Samuel, Y. Murzello, W. Ding, X. Zhang, and J. Niu. 2022. Hazard perception in driving: A systematic literature review. Transportation Research Record. [Google Scholar] [CrossRef]
- Ciuperca, G., and V. Girardin. 2007. Estimation of the entropy rate of a countable Markov chain. Communications in Statistics—Theory and Methods 36, 14: 2543–2557. [Google Scholar]
- Cvahte Ojsteršek, T., and D. Topolšek. 2019. Eye tracking use in researching driver distraction: A scientometric and qualitative literature review approach. Journal of Eye Movement Research 12, 3. [Google Scholar] [CrossRef]
- de Brouwer, A. J., J. R. Flanagan, and M. Spering. 2021. Functional use of eye movements for an acting system. Trends in Cognitive Sciences 25, 3: 252–263. [Google Scholar]
- Dehais, F., J. Behrend, V. Peysakhovich, M. Causse, and C. D. Wickens. 2017. Pilot flying and pilot monitoring’s aircraft state awareness during go-around execution in aviation: A behavioral and eye tracking study. The International Journal of Aerospace Psychology 27, 1–2: 15–28. [Google Scholar]
- Diaz-Piedra, C., H. Rieiro, A. Cherino, L. J. Fuentes, A. Catena, and L. L. Di Stasi. 2019. The effects of flight complexity on gaze entropy: An experimental study with fighter pilots. Applied Ergonomics 77: 9299. [Google Scholar]
- Dick, A. O. 1976. Spatial abilities. In Studies in Neurolinguistics. Academic Press: pp. 225–268. [Google Scholar]
- Dick, A. O. 1980. Instrument scanning and controlling: Using eye movement data to understand pilot behavior and strategies (NASA CR-3306). Washington, DC: National Aeronautics and Space Administration. [Google Scholar]
- Di Nocera, F., M. Camilli, and M. Terenzi. 2007. A random glance at the flight deck: Pilots’ scanning strategies and the real-time assessment of mental workload. Journal of Cognitive Engineering and Decision Making 1, 3: 271–285. [Google Scholar]
- Eysenck, M. W., N. Derakshan, R. Santos, and M. G. Calvo. 2007. Anxiety and cognitive performance: Attentional control theory. Emotion 7, 2: 336. [Google Scholar] [CrossRef]
- Federal Aviation Administration. 2021. Airplane Flying Handbook (FAA-H-8083-3C). Washington, DC: Federal Aviation Administration. [Google Scholar]
- Gegenfurtner, A., E. Lehtinen, and R. Säljö. 2011. Expertise differences in the comprehension of visualizations: A meta-analysis of eye-tracking research in professional domains. Educational Psychology Review 23, 4: 523–552. [Google Scholar] [CrossRef]
- Glaholt, M. G. 2014. Eye tracking in the cockpit: A review of the relationships between eye movements and the aviators cognitive state. https://apps.dtic.mil/sti/pdfs/AD1000097.pdf.
- Gray, R., J. A. Navia, and J. Allsop. 2014. Action-specific effects in aviation: What determines judged runway size? Perception 43, 2–3: 145–154. [Google Scholar] [CrossRef]
- Gonzalez, D. A., and E. Niechwiej-Szwedo. 2016. The effects of monocular viewing on hand-eye coordination during sequential grasping and placing movements. Vision Research 128: 30–38. [Google Scholar] [CrossRef]
- Harris, R. L., B. L. Glover, and A. A. Spady. 1986. Analytical techniques of pilot scanning behavior and their application (NASA TP-2525). Washington, DC: National Aeronautics and Space Administration. [Google Scholar]
- Hodgson, T. L., A. Bajwa, A. M. Owen, and C. Kennard. 2000. The strategic control of gaze direction in the Tower-of-London task. Journal of Cognitive Neuroscience 12, 5: 894–907. [Google Scholar] [CrossRef] [PubMed]
- Hodgson, T. L., G. Ezard, and F. Hermens. 2019. Eye Movements in Neuropsychological Tasks. Current Topics in Behavioral Neurosciences 41: 393–418. [Google Scholar] [CrossRef]
- Jacob, R. J., and K. S. Karn. 2003. Eye tracking in human-computer interaction and usability research: Ready to deliver the promises. In The mind's eye. North-Holland: pp. 573–605. [Google Scholar]
- Kandel, E., J. Schwartz, T. Jessell, S. Siegelbaum, and A. J. Hudspeth. 2012. Principles of Neural Science, 5th ed. McGraw-Hill Medical. [Google Scholar]
- Kaller, C. P., B. Rahm, K. Bolkenius, and J. M. Unterrainer. 2009. Eye movements and visuospatial problem solving: Identifying separable phases of complex cognition. Psychophysiology 46, 4: 818–830. [Google Scholar] [CrossRef]
- Kearns, S. K. 2021. Fundamentals of International Aviation, 2nd ed. Routledge. [Google Scholar]
- Kim, J., S. A. Palmisano, A. Ash, and R. S. Allison. 2008. Pilot gaze and glideslope control. ACM Transactions on Applied Perception (TAP) 7, 3: 1–18. [Google Scholar] [CrossRef]
- Krebs, M. J., and J. W. Wingert. 1976. Use of the oculometer in pilot workload measurement (NASA CR-144951). Washington, DC: National Aeronautics and Space Administration. [Google Scholar]
- Krejtz, K., T. Szmidt, A. T. Duchowski, and I. Krejtz. 2014. Entropy-based statistical analysis of eye movement transitions. In Proceedings of the Symposium on Eye Tracking Research and Applications. pp. 159–166. [Google Scholar]
- Land, M. F., and M. Hayhoe. 2001. In what ways do eye movements contribute to everyday activities? Vision Research 41, 25–26: 3559–3565. [Google Scholar] [CrossRef]
- León, J. A., J. D. Moreno, I. Escudero, and J. K. Kaakinen. 2019. Selective attention to question-relevant text information precedes high-quality summaries: Evidence from eye movements. Journal of Eye Movement Research 12, 1. [Google Scholar] [CrossRef]
- Lemonnier, S., R. Brémond, and T. Baccino. 2014. Discriminating cognitive processes with eye movements in a decision-making driving task. Journal of Eye Movement Research 7, 4. [Google Scholar] [CrossRef]
- Liu, S., R. Donaldson, A. Subramaniam, H. Palmer, C. D. Champion, M. L. Cox, and L. G. Appelbaum. 2021. Developing expert gaze pattern in laparoscopic surgery requires more than behavioral training. Journal of Eye Movement Research 14, 2. [Google Scholar] [CrossRef]
- Lounis, C., V. Peysakhovich, and M. Causse. 2021. Visual scanning strategies in the cockpit are modulated by pilots’ expertise: A flight simulator study. PLoS ONE 16, 2: e0247061. [Google Scholar]
- Lu, T., Z. Lou, F. Shao, Y. Li, and X. You. 2020. Attention and Entropy in Simulated Flight with Varying Cognitive Loads. Aerospace Medicine and Human Performance 91, 6: 489–495. [Google Scholar] [PubMed]
- Martin, L., A. Tapper, D. A. Gonzalez, M. Leclerc, and E. Niechwiej-Szwedo. 2017. The effects of task-relevant saccadic eye movements performed during the encoding of a serial sequence on visuospatial memory performance. Experimental Brain Research 235, 5: 1519–1529. [Google Scholar]
- Martinez-Conde, S., J. Otero-Millan, and S. L. Macknik. 2013. The impact of microsaccades on vision: Towards a unified theory of saccadic function. Nature Reviews Neuroscience 14, 2: 83–96. [Google Scholar] [CrossRef]
- Menekşe Dalveren, G. G., and N. E. Cagiltay. 2018. Using Eye-Movement Events to Determine the Mental Workload of Surgical Residents. Journal of Eye Movement Research 11, 4. [Google Scholar] [CrossRef]
- Mertens, H. W., and M. F. Lewis. 1981. Effect of different runway size on pilot performance during simulated night landing approaches. Federal Aviation Administration Washington DC Office of Aviation Medicine. [Google Scholar]
- National Transportation Safety Board. 1994. A Review of Flightcrew-Involved, Major Accidents of US Air Carriers, 1978 Through 1990. https://reports.aviationsafety.net/1994/19940618-1_LJ25_XA-BBA.pdf.
- Nitschke, K., N. Ruh, S. Kappler, C. Stahl, and C. P. Kaller. 2012. Dissociable stages of problem solving (I): Temporal characteristics revealed by eye-movement analyses. Brain and Cognition 80, 1: 160–169. [Google Scholar]
- Niu, Y. F., Y. Gao, Y. T. Zhang, C. Q. Xue, and L. X. Yang. 2020. Improving eye–computer interaction interface design: Ergonomic investigations of the optimum target size and gaze-triggering dwell time. Journal of Eye Movement Research 12, 3. [Google Scholar] [CrossRef]
- Paas, F., and J. J. van Merriënboer. 2020. Cognitive-load theory: Methods to manage working memory load in the learning of complex tasks. Current Directions in Psychological Science 29, 4: 394–398. [Google Scholar]
- Peißl, S., C. D. Wickens, and R. Baruah. 2018. Eyetracking measures in aviation: A selective literature review. The International Journal of Aerospace Psychology 28, 3–4: 98–112. [Google Scholar] [CrossRef]
- Sarter, N. B., R. J. Mumaw, and C. D. Wickens. 2007. Pilots’ monitoring strategies and performance on automated flight decks: An empirical study combining behavioral and eye-tracking data. Human Factors 49, 3: 347–357. [Google Scholar]
- Shannon, C. E. 1948. A Mathematical Theory of Communication. The Bell System Technical Journal 27, 3: 379–423. [Google Scholar] [CrossRef]
- Shappell, S. A., and D. A. Wiegmann. 2000. The human factors analysis and classification system--HFACS. [Google Scholar]
- Shiferaw, B., L. Downey, and D. Crewther. 2019. A review of gaze entropy as a measure of visual scanning efficiency. Neuroscience & Biobehavioral Reviews 96: 353–366. [Google Scholar]
- Shiferaw, B. A., L. A. Downey, J. Westlake, B. Stevens, S. M. Rajaratnam, D. J. Berlowitz, P. Swann, and M. E. Howard. 2018. Stationary gaze entropy predicts lane departure events in sleep-deprived drivers. Scientific Reports 8, 1: 1–10. [Google Scholar]
- Spady, A. A., Jr. 1978. Airline pilot scan patterns during simulated ILS approaches (NASA TP-1250). Washington, DC: National Aeronautics and Space Administration. [Google Scholar]
- Tole, J. R., A. T. Stephens, R. L. Harris, and A. R. Ephrath. 1982. Visual scanning behavior and mental workload in aircraft pilots. Aviation, Space, and Environmental Medicine 53, 1: 54–61. [Google Scholar]
- Tole, J. R., A. T. Stephens, E. A. Vivaudou, and L. R. Young. 1983. Visual scanning behavior and pilot workload (NASA CR-3717). Washington, DC: National Aeronautics and Space Administration. [Google Scholar]
- van de Merwe, K., H. Van Dijk, and R. Zon. 2012. Eye movements as an indicator of situation awareness in a flight simulator experiment. The International Journal of Aviation Psychology 22, 1: 78–95. [Google Scholar]
- van Dijk, H., K. van de Merwe, and R. Zon. 2011. A Coherent Impression of the Pilots’ Situation Awareness: Studying relevant human factors tools. The International Journal of Aviation Psychology 21, 4: 343356. [Google Scholar]
- Vansteenkiste, P., M. Lenoir, I. Krejtz, and K. Krejtz. 2022. Visual strategies of young soccer players during a passing test—A pilot study. Journal of Eye Movement Research 15, 1. [Google Scholar] [CrossRef]
- Velichkovsky, B. M., M. Joos, J. R. Helmert, and S. Pannasch. 2005. Two visual systems and their eye movements: Evidence from static and dynamic scene perception. In Proceedings of the XXVII Conference of the Cognitive Science Society. Vol. 1. [Google Scholar]
- Vickers, J. N., and A. M. Williams. 2017. The role of mental processes in elite sports performance. In Oxford Research Encyclopedia of Psychology. [Google Scholar]
- Vlačić, S. I., A. Z. Knežević, S. Mandal, S. Rođenkov, and P. Vitsas. 2020. Improving the pilot selection process by using eye-tracking tools. Journal of Eye Movement Research 12, 3. [Google Scholar] [CrossRef] [PubMed]
- Waller, M. C. 1976. An investigation of correlation between pilot scanning behavior and workload using stepwise regression analysis (NASA TM X-3344). Washington, DC: National Aeronautics and Space Administration. [Google Scholar]
- Weiss, R. S., R. Remington, and S. R. Ellis. 1989. Sampling distributions of the entropy in visual scanning. Behavior Research Methods, Instruments, & Computers 21, 3: 348–352. [Google Scholar]
- Xiong, W., Y. Wang, Q. Zhou, Z. Liu, and X. Zhang. 2016. The research of eye movement behavior of expert and novice in flight simulation of landing. In International Conference on Engineering Psychology and Cognitive Ergonomics. pp. 485–493. [Google Scholar]
- Ziv, G. 2016. Gaze behavior and visual attention: A review of eye tracking studies in aviation. The International Journal of Aviation Psychology 26, 3–4: 75–104. [Google Scholar]
- Ziv, G., and R. Lidor. 2016. The effect of age on gaze behavior in drivers and pedestrians—A review. Journal of Eye Movement Research 9, 7. [Google Scholar] [CrossRef]
- Zelinsky, G. J., and D. L. Sheinberg. 1997. Eye movements during parallel-serial visual search. Journal of Experimental Psychology: Human Perception and Performance 23, 1: 244. [Google Scholar] [CrossRef]


© 2023 by the authors. This article is licensed under a Creative Commons Attribution 4.0 International License.
Share and Cite
Ayala, N.; Zafar, A.; Kearns, S.; Irving, E.; Cao, S.; Niechwiej-Szwedo, E. The Effects of Task Difficulty on Gaze Behaviour During Landing with Visual Flight Rules in Low-Time Pilots. J. Eye Mov. Res. 2023, 16, 1-16. https://doi.org/10.16910/jemr.16.1.3
Ayala N, Zafar A, Kearns S, Irving E, Cao S, Niechwiej-Szwedo E. The Effects of Task Difficulty on Gaze Behaviour During Landing with Visual Flight Rules in Low-Time Pilots. Journal of Eye Movement Research. 2023; 16(1):1-16. https://doi.org/10.16910/jemr.16.1.3
Chicago/Turabian StyleAyala, Naila, Abdullah Zafar, Suzanne Kearns, Elizabeth Irving, Shi Cao, and Ewa Niechwiej-Szwedo. 2023. "The Effects of Task Difficulty on Gaze Behaviour During Landing with Visual Flight Rules in Low-Time Pilots" Journal of Eye Movement Research 16, no. 1: 1-16. https://doi.org/10.16910/jemr.16.1.3
APA StyleAyala, N., Zafar, A., Kearns, S., Irving, E., Cao, S., & Niechwiej-Szwedo, E. (2023). The Effects of Task Difficulty on Gaze Behaviour During Landing with Visual Flight Rules in Low-Time Pilots. Journal of Eye Movement Research, 16(1), 1-16. https://doi.org/10.16910/jemr.16.1.3