Pupillary and Microsaccadic Responses to Cognitive Effort and Emotional Arousal During Complex Decision Making
Abstract
:Introduction & Background
Cognitive effort in decision making
Pupil size, cognitive effort and arousal
Microsaccades and information processing
The Present Study
Method
Participants
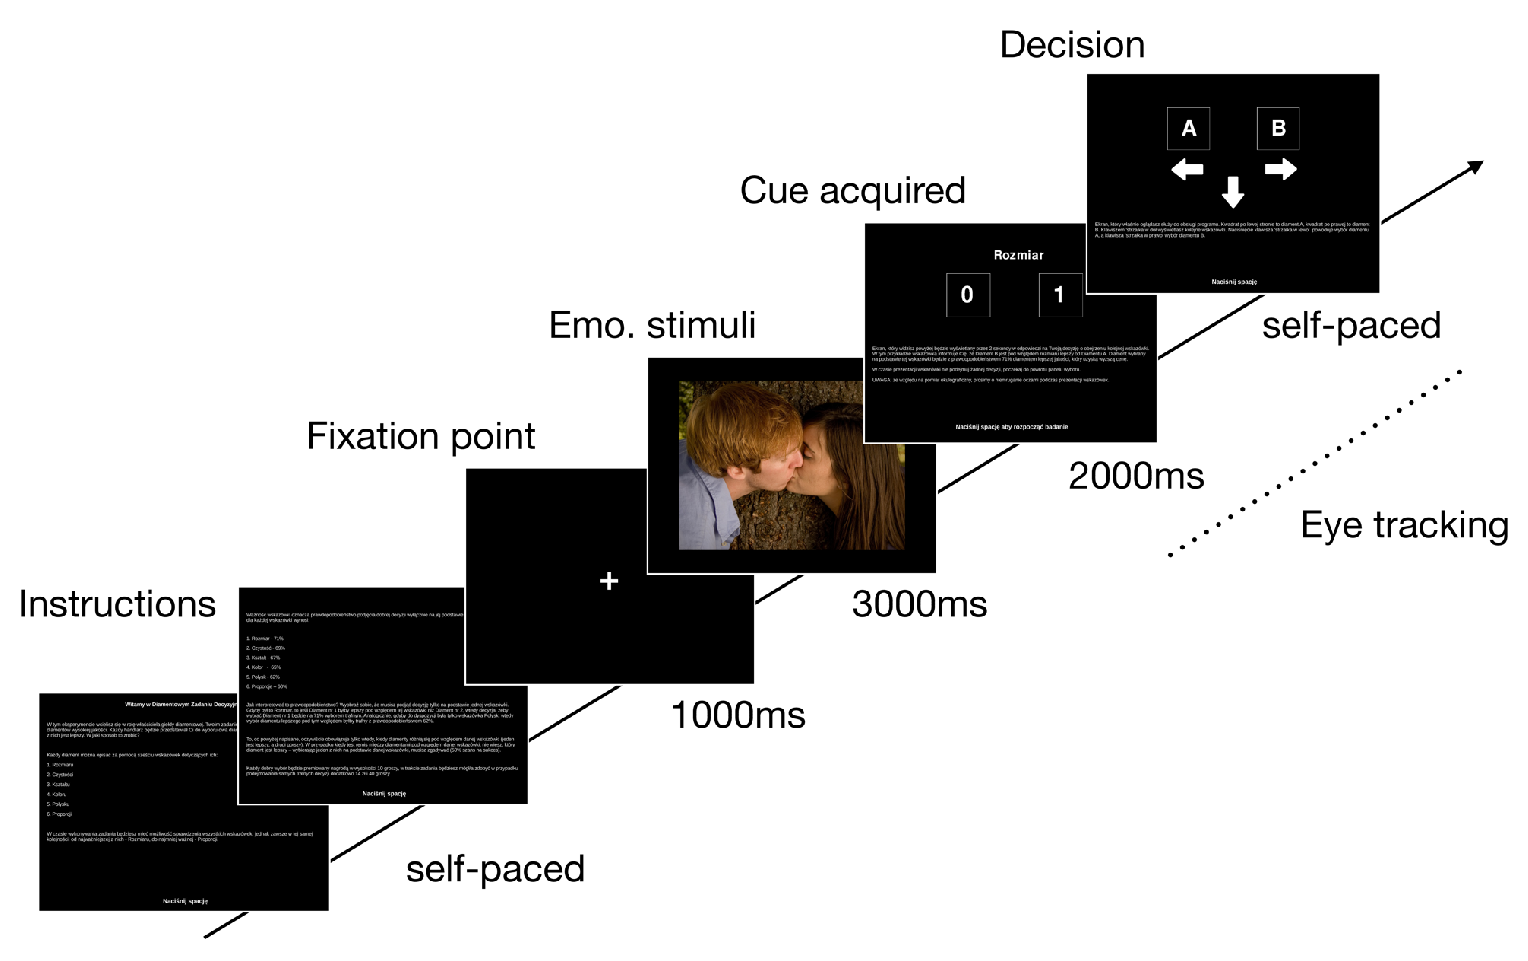
Procedure
The decision-making task
Affective Priming
Apparatus
Data Preprocessing
Results
Behavioral Responses
Pupil Diameter
Microsaccades
General Discussion
Pupil size vs. cognitive effort and affective priming
Microsaccades vs. cognitive effort and affective priming
Ethics and Conflict of Interest
Acknowledgments
References
- Alnæs, D., M. H. Sneve, T. Espeseth, T. Endestad, S. H. P. van de Pavert, and B. Laeng. 2014. Pupil size signals mental effort deployed during multiple object tracking and predicts brain activity in the dorsal attention network and the locus coeruleus. Journal of vision 14, 4: 1–1. [Google Scholar] [CrossRef]
- Assadi, S. M., M. Yücel, and C. Pantelis. 2009. Dopa-mine modulates neural networks involved in effort-based decision-making. Neuroscience & Biobehavioral Reviews 33, 3: 383–393. [Google Scholar] [CrossRef]
- Beatty, J. 1982. Task-evoked pupillary responses, processing load, and the structure of processing resources. Psychological Bulletin 91, 2: 276–292. [Google Scholar] [CrossRef]
- Bradley, M. M., L. Miccoli, M. A. Escrig, and P. J. Lang. 2008. The pupil as a measure of emotional arousal and autonomic activation. Psychophysiology 45: 602–607. [Google Scholar] [CrossRef]
- Botvinick, M. M. 2007. Conflict monitoring and decision making: reconciling two perspectives on anterior cingulate function. Cognitive, Affective, & Behavioral Neuroscience 7, 4: 356–366. [Google Scholar] [CrossRef]
- Bröder, A. 2003. Decision making with the “adaptive toolbox”: Influence of environmental structure, intelligence, and working memory load. Journal of Experimental Psychology Learning, Memory and Cognition 29: 611–625. [Google Scholar] [CrossRef]
- Chen, Y., S. Martinez-Conde, S. L. Macknik, Y. Bereshpolova, H. A. Swadlow, and J.-M. Alonso. 2008. Task difficulty modulates the activity of specific neu-ronal populations in primary visual cortex. Nature Neuroscience 11, 8: 974–982. [Google Scholar] [CrossRef]
- Costa, V. D., and P. H. Rudebeck. 2016. More than Meets the Eye: the Relationship between Pupil Size and Locus Coerulus Activity. Neuron 89, 1: 8–10. [Google Scholar] [CrossRef]
- Dalmaso, M., L. Castelli, P. Scatturin, and G. Galfano. 2017. Working memory load modulates microsaccadic rate. Journal of Vision 17, 3: 1–12. [Google Scholar] [CrossRef]
- Di Stasi, L. L., M. B. McCamy, A. Catena, S. L. Macknik, J.J. Cañas, and S. Martinez-Conde. 2013. Microsaccade and drift dynamics reflect mental fatigue. European Journal of Neuroscience 38, 3: 2389–2398. [Google Scholar] [CrossRef]
- Dreisbach, G., and R. Fischer. 2012. Conflicts as aversive signals. Brain and Cognition 78, 2: 94–98. [Google Scholar] [CrossRef]
- Duchowski, A. T., K. Krejtz, N. Gehrer, T. Bafna, and P. Bækgaard. 2020. The Low/High Index of Pupillary Activity. In Proceedings of the 48th annual ACM Conference on Human Factors in Computing Systems (CHI’20). ACM. [Google Scholar] [CrossRef]
- Duchowski, A. T., K. Krejtz, I. Krejtz, C. Biele, A. Niedzielska, P. Kiefer, M. Raubal, and I. Giannopoulos. 2018. The Index of Pupillary Activity. In Proceedings of the 46th annual ACM Conference on Human Factors in Computing Systems (CHI’18). ACM. [Google Scholar] [CrossRef]
- Duchowski, A. T., E. Medlin, N. Cournia, A. Gramopadhye, S. Nair, J. Vorah, and B. Melloy. 2002. 3D Eye Movement Analysis. Behavior Research Methods, Instruments, Computers (BRMIC) 34, 4: 573–591. [Google Scholar] [CrossRef] [PubMed]
- Engbert, R. 2006. Microsaccades: a microcosm for research on oculomotor control, attention, and visual perception. Edited by S. Martinez-Conde, S. L. Macknik, L. M. Martinez, J.-M. Alonso and P. U. Tse. In Progress in Brain Research. Elsevier B.V: Vol. 154A, pp. 177–192. [Google Scholar] [CrossRef]
- Engbert, R., and R. Kliegl. 2003. Microsaccades uncover the orientation of covert attention. Vision Research 43: 1035–1045. [Google Scholar] [CrossRef]
- Engbert, R., K. Mergenthaler, P. Sinn, and A. Pikovsky. 2011. An integrated model of fixational eye movements and microsaccades. Proceedings of the National Academy of Sciences of the United States of America 108: E765–E770. [Google Scholar] [CrossRef]
- Fritz, J., and G. Dreisbach. 2015. The time course of the aversive conflict signal. Experimental psychology 62, 1: 30–39. [Google Scholar] [CrossRef]
- Foote, S. L., and J. H. Morrison. 1987. Extrathalamic modulation of cortical function. Annual Review of Neuroscience 10, 1: 67–95. [Google Scholar] [CrossRef]
- Gao, X., H. Yan, and H.-j. Sun. 2015. Modulation of microsaccade rate by task difficulty revealed through between- and within-trial comparisons. Journal of Vision 15, 3: 1–15. [Google Scholar] [CrossRef]
- Gigerenzer, G., P. M. Todd, and the ABC Research Group. 1999. Simple Heuristics That Make Us Smart. Oxford University Press. [Google Scholar]
- Hafed, Z. M., L. Goffart, and R. J. Krauzlis. 2009. A neural mechanism for microsaccade generation in the primate superior colliculus. Science 323, 5916: 940–943. [Google Scholar] [CrossRef]
- Hess, E. H., and J. M. Polt. 1960. Pupil size as related to interest value of visual stimuli. Science 132: 349–350. [Google Scholar] [CrossRef]
- Hess, E. H., and J. M. Polt. 1964. Pupil Size in Relation to Mental Activity during Simple Problem Solving. Science 143, 3611: 1190–1192. [Google Scholar] [CrossRef]
- Hyönä, J., J. Tommola, and A. M. Alaja. 1995. Pupil Dilation as a Measure of Processing Load in Simultane-ous Interpretation and Other Language Tasks. The Quarterly Journal of Experimental Psychology 48, 3: 598–612. [Google Scholar] [CrossRef] [PubMed]
- Joshi, S., Y. Li, R. M. Kalwani, and J. I. Gold. 2016. Relationships between pupil diameter and neuronal activity in the locus coeruleus, colliculi, and cingulate cortex. Neuron 89, 1: 221–234. [Google Scholar] [CrossRef]
- Kahneman, D., and J. Beatty. 1966. Pupillary Diameter and Load on Memory. Science 154, 3756: 1583–1585. [Google Scholar] [CrossRef] [PubMed]
- Khader, P. H., T. Pachur, S. Meier, S. Bien, K. Jost, and F. Rösler. 2011. Memory-based decision-making with heuristics: evidence for a controlled activation of memory representations. Journal of Cognitive Neuroscience 23, 11: 3540–3554. [Google Scholar] [CrossRef] [PubMed]
- Kashihara, K., K. Okanoya, and N. Kawai. 2014. Emotional attention modulates microsaccadic rate and direction. Psychological Research 78: 166–179. [Google Scholar] [CrossRef]
- Krejtz, K., A. T. Duchowski, A. Niedzielska, C. Biele, and I. Krejtz. 2018. Eye tracking cognitive load using pupil diameter and microsaccades with fixed gaze. PLoS ONE 13, 9. [Google Scholar] [CrossRef]
- Laeng, B., S. Sirois, and G. Gredebäck. 2012. Pupillometry: A Window to the Preconscious? Perspectives on Psychological Science 7, 1: 18–27. [Google Scholar] [CrossRef]
- Lang, J. P., M. M. Bradley, and N. B. Cuthbert. 1999. International affective picture system (IAPS): affective ratings of pictures and instruction manual. Technical Report. [Google Scholar]
- Li, L., X. Feng, Z. Zhou, H. Zhang, Q. Shi, Z. Lei, P. Shen, Q. Yang, B. Zhao, S. Chen, L. Li, Y. Zhang, P. Wen, Z. Lu, X. Li, F. Xu, and L. Wang. 2018. Stress accelerates defensive responses to looming in mice and involves a locus coeruleus-superior colliculus projection. Current Biology 28, 6: 859–871. [Google Scholar] [CrossRef]
- Marchewka, A., Żurawski, K. Jednoróg, and A. Grabow-ska. 2014. The Nencki Affective Picture System (NAPS): introduction to a novel, standardized, widerange, high-quality, realistic picture database. Behavior Research Methods 46, 2: 596–610. [Google Scholar] [CrossRef]
- Martignon, L., and U. Hoffrage. 1999. When do people use simple heuristics, and how can we tell? Edited by G. Gigerenzer, P. M. Todd and the ABC Research Group. In Simple Heuristics that Make Us Smart. Oxford University Press: pp. 119–140. [Google Scholar]
- Martinez-Conde, S., S. L. Macknik, X. G. Troncoso, and D. H. Hubel. 2009. Microsaccades: a neurophysiological analysis. Trends in Neurosciences 32, 9: 463–475. [Google Scholar] [CrossRef]
- Murphy, P. R., R. G. O’Connell, M. O’Sullivan, I. H. Robertson, and J. H. Balsters. 2014. Pupil diameter covaries with BOLD activity in human locus coeruleus. Human brain mapping 35, 8: 4140–4154. [Google Scholar] [CrossRef] [PubMed]
- Newell, B., and D. Shanks. 2003. Take the best or look at the rest? factors influencing one-reason decision making. Journal of experimental psychology. Learning, memory, and cognition 29: 53–65. [Google Scholar] [CrossRef] [PubMed]
- Nieuwenhuis, S., G. Aston-Jones, and J. D. Cohen. 2005. Decision making, the P3, and the locus coeruleus-norepinephrine system. Psychological Bulletin 131, 4: 510–532. [Google Scholar] [CrossRef]
- Oh-Descher, H., M. J. Beck, S. Ferrari, M. Sommer, and T. Egner. 2017. Probabilistic inference under time pressure leads to a cortical-to-subcortical shift in decision evidence integration. NeuroImage 162: 138–150. [Google Scholar] [CrossRef]
- Otero-Millan, J., X. G. Troncoso, S. L. Macknik, I. Serrano-Pedraza, and S. Martinez-Conde. 2008. Saccades and microsaccades during visual fixation, exploration, and search: Foundations for a common saccadic generator. Journal of Vision 8, 14: 21. [Google Scholar] [CrossRef]
- Partala, T., and V. Surakka. 2003. Pupil size variation as an indication of affective processing. International Journal of Human-Computer Studies 59: 185–198. [Google Scholar] [CrossRef]
- Payne, J. W., J. R. Bettman, and E. J. Johnson. 1993. The adaptive decision maker. Cambridge University Press. [Google Scholar] [CrossRef]
- Payne, W. J., J.R. Bettman, and E. J. Johnson. 1988. Adaptive strategy selection in decision making. Journal of Experimental Psychology: Learning, Memory and Cognition 14, 3: 534–552. [Google Scholar] [CrossRef]
- Peirce, J. W. 2007. PsychoPy–Psychophysics Software in Python. Journal of neuroscience methods 162, 1: 8–13. [Google Scholar] [CrossRef]
- R Development Core Team. 2011. R: A Language and Environment for Statistical Computing [Computer software manual]. Available online: http://www.R-project.org/.
- Rieskamp, J. 2008. The importance of learning when making inferences. Judgment and Decision Making 3, 3: 261–277. [Google Scholar] [CrossRef]
- Rieskamp, J., and U. Hoffrage. 1999. When do people use simple heuristics, and how can we tell? Edited by G. Gigerenzer, P. M. Todd and the ABC Research Group. In Simple Heuristics that Make Us Smart. Oxford University Press: pp. 141–605. [Google Scholar]
- Siegenthaler, E., F. M. Costela, M. B. McCamy, L. L. Di Stasi, J. Otero-Millan, A. Sonderegger, R. Groner, S. Macknik, and S. Martinez-Conde. 2014. Task difficulty in mental arithmetic affects microsaccadic rates and magnitudes. European Journal of Neuroscience 39, 1: 287–294. [Google Scholar] [CrossRef]
- Takakusaki, K., K. Saitoh, H. Harada, and M. Kashiwayanagi. 2004. Role of basal ganglia–brainstem pathways in the control of motor behaviors. Neuroscience Research 50, 2: 137–151. [Google Scholar] [CrossRef] [PubMed]
- Van der Wel, P., and H. Steenbergen. 2018. Pupil dilation as an index of effort in cognitive control tasks: A review. Psychonomic Bulletin & Review 154, 3756: 1583–1585. [Google Scholar] [CrossRef]
- Van Steenbergen, H. 2015. Affective modulation of cognitive control: A biobehavioral perspective. In Handbook of biobehavioral approaches to self-regulation. Springer: pp. 89–107. [Google Scholar]
- Van Steenbergen, H., G. P. Band, and B. Hommel. 2010. In the mood for adaptation: How affect regulates conflict-driven control. Psychological Science 21, 11: 1629–1634. [Google Scholar] [CrossRef] [PubMed]
- Van Steenbergen, H., G. P. Band, and B. Hommel. 2012. Reward valence modulates conflict-driven attentional adaptation: Electrophysiological evidence. Biological psychology 90, 3: 234–241. [Google Scholar] [CrossRef]
- Van Steenbergen, H., M. Eikemo, and S. Leknes. 2019. The role of the opioid system in decision making and cognitive control: A review. Cognitive, Affective, & Behavioral Neuroscience 19, 3: 435–458. [Google Scholar] [CrossRef]
- Van Steenbergen, H., S. J. Langeslag, G. P. Band, and B. Hommel. 2014. Reduced cognitive control in passionate lovers. Motivation and Emotion 38, 3: 444–450. [Google Scholar] [CrossRef]
- Venkatraman, V., J. Payne, J. Bettman, M. Luce, and S. Huettel. 2009. Separate Neural Mechanisms Underlie Choices and Strategic Preferences in Risky Decision Making. Neuron 62: 593–602. [Google Scholar] [CrossRef]
- Wichary, S., M. Magnuski, T. Oleksy, and A. Brzezicka. 2017. Neural signatures of rational and heuristic choice strategies: A single trial ERP analysis. Frontiers in Human Neuroscience 11: 401. [Google Scholar] [CrossRef]
- Wichary, S., R. Mata, and J. Rieskamp. 2016. Probabilistic inferences under emotional stress: how arousal affects decision processes. Journal of Behavioral Decision Making 29: 525–538. [Google Scholar] [CrossRef]
- Wilhelm, B., H. Wilhelm, and H. Lüdtke. 1999. Pupillography: Principles and applications in basic and clinical research. Edited by J. Kuhlmann and M. Böttcher. In Pupillography: Principles, methods and applications. Zuckschwerdt Verlag: pp. 1–11. [Google Scholar]
- Wurtz, R. H., and O. Hikosaka. 1986. Role of the basal ganglia in the initiation of saccadic eye movements. Edited by H.-J. Freund, U. Büttner, B. Cohen and J. Noth. In The oculomotor and skeletalmotor systems: Differences and similarities. Elsevier: Vol. 64, pp. 175–190. [Google Scholar] [CrossRef]


| Condition | Valence Mean (SD) | Arousal | Luminance (lx) |
| Erotic | 6.42 (1.48) | 4.84 (1.96) | 107.52 (13.65) |
| Aversive | 2.04 (1.41) | 6.37 (2.49) | 98.64 (18.20) |
| Neutral | 5.08 (1.23) | 2.68 (1.95) | 107.33 (18.33) |
| Number of cues | |||||
| Condition | 1 | 2 | 3 | 4 | 5 |
| Neutral | 0.41 | 0.10 | 0.06 | 0.08 | 0.35 |
| Aversive | 0.54 | 0.12 | 0.04 | 0.01 | 0.29 |
| Erotic | 0.56 | 0.10 | 0.07 | 0.02 | 0.25 |
| Overall | 0.49 | 0.11 | 0.06 | 0.04 | 0.30 |
© 2020 by the authors. This article is licensed under a Creative Commons Attribution 4.0 International License.
Share and Cite
Krejtz, K.; Żurawska, J.; Duchowski, A.T.; Wichary, S. Pupillary and Microsaccadic Responses to Cognitive Effort and Emotional Arousal During Complex Decision Making. J. Eye Mov. Res. 2020, 13, 1-15. https://doi.org/10.16910/jemr.13.5.2
Krejtz K, Żurawska J, Duchowski AT, Wichary S. Pupillary and Microsaccadic Responses to Cognitive Effort and Emotional Arousal During Complex Decision Making. Journal of Eye Movement Research. 2020; 13(5):1-15. https://doi.org/10.16910/jemr.13.5.2
Chicago/Turabian StyleKrejtz, Krzysztof, Justyna Żurawska, Andrew T. Duchowski, and Szymon Wichary. 2020. "Pupillary and Microsaccadic Responses to Cognitive Effort and Emotional Arousal During Complex Decision Making" Journal of Eye Movement Research 13, no. 5: 1-15. https://doi.org/10.16910/jemr.13.5.2
APA StyleKrejtz, K., Żurawska, J., Duchowski, A. T., & Wichary, S. (2020). Pupillary and Microsaccadic Responses to Cognitive Effort and Emotional Arousal During Complex Decision Making. Journal of Eye Movement Research, 13(5), 1-15. https://doi.org/10.16910/jemr.13.5.2