Eye Tracking Use in Researching Driver Distraction: A Scientometric and Qualitative Literature Review Approach
Abstract
:Introduction
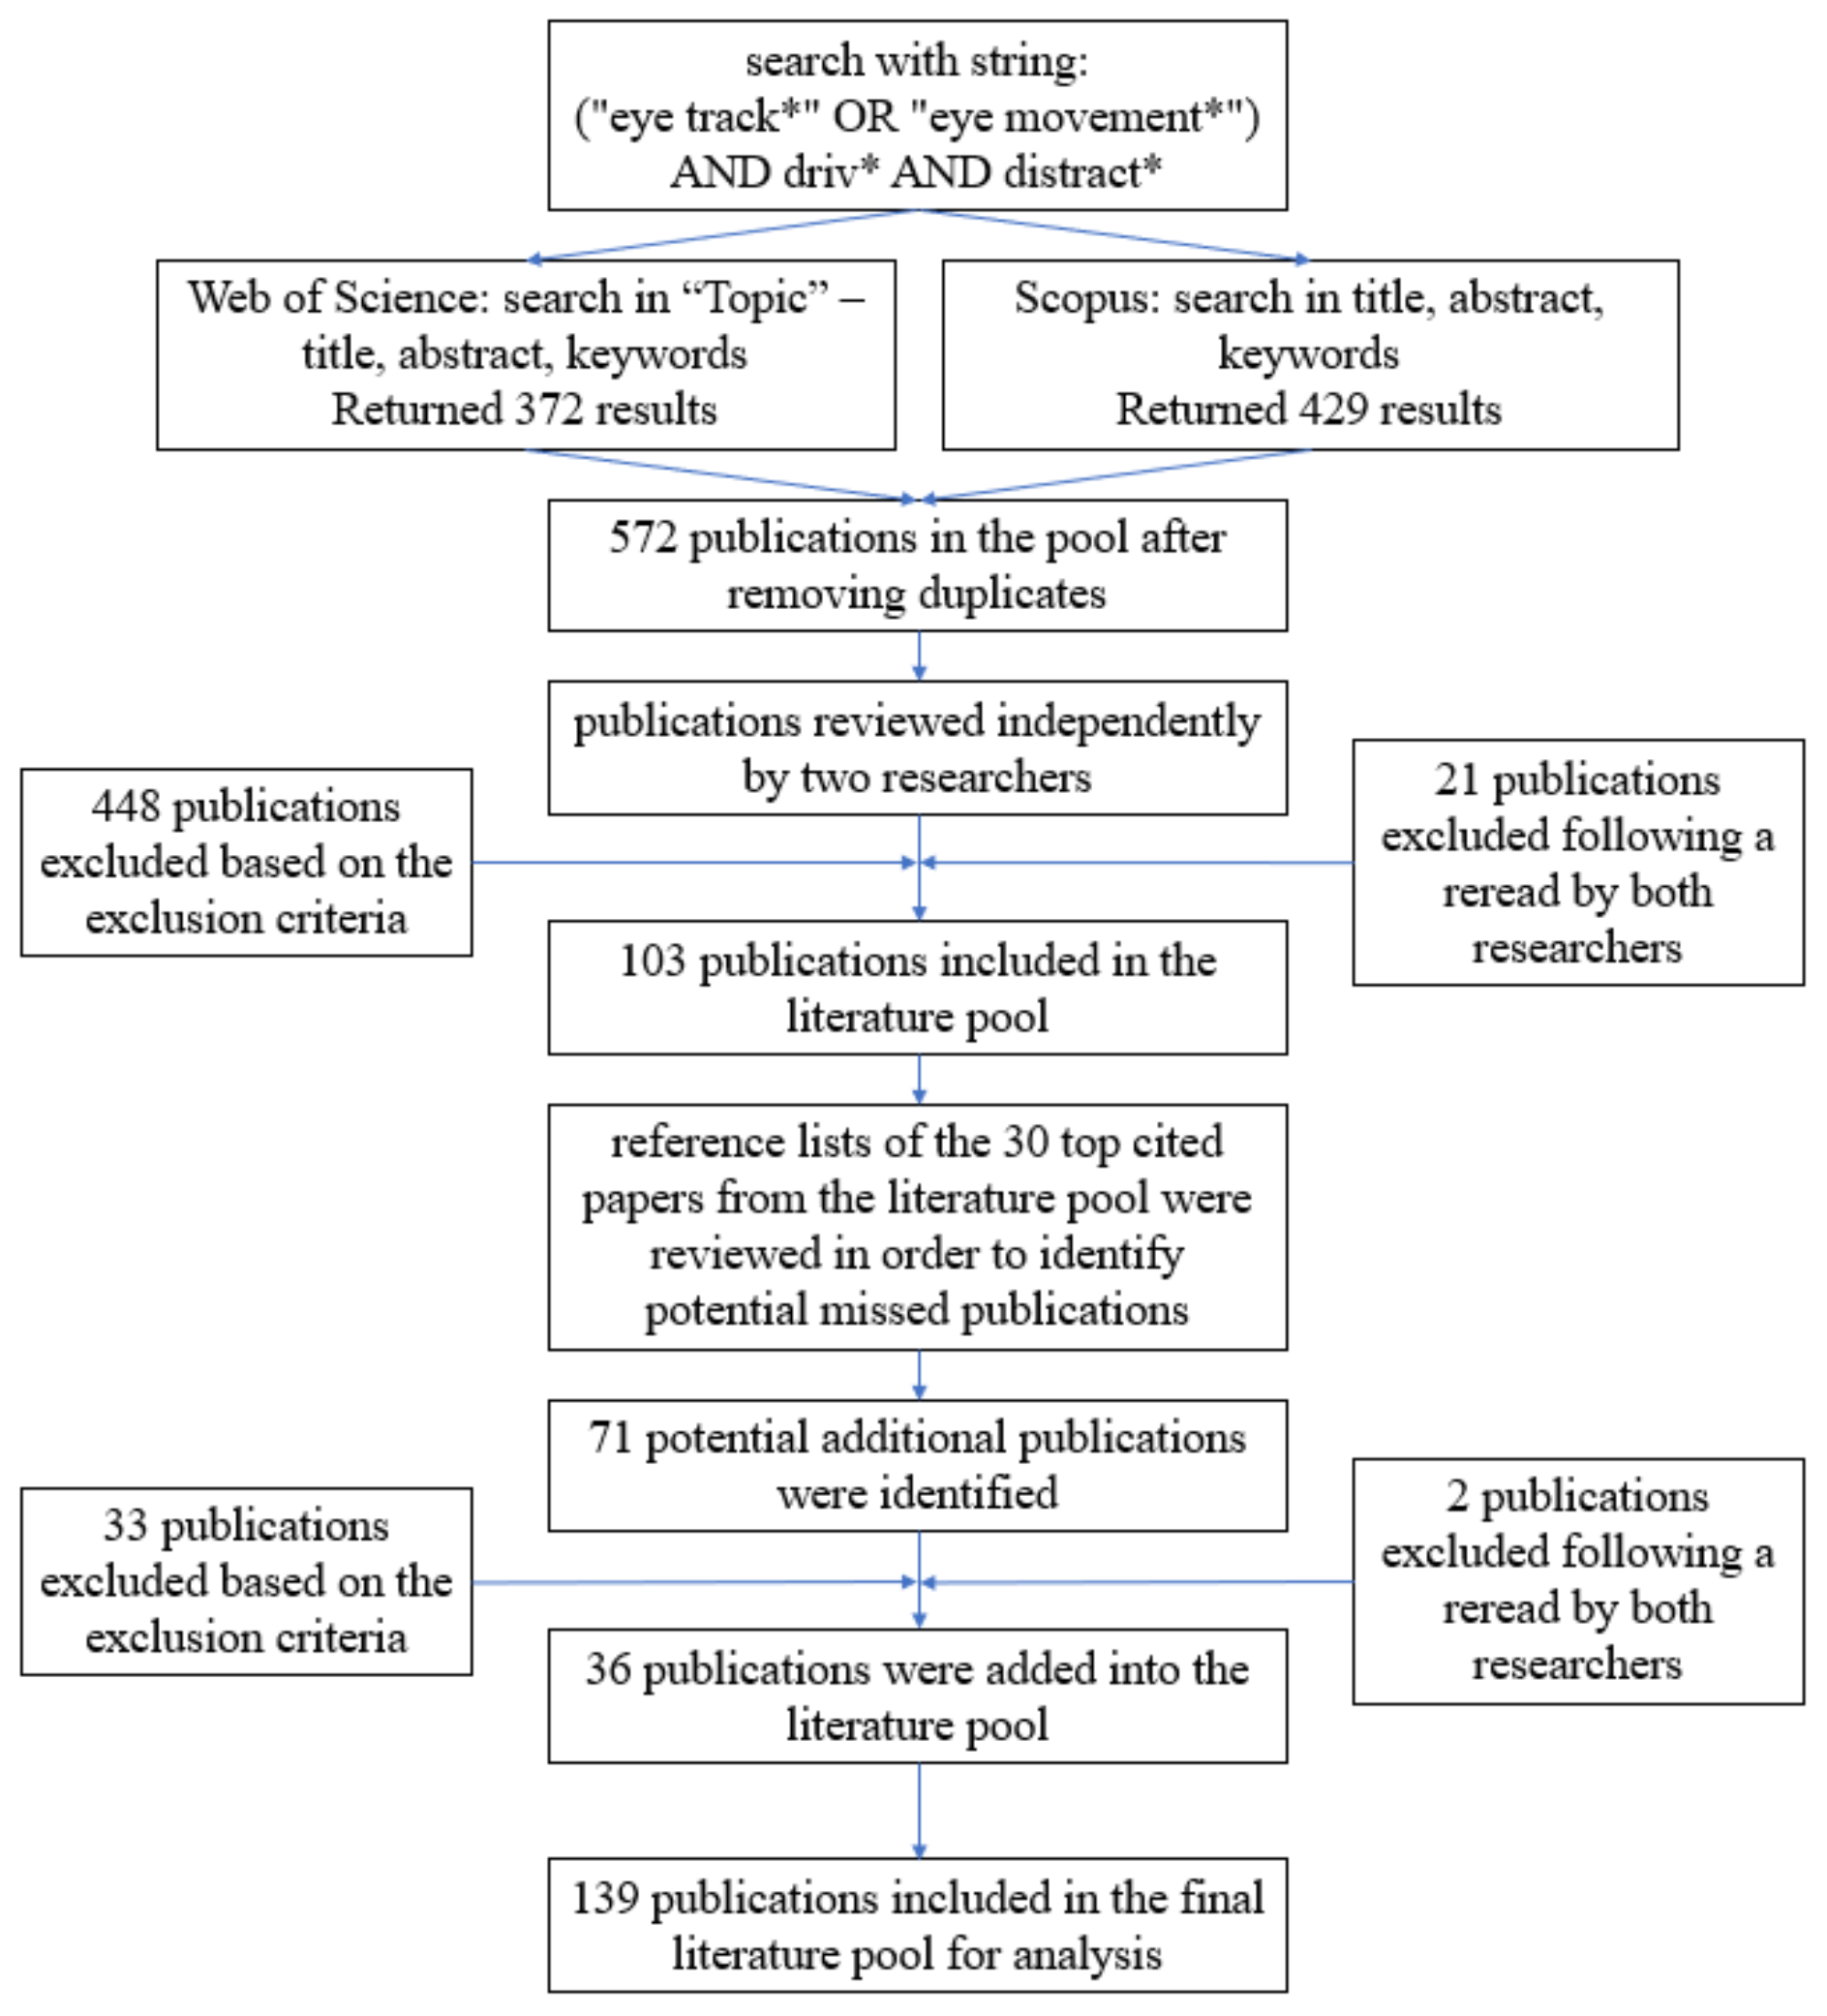
Methods
- present only literature reviews;
- focus on theoretical aspects of using eye tracking, and conceptual papers;
- focus on the technical aspects of eye tracking technology or present patents;
- suggest the use of eye tracking technology, but do not demonstrate direct use of the technology in research;
- study modalities other than car road transport, and papers devoted to autonomous vehicle use;
- use eye tracking technology for research into drivers’ visual behaviour during driving without specifically studying distracting factors, e.g. development of a model for predicting distracted driving or driver drowsiness or researching gaze patterns of drivers in general;
- do not deal directly with examining driver distraction, but rather use eye tracking to examine design features of various elements in the traffic environment or vehicle, e. g. the design of traffic signs, changes in road geometry, user interface design of in-vehicle systems…
Results
Bibliographic analysis and science mapping
Use of eye tracking in driver distraction research
Discussion
- (a)
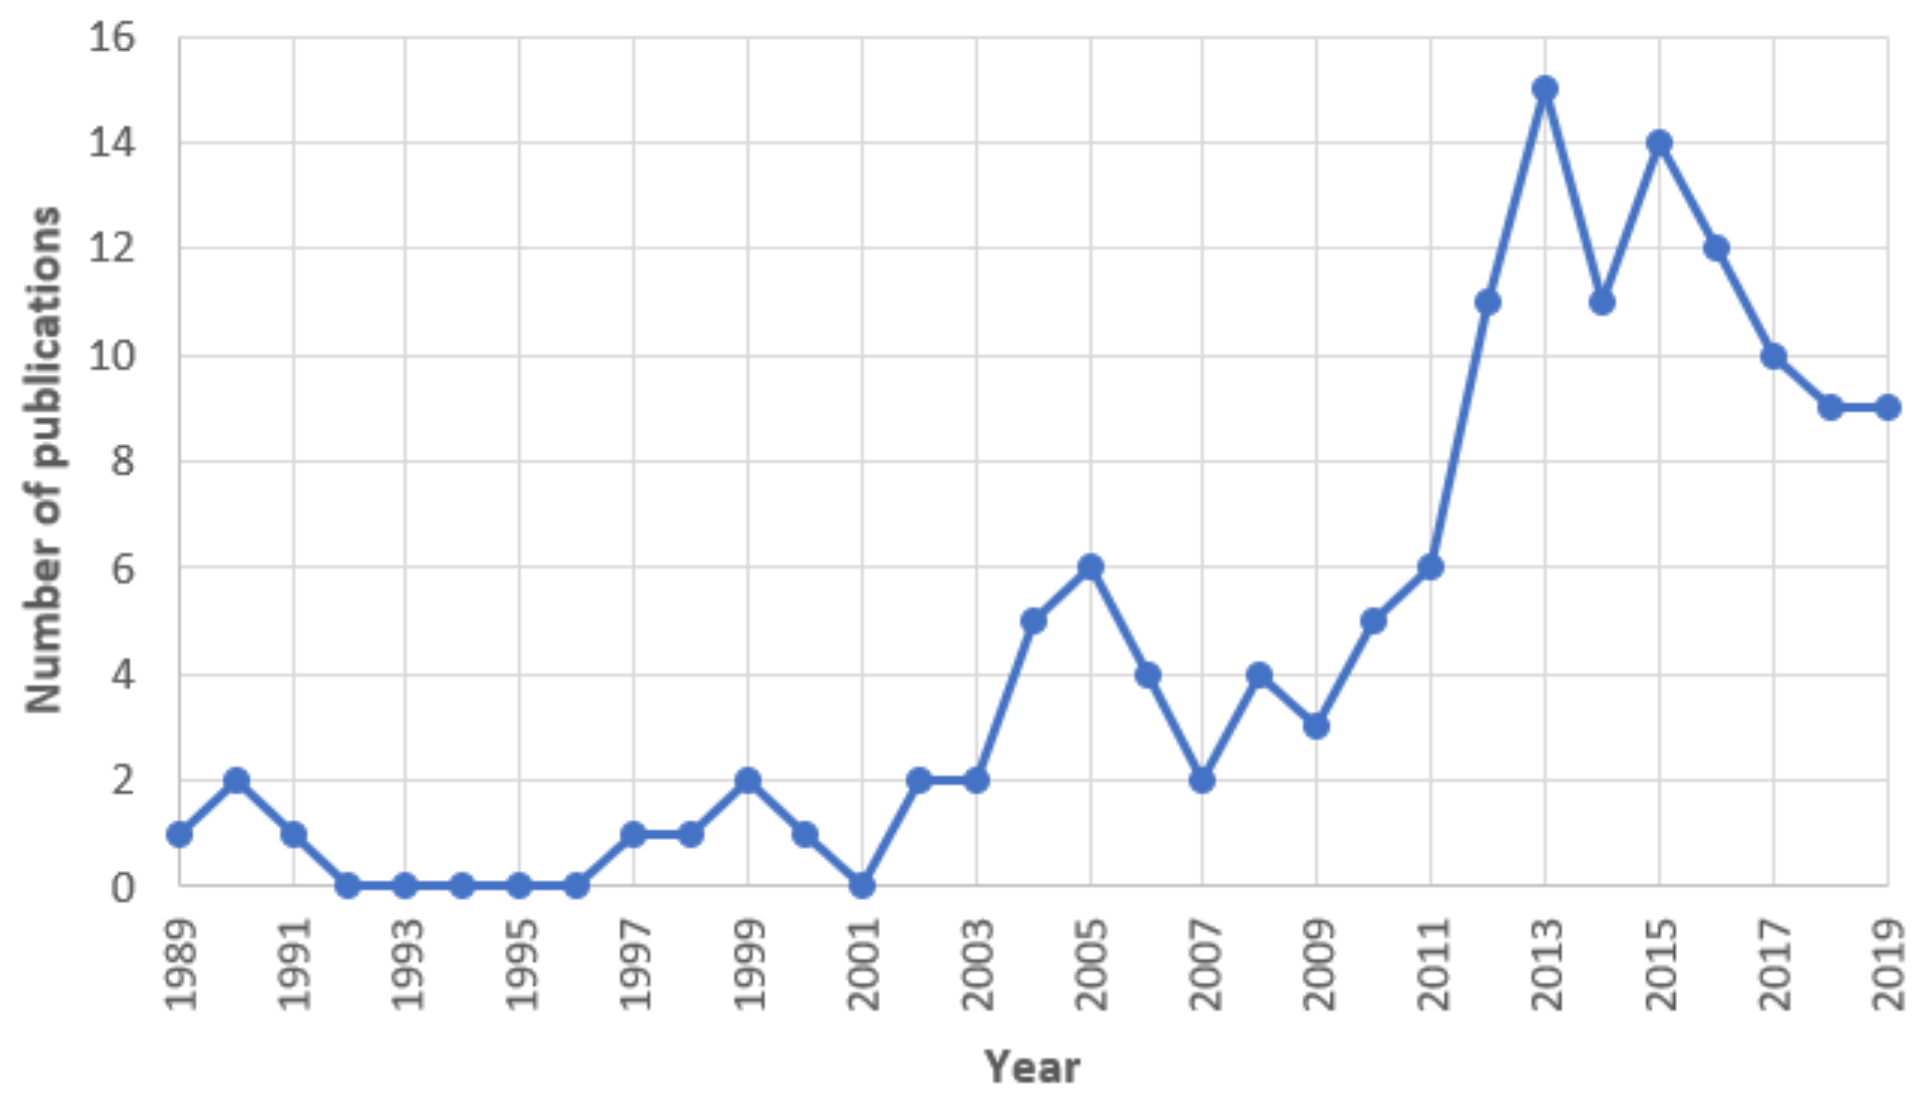
- Generally speaking, eye tracking is currently being used as a supportive technology in driver distraction research. Given its potential for an accurate insight into the overt visual attention of drivers, it can be expected that this field of research is expanding and will likely continue to grow in the next years. Currently, 139 papers that focus on examining the influence of distractions on drivers’ visual attention can be found in WOS and Scopus, and the overall publication trend is on the rise.
- (b)
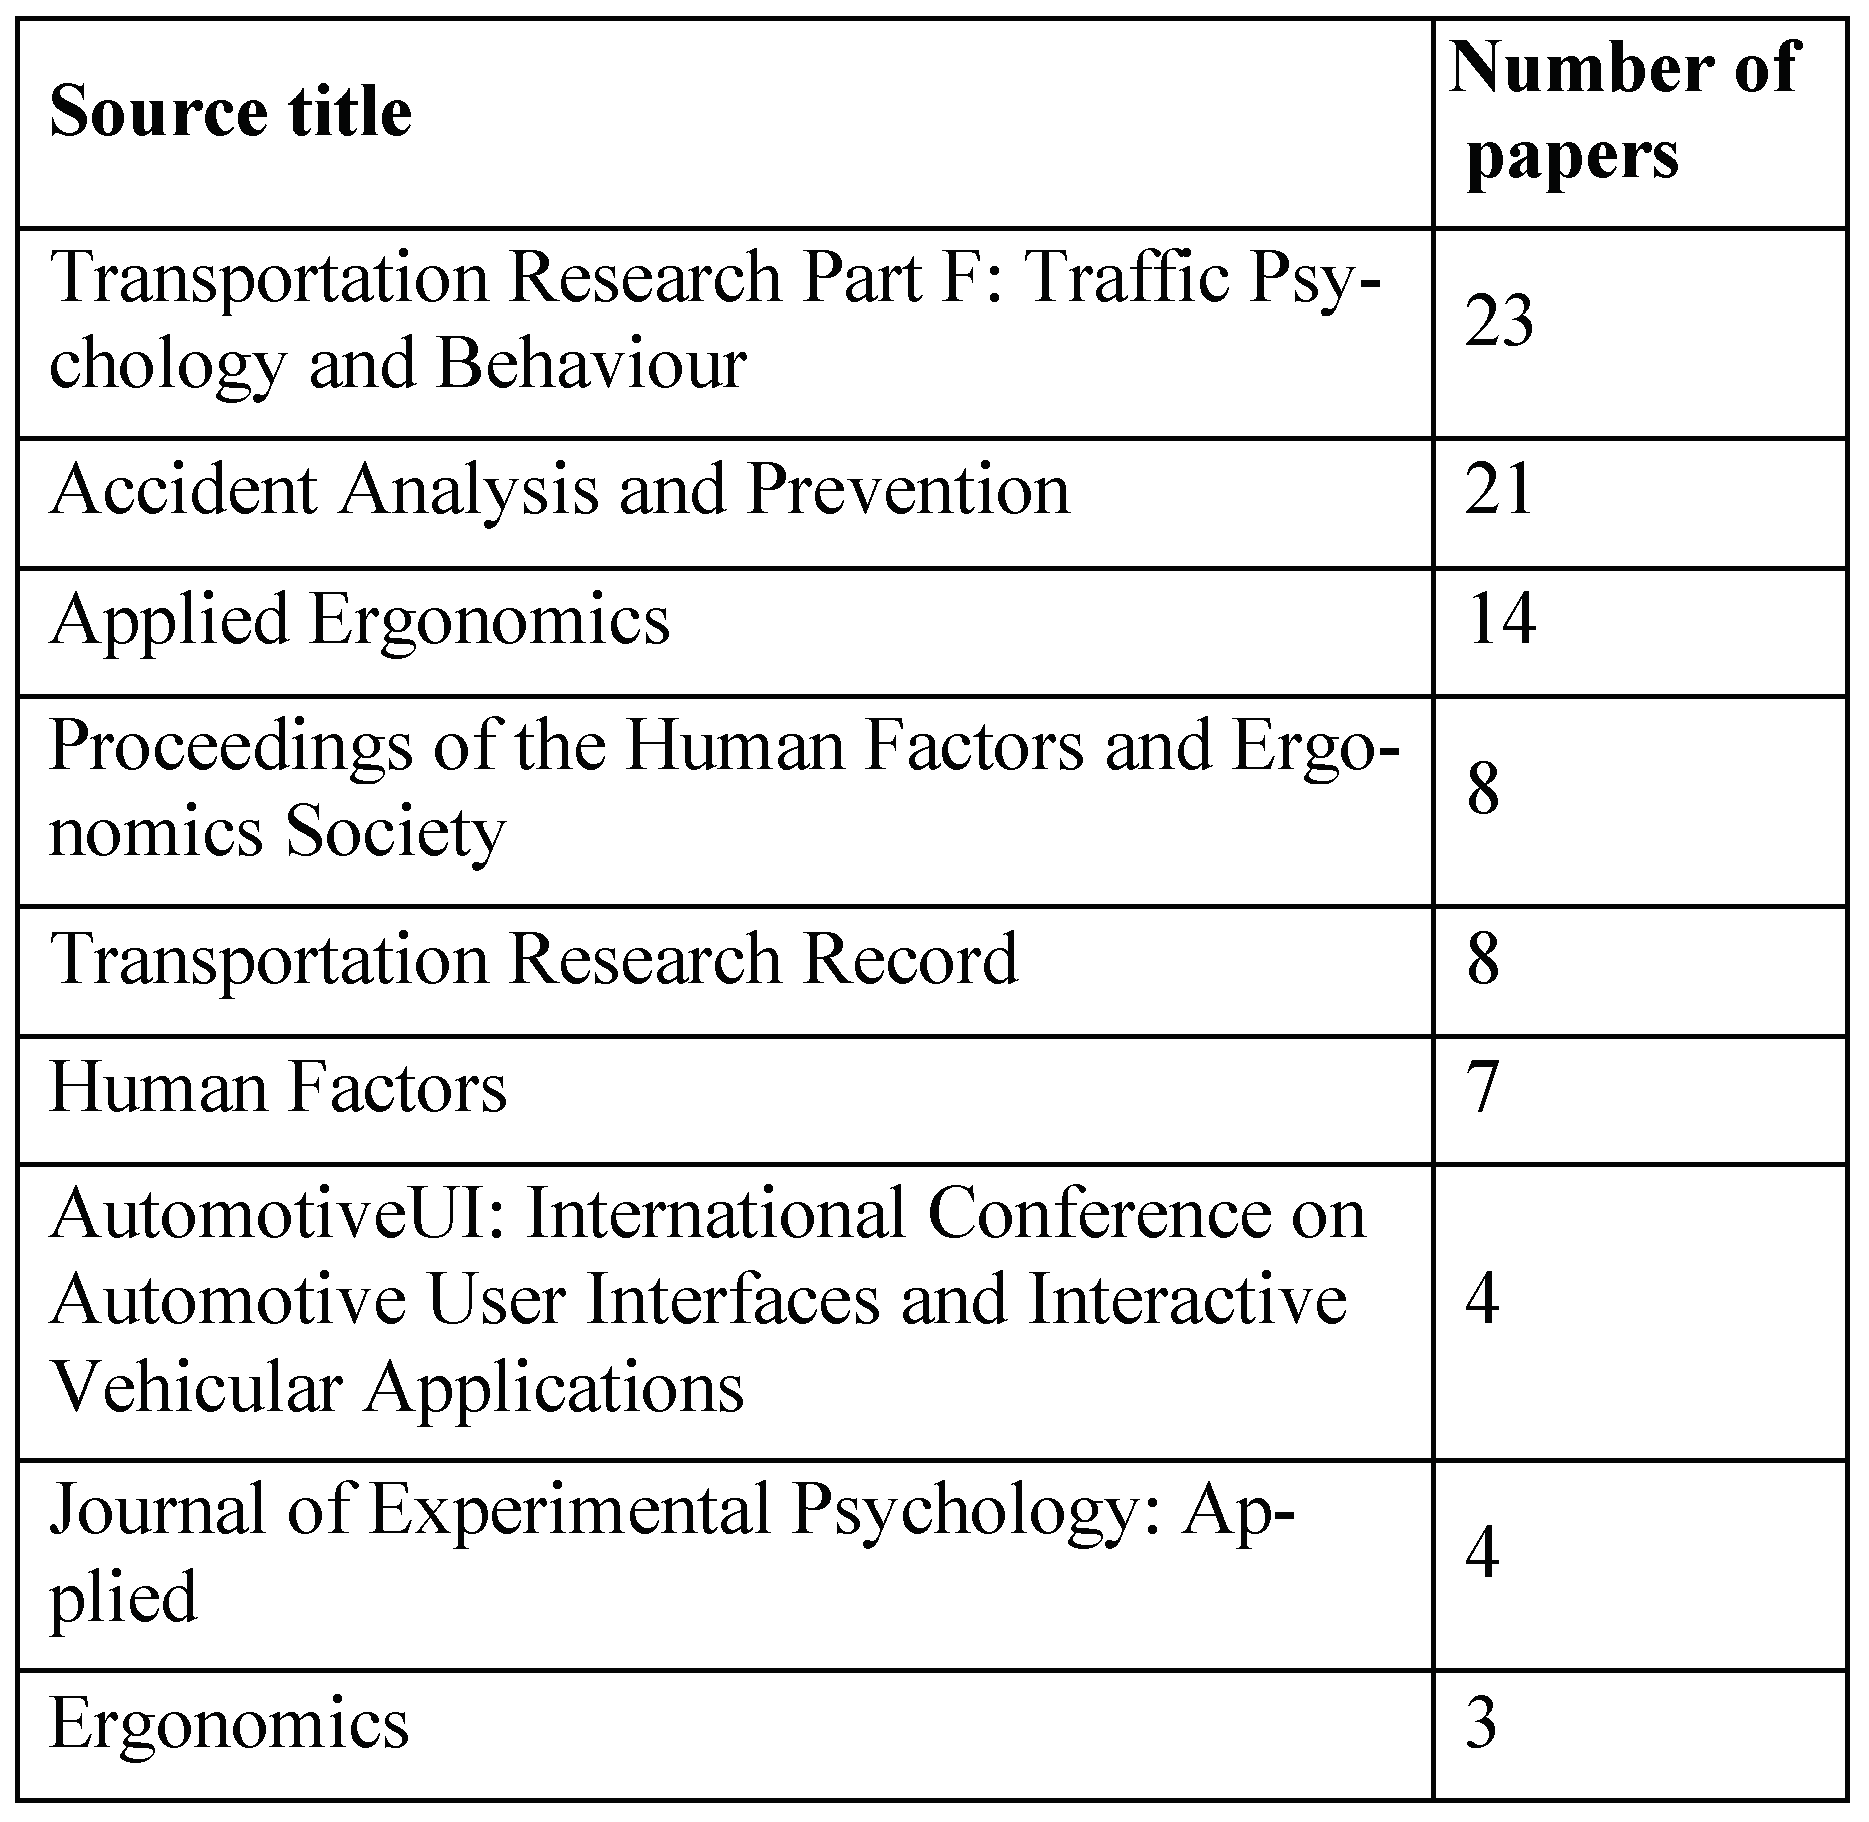
- The field is interdisciplinary in its core, which is also reflected in the source publications where papers are being published. Journals and conferences that publish papers from the field are predominantly focused on psychology and human factors, transportation, safety, and ergonomics.
- (c)
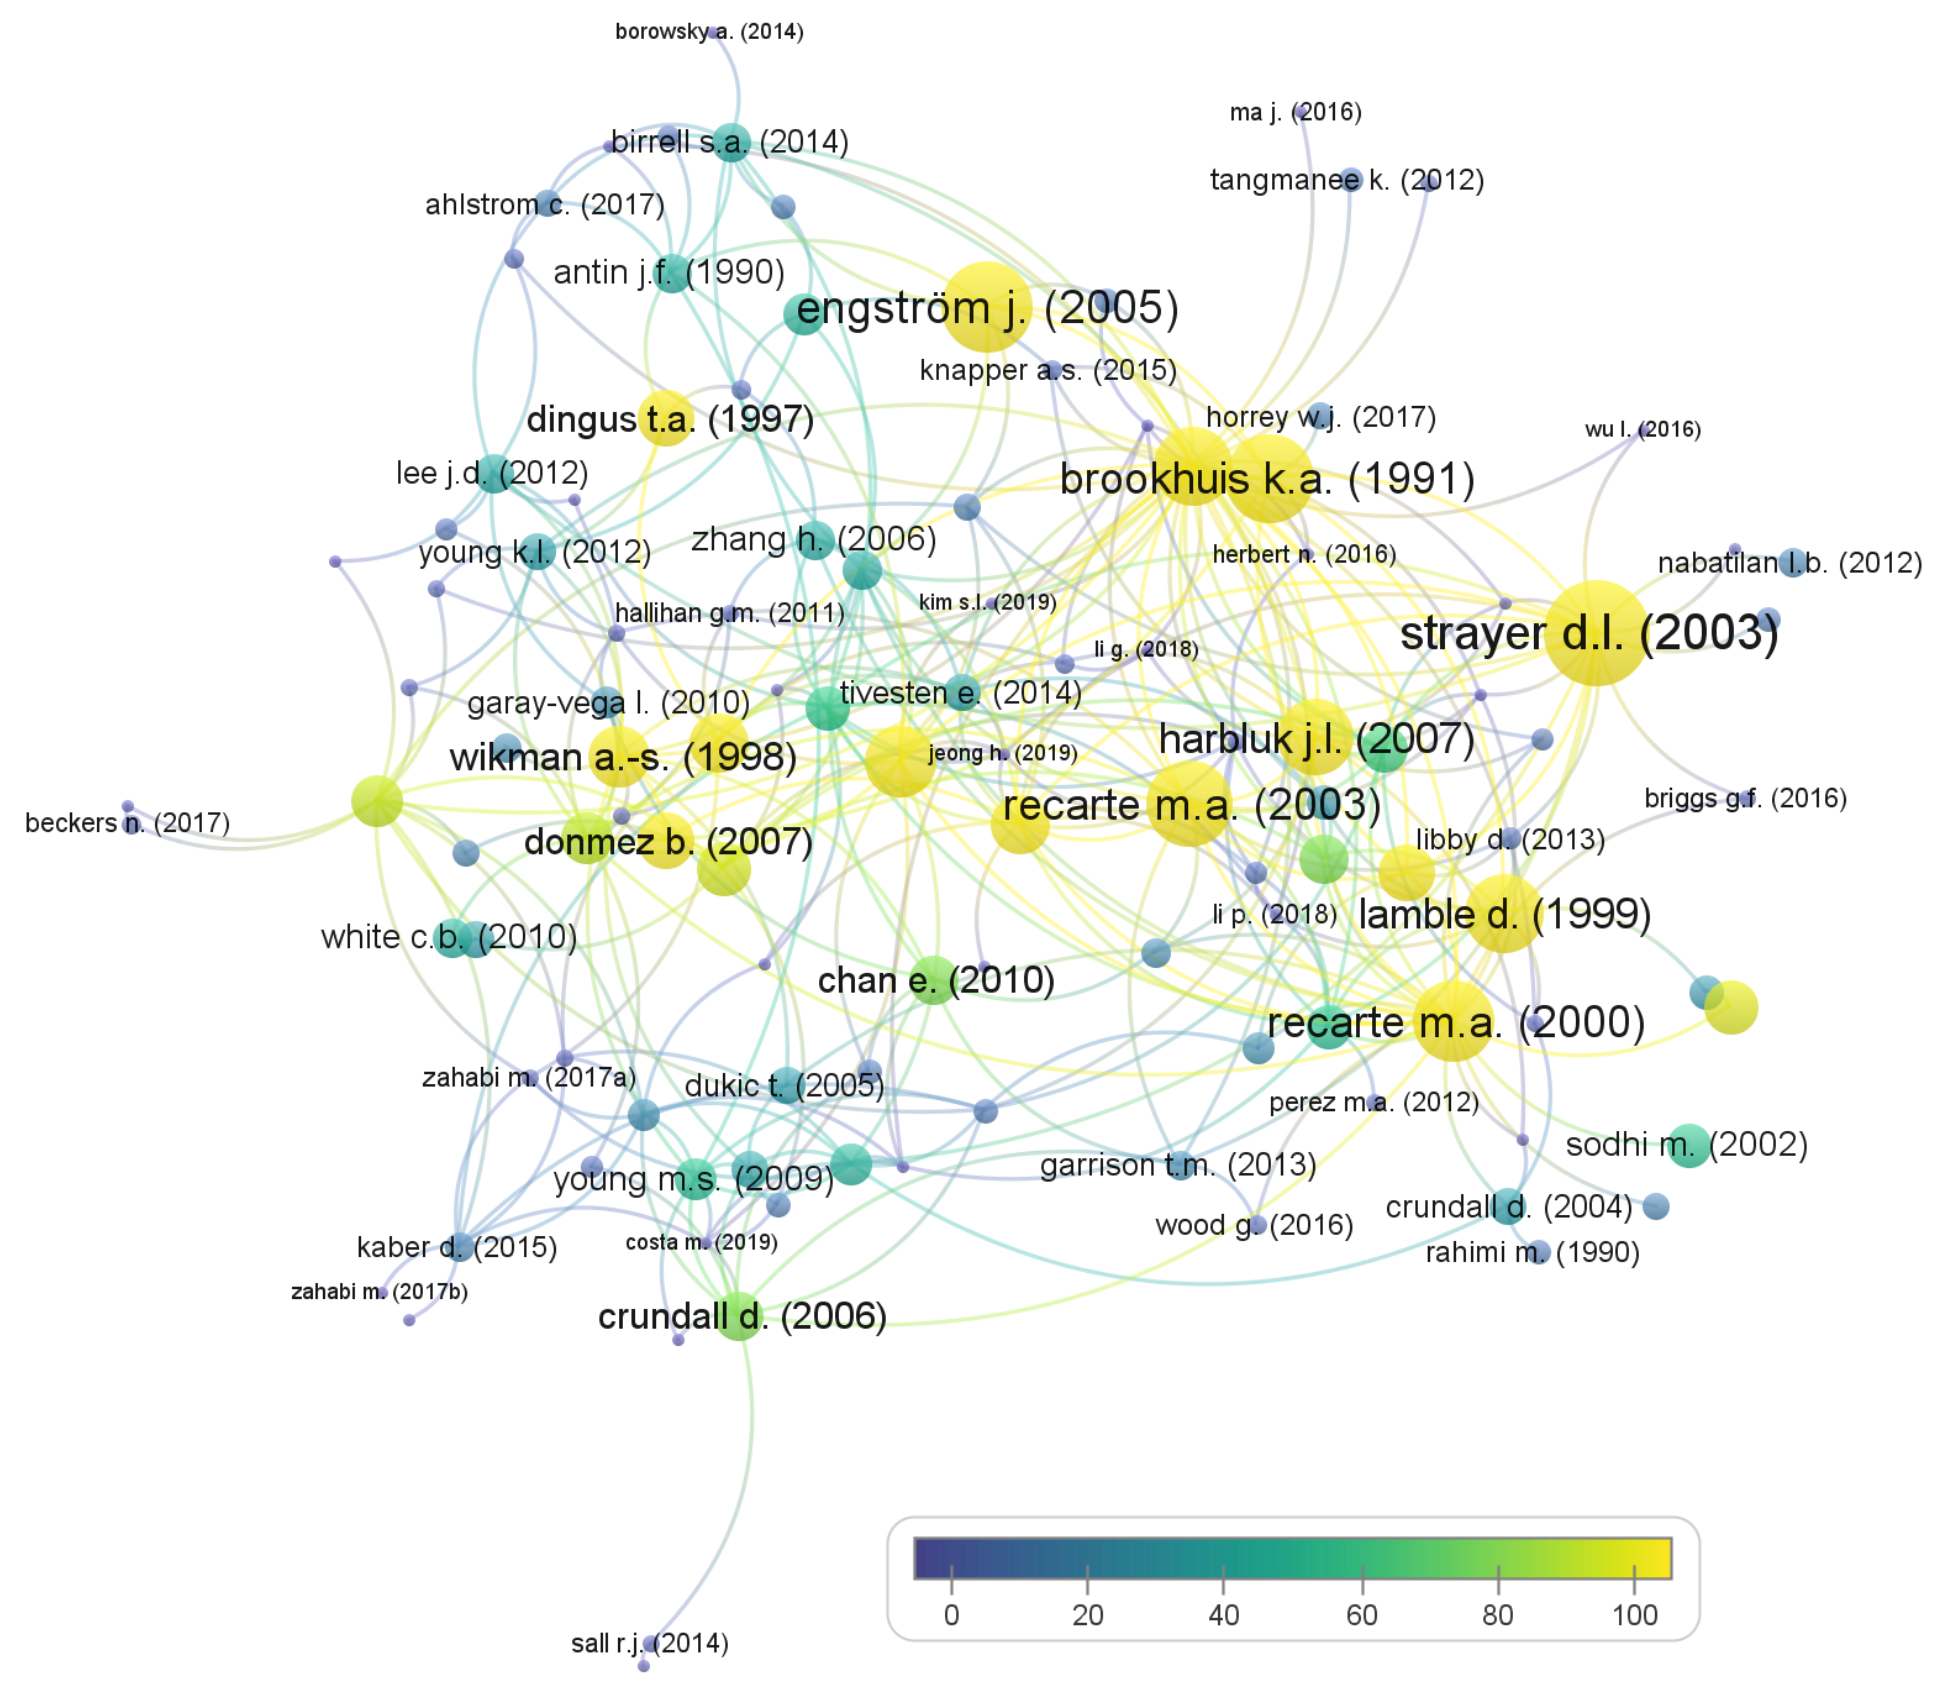
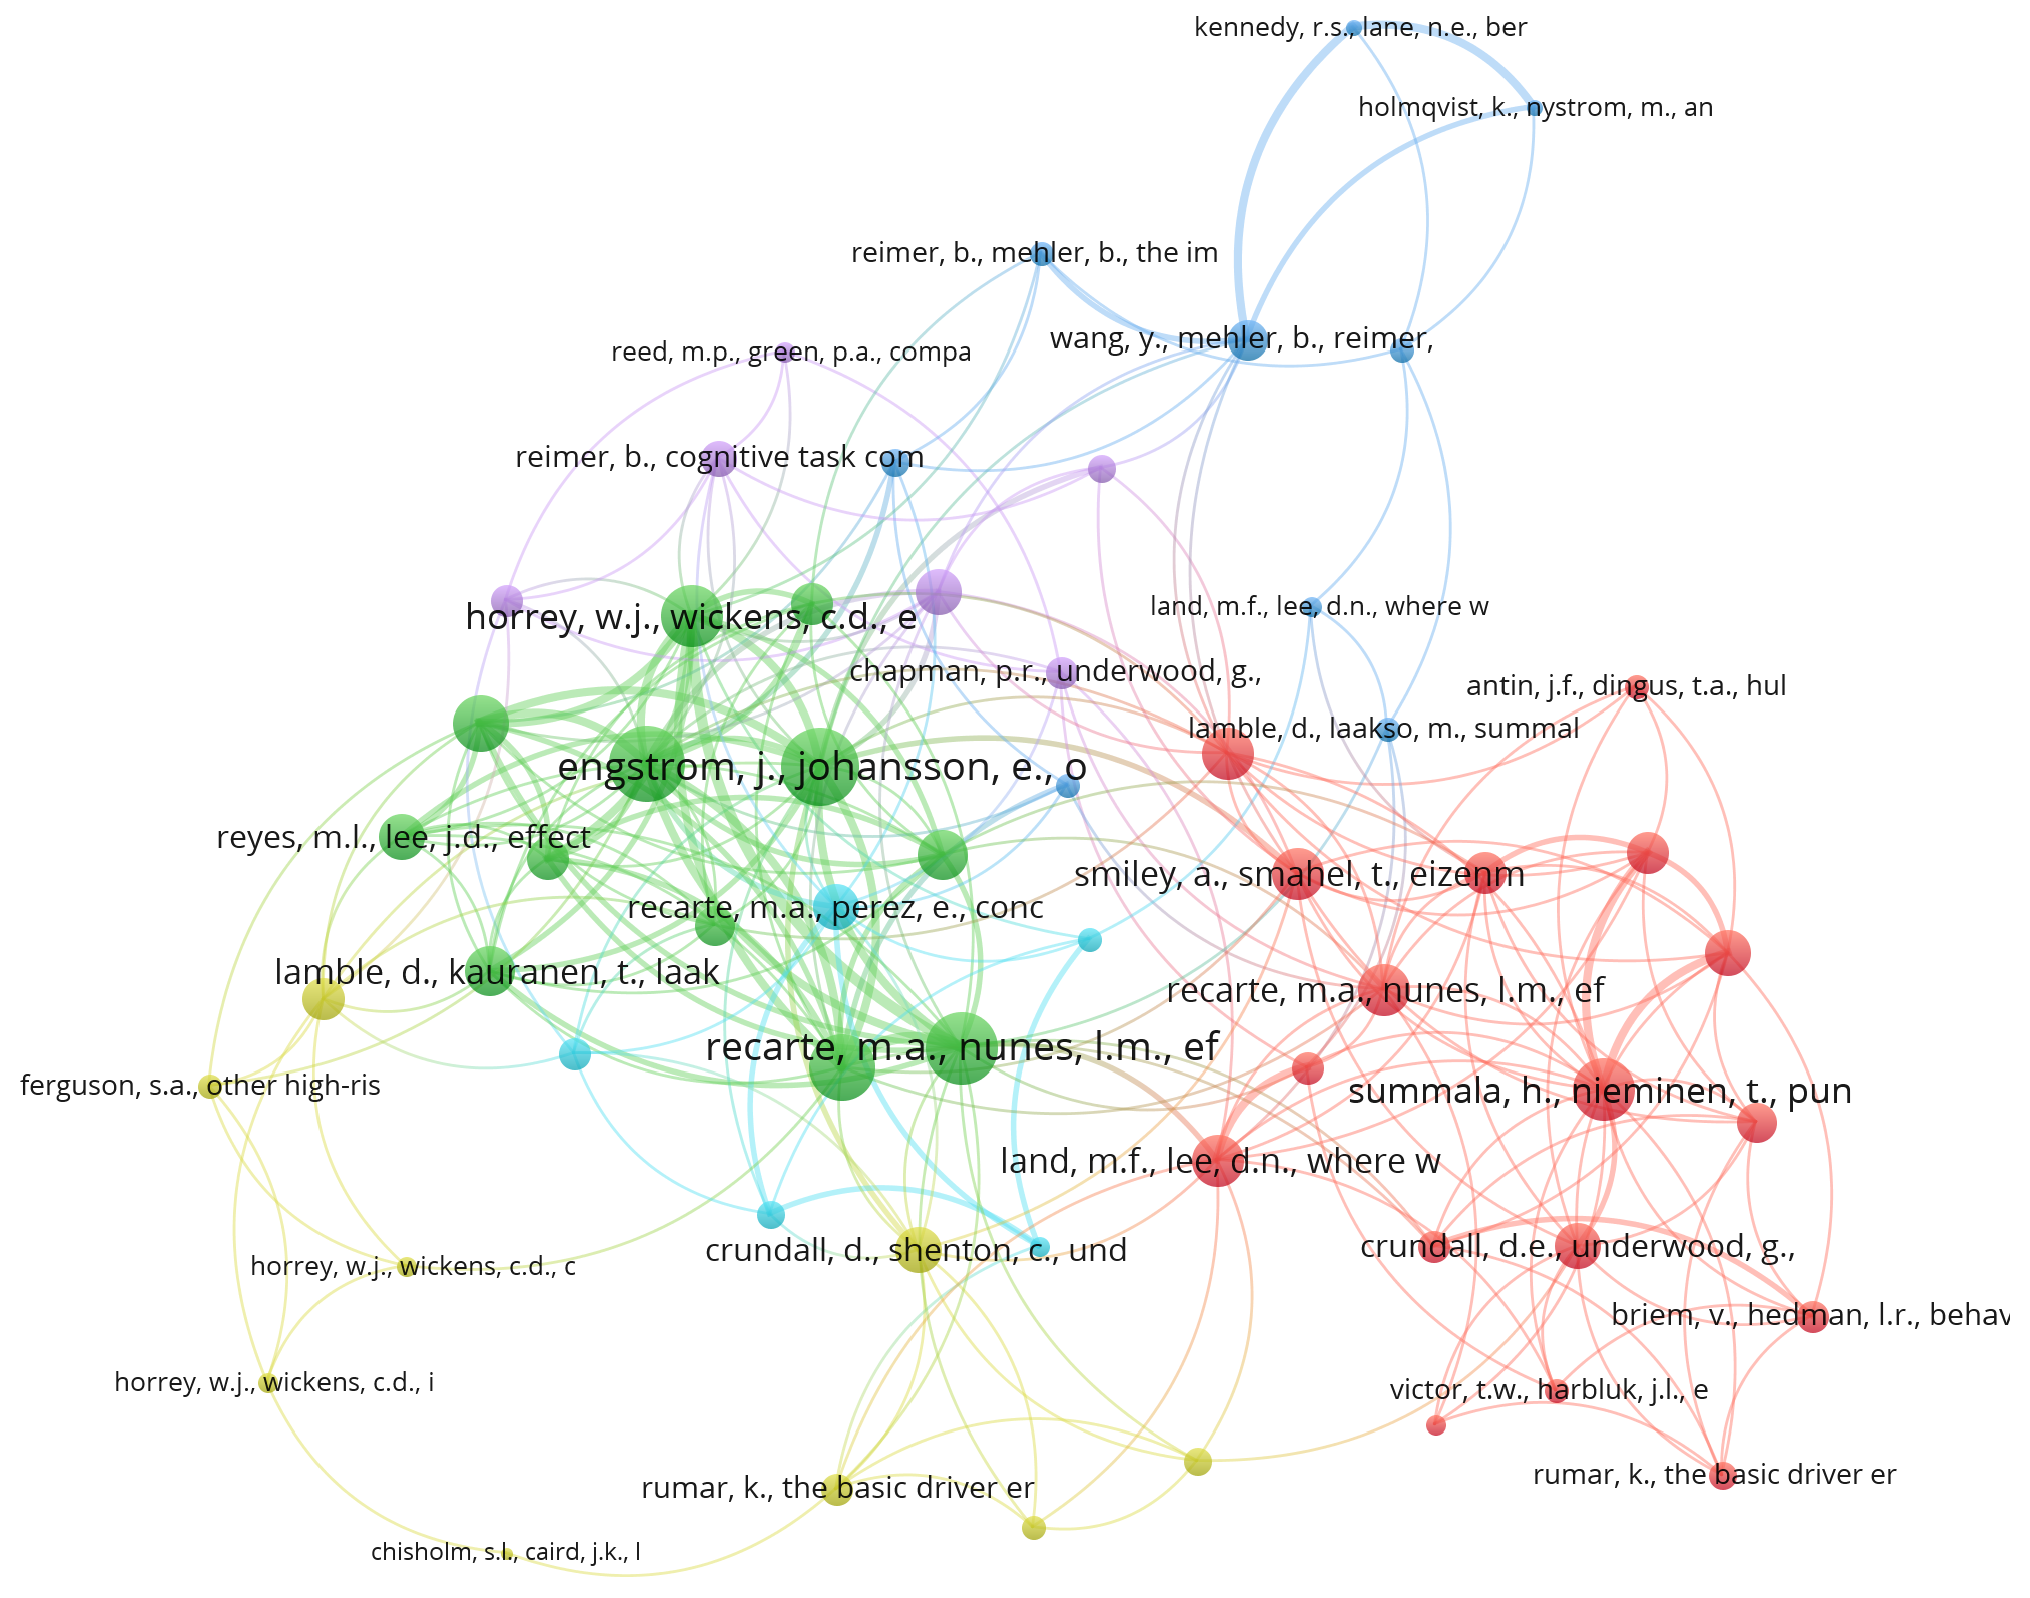
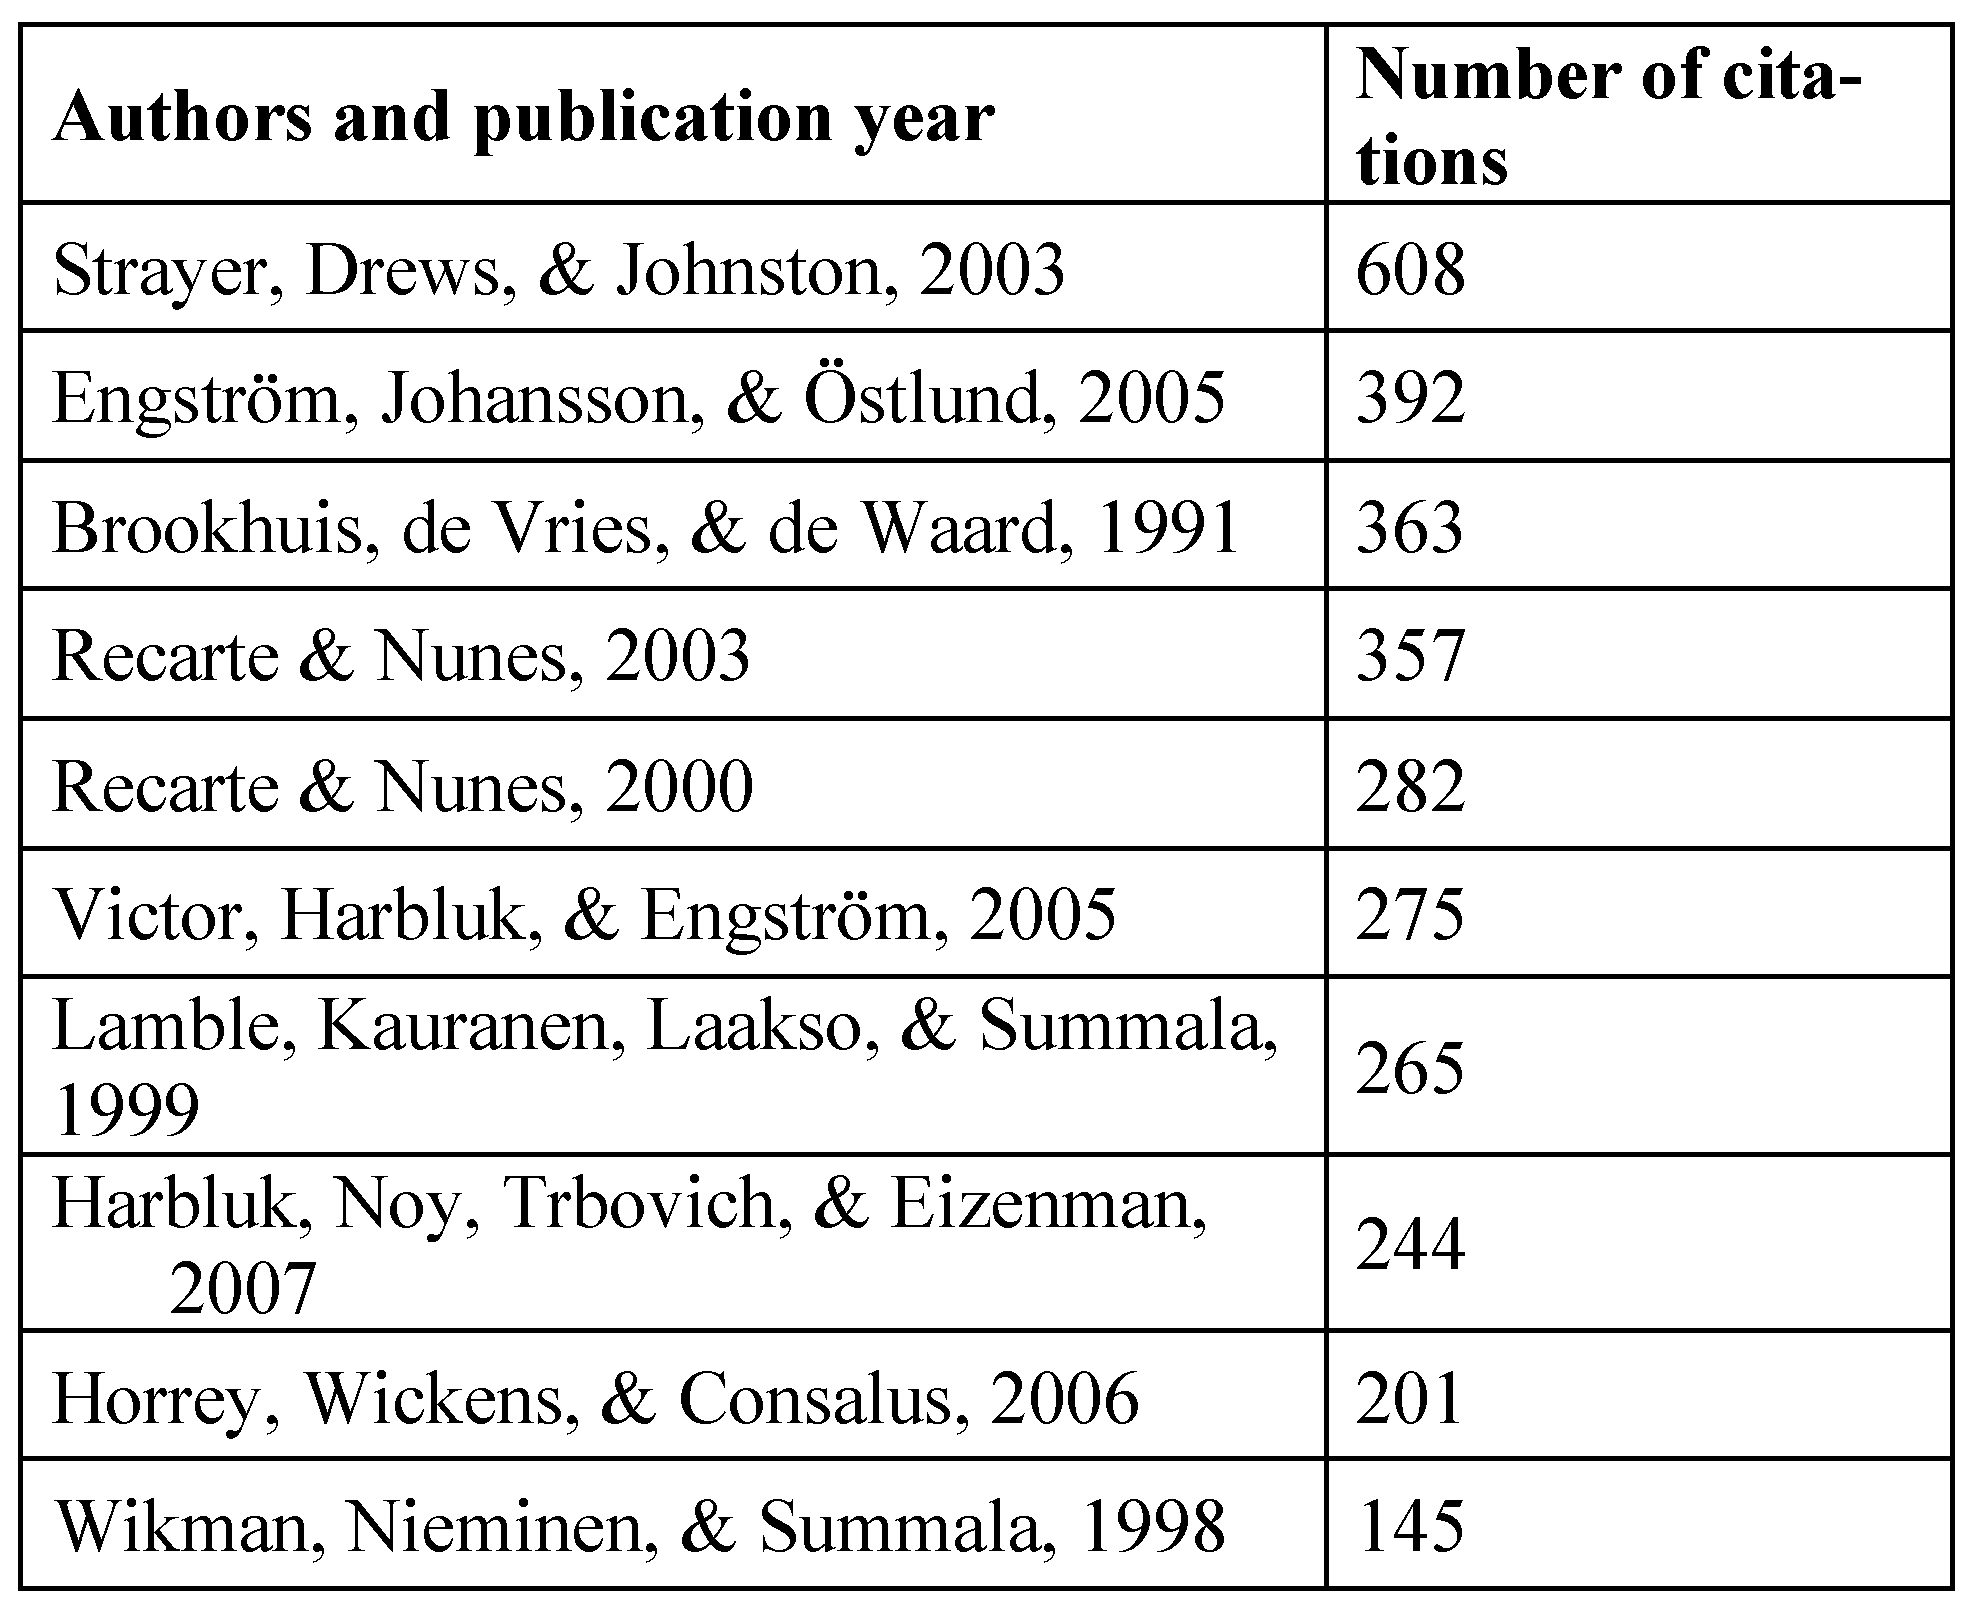
- Citation analysis shows that by far the most referenced paper is on the topic of cell phone distractions, which are also the focus of three other publications among the top ten cited. An analysis of citing among papers in the literature pool shows that the field is relatively interconnected since 115 out of the 136 included publications share at least one citation link. This is not surprising given the narrow focus of the present analysis. Secondary citation network analysis (co-citation and bibliographic coupling) further proves the above finding and additionally forms six clusters of connected publications which are most often cited together or share common references.
- (d)
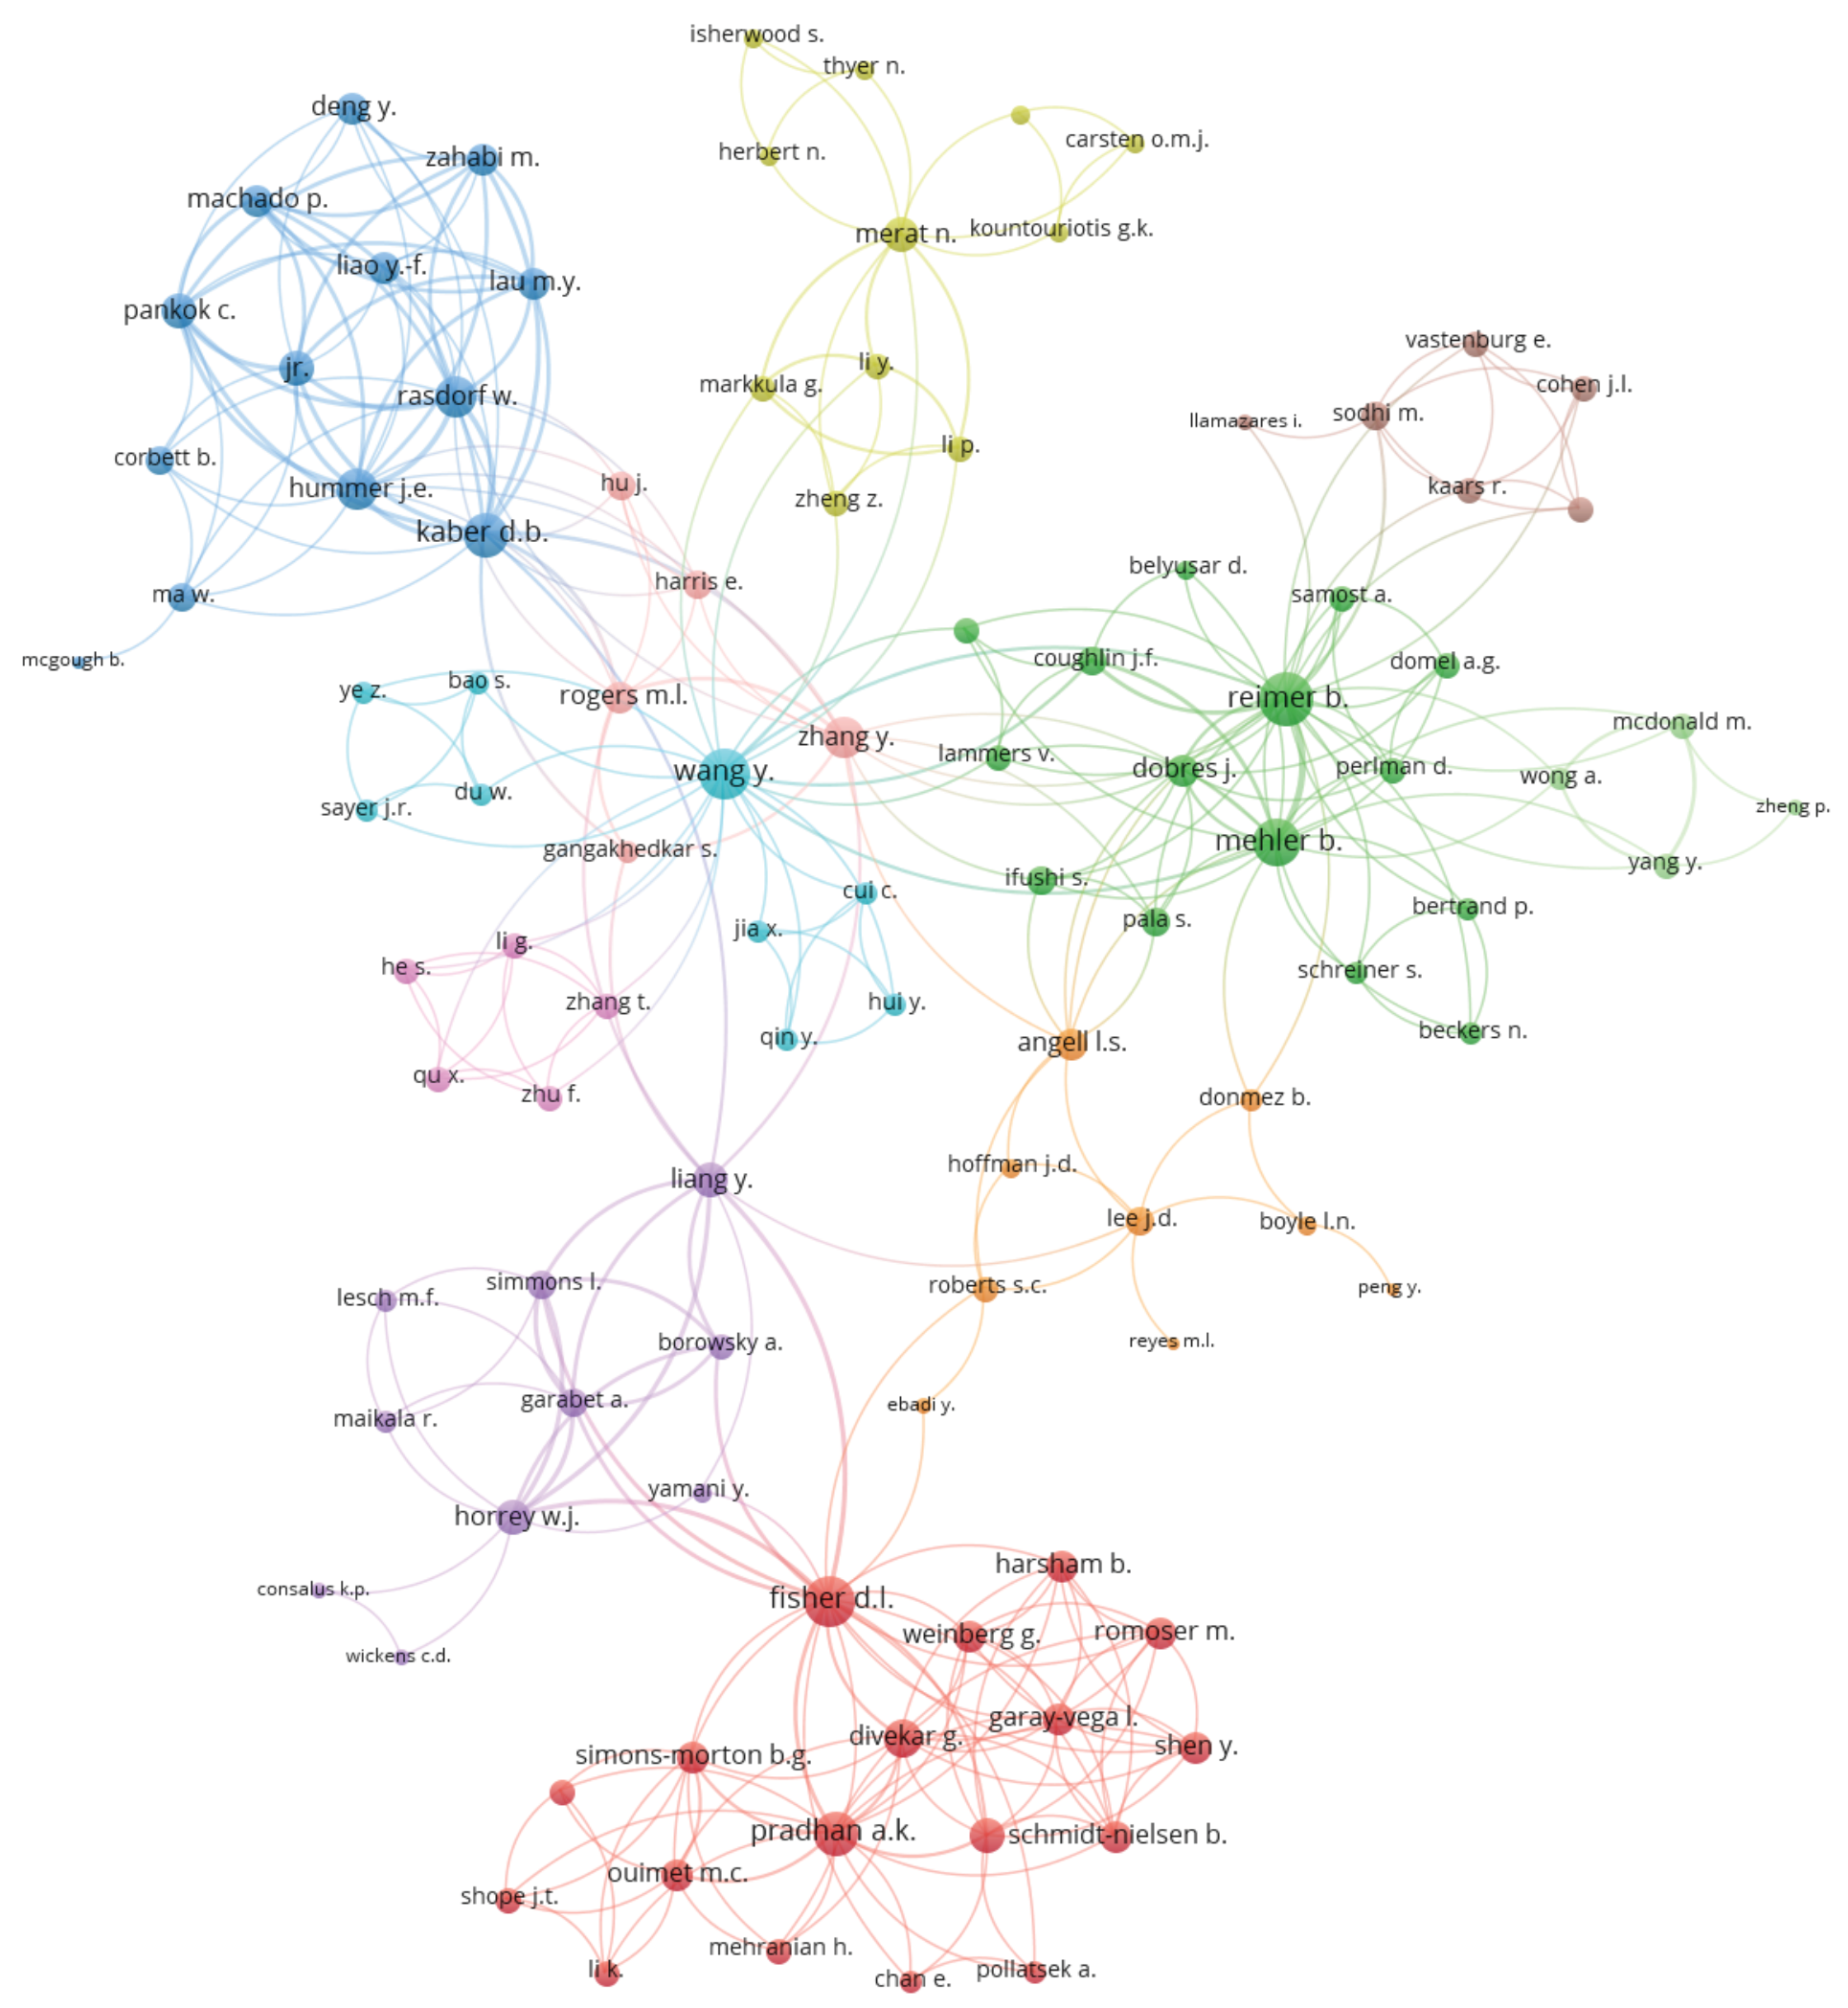
- The amount of cooperation among authors in the field, especially outside of their primary co-authorship network, is relatively low as shown by the co-authorship analysis. The co-authorship scheme shows that some co-authorship clusters have formed but are interconnected only with occasional collaborations.
- (e)
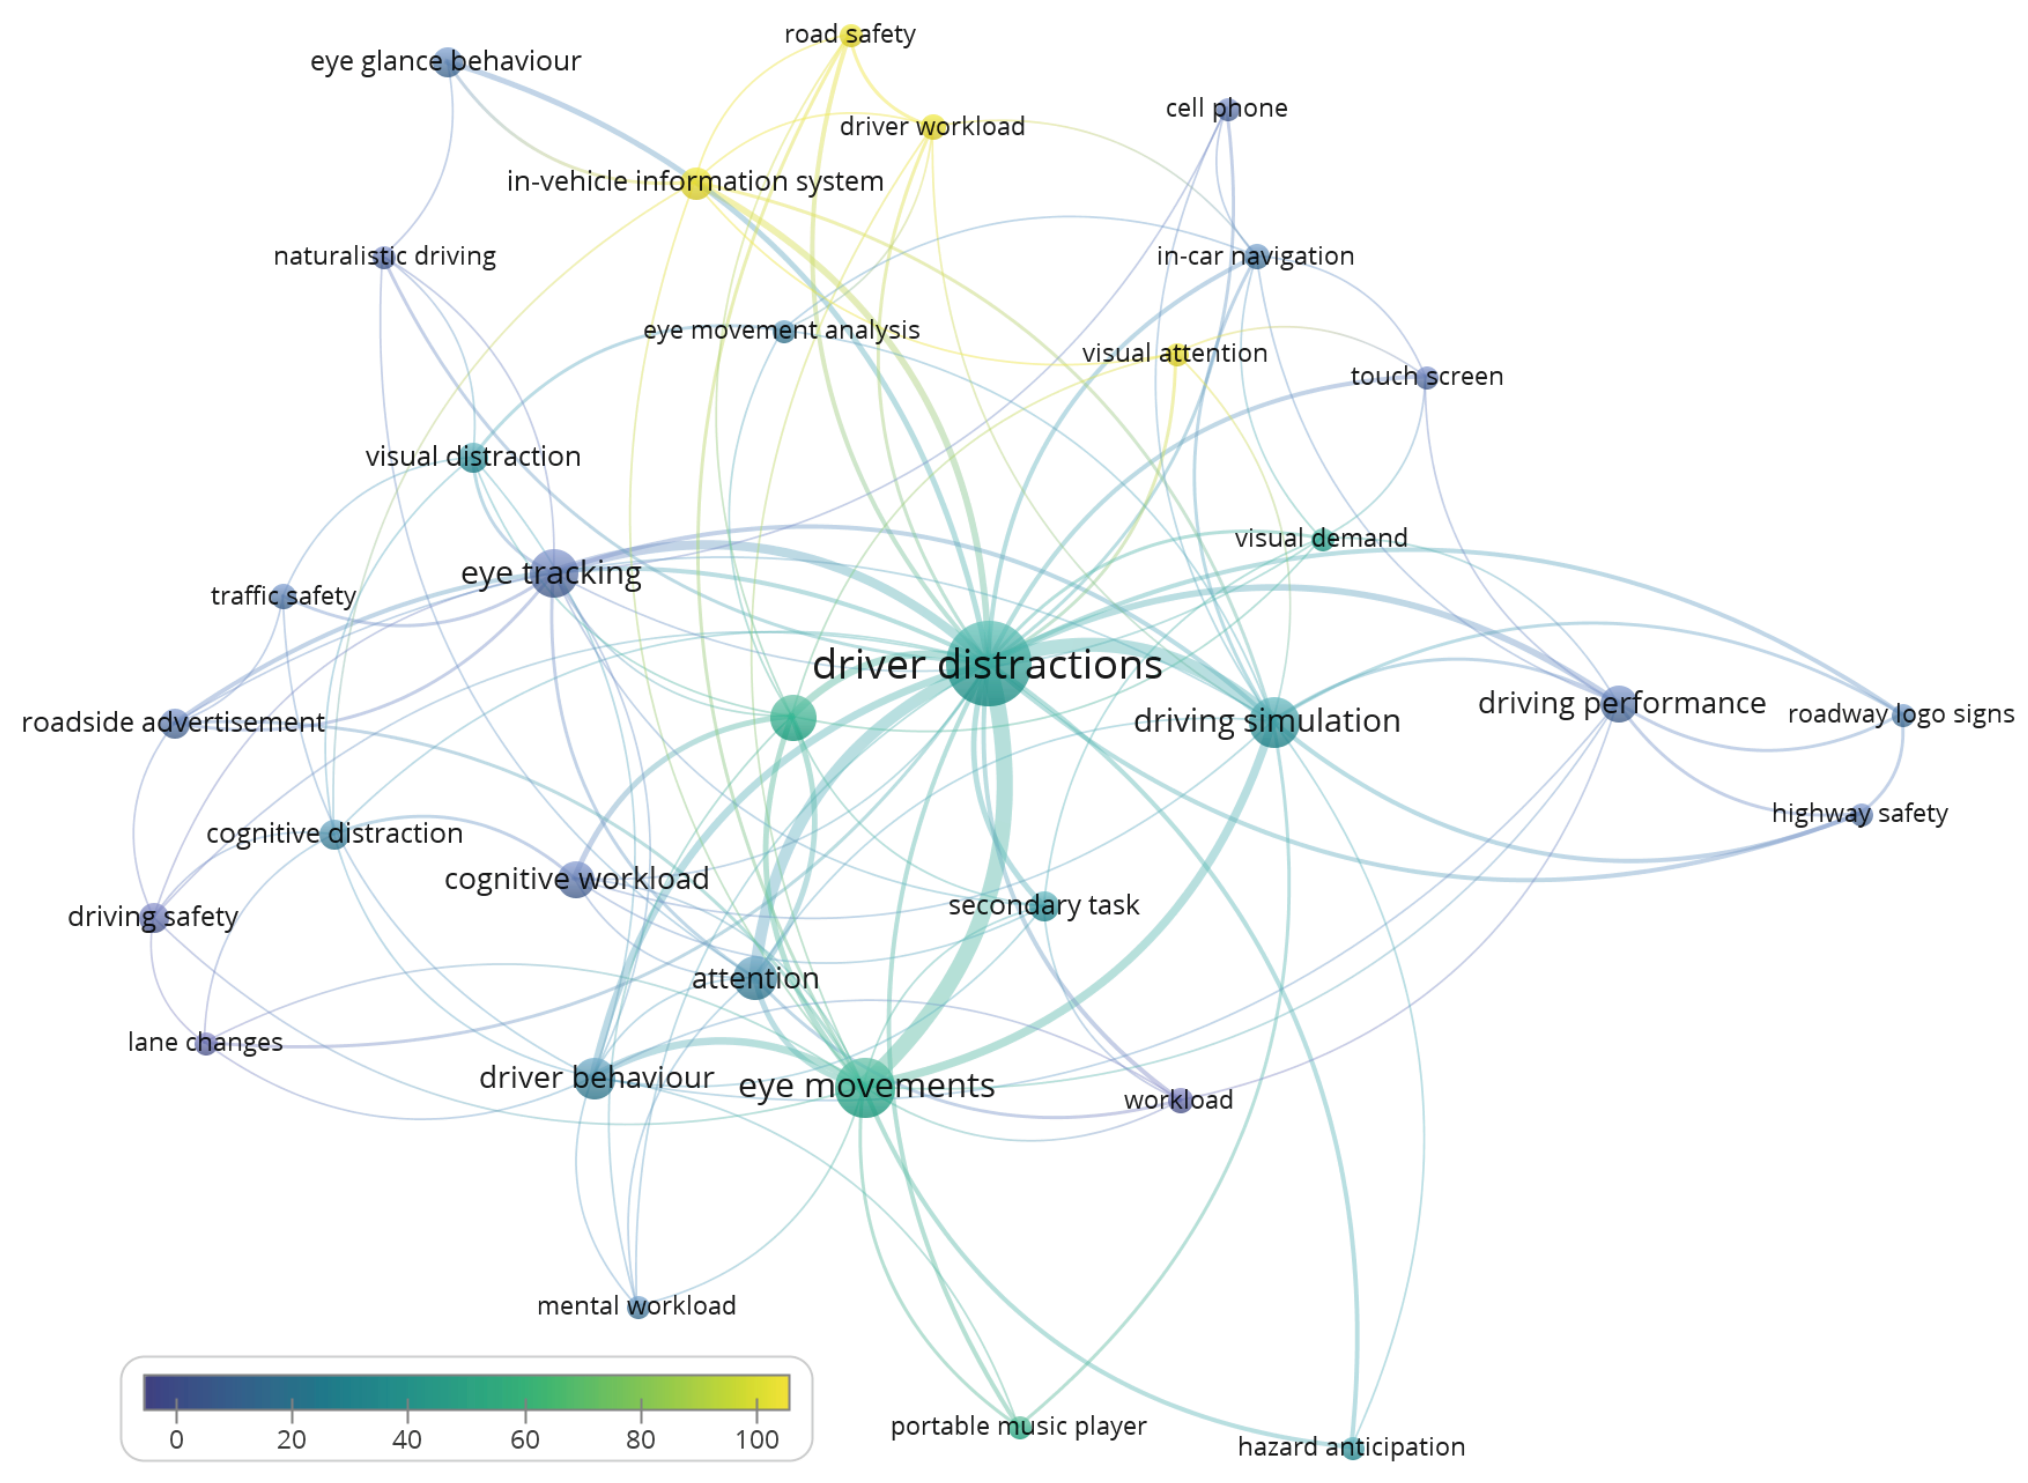
- Four keyword clusters can be identified. One presents research, focused on utilizing driving simulators; the second seems to be focused on evaluating visual attention while taking into account participant factors such as age, gender, and psychological factors; the third, smallest cluster, focuses on accident prevention; and the fourth, largest, focuses on safety and specific distractions and tasks. As expected, “eye movements”, “driver distractions”, “car drivers” and alike are the most commonly used keywords, and these are also keywords used in the most cited papers from the field as shown by the analysis of author keywords.
- (f)
- A little under a third of the included papers present research, performed in real road conditions, other papers utilize driving simulators of various sophistication levels, prerecorded video recordings of driving situations, and four publications utilize both simulators and on-road research. On average, research includes roughly 29 participants, with the average number of participants being slightly higher for research in driving simulators (27.84 versus 26.05 for research in real conditions), but given the large standard deviations, it does not seem that research settings influence the number of included participants.
- (g)
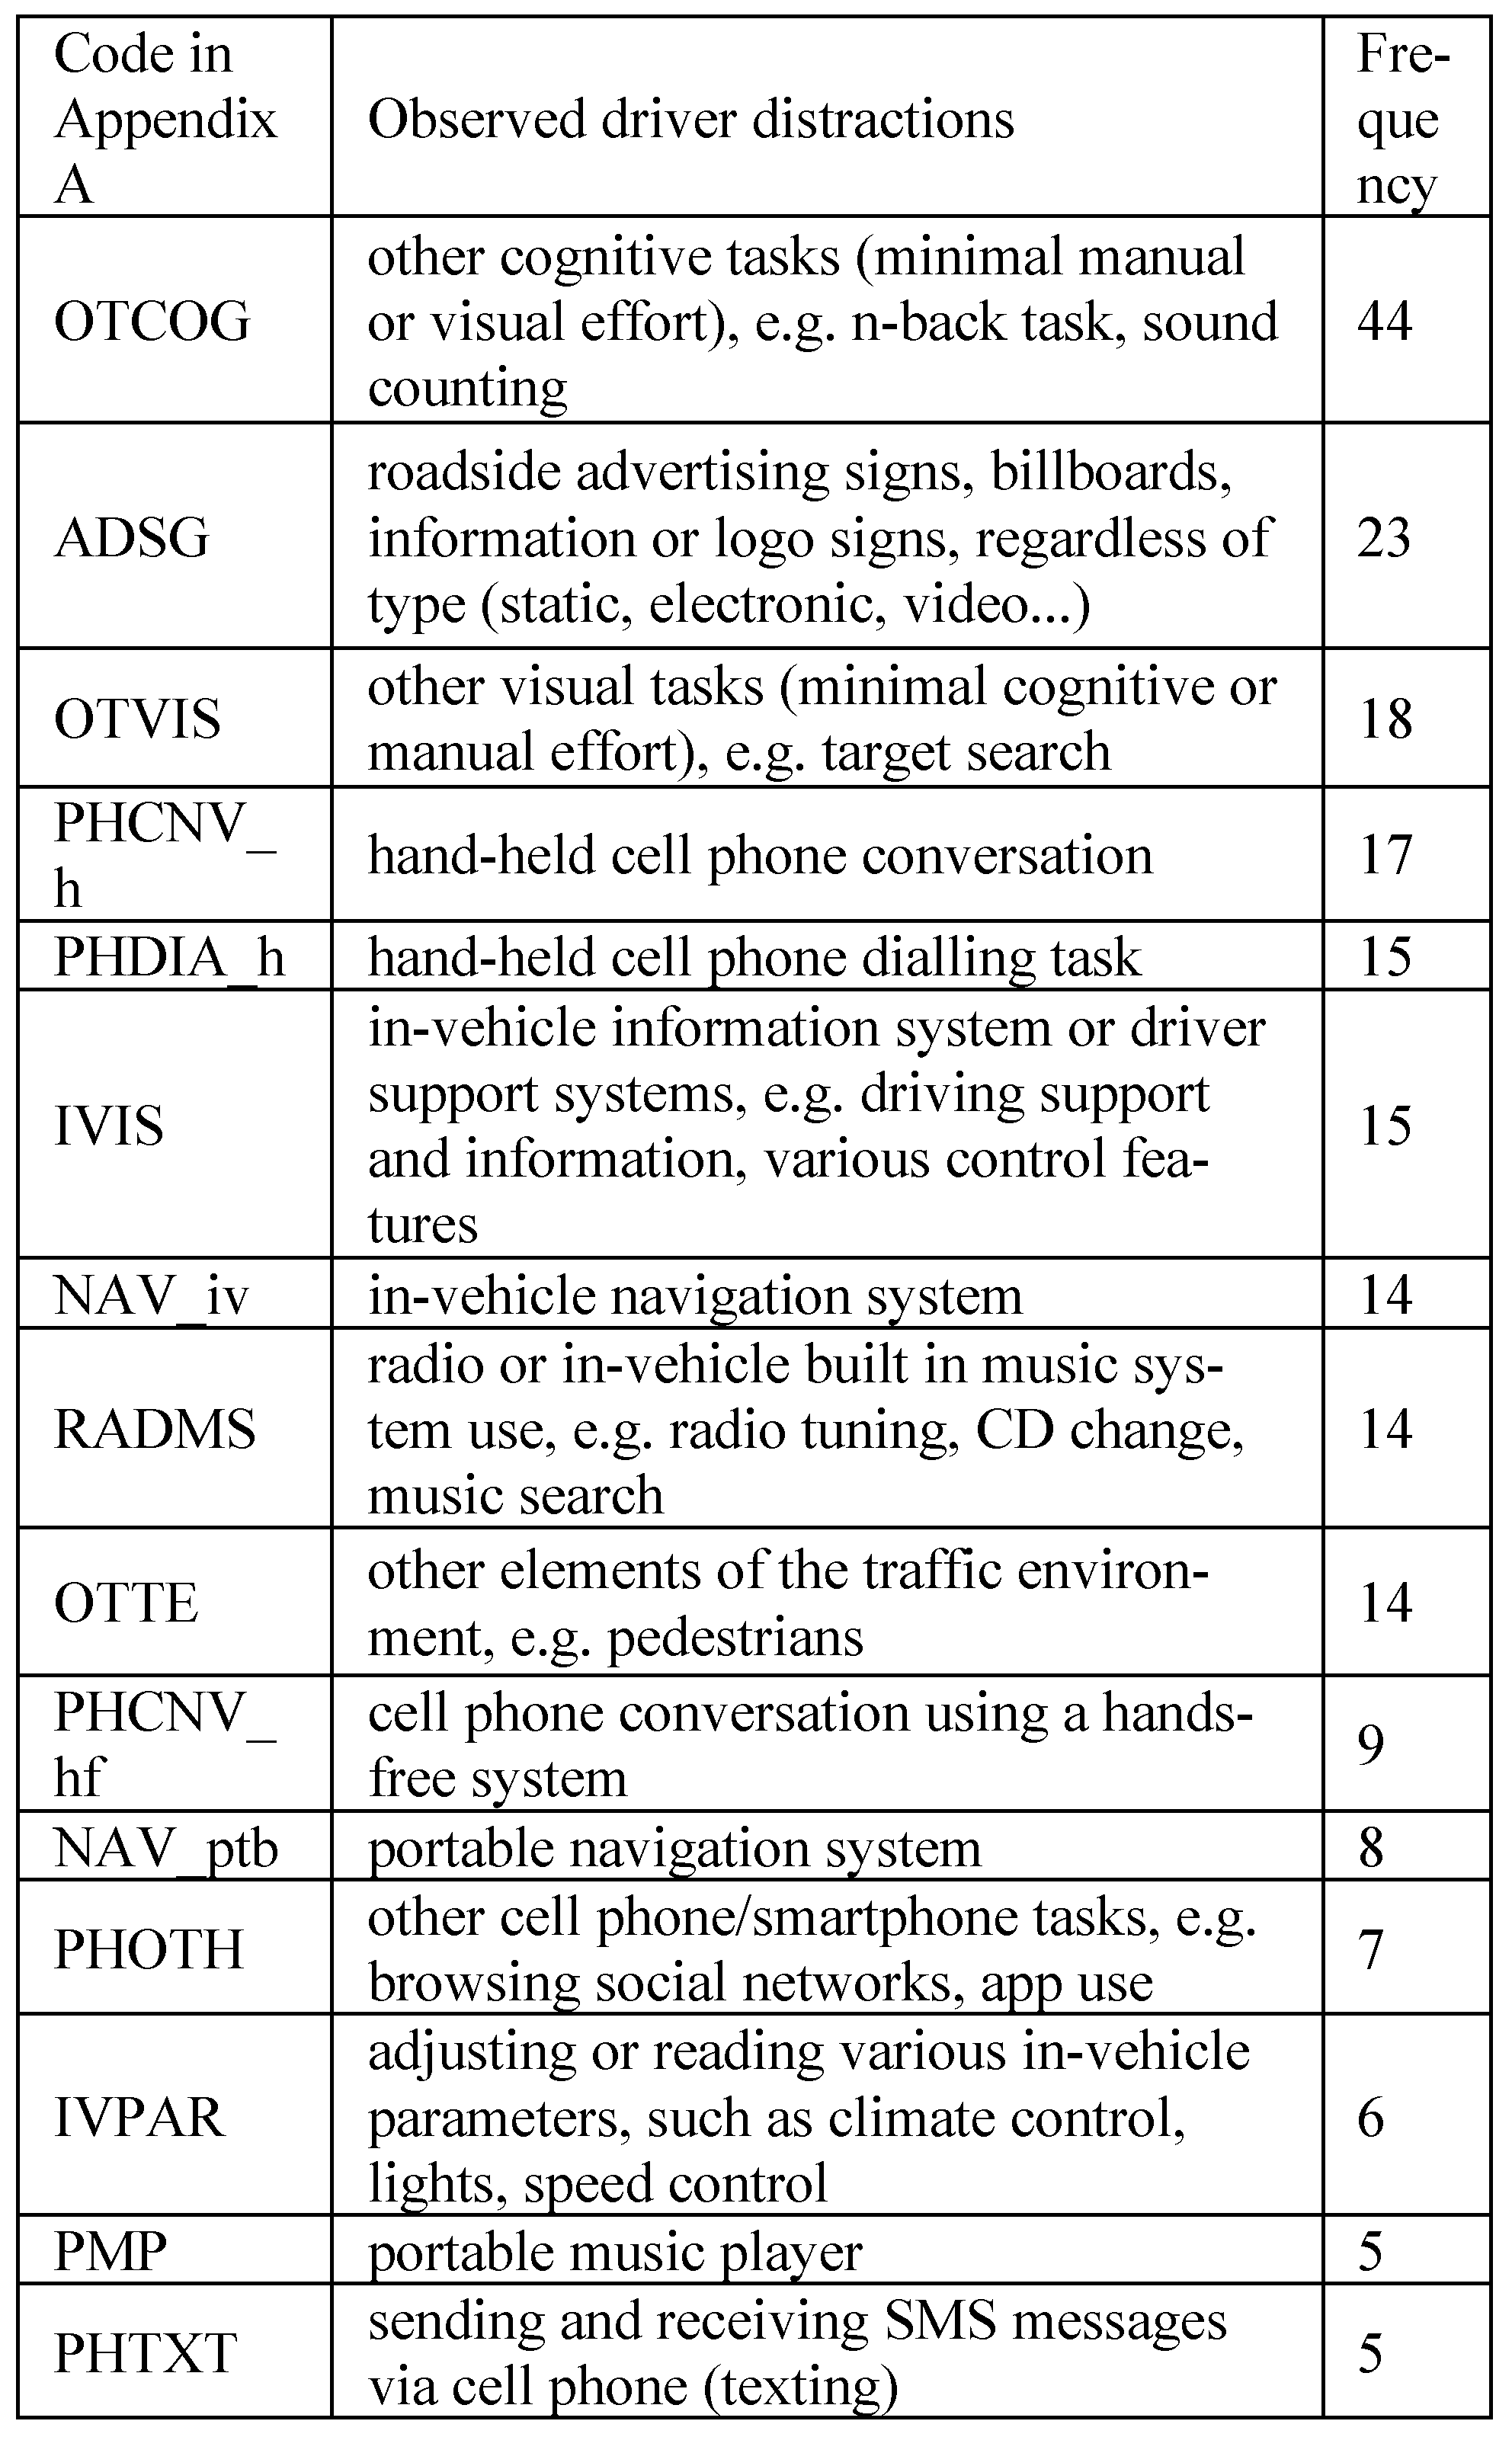
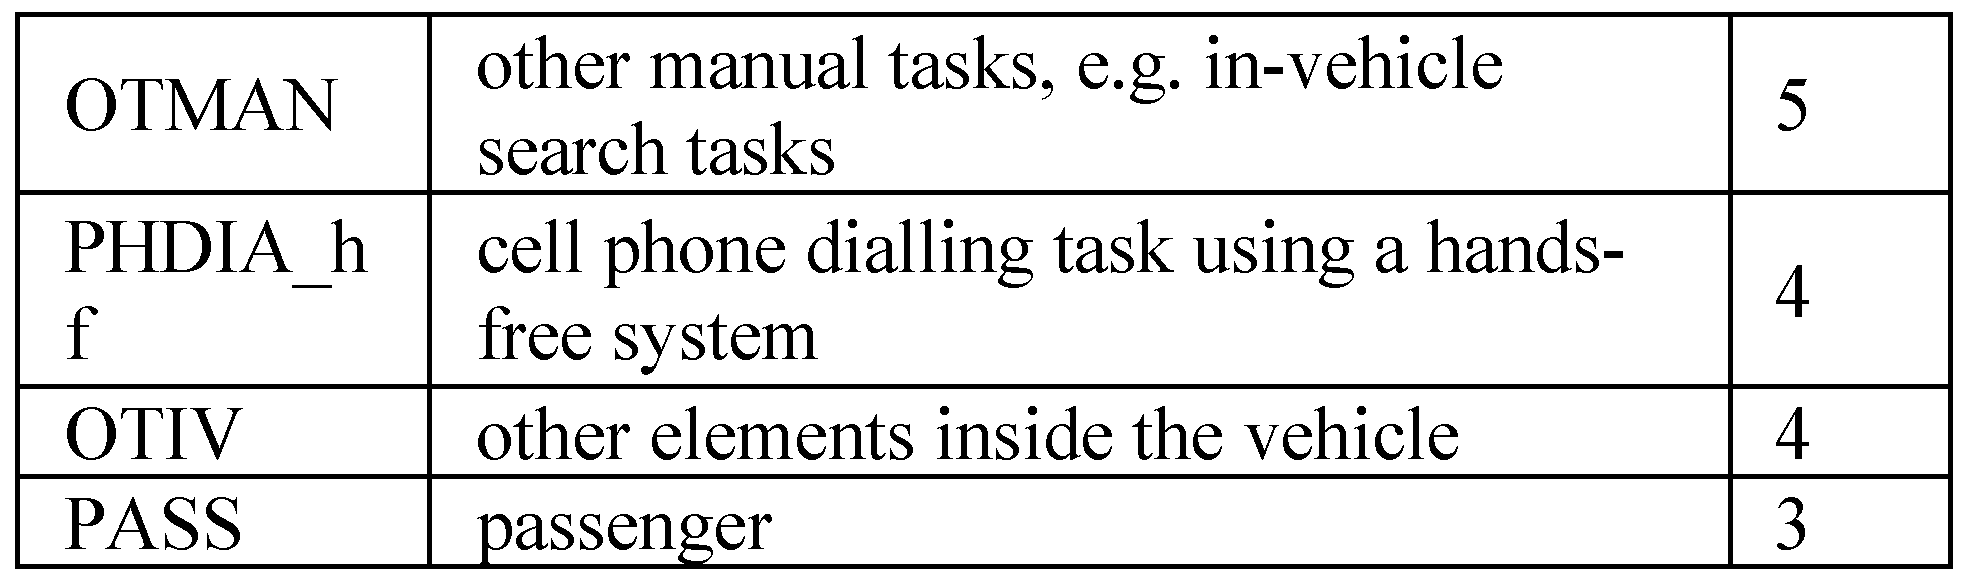
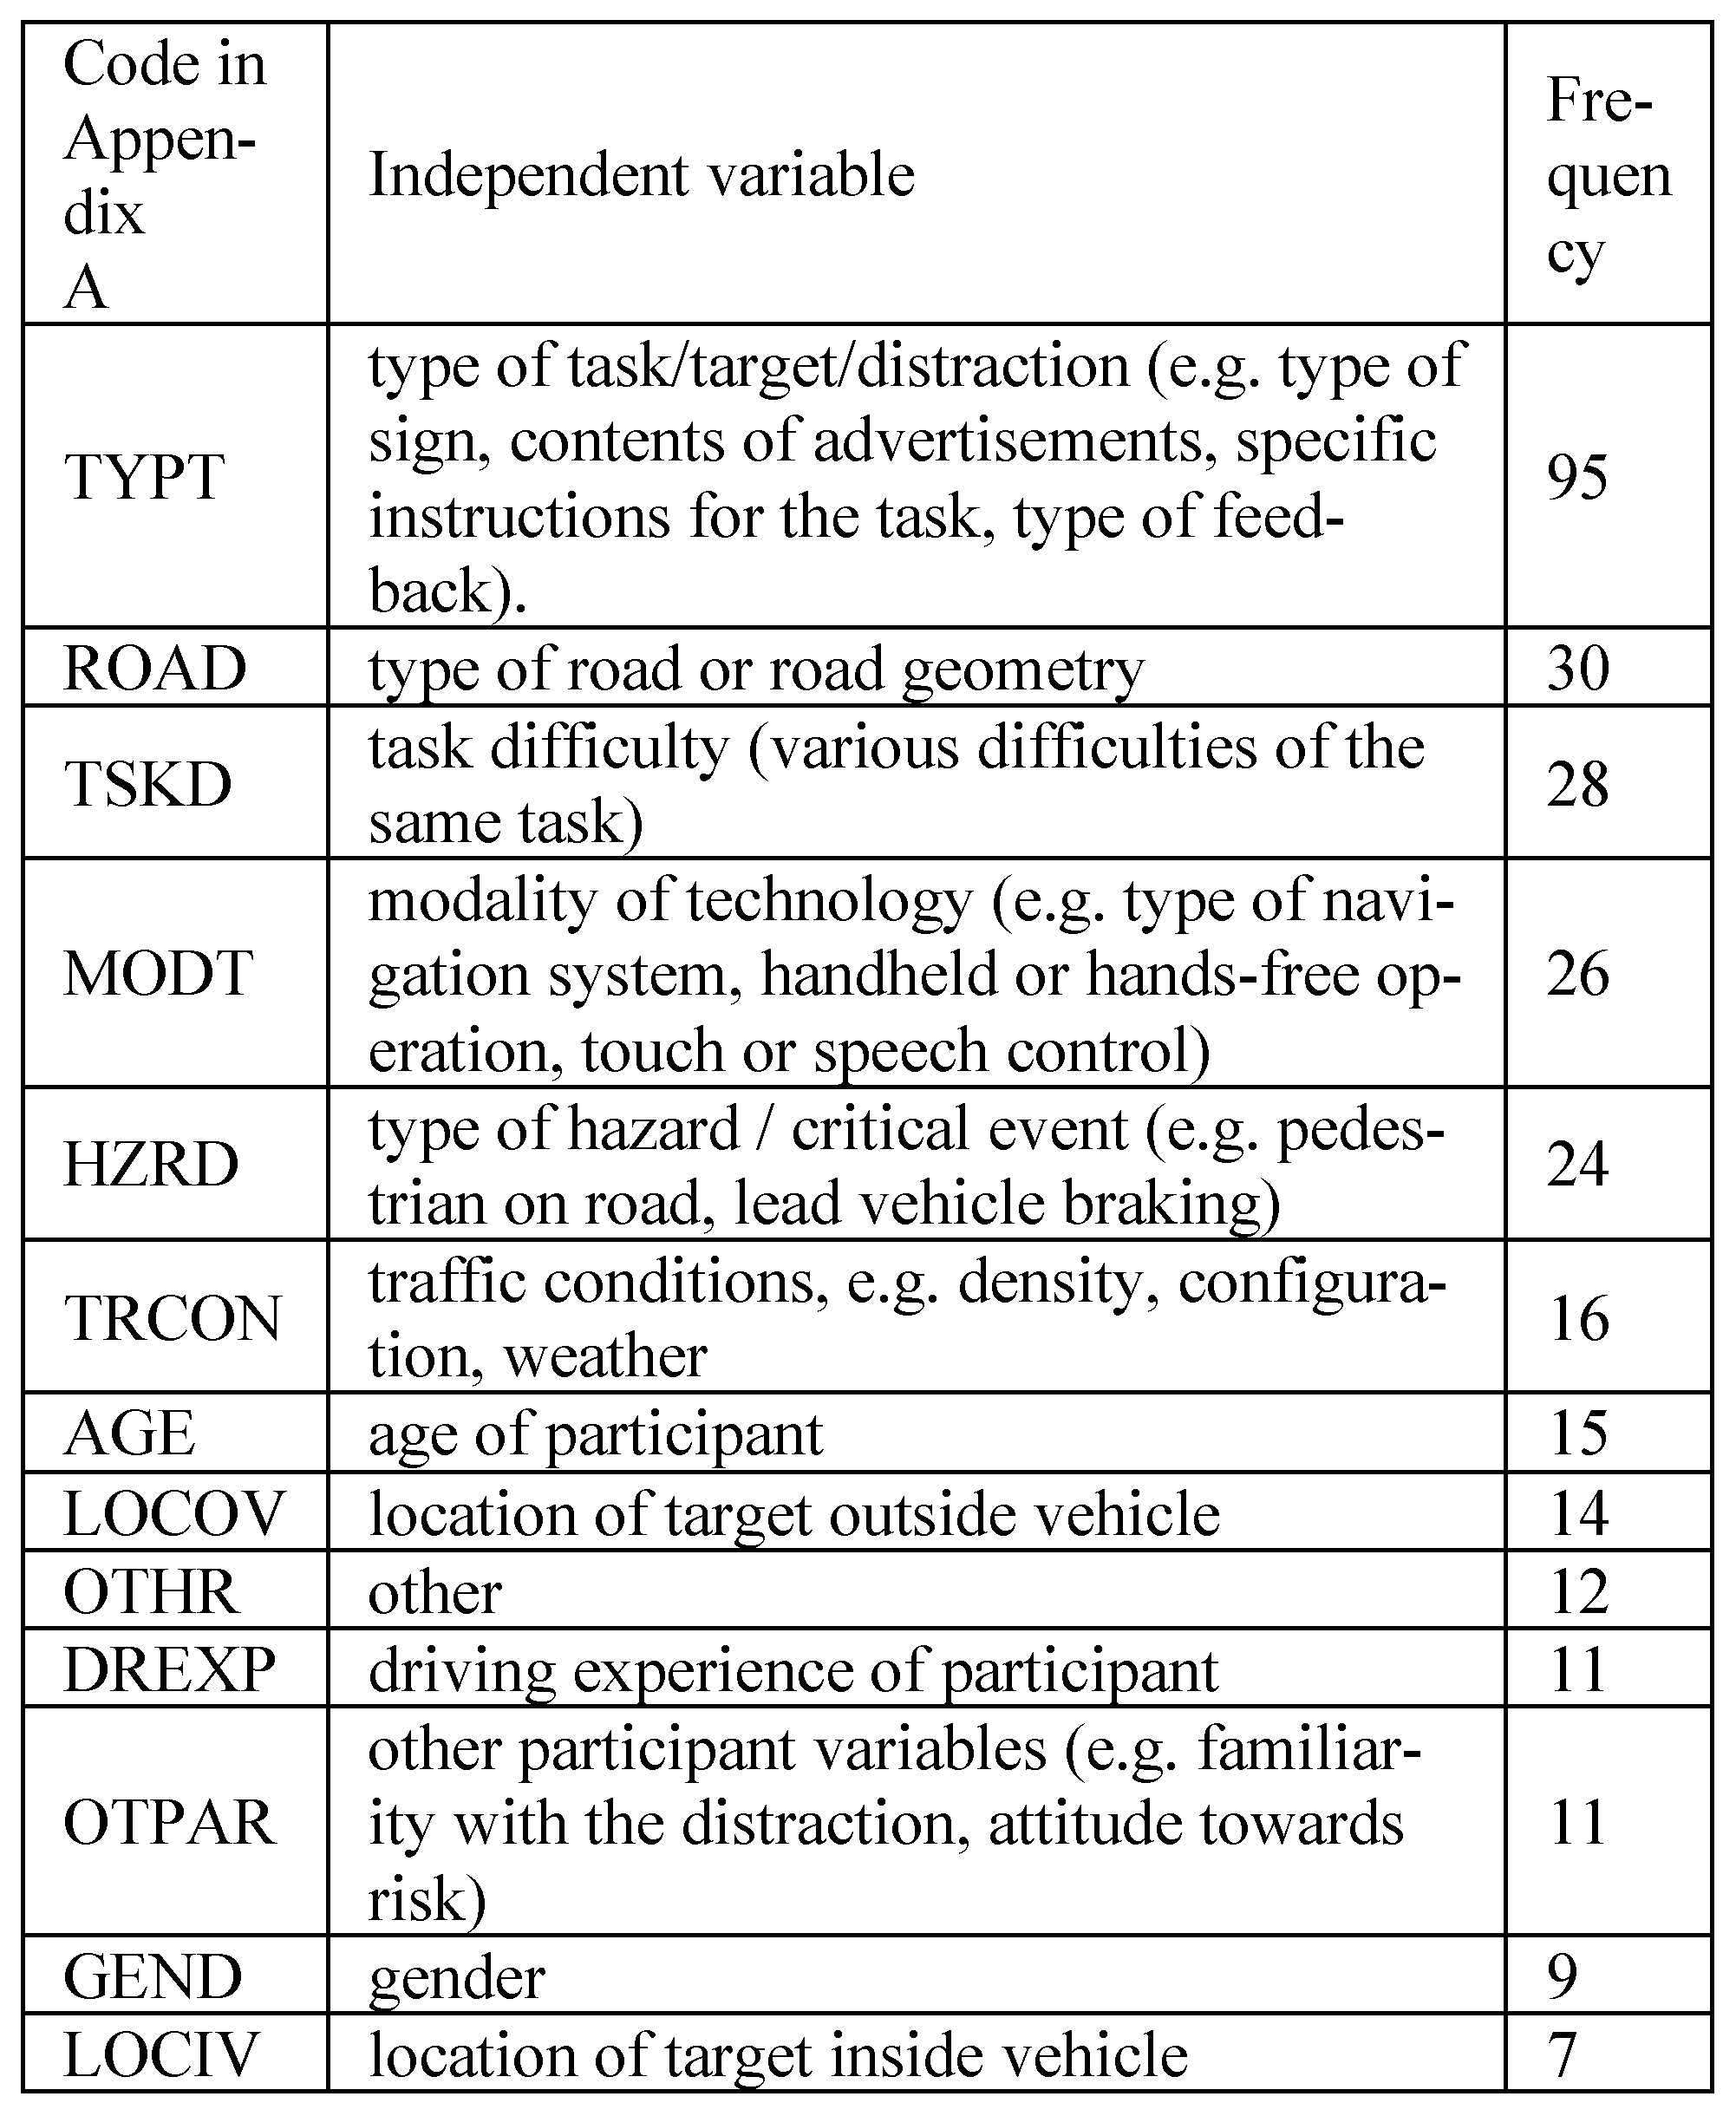
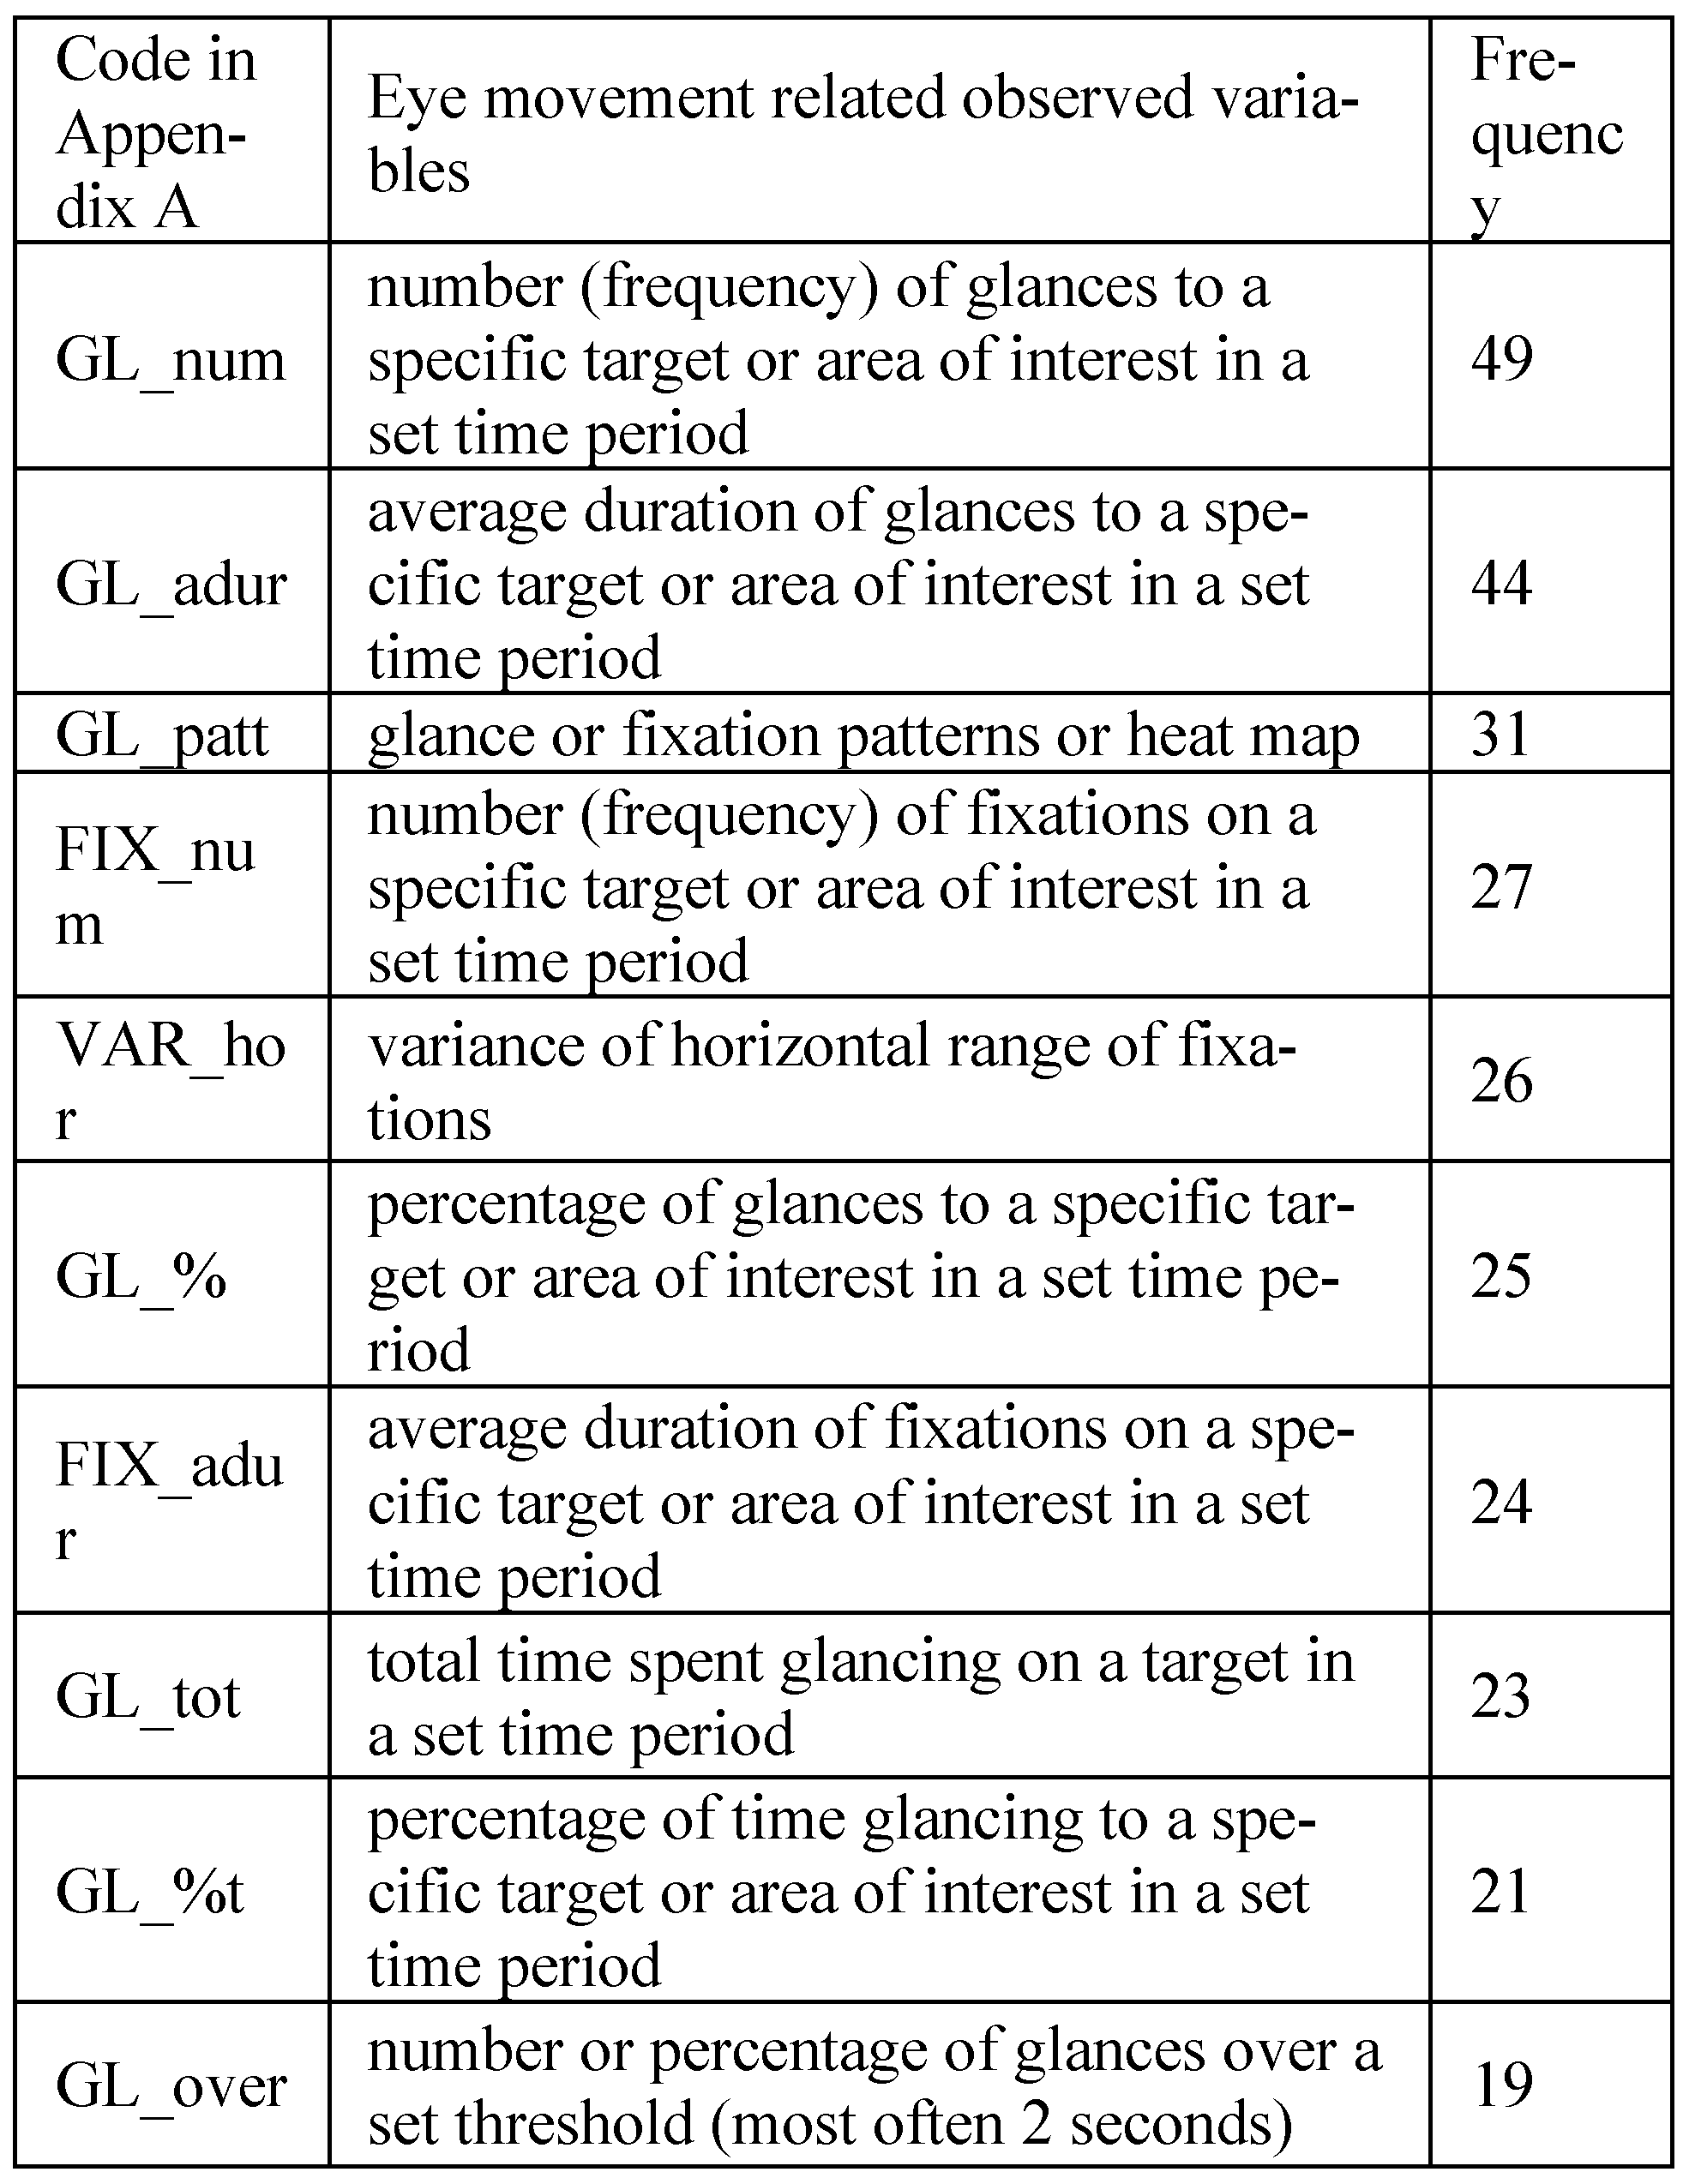
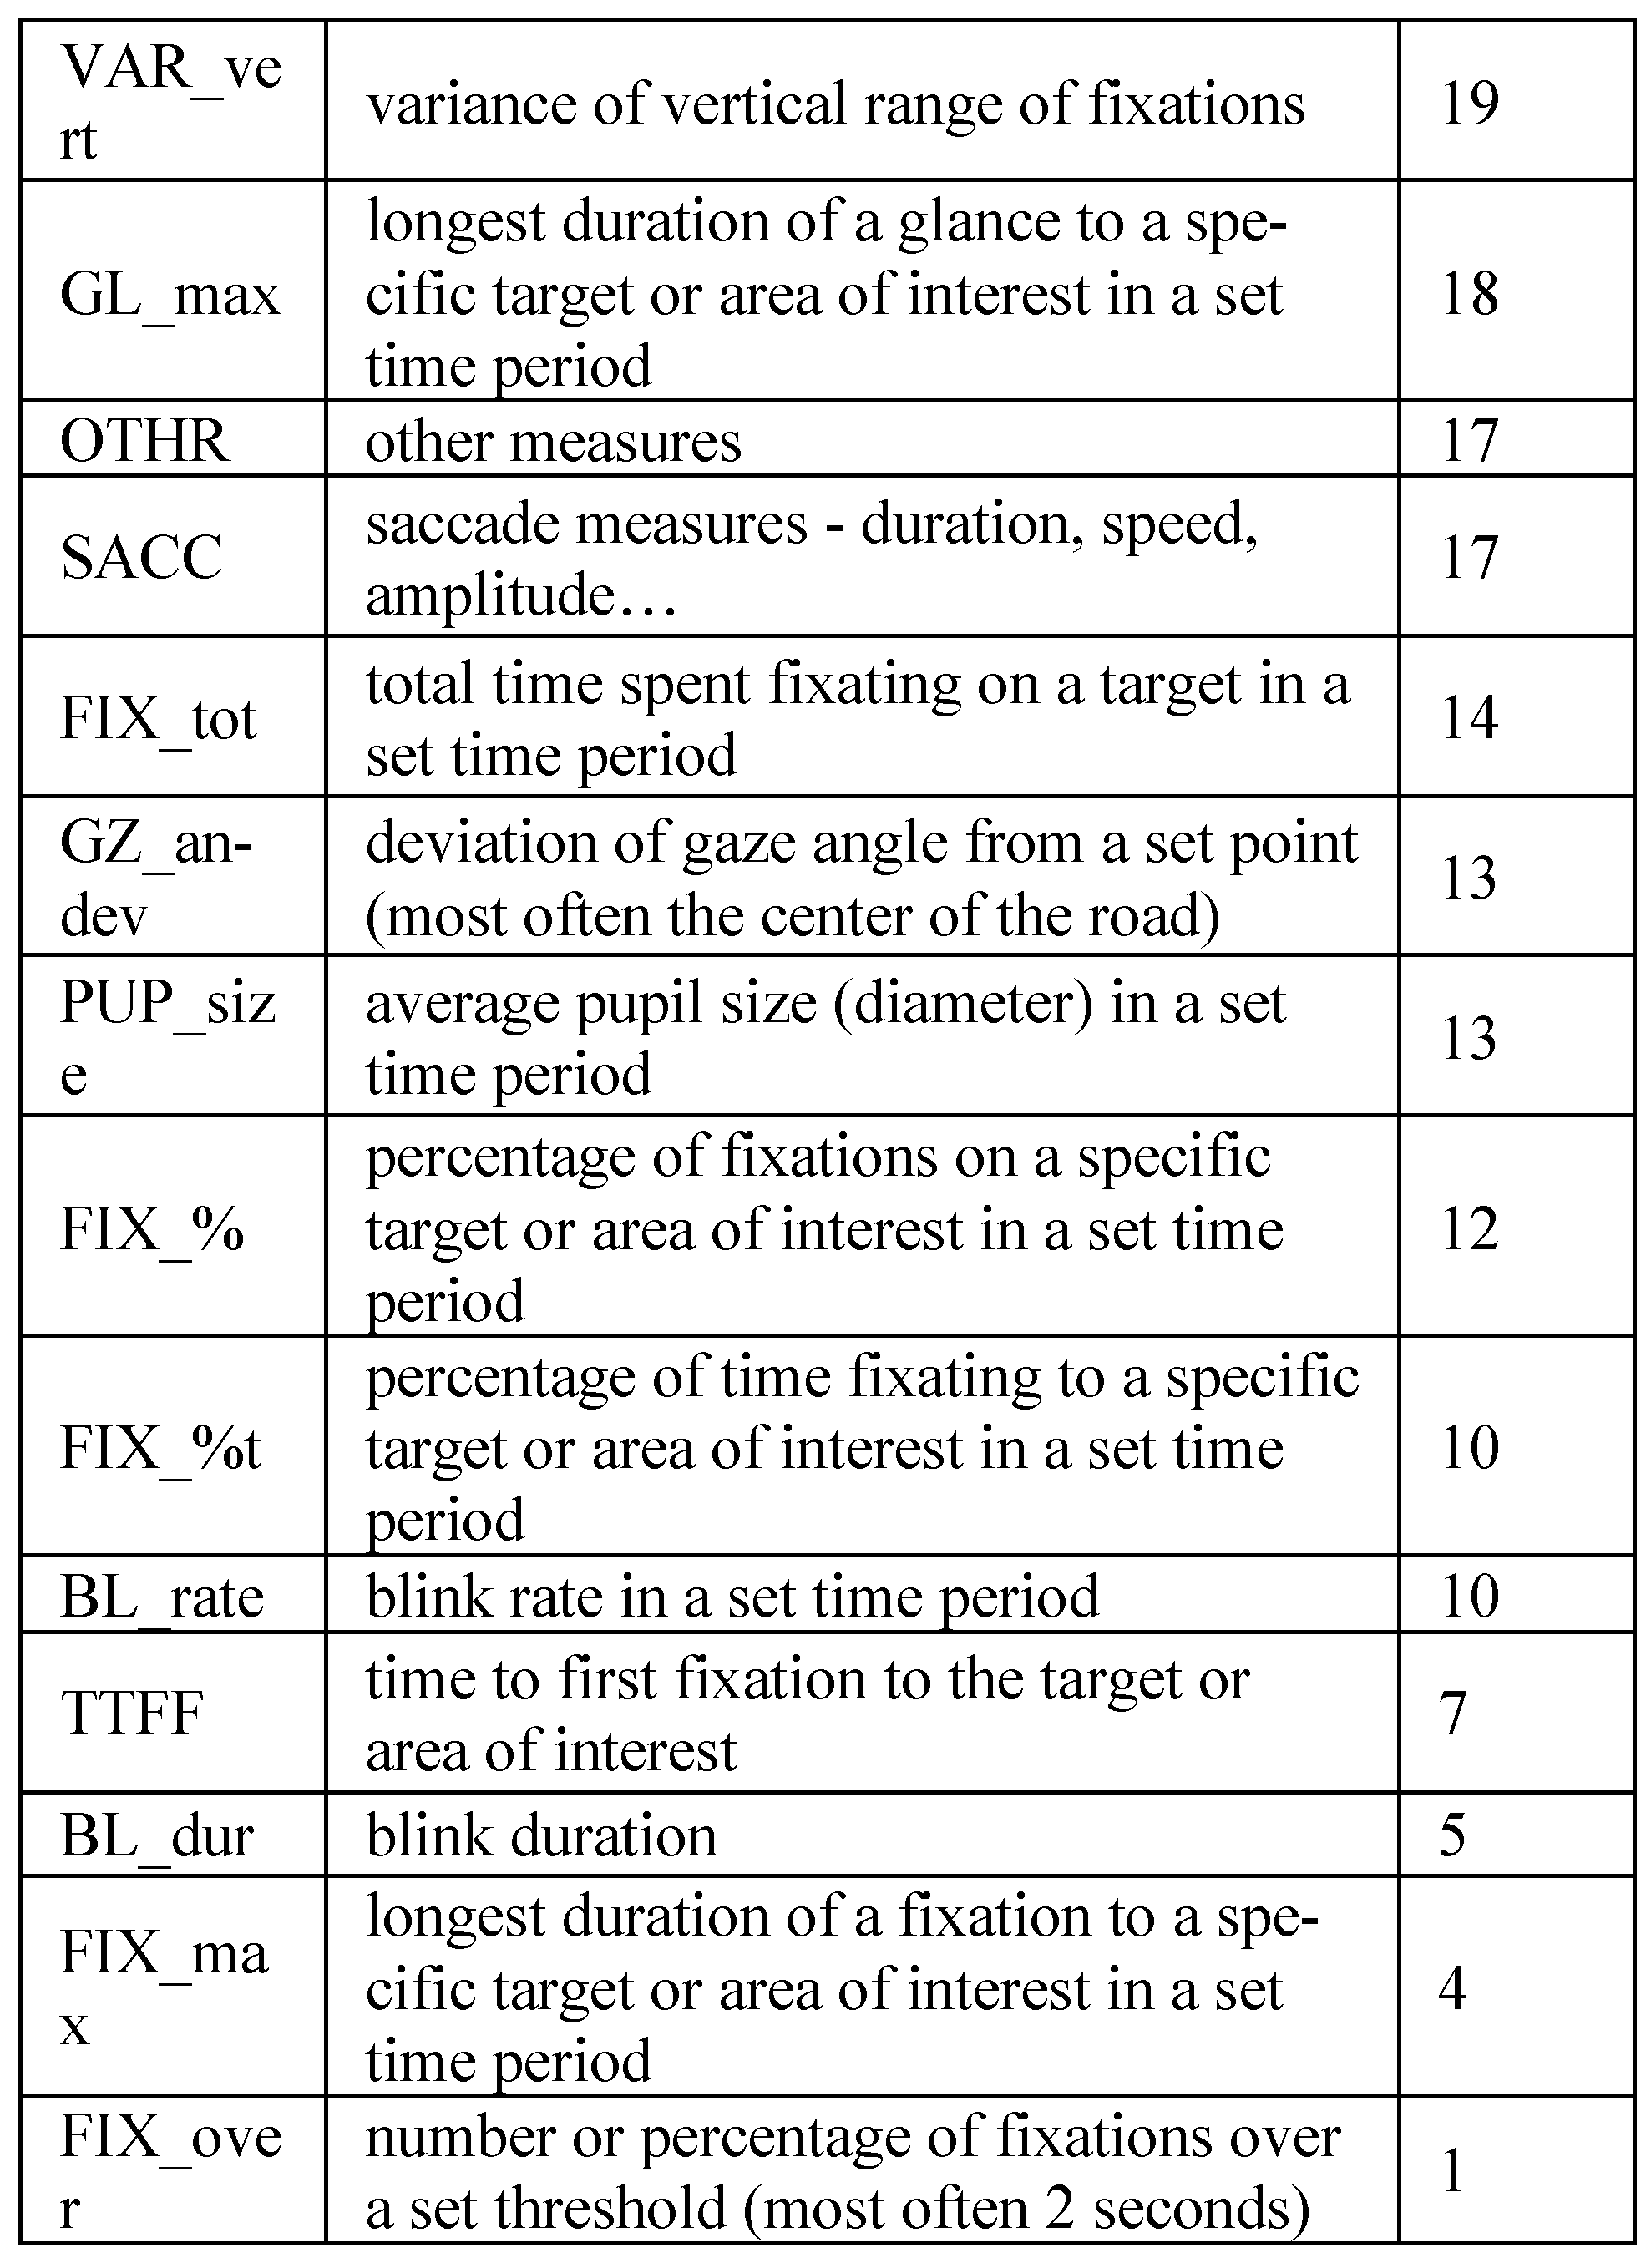
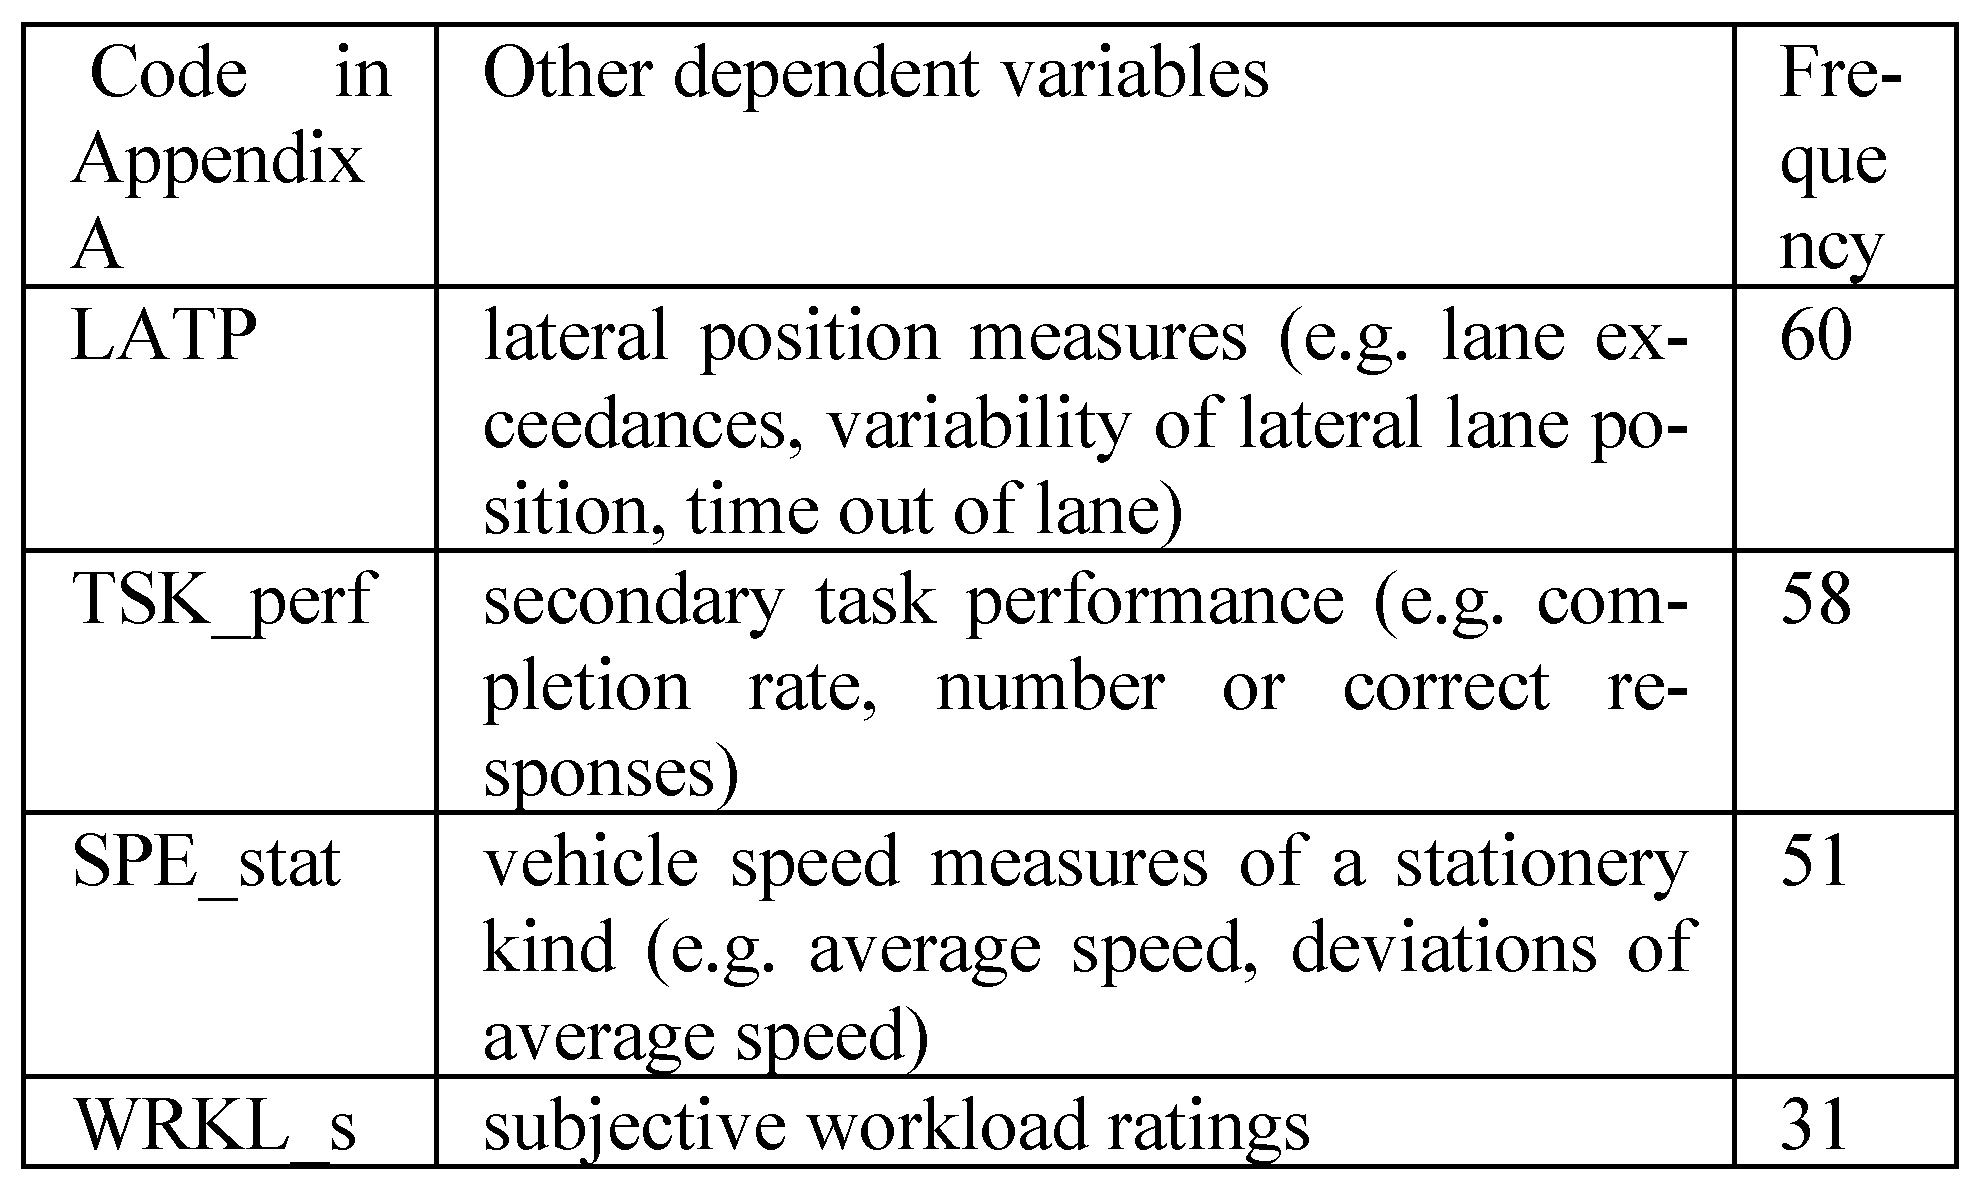
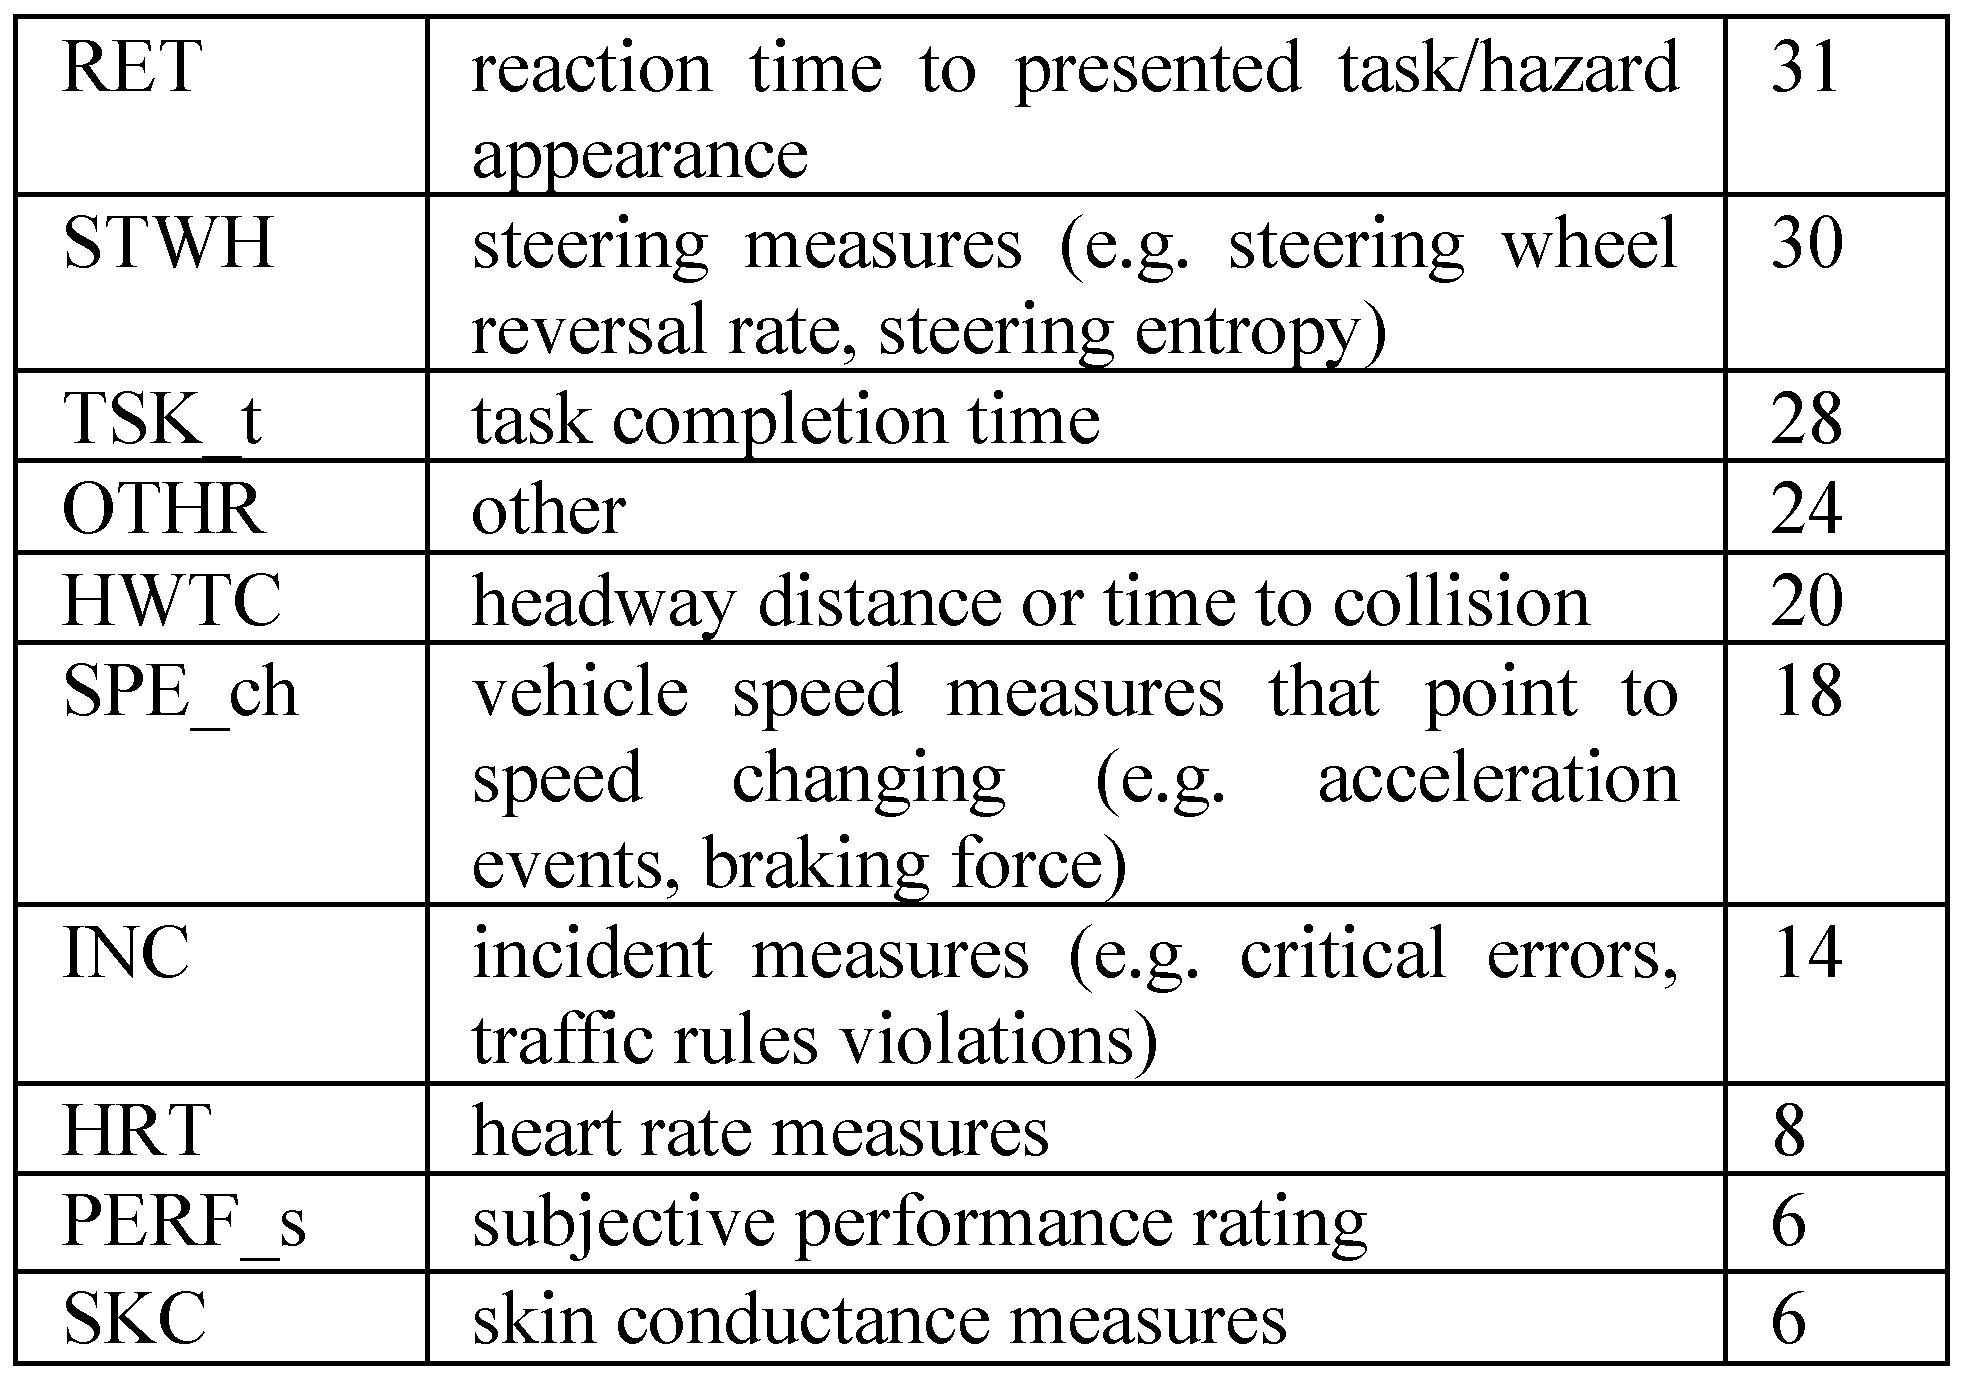
- An overall analysis of the research variables points to the fact that cognitive distractions are most researched, followed by visual ones. Cell phones and various IVIS systems are at the centre of in-vehicle distraction research while advertisements and information signs dominate research outside the vehicle. Most papers only include one distraction or task type. In addition to eye tracking parameters, the effects of driver distraction are often analysed by using complementary variables, such as parameters of driving performance and task performance. Another point worth mentioning is the use of glances or fixations as the basic eye movement parameter. There seems to be a lack of consensus on the field on which unit of measurement to use. We did notice however that a lot of research lately uses the definition of glances and fixations as was put forward in the ISO standard on measuring driver visual behaviour (International Organization for Standardization, 2014), where fixations are seen as a static point of gaze focus and glances as a set of fixations and saccades inside a predefined area of interest.
Ethics and Conflict of Interest
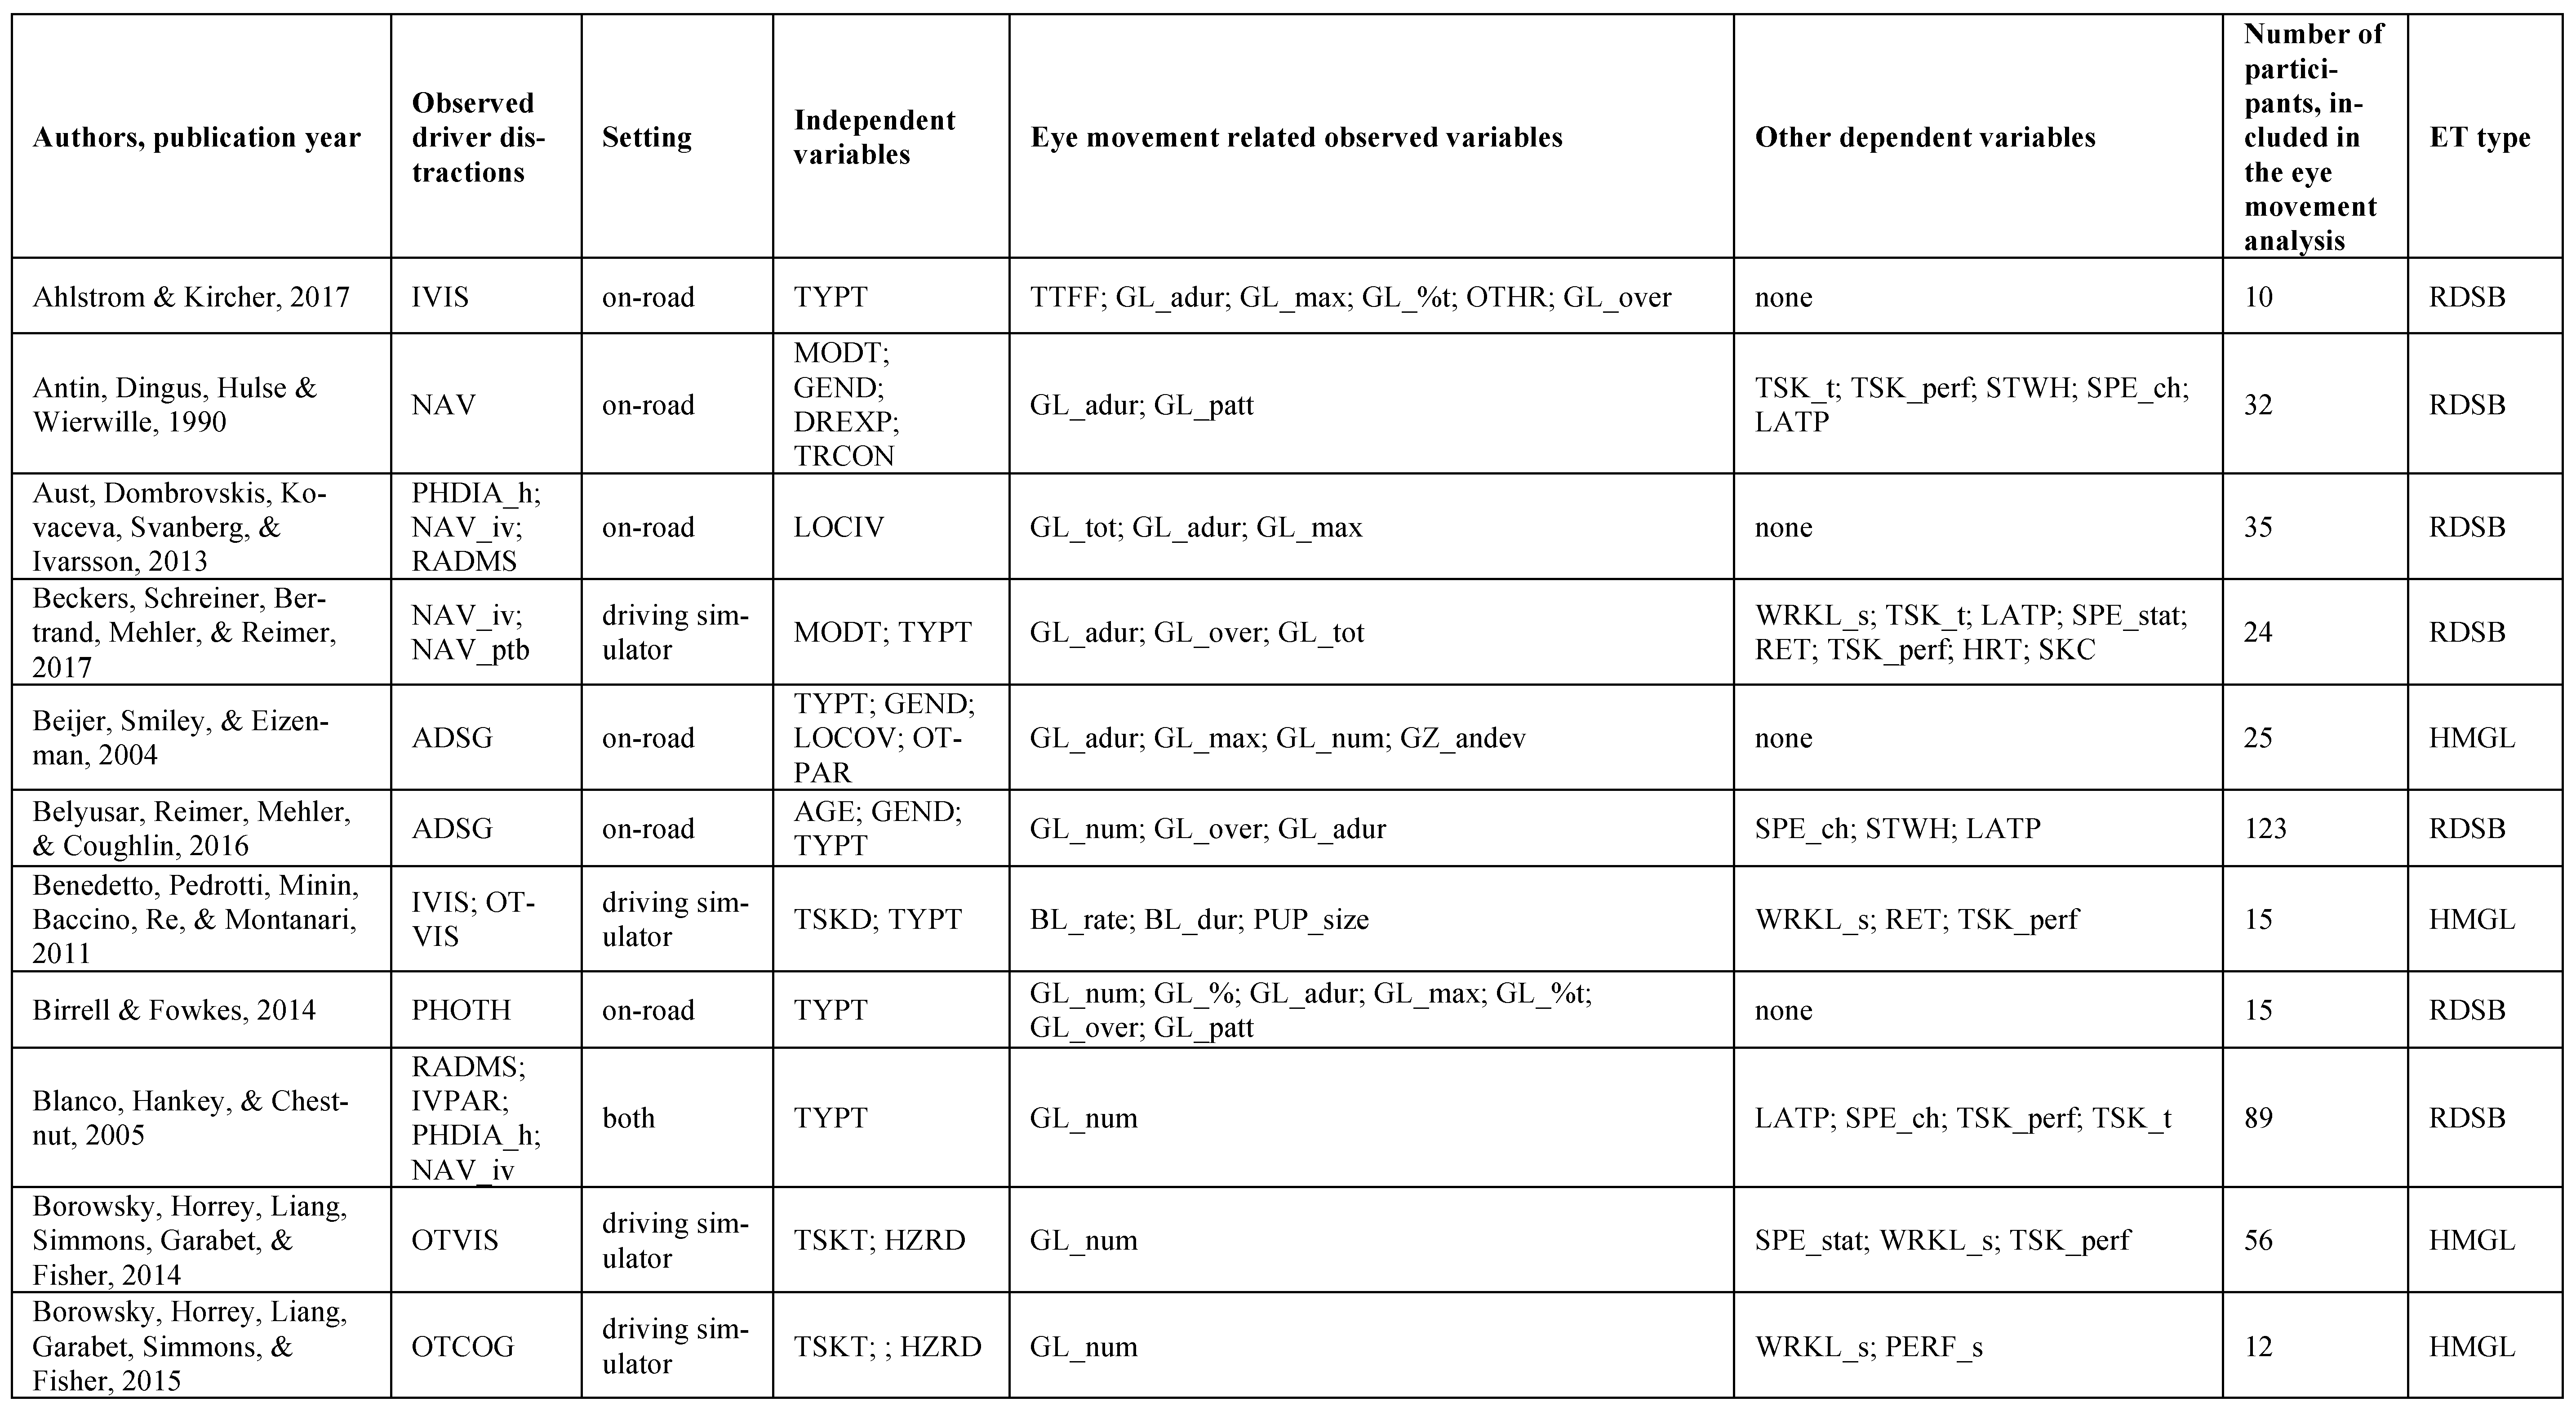
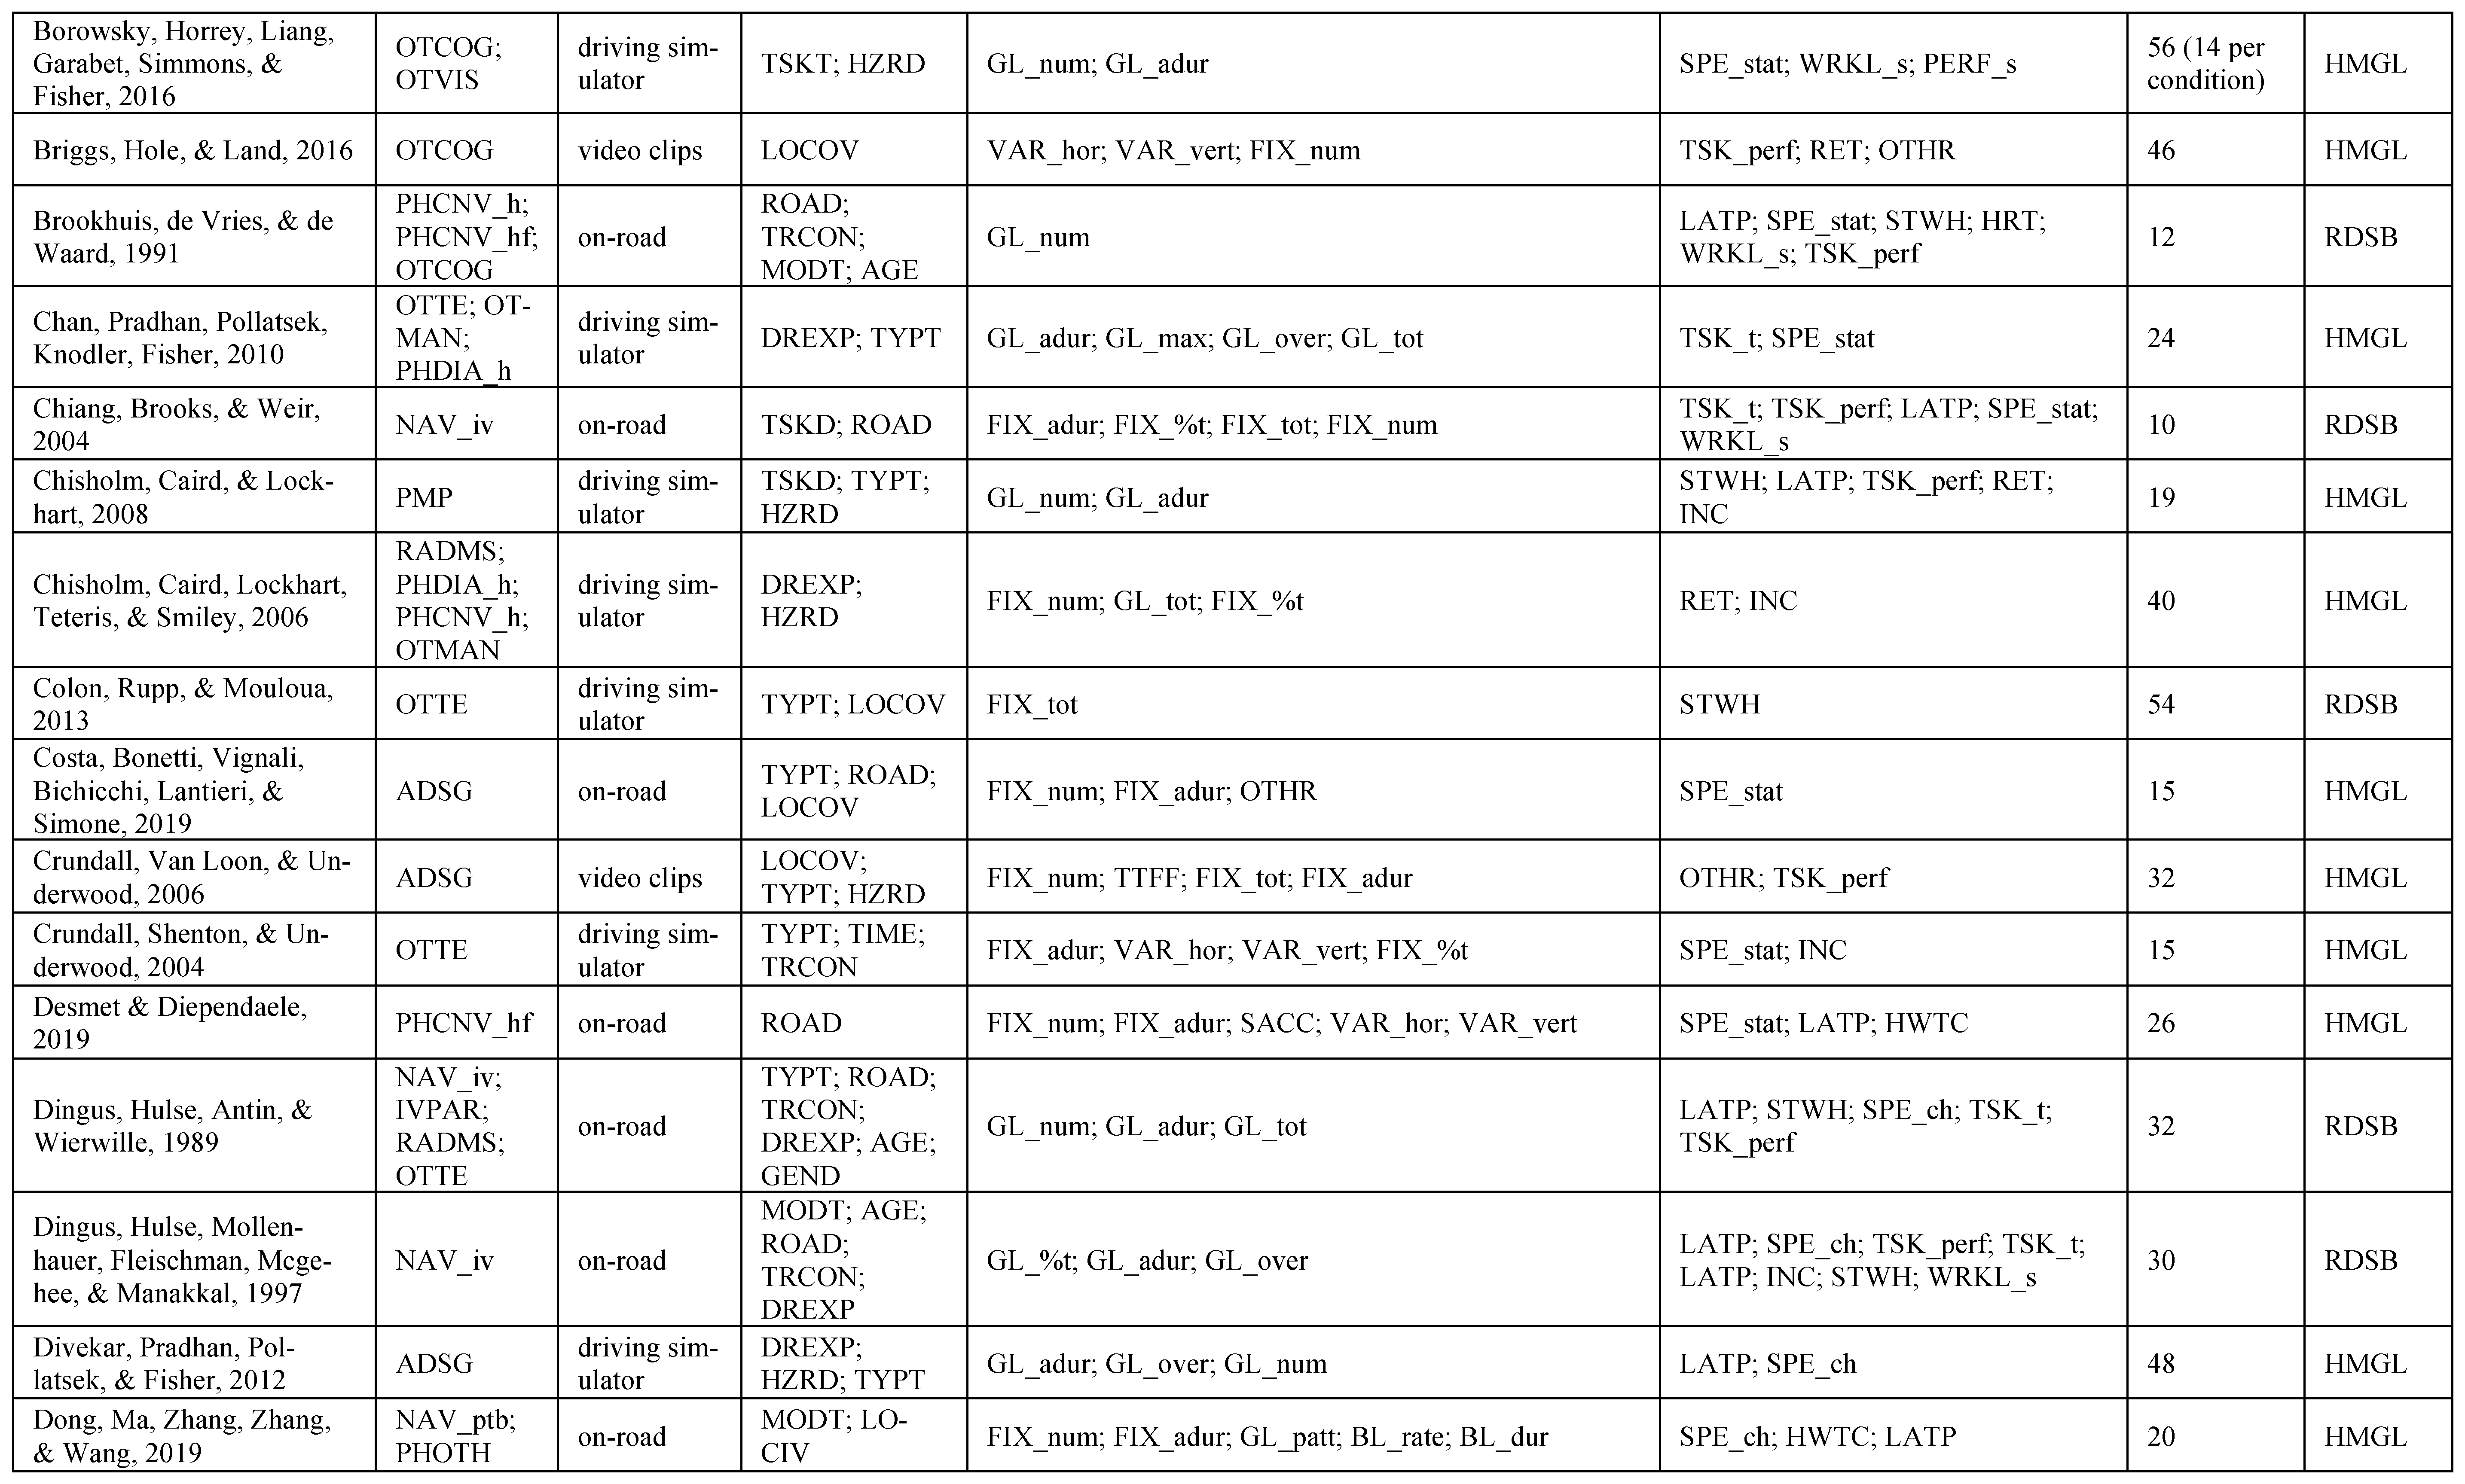
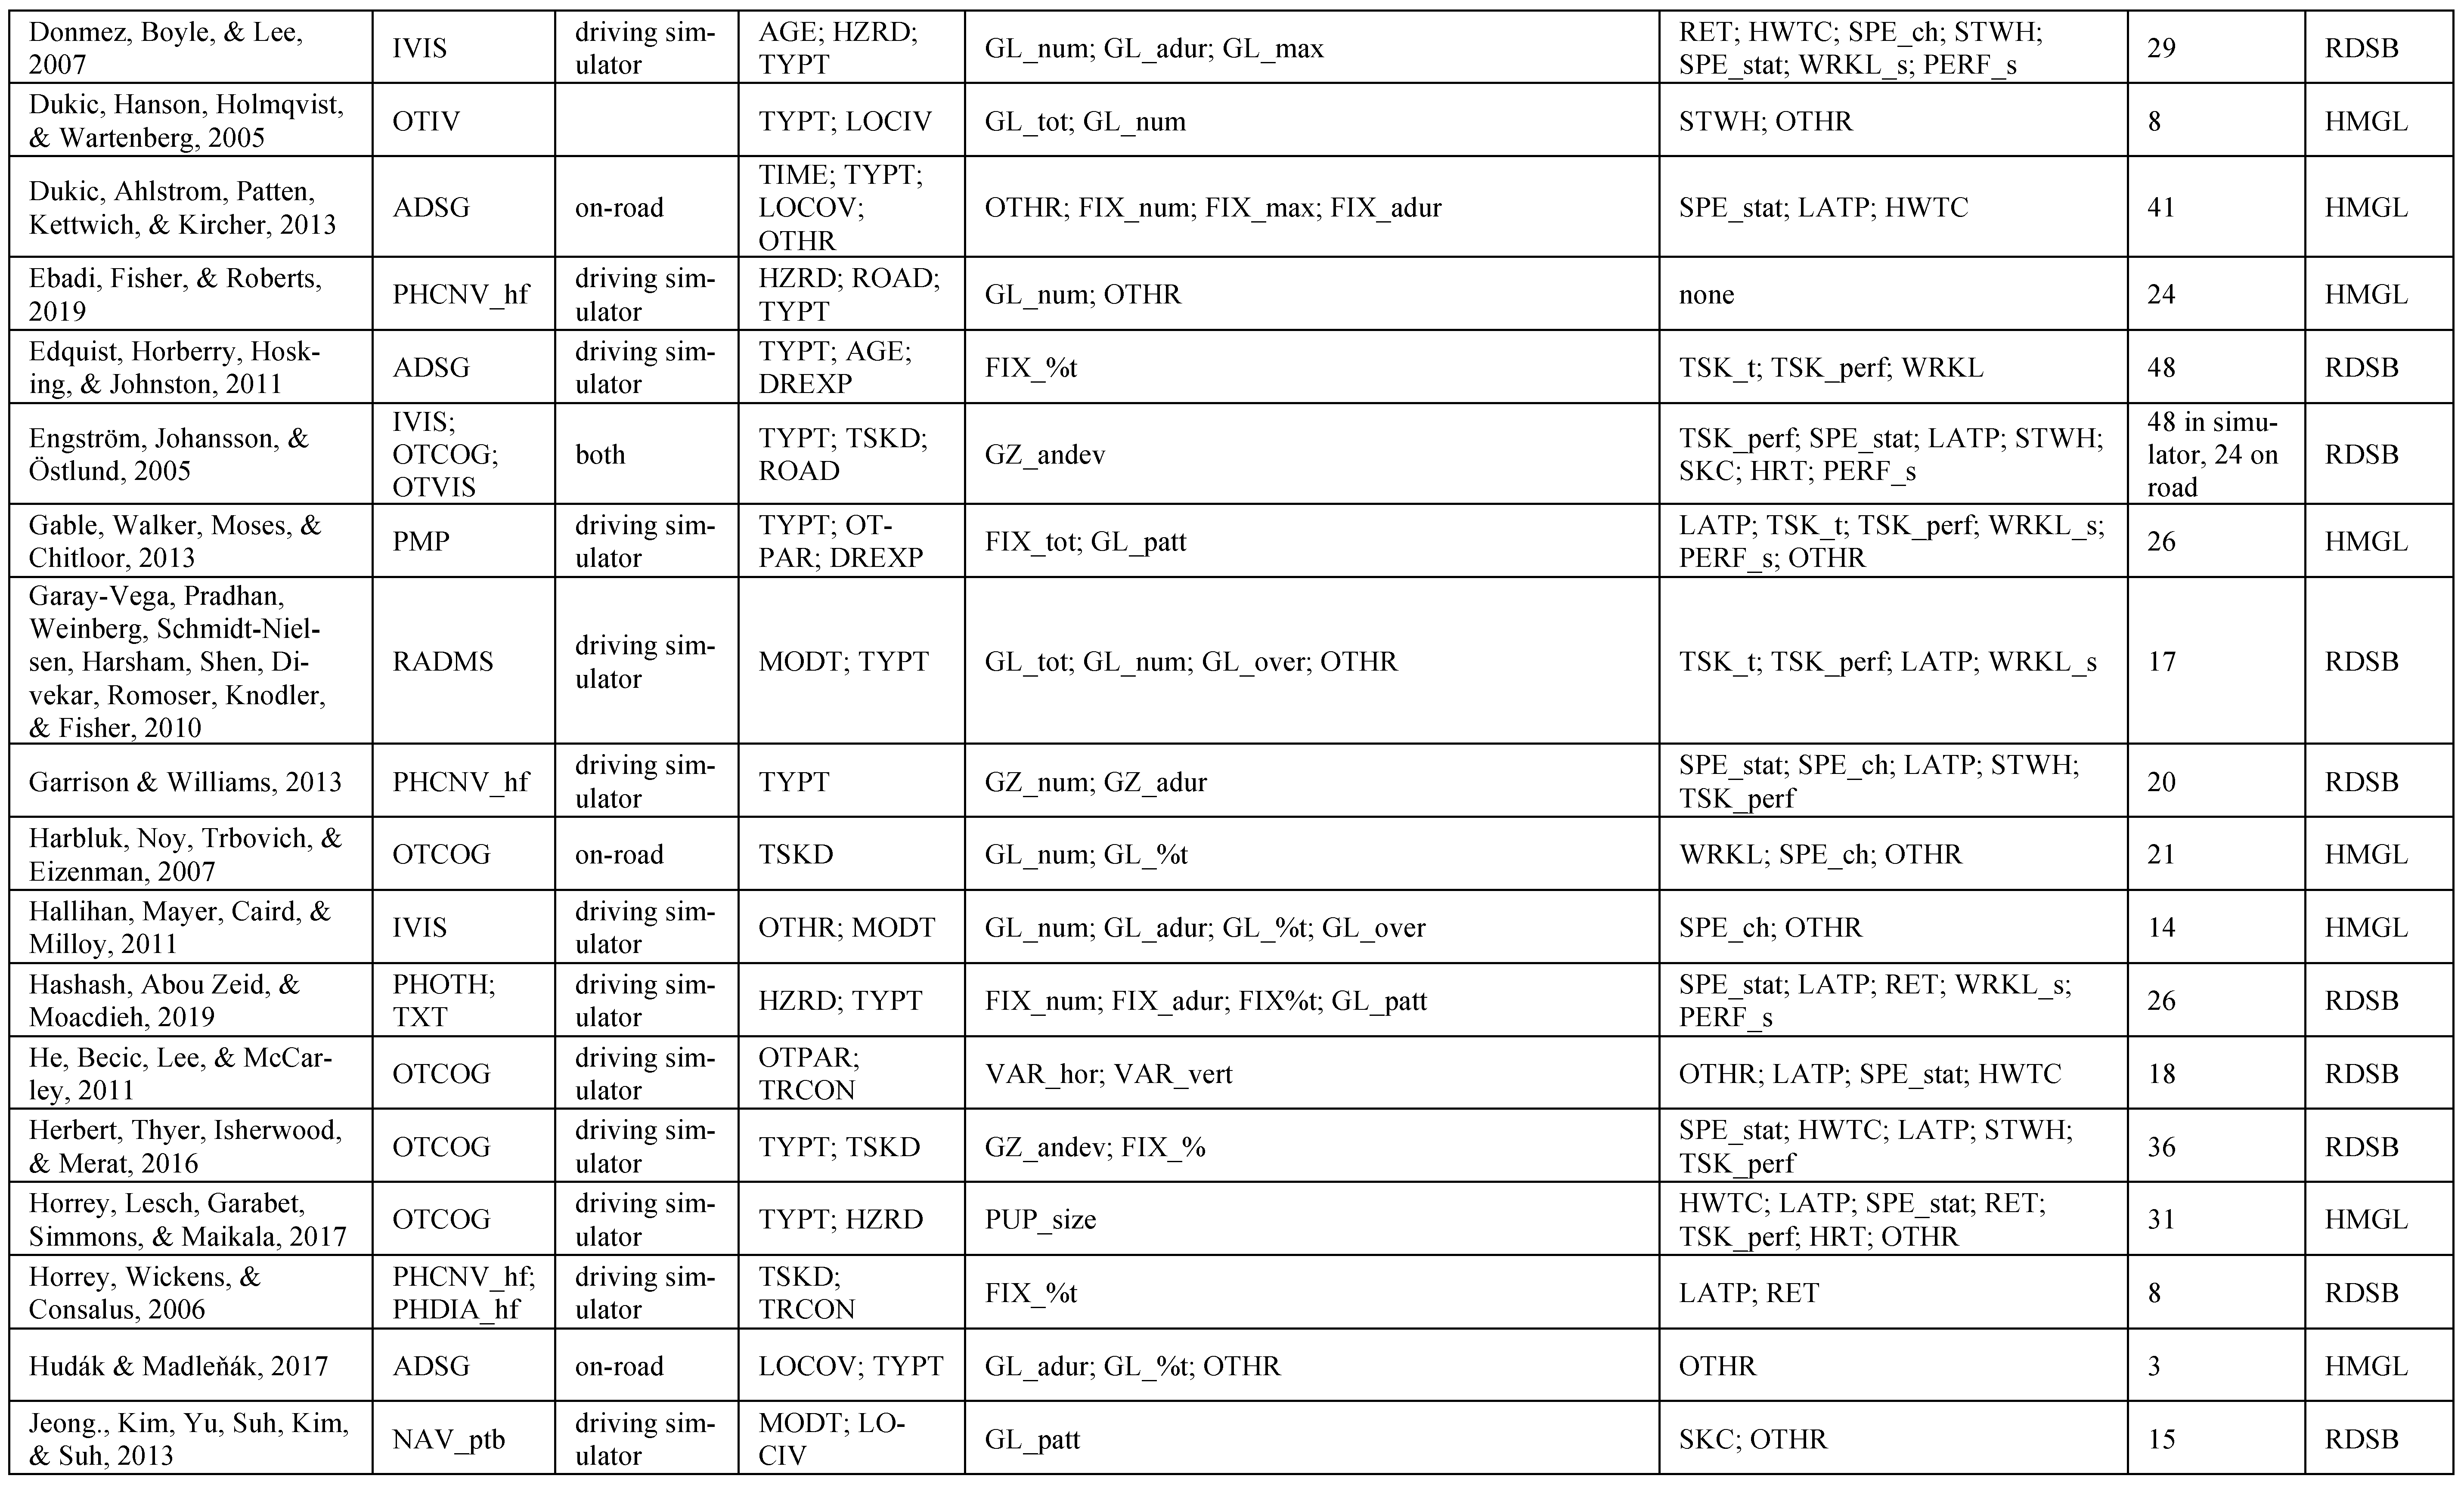
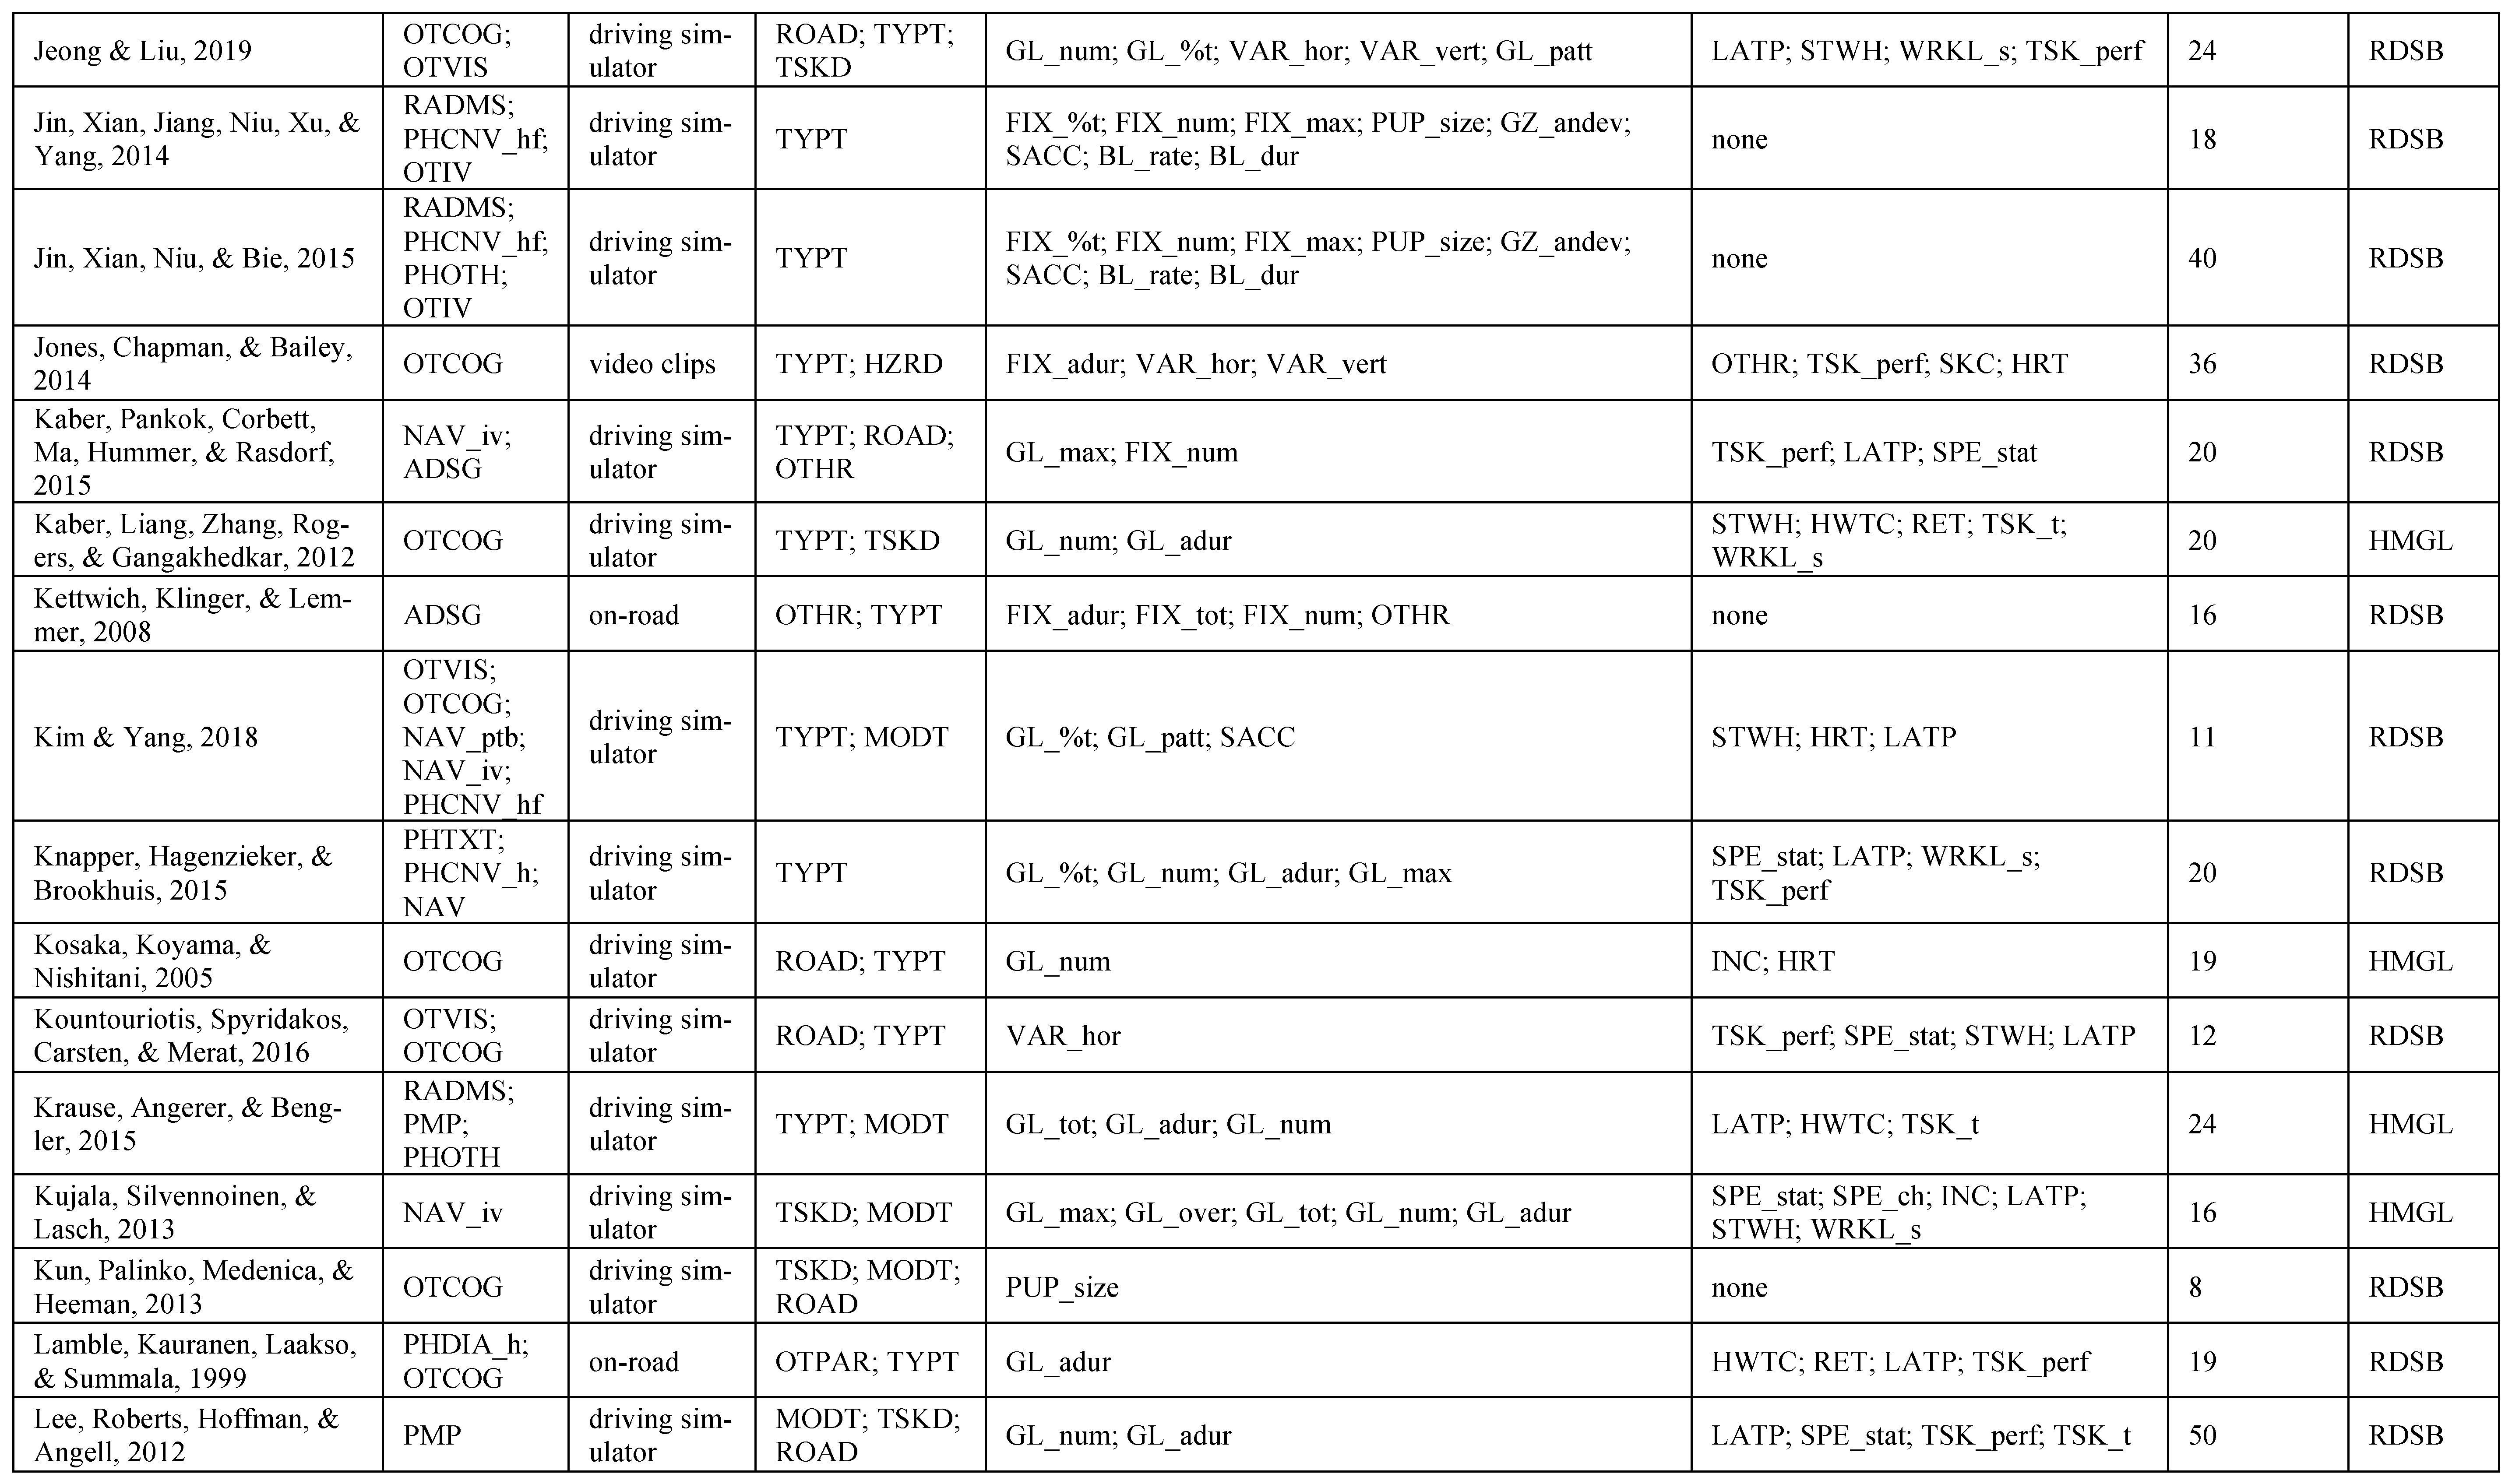
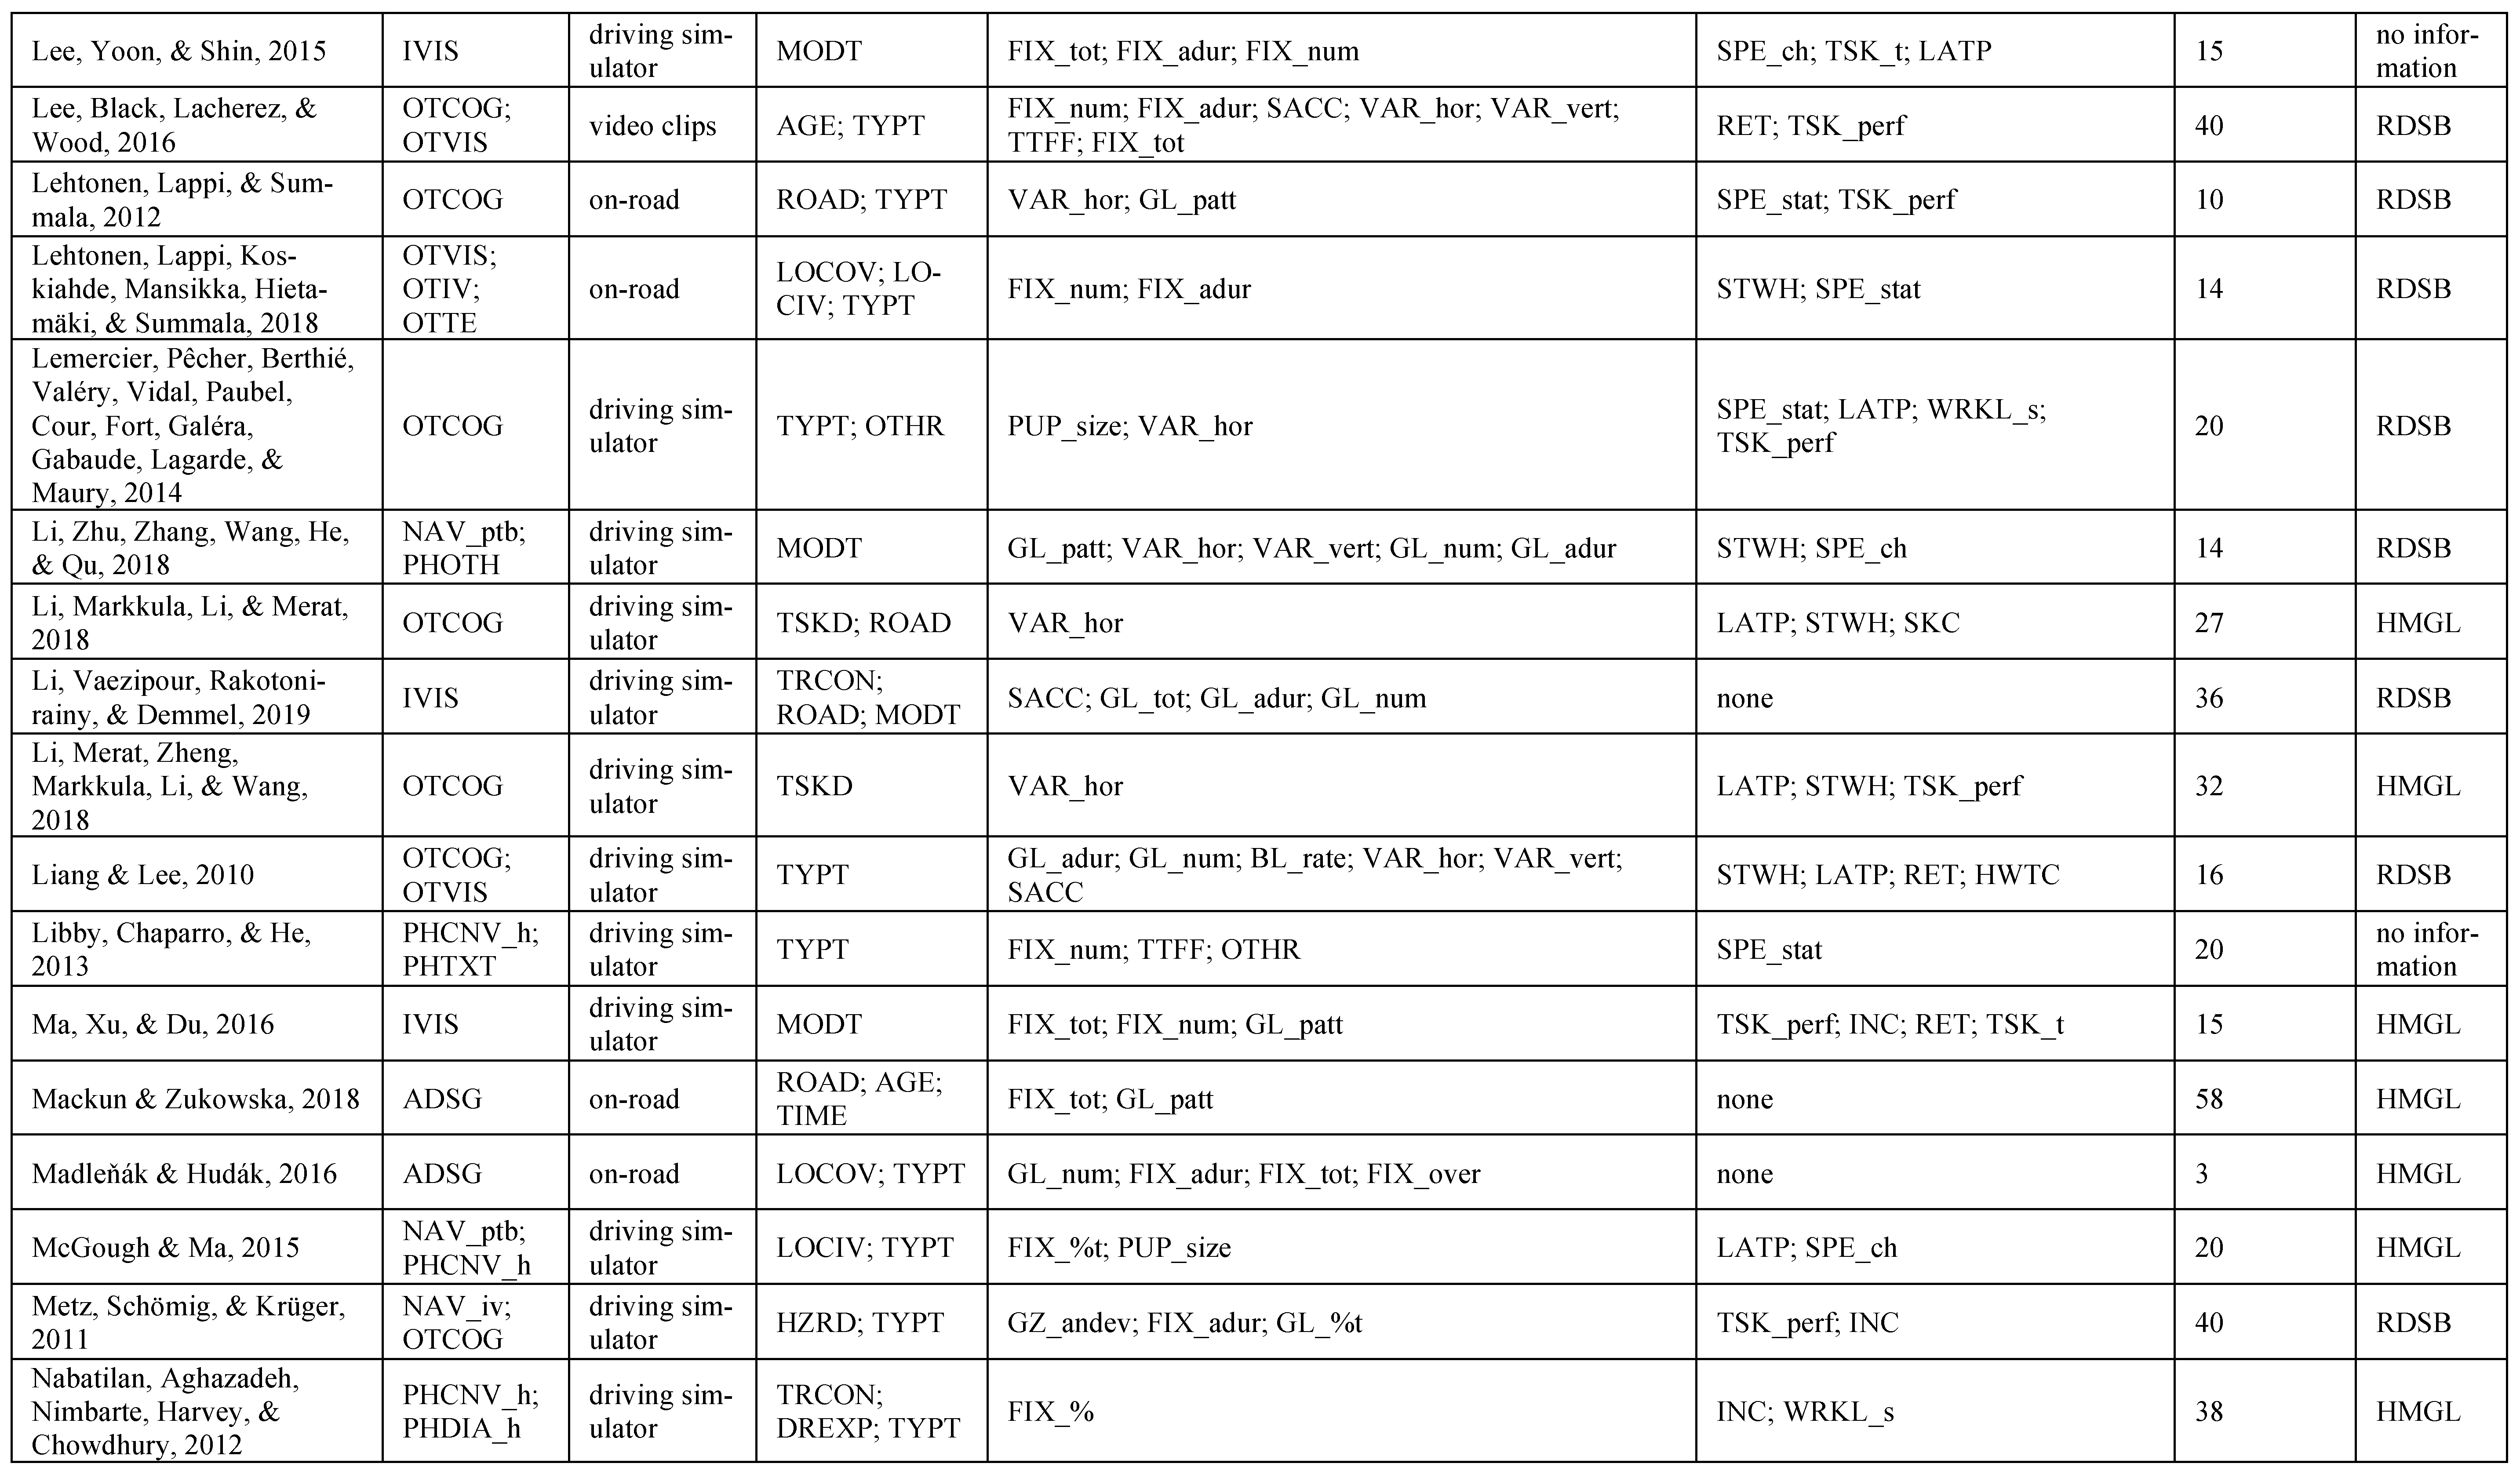
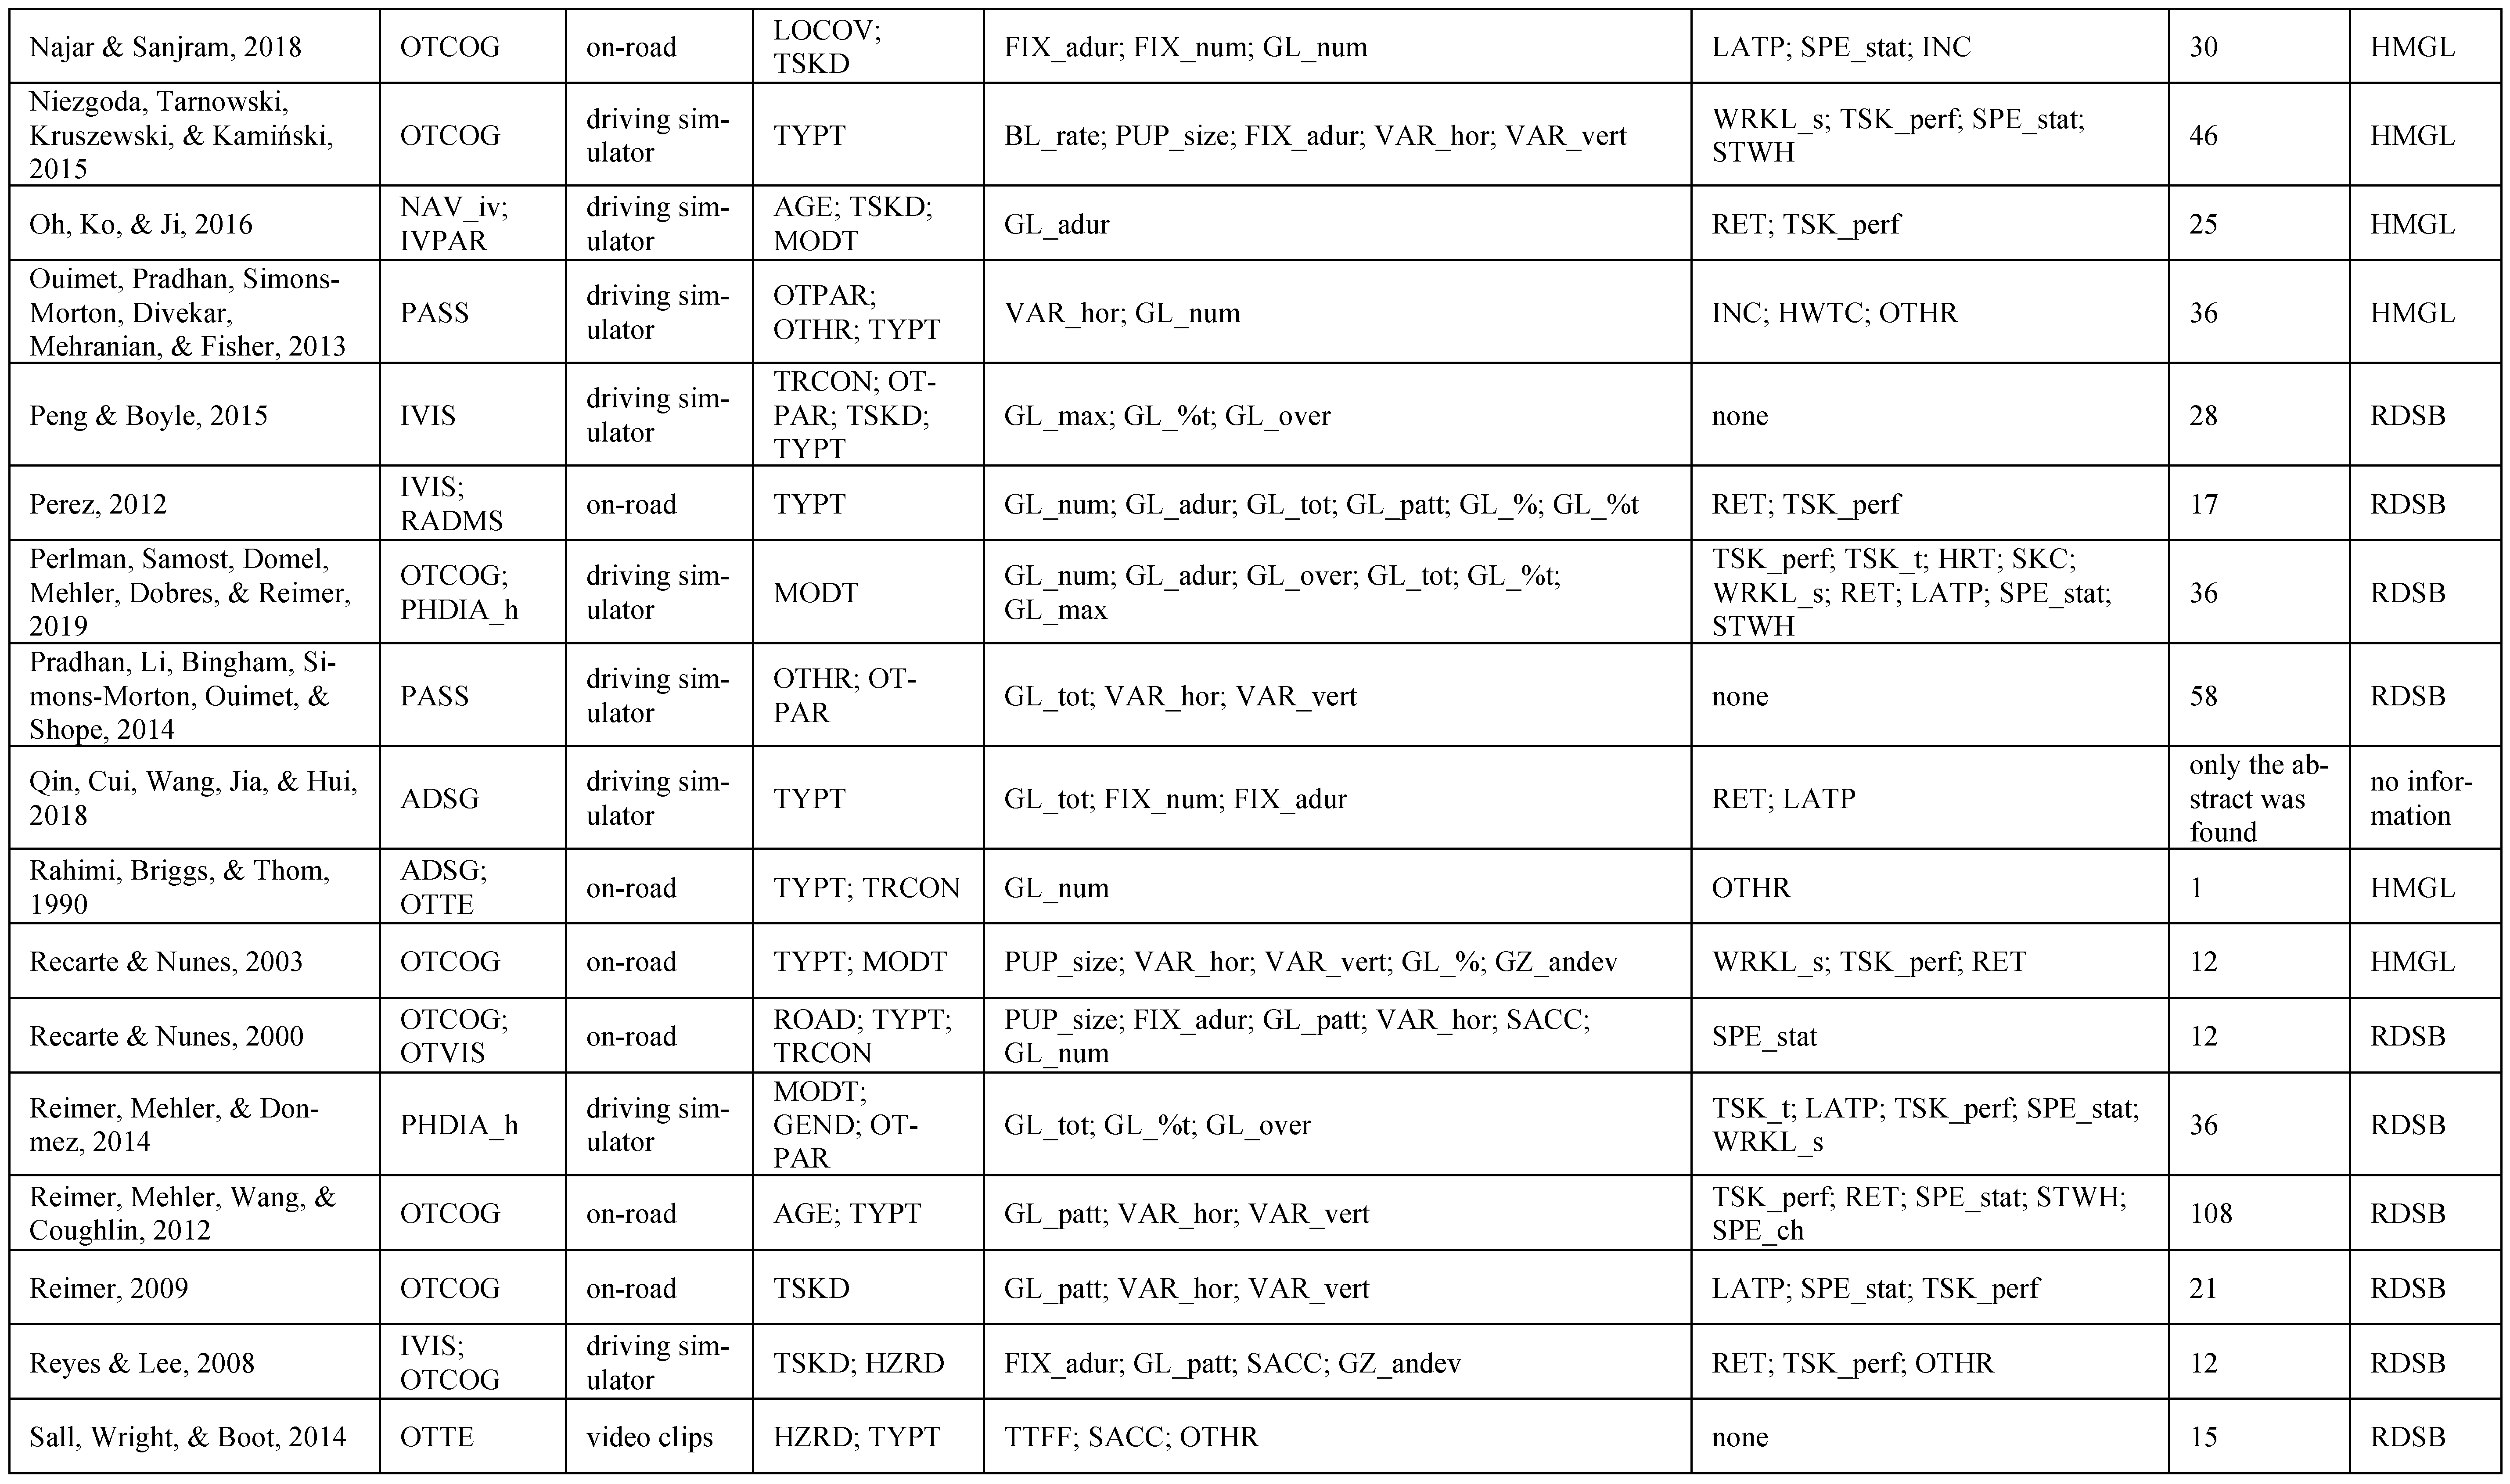
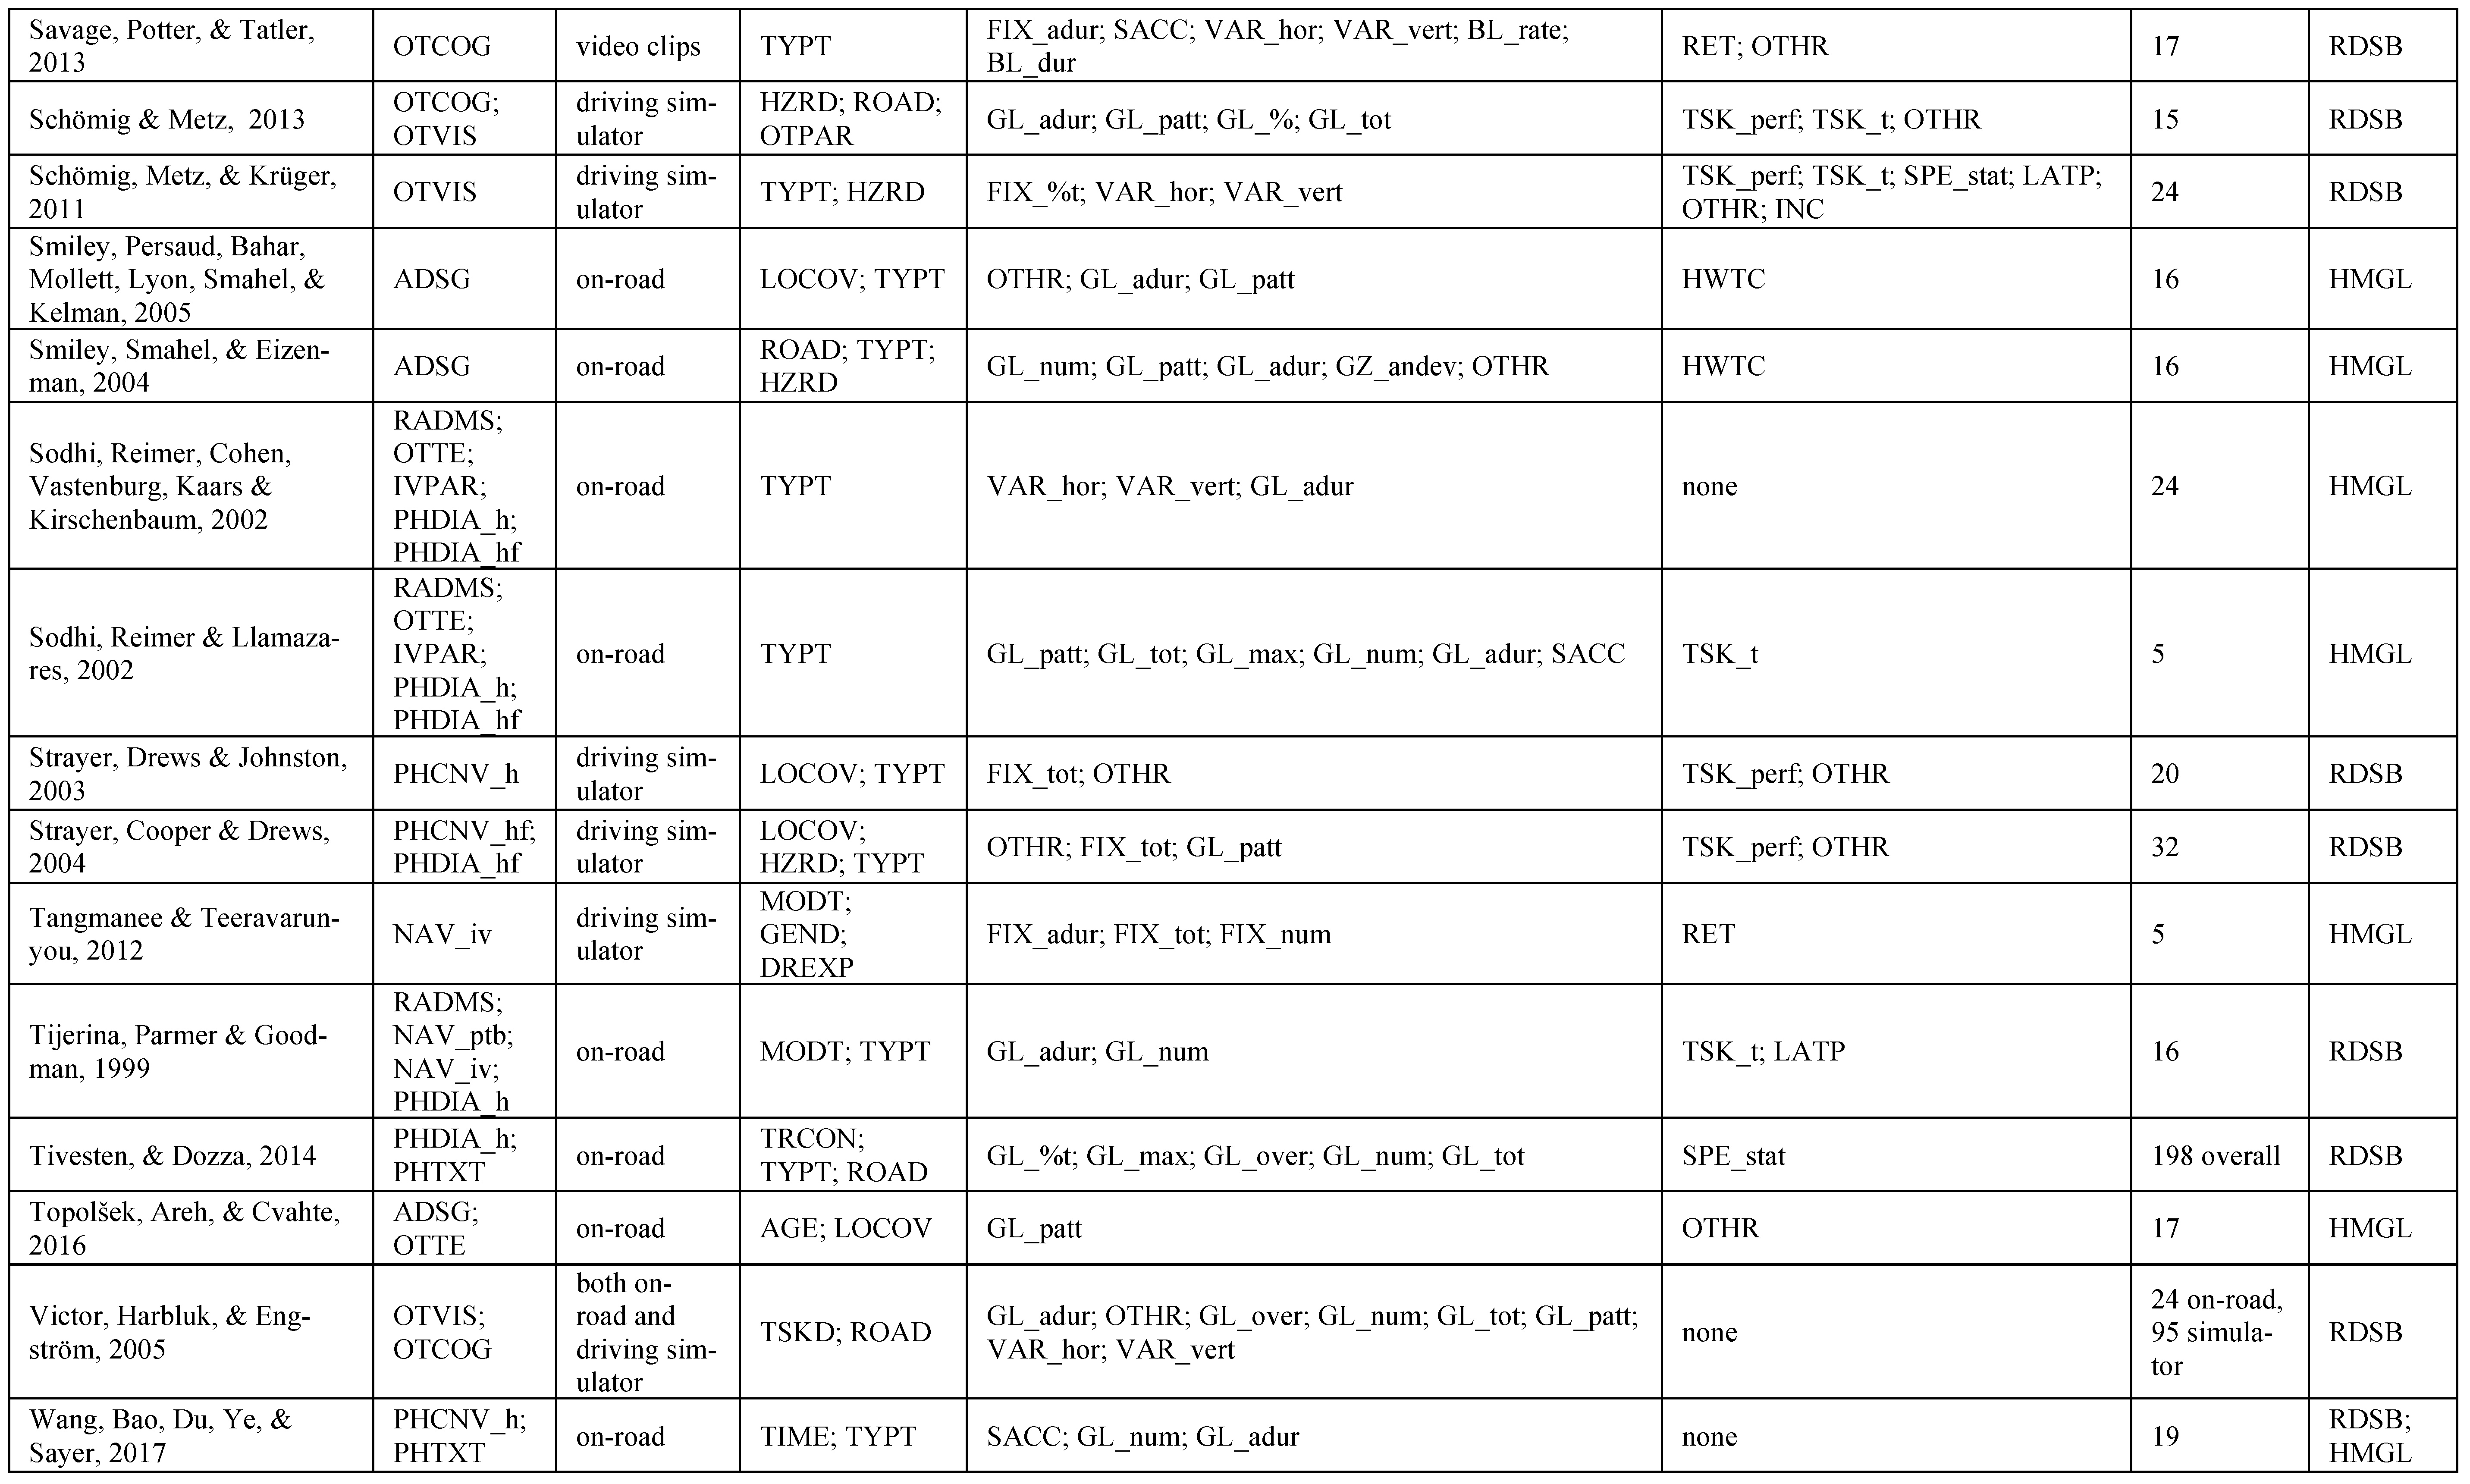
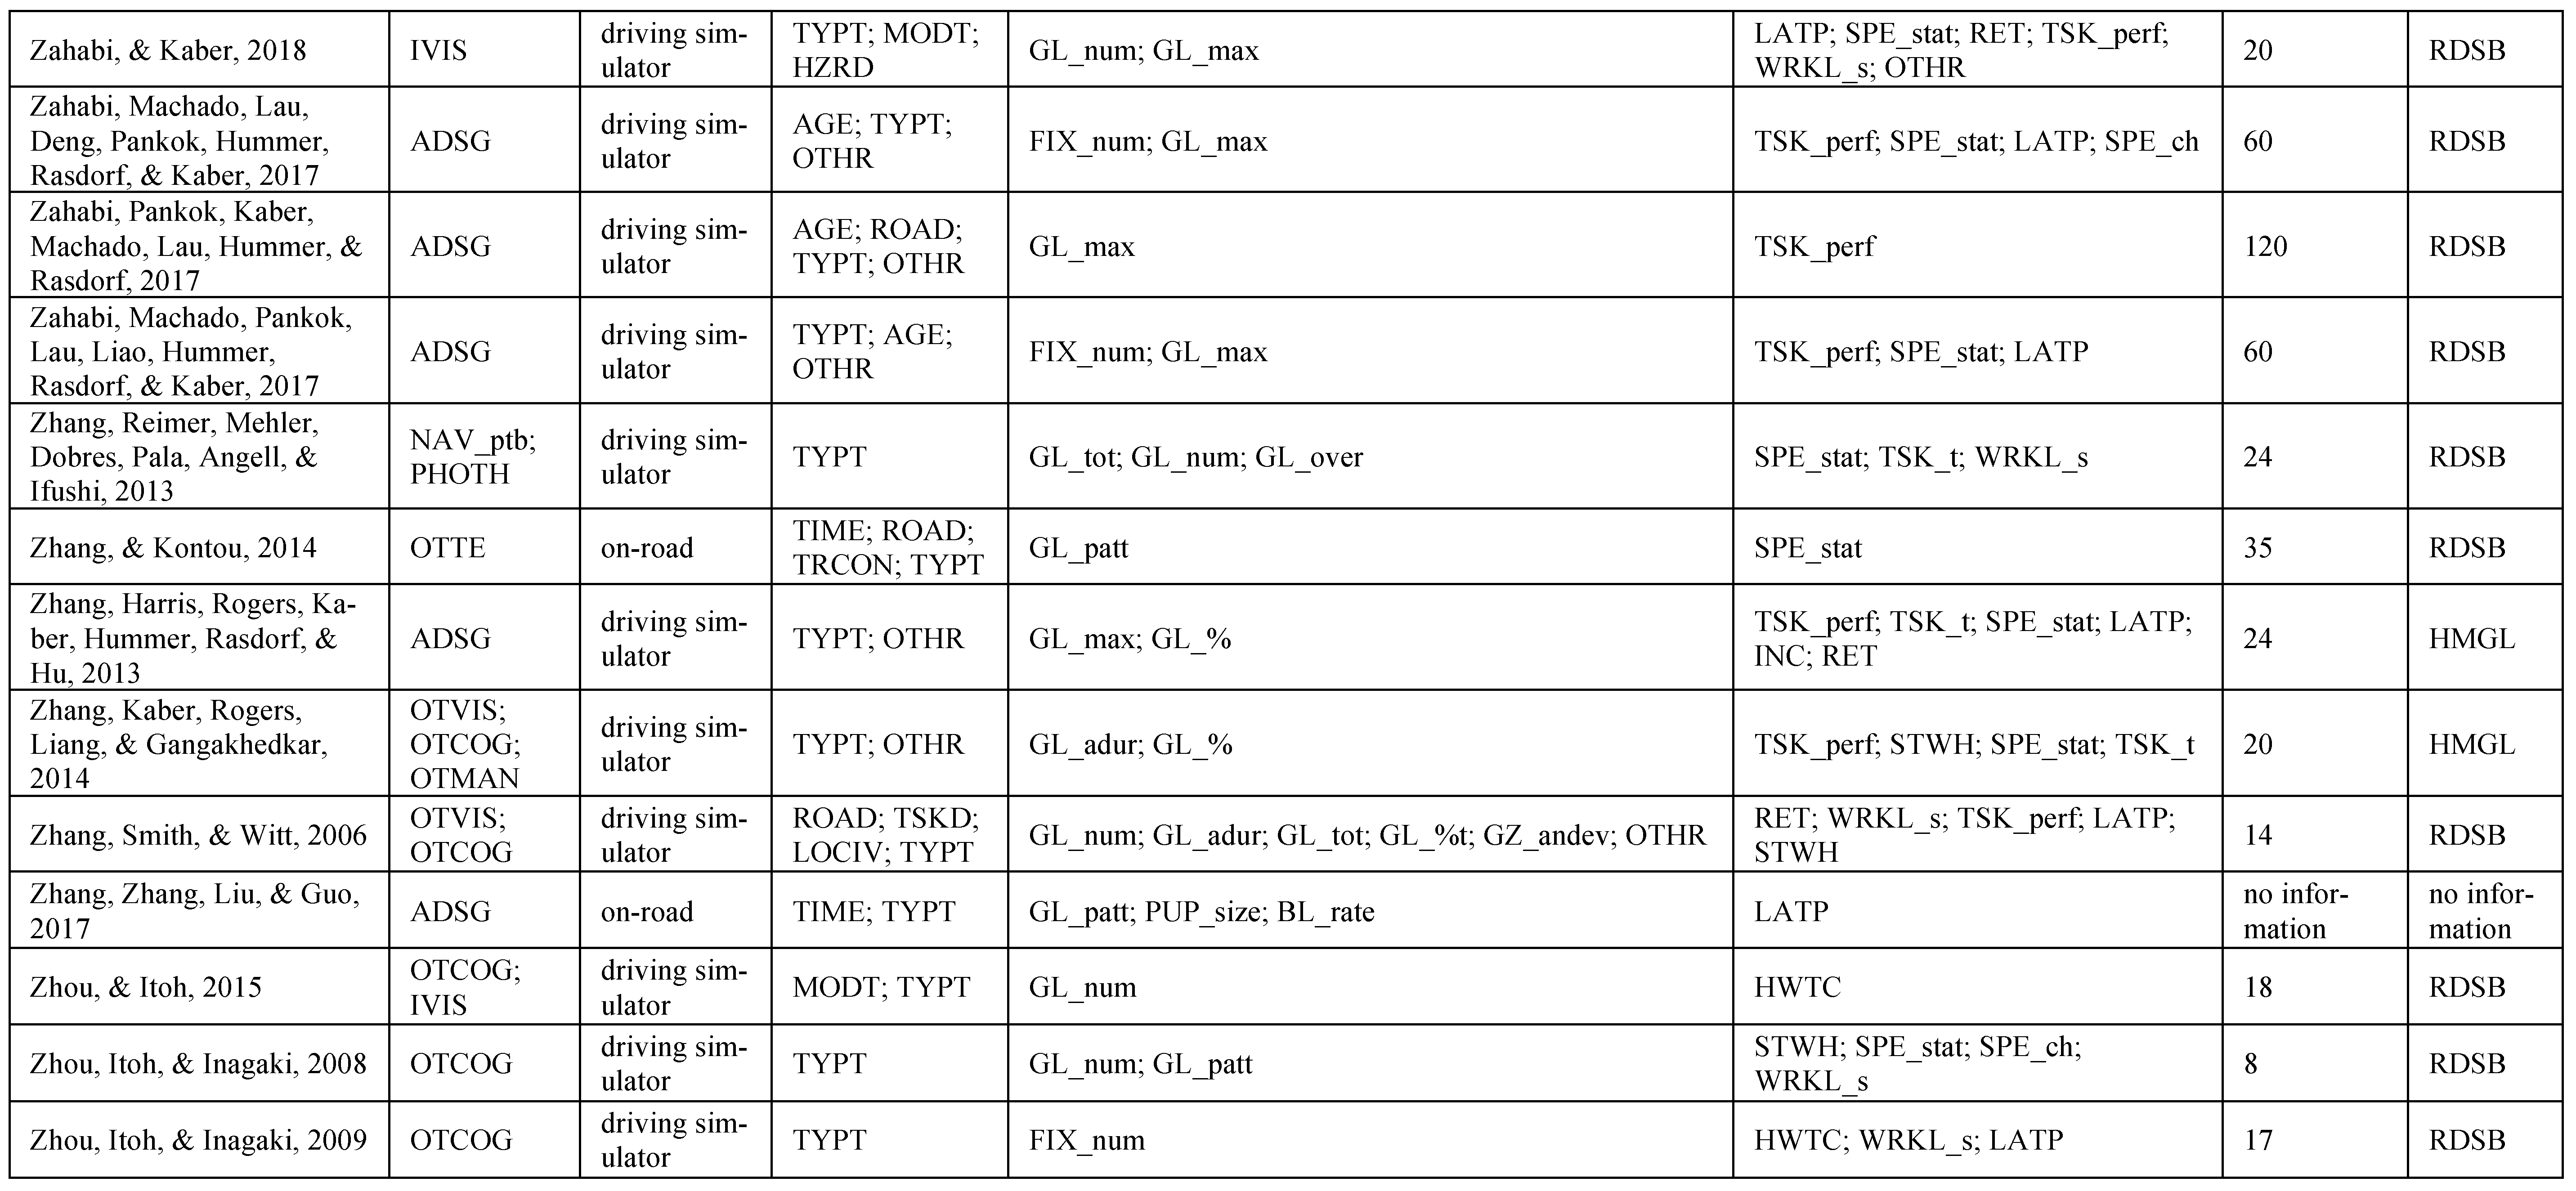
Appendix A: In-depth analysis of papers in the literature pool

References
- Ahlstrom, C., and K. Kircher. 2017. Changes in glance behaviour when using a visual eco-driving system—A field study. Applied Ergonomics 58: 414–423. [Google Scholar] [CrossRef] [PubMed]
- Antin, J. F., T. A. Dingus, M. C. Hulse, and W. W. Wierwille. 1990. An evaluation of the effectiveness and efficiency of an automobile moving-map navigational display. International Journal of Man-Machine Studies 33, 5: 581–594. [Google Scholar] [CrossRef]
- Aust, M.L., S. Dombrovskis, J. Kovaceva, B. Svanberg, and J. Ivarsson. 2013. An Empirically Based Suggestion for Reformulating the Glance Duration Criteria in NHTSA's Visual-Manual Interaction Guidelines. SAE International Journal of Passenger Cars Electronic and Electrical Systems 6, 2: 444–453. [Google Scholar] [CrossRef]
- Beckers, N., S. Schreiner, P. Bertrand, B. Mehler, and B. Reimer. 2017. Comparing the demands of destination entry using Google Glass and the Samsung Galaxy S4 during simulated driving. Applied Ergonomics 58: 25–34. [Google Scholar] [CrossRef]
- Beijer, D., A. Smiley, and M. Eizenman. 2004. Observed driver glance behavior at roadside advertising signs. Transportation Research Record 1899, 1: 96–103. [Google Scholar] [CrossRef]
- Belyusar, D., B. Reimer, B. Mehler, and J. F. Coughlin. 2016. A field study on the effects of digital billboards on glance behavior during highway driving. Accident Analysis and Prevention 88: 88–96. [Google Scholar] [CrossRef]
- Benedetto, S., M. Pedrotti, L. Minin, T. Baccino, A. Re, and R. Montanari. 2011. Driver workload and eye blink duration. Transportation Research Part F: Traffic Psychology and Behaviour 14, 3: 199–208. [Google Scholar] [CrossRef]
- Birrell, S.A., and M. Fowkes. 2014. Glance behaviours when using an in-vehicle smart driving aid: A realworld, on-road driving study. Transportation Research Part F: Traffic Psychology and Behaviour 22: 113–125. [Google Scholar] [CrossRef]
- Blanco, M., J.M. Hankey, and J.A. Chestnut. 2005. A taxonomy for secondary in-vehicle tasks based on eye glance and task completion time. Proceedings of the Human Factors and Ergonomics Society Annual Meeting 49, 22: 1975–1979. [Google Scholar] [CrossRef]
- Borowsky, A., W.J. Horrey, Y. Liang, A. Garabet, L. Simmons, and D.L. Fisher. 2016. The effects of brief visual interruption tasks on drivers' ability to resume their visual search for a pre-cued hazard. Accident Analysis and Prevention 93: 207–216. [Google Scholar] [CrossRef]
- Borowsky, A., W. J. Horrey, Y. Liang, A. Garabet, L. Simmons, and D.L. Fisher. 2015. The Effects of Momentary Visual Disruption on Hazard Anticipation and Awareness in Driving. Traffic Injury Prevention 16, 2: 133–139. [Google Scholar] [CrossRef] [PubMed]
- Borowsky, A., W. J. Horrey, Y. Liang, L. Simmons, A. Garabet, and D. L. Fisher. 2014. Memory for a hazard is interrupted by performance of a secondary invehicle task. Proceedings of the Human Factors and Ergonomics Society Annual Meeting 58, 1: 2219–2223. [Google Scholar] [CrossRef]
- Briggs, G.F., G.J. Hole, and M.F. Land. 2016. Imageryinducing distraction leads to cognitive tunnelling and deteriorated driving performance. Transportation Research Part F: Traffic Psychology and Behaviour 38: 106–117. [Google Scholar] [CrossRef]
- Brookhuis, K.A., G. de Vries, and D. de Waard. 1991. The effects of mobile telephoning on driving performance. Accident Analysis and Prevention 23, 4: 309–316. [Google Scholar] [CrossRef]
- Chan, E., A. K. Pradhan, A. Pollatsek, M. A. Knodler, and D. L. Fisher. 2010. Are driving simulators effective tools for evaluating novice drivers' hazard anticipation, speed management, and attention maintenance skills? Transportation Research Part F: Traffic Psychology and Behaviour 13, 5: 343–353. [Google Scholar] [CrossRef]
- Chiang, D.P., A.M. Brooks, and D.H. Weir. 2004. On the highway measures of driver glance behavior with an example automobile navigation system. Applied Ergonomics 35, 3: 215–223. [Google Scholar] [CrossRef]
- Chisholm, S. L., J. K. Caird, and J. Lockhart. 2008. The effects of practice with MP3 players on driving performance. Accident Analysis and Prevention 40, 2: 704–713. [Google Scholar] [CrossRef]
- Chisholm, S.L., J. K. Caird, J. A. Lockhart, L. E. Teteris, and A. Smiley. 2006. Novice and experienced driving performance with cell phones. Proceedings of the Human Factors and Ergonomics Society 50, 22: 2354–2358. [Google Scholar] [CrossRef]
- Cobo, J.M., G.A. Lopez-Herrera, E. Herrera-Viedma, and F. Herrera. 2011. Science Mapping Software Tools: Review, Analysis, and Cooperative Study Among Tools. Journal of the American Society for Information Science and Technology 62, 7: 1382. [Google Scholar] [CrossRef]
- Colon, N. P., M. A. Rupp, and M. Mouloua. 2013. Temporary barriers to reduce the effects of rubbernecking. Proceedings of the Human Factors and Ergonomics Society; pp. 1810–1814. [Google Scholar] [CrossRef]
- Costa, M., L. Bonetti, V. Vignali, A. Bichicchi, C. Lantieri, and A. Simone. 2019. Driver’s visual attention to different categories of roadside advertising signs. Applied Ergonomics 78: 127–136. [Google Scholar] [CrossRef]
- Crundall, D. E., and G. Underwood. 1998. Effects of experience and processing demands on visual information acquisition in drivers. Ergonomics 41, 4: 448–458. [Google Scholar] [CrossRef]
- Crundall, D., and G. Underwood. 2011. Visual attention while driving: measures of eye movements used in driving research. In Handbook of traffic psychology. Academic Press: pp. 137–148. [Google Scholar] [CrossRef]
- Crundall, D., C. Shenton, and G. Underwood. 2004. Eye movements during intentional car following. Perception 33, 8: 975–986. [Google Scholar] [CrossRef] [PubMed]
- Crundall, D., E. Van Loon, and G. Underwood. 2006. Attraction and distraction of attention with roadside advertisements. Accident Analysis and Prevention 38, 4: 671–677. [Google Scholar] [CrossRef]
- Desmet, C., and K. Diependaele. 2019. An eye-tracking study on the road examining the effects of handsfree phoning on visual attention. Transportation Research Part F: Traffic Psychology and Behaviour 60: 549–559. [Google Scholar] [CrossRef]
- Dingus, T.A., F. Guo, S. Lee, J.F. Antin, M. Perez, M. Buchanan-King, and J. Hankey. 2016. Driver crash risk factors and prevalence evaluation using naturalistic driving data. Proceedings of the National Academy of Sciences of the United States of America 113, 10: 2636–2641. [Google Scholar] [CrossRef] [PubMed]
- Dingus, T. A., M. C. Hulse, J. F. Antin, and W. W. Wierwille. 1989. Attentional demand requirements of an automobile moving-map navigation system. Transportation Research Part A: General 23, 4: 301–315. [Google Scholar] [CrossRef]
- Dingus, T. A., M. C. Hulse, M. A. Mollenhauer, R. N. Fleischman, D. V. Mcgehee, and N. Manakkal. 1997. Effects of age, system experience, and navigation technique on driving with an advanced traveler information system. Human Factors 39, 2: 177–199. [Google Scholar] [CrossRef] [PubMed]
- Divekar, G., A. K. Pradhan, A. Pollatsek, and D. L. Fisher. 2012. Effect of External Distractions. Behavior and Vehicle Control of Novice and Experienced Drivers Evaluated. Transportation Research Record 2321: 15–22. [Google Scholar] [CrossRef]
- Dong, C. H., R. G. Ma, D. Zhang, W. T. Zhang, and F. F. Wang. 2019. Research on the Influence of Smartphone Navigation on Driving Behavior Based on Real Vehicle Driving. Mobile Information Systems. [Google Scholar] [CrossRef]
- Donmez, B., L. N. Boyle, and J. D. Lee. 2007. Safety implications of providing real-time feedback to distracted drivers. Accident Analysis and Prevention 39, 3: 581–590. [Google Scholar] [CrossRef]
- Dukic, T., C. Ahlstrom, C. Patten, C. Kettwich, and K. Kircher. 2013. Effects of Electronic Billboards on Driver Distraction. Traffic Injury Prevention 14, 5: 469–476. [Google Scholar] [CrossRef]
- Dukic, T., L. Hanson, K. Holmqvist, and C. Wartenberg. 2005. Effect of button location on driver's visual behaviour and safety perception. Ergonomics 48, 4: 399–410. [Google Scholar] [CrossRef] [PubMed]
- Ebadi, Y., D.L. Fisher, and S.C. Roberts. 2019. Impact of Cognitive Distractions on Drivers’ Hazard Anticipation Behavior in Complex Scenarios. Transportation Research Record. [Google Scholar] [CrossRef]
- Edquist, J., T. Horberry, S. Hosking, and I. Johnston. 2011. Effects of advertising billboards during simulated driving. Applied Ergonomics 42, 4: 619–626. [Google Scholar] [CrossRef] [PubMed]
- Engström, J., E. Johansson, and J. Östlund. 2005. Effects of visual and cognitive load in real and simulated motorway driving. Transportation Research Part F: Traffic Psychology and Behaviour 8, 2: 97–120. [Google Scholar] [CrossRef]
- Fort, A., R. Martin, A. Jacquet-Andrieu, C. Combe-Pangaud, G. Foliot, S. Daligault, and C. Delpuech. 2010. Attentional demand and processing of relevant visual information during simulated driving: A MEG study. Brain Research 1363: 117–127. [Google Scholar] [CrossRef]
- Gable, T. M., B. N. Walker, H. R. Moses, and R. D. Chitloor. 2013. Advanced auditory cues on mobile phones help keep drivers’ eyes on the road. Proceedings of the 5th International Conference on Automotive User Interfaces and Interactive Vehicular Applications, AutomotiveUI 2013, AutomotiveUI 2013; pp. 66–73. [Google Scholar] [CrossRef]
- Garay-Vega, L., A.K. Pradhan, G. Weinberg, B. SchmidtNielsen, B. Harsham, Y. Shen, G. Divekar, M. Romoser, M. Knodler, and D.L. Fisher. 2010. Evaluation of different speech and touch interfaces to in-vehicle music retrieval systems. Accident Analysis and Prevention 42, 3: 913–920. [Google Scholar] [CrossRef]
- Garrison, T.M., and C.C. Williams. 2013. Impact of Relevance and Distraction on Driving Performance and Visual Attention in a Simulated Driving Environment. Applied Cognitive Psychology 27, 3: 396–405. [Google Scholar] [CrossRef]
- Graf, C., and M. Krebs. 1976. Headlight factors and nighttime vision. (Final Report No. 76SRC13). Honeywell Inc., Systems and Research Center. [Google Scholar]
- Graydon, F.X., R. Young, M.D. Benton, R.J. Genik, S. Posse, L. Hsieh, and C. Green. 2004. Visual event detection during simulated driving: Identifying the neural correlates with functional neuroimaging. Transportation Research Part F: Traffic Psychology and Behaviour 7: 271–286. [Google Scholar] [CrossRef]
- Green, P. 2002. Where Do Drivers Look While Driving (and for How Long)? In P. L. Olson. In Human Factors in Traffic Safety. Edited by E. Dewar R. Lawyers & Judges Publishing Company: pp. 77–110. [Google Scholar]
- Hallihan, G. M., A. K. Mayer, J. K. Caird, and S. L. Milloy. 2011. Effects of hybrid interface on ecodriving and driver distraction. Transportation Research Record (2248): 74–80. [Google Scholar] [CrossRef]
- Harbluk, J.L., Y.I. Noy, P.L. Trbovich, and M. Eizenman. 2007. An on-road assessment of cognitive distraction: Impacts on drivers' visual behavior and braking performance. Accident Analysis and Prevention 39, 2: 372–379. [Google Scholar] [CrossRef]
- Hashash, M., M. Abou Zeid, and N. M. Moacdieh. 2019. Social media browsing while driving: Effects on driver performance and attention allocation. Transportation Research Part F: Traffic Psychology and Behaviour 63: 67–82. [Google Scholar] [CrossRef]
- He, J., E. Becic, Y. C. Lee, and J. S. McCarley. 2011. Mind wandering behind the wheel: Performance and oculomotor correlates. Human Factors 53, 1: 13–21. [Google Scholar] [CrossRef] [PubMed]
- Herbert, N., N. Thyer, S. Isherwood, and N. Merat. 2016. The effect of a simulated hearing loss on performance of an auditory memory task in driving. Transportation Research Part F: Traffic Psychology and Behaviour 43: 122–130. [Google Scholar] [CrossRef]
- Horrey, W.J., M. F. Lesch, A. Garabet, L. Simmons, and R. Maikala. 2017. Distraction and task engagement: How interesting and boring information impact driving performance and subjective and physiological responses. Applied Ergonomics 58: 342–348. [Google Scholar] [CrossRef] [PubMed]
- Horrey, W. J., C. D. Wickens, and K. P. Consalus. 2006. Modeling drivers’ visual attention allocation while interacting with in-vehicle technologies. Journal of Experimental Psychology: Applied 12, 2: 67–78. [Google Scholar] [CrossRef]
- Hudák, M., and R. Madleňák. 2017. The Research of Driver Distraction by Visual Smog on Selected Road Stretch in Slovakia. Procedia Engineering 178: 472–479. [Google Scholar] [CrossRef]
- International Organization for Standardization. 2014. ISO 15007-1:2014(en) Road vehicles—Measurement of driver visual behaviour with respect to transport information and control systems—Part 1: Definitions and parameters. International Organization for Standardization. [Google Scholar]
- Jeong, C., B. Kim, S. Yu, D. Suh, M. Kim, and M. Suh. 2013. In-vehicle display HMI safety evaluation using a driving simulator. International Journal of Automotive Technology 14, 6: 987–992. [Google Scholar] [CrossRef]
- Jeong, H., and Y. Liu. 2019. Effects of non-driving-related-task modality and road geometry on eye movements, lane-keeping performance, and workload while driving. Transportation Research Part F: Traffic Psychology and Behaviour 60: 157–171. [Google Scholar] [CrossRef]
- Jin, L., H. Xian, Y. Jiang, Q. Niu, M. Xu, and D. Yang. 2014. Research on evaluation model for secondary task driving safety based on driver eye movements. Advances in Mechanical Engineering 2014. [Google Scholar] [CrossRef]
- Jin, L., H. Xian, Q. Niu, and J. Bie. 2015. Research on safety evaluation model for in-vehicle secondary task driving. Accident Analysis and Prevention 81: 243–250. [Google Scholar] [CrossRef] [PubMed]
- Jones, M.P., P. Chapman, and K. Bailey. 2014. The influence of image valence on visual attention and perception of risk in drivers. Accident Analysis and Prevention 73: 296–304. [Google Scholar] [CrossRef]
- Kaber, D., C. Pankok, B. Corbett, W. Ma, J. Hummer, and W. Rasdorf. 2015. Driver behavior in use of guide and logo signs under distraction and complex roadway conditions. Applied Ergonomics 47: 99–106. [Google Scholar] [CrossRef] [PubMed]
- Kaber, D.B., Y. Liang, Y. Zhang, M.L. Rogers, and S. Gangakhedkar. 2012. Driver performance effects of simultaneous visual and cognitive distraction and adaptation behaviour. Transportation Research Part F: Traffic Psychology and Behaviour 15, 5: 491–501. [Google Scholar] [CrossRef]
- Kettwich, C., K. Klinger, and U. Lemmer. 2008. Do advertisements at the roadside distract the driver? Proceedings of SPIE The International Society for Optical Engineering; p. 7003. [Google Scholar] [CrossRef]
- Kim, S.L., and J.H. Yang. 2019. Evaluation of the Effects of Driver Distraction Part 1: Based on Simulator Experiments. Proceedings 2018 IEEE International Conference on Systems, Man, and Cybernetics, SMC 2018; pp. 1081–1086. [Google Scholar] [CrossRef]
- King, B. G., and P.J. Sutro. 1957. Dynamic Visual Fields. Highway Research Board Bulletin 152: 3–14. [Google Scholar]
- Knapper, A. S., M. P. Hagenzieker, and K. A. Brookhuis. 2015. Do in-car devices affect experienced users' driving performance? IATSS Research 39, 1: 72–78. [Google Scholar] [CrossRef]
- Kosaka, H., H. Koyama, and H. Nishitani. 2005. Analysis of driver's behavior from heart rate and eye movement when he/she causes an accident between cars at an intersection. SAE Technical Papers. [Google Scholar] [CrossRef]
- Kountouriotis, G. K., P. Spyridakos, O. M. J. Carsten, and N. Merat. 2016. Identifying cognitive distraction using steering wheel reversal rates. Accident Analysis and Prevention 96: 39–45. [Google Scholar] [CrossRef]
- Krause, M., C. Angerer, and K. Bengler. 2015. Evaluation of a Radio Tuning Task on Android while Driving. Procedia Manufacturing 3: 2642–2649. [Google Scholar] [CrossRef]
- Kujala, T., J. Silvennoinen, and A. Lasch. 2013. Visualmanual in-car tasks decomposed Text entry and kinetic scrolling as the main sources of visual distraction. Proceedings of the 5th International Conference on Automotive User Interfaces and Interactive Vehicular Applications, AutomotiveUI 2013; pp. 82–89. [Google Scholar] [CrossRef]
- Kun, A. L., O. Palinko, Z. Medenica, and P. A. Heeman. 2013. On the feasibility of using pupil diameter to estimate cognitive load changes for in-vehicle spoken dialogues. Proceedings of the Annual Conference of the International Speech Communication Association, INTERSPEECH; pp. 3766–3770. [Google Scholar]
- Lamble, D., T. Kauranen, M. Laakso, and H. Summala. 1999. Cognitive load and detection thresholds in car following situations: Safety implications for using mobile (cellular) telephones while driving. Accident Analysis and Prevention 31, 6: 617–623. [Google Scholar] [CrossRef]
- Lauer, A. R., and C. J. McMonagle. 1955. Do Road Signs Affect Accidents. Traffic Quarterly 6: 322–324. [Google Scholar]
- Lee, J. D., S. C. Roberts, J. D. Hoffman, and L. S. Angell. 2012. Scrolling and driving: How an MP3 player and its aftermarket controller affect driving performance and visual behaviour. Human Factors 54, 2: 250–263. [Google Scholar] [CrossRef] [PubMed]
- Lee, J. D., K. L. Young, and M. A. Regan. 2008. Defining Driver Distraction. In Driver Distraction: Theory, Effects, and Mitigation. Edited by M.A. Regan, J.D. Lee and K. Young. CRC Press: pp. 31–40. [Google Scholar]
- Lee, S. H., S. O. Yoon, and J. H. Shin. 2015. On-wheel finger gesture control for invehicle systems on central consoles. Adjunct Proceedings of the 7th International Conference on Automotive User Interfaces and Interactive Vehicular Applications, AutomotiveUI 2015; pp. 94–99. [Google Scholar] [CrossRef]
- Lee, S. S. Y., A. A. Black, P. Lacherez, and J. M. Wood. 2016. Eye movements and road hazard detection: Effects of blur and distractors. Optometry and Vision Science 93, 9: 1137–1146. [Google Scholar] [CrossRef]
- Lehtonen, E., O. Lappi, and H. Summala. 2012. Anticipatory eye movements when approaching a curve on a rural road depend on working memory load. Transportation Research Part F: Traffic Psychology and Behaviour 15, 3: 369–377. [Google Scholar] [CrossRef]
- Lehtonen, E., O. Lappi, N. Koskiahde, T. Mansikka, J. Hietamäki, and H. Summala. 2018. Gaze doesn’t always lead steering. Accident Analysis and Prevention 121: 268–278. [Google Scholar] [CrossRef]
- Lemercier, C., C. Pêcher, G. Berthié, B. Valéry, V. Vidal, P.-V. Paubel, M. Cour, A. Fort, C. Galéra, C. Gabaude, E. Lagarde, and B. Maury. 2014. Inattention behind the wheel: How factual internal thoughts impact attentional control while driving. Safety Science 62: 279–285. [Google Scholar] [CrossRef]
- Li, G., F. Zhu, T. Zhang, Y. Wang, S. He, and X. Qu. 2018. Evaluation of Three In-Vehicle Interactions from Drivers' Driving Performance and Eye Movement behaviour. IEEE Conference on Intelligent Transportation Systems, Proceedings, ITSC, 2018 November; pp. 2086–2091. [Google Scholar] [CrossRef]
- Li, P., G. Markkula, Y. Li, and N. Merat. 2018. Is improved lane keeping during cognitive load caused by increased physical arousal or gaze concentration toward the road center? Accident Analysis and Prevention 117: 65–74. [Google Scholar] [CrossRef]
- Li, P., N. Merat, Z. Zheng, G. Markkula, Y. Li, and Y. Wang. 2018. Does cognitive distraction improve or degrade lane keeping performance? Analysis of time-to-line crossing safety margins. Transportation Research Part F: Traffic Psychology and Behaviour 57: 48–58. [Google Scholar] [CrossRef]
- Li, X., A. Vaezipour, A. Rakotonirainy, and S. Demmel. 2019. Effects of an in-vehicle eco-safe driving system on drivers’ glance behaviour. Accident Analysis and Prevention 122, 143–152. [Google Scholar] [CrossRef]
- Liang, Y., and J. D. Lee. 2010. Combining cognitive and visual distraction: Less than the sum of its parts. Accident Analysis and Prevention 42, 3: 881–890. [Google Scholar] [CrossRef]
- Libby, D., A. Chaparro, and J. He. 2013. Distracted while driving: A comparison of the effects of texting and talking on a cell phone. Proceedings of the Human Factors and Ergonomics Society 57, 1: 1874–1878. [Google Scholar] [CrossRef]
- Ma, J., M. Xu, and Y. Du. 2016. A Usability Study on InVehicle Gesture Control. SAE Technical Papers. [Google Scholar] [CrossRef]
- Mackun, T., and J. Zukowska. 2018. Analysis of the relationship between the length of eye fixation and the parameters of advertisements visible from the road. MATEC Web of Conferences 231. [Google Scholar] [CrossRef]
- Madleňák, R., and M. Hudák. 2016. Analysis of Roadside advertisements on selected Road stretch in Žilina. Transport Means Proceedings of the International Conference, October; pp. 618–621. [Google Scholar]
- McGough, B., and W. Ma. 2015. Assessment of in-vehicle cellphone locations in influencing driving performance and distraction. Proceedings of the Human Factors and Ergonomics Society, January; pp. 1588–1592. [Google Scholar] [CrossRef]
- McMonagle, C.J. 1952. The Effect of Roadside Features on Traffic Accidents. Traffic Quarterly 6: 237. [Google Scholar]
- Metz, B., N. Schömig, and H. P. Krüger. 2011. Attention during visual secondary tasks in driving: Adaptation to the demands of the driving task. Transportation Research Part F: Traffic Psychology and Behaviour 14, 5: 369–380. [Google Scholar] [CrossRef]
- Mongeon, P., and A. Paul-Hus. 2016. The journal coverage of Web of Science and Scopus: A comparative analysis. Scientometrics 106, 1: 213–228. [Google Scholar] [CrossRef]
- Mourant, R. R., and T. H. Rockwell. 1970. Mapping EyeMovement Patterns to the Visual Scene in Driving: An Exploratory Study. Human Factors: The Journal of the Human Factors and Ergonomics Society 12, 1: 81–87. [Google Scholar] [CrossRef] [PubMed]
- Mourant, R. R., and T. H. Rockwell. 1972. Strategies of visual search by novice and experienced drivers. Human Factors: The Journal of the Human Factors and Ergonomics Society 14, 4: 325–335. [Google Scholar] [CrossRef]
- Nabatilan, L. B., F. Aghazadeh, A. D. Nimbarte, C. C. Harvey, and S. K. Chowdhury. 2012. Effect of driving experience on visual behavior and driving performance under different driving conditions. Cognition, Technology and Work 14, 4: 355–363. [Google Scholar] [CrossRef]
- Najar, S.A., and P.K. Sanjram. 2018. Gaze behavior and human error in distracted driving: Unlocking the complexity of articulatory rehearsal mechanism. Transportation Research Part F: Traffic Psychology and Behaviour 59: 12–23. [Google Scholar] [CrossRef]
- Niezgoda, M., A. Tarnowski, M. Kruszewski, and T. Kamiński. 2015. Towards testing auditory-vocal interfaces and detecting distraction while driving: A comparison of eye-movement measures in the assessment of cognitive workload. Transportation Research Part F: Traffic Psychology and Behaviour 32: 23–34. [Google Scholar] [CrossRef]
- Oh, H.J., S.M. Ko, and Y.G. Ji. 2016. Effects of Superimposition of a Head-Up Display on Driving Performance and Glance Behavior in the Elderly. International Journal of Human-Computer Interaction 32, 2: 143–154. [Google Scholar] [CrossRef]
- Ouimet, M.C., A.K. Pradhan, B.G. Simons-Morton, G. Divekar, H. Mehranian, and D.L. Fisher. 2013. The effect of male teenage passengers on male teenage drivers: Findings from a driving simulator study. Accident Analysis and Prevention 58: 132–139. [Google Scholar] [CrossRef]
- Peng, Y., and L. N. Boyle. 2015. Driver’s adaptive glance behavior to in-vehicle information systems. Accident Analysis and Prevention 85: 93–101. [Google Scholar] [CrossRef] [PubMed]
- Perez, M.A. 2012. Safety implications of infotainment system use in naturalistic driving. Work 41 Suppl. 1: 4200–4204. [Google Scholar] [CrossRef]
- Perlman, D., A. Samost, A.G. Domel, B. Mehler, J. Dobres, and B. Reimer. 2019. The relative impact of smartwatch and smartphone use while driving on workload, attention, and driving performance. Applied Ergonomics 75: 8–16. [Google Scholar] [CrossRef] [PubMed]
- Pradhan, A.K., K. Li, C.R. Bingham, B.G. Simons-Morton, M.C. Ouimet, and J.T. Shope. 2014. Peer passenger influences on male adolescent drivers' visual scanning behavior during simulated driving. Journal of Adolescent Health 54, 5: 42–49. [Google Scholar] [CrossRef]
- Qin, Y., C. Cui, Y. Wang, X. Jia, and Y. Hui. 2018. The influence of road advertisement on driving behavior characteristics under the condition of risk driving. Wuhan Ligong Daxue Xuebao (Jiaotong Kexue Yu Gongcheng Ban)/Journal of Wuhan University of Technology (Transportation Science and Engineering) 42, 6: 925–936. [Google Scholar] [CrossRef]
- Rahimi, M., R.P. Briggs, and D.R. Thom. 1990. A field evaluation of driver eye and head movement strategies toward environmental targets and distractors. Applied Ergonomics 21, 4: 267–274. [Google Scholar] [CrossRef]
- Recarte, M. A., and L. M. Nunes. 2000. Effects of verbal and spatial-imagery tasks on eye fixations while driving. Journal of Experimental Psychology: Applied 6, 1: 31–43. [Google Scholar] [CrossRef] [PubMed]
- Recarte, M. A., and L. M. Nunes. 2003. Mental Workload While Driving: Effects on Visual Search, Discrimination, and Decision Making. Journal of Experimental Psychology: Applied 9, 2: 119–137. [Google Scholar] [CrossRef]
- Reimer, B. 2009. Impact of cognitive task complexity on drivers' visual tunnelling. Transportation Research Record 2138: 13–19. [Google Scholar] [CrossRef]
- Reimer, B., B. Mehler, and B. Donmez. 2014. A study of young adults examining phone dialing while driving using a touchscreen vs. a button style flip-phone. Transportation Research Part F: Traffic Psychology and Behaviour 23: 57–68. [Google Scholar] [CrossRef]
- Reimer, B., B. Mehler, Y. Wang, and J.F. Coughlin. 2012. A field study on the impact of variations in short-term memory demands on drivers’ visual attention and driving performance across three age groups. Human Factors 54, 3: 454–468. [Google Scholar] [CrossRef] [PubMed]
- Reyes, M. L., and J. D. Lee. 2008. Effects of cognitive load presence and duration on driver eye movements and event detection performance. Transportation Research Part F: Traffic Psychology and Behaviour 11, 6: 391–402. [Google Scholar] [CrossRef]
- Rockwell, T. H. 1972. Eye Movement Analysis of Visual Information Acquisition in Driving: And Overview. In 6th Australian Road Research Board (ARRB) Conference. Australian Road Research Board (ARRB): Vol. 6, pp. 316–331. [Google Scholar]
- Rockwell, T.H., C. Overby, and R. R. Mourant. 1968. Drivers’ eye movements: an apparatus and calibration. Highway Research Record 247: 29–41. [Google Scholar]
- Rupp, M. A. 2012. Looking Back: Examining the Trends of Driver Distraction from 2007–2011. Proceedings of the Human Factors and Ergonomics Society Annual Meeting 56, 1: 2181–2185. [Google Scholar] [CrossRef]
- Rusch, W. A. 1951. Highway accidents in relation to roadside business and advertising. Highway Research Board Bulletin 30: 46–50. [Google Scholar]
- Sall, R. J., T. J. Wright, and W. R. Boot. 2014. Driven to distraction? The effect of simulated red light running camera flashes on attention and oculomotor control. Visual Cognition 22, 1: 57–73. [Google Scholar] [CrossRef]
- Savage, S. W., D. D. Potter, and B. W. Tatler. 2013. Does preoccupation impair hazard perception? A simultaneous EEG and Eye Tracking study. Transportation Research Part F: Traffic Psychology and Behaviour 17: 52–62. [Google Scholar] [CrossRef]
- Schömig, N., and B. Metz. 2013. Three levels of situation awareness in driving with secondary tasks. Safety Science 56: 44–51. [Google Scholar] [CrossRef]
- Schömig, N., B. Metz, and H. P. Krüger. 2011. Anticipatory and control processes in the interaction with secondary tasks while driving. Transportation Research Part F: Traffic Psychology and Behaviour 14, 6: 525–538. [Google Scholar] [CrossRef]
- Singh, S. 2015. Critical Reasons for Crashes Investigated in the National Motor Vehicle Crash Causation Survey. Traffic Safety Facts Crash•Stats. [Google Scholar]
- Sivak, M. 1996. The information that drivers use: is it indeed 90% visual? Perception 25: 1081–1089. [Google Scholar] [CrossRef] [PubMed]
- Smiley, A., B. Persaud, G. Bahar, C. Mollett, C. Lyon, T. Smahel, and L. W. Kelman. 2005. Traffic safety evaluation of video advertising signs. Transportation Research Record 1937, 1: 105–112. [Google Scholar] [CrossRef]
- Smiley, A., T. Smahel, and M. Eizenman. 2004. Impact of video advertising on driver fixation patterns. Transportation Research Record 1899, 1: 76–83. [Google Scholar] [CrossRef]
- Sodhi, M., B. Reimer, and I. Llamazares. 2002. Glance analysis of driver eye movements to evaluate distraction. Behavior Research Methods, Instruments, and Computers 34, 4: 529–538. [Google Scholar] [CrossRef] [PubMed]
- Sodhi, M., B. Reimer, J.L. Cohen, E. Vastenburg, R. Kaars, and S. Kirschenbaum. 2002. On-road driver eye movement tracking using head-mounted devices. In Eye Tracking Research and Applications Symposium (ETRA). pp. 61–68. [Google Scholar] [CrossRef]
- Staffeld, P. R. 1953. Accidents Related to Access Points and Advertising Signs in Study. Traffic Quarterly 7: 59–74. [Google Scholar]
- Strayer, D.L., F.A. Drews, and W.A. Johnston. 2003. Cell phone-induced failures of visual attention during simulated driving. Journal of Experimental Psychology: Applied 9, 1: 23–32. [Google Scholar] [CrossRef]
- Strayer, D.L., J.M. Cooper, and F.A. Drews. 2004. What do Drivers Fail to See When Conversing on a Cell Phone? Proceedings of the Human Factors and Ergonomics Society Annual Meeting 48, 19: 2213–2217. [Google Scholar] [CrossRef]
- Tangmanee, K., and S. Teeravarunyou. 2012. Effects of guided arrows on head-up display towards the vehicle windshield. 2012 Southeast Asian Network of Ergonomics Societies Conference: Ergonomics Innovations Leveraging User Experience and Sustainability, SEANES 2012. [Google Scholar] [CrossRef]
- Tijerina, L., E.B. Parmer, and M.J. Goodman. 1999. Individual Differences and in-Vehicle Distraction While Driving: A Test Track Study and Psychometric Evaluation. Proceedings of the Human Factors and Ergonomics Society Annual Meeting 43, 18: 982–986. [Google Scholar] [CrossRef]
- Tivesten, E., and M. Dozza. 2014. Driving context and visual-manual phone tasks influence glance behavior in naturalistic driving. Transportation Research Part F: Traffic Psychology and Behaviour 26(A): 258–272. [Google Scholar] [CrossRef]
- Topolšek, D., I. Areh, and T. Cvahte. 2016. Examination of driver detection of roadside traffic signs and advertisements using eye tracking. Transportation Research Part F: Traffic Psychology and Behaviour 43: 212–224. [Google Scholar] [CrossRef]
- van Eck, N.J., and L. Waltman. 2014. Visualizing Bibliometric Networks. In Measuring Scholarly Impact. Edited by Y. Ding, R. Rousseau and D. Wolfram. Springer: pp. 285–320. [Google Scholar] [CrossRef]
- van Raan, A.F. 2014. Advances in bibliometric analysis: research performance assessment and science mapping. In Bibliometrics: Use and Abuse in the Review of Research Performance. Edited by L. Blockmans, L. Engwall and D. Weaire. Portland Press: pp. 17–28. [Google Scholar]
- Victor, T.W., J.L. Harbluk, and J.A. Engström. 2005. Sensitivity of eye-movement measures to in-vehicle task difficulty. Transportation Research Part F: Traffic Psychology and Behaviour 8, 2: 167–190. [Google Scholar] [CrossRef]
- Wang, Y., S. Bao, W. Du, Z. Ye, and J. R. Sayer. 2017. Examining drivers' eye glance patterns during distracted driving: Insights from scanning randomness and glance transition matrix. Journal of Safety Research 63: 149–155. [Google Scholar] [CrossRef] [PubMed]
- Wang, Y., B. Mehler, B. Reimer, V. Lammers, L.A. D’Ambrosio, and J. F. Coughlin. 2010. The validity of driving simulation for assessing differences between in-vehicle informational interfaces: A comparison with field testing. Ergonomics 53, 3: 404–420. [Google Scholar] [CrossRef] [PubMed]
- White, C.B., and J.K. Caird. 2010. The blind date: The effects of change blindness, passenger conversation and gender on looked-but-failed-to-see (LBFTS) errors. Accident Analysis and Prevention 42, 6: 1822–1830. [Google Scholar] [CrossRef]
- Wikman, A. S., T. Nieminen, and H. Summala. 1998. Driving experience and time-sharing during in-car tasks on roads of different width. Ergonomics 41, 3: 358–372. [Google Scholar] [CrossRef]
- Wong, J. T., and S. H. Huang. 2013. Attention allocation patterns in naturalistic driving. Accident Analysis and Prevention 58: 140–147. [Google Scholar] [CrossRef]
- Wood, G., G. Hartley, P. A. Furley, and M. R. Wilson. 2016. Working Memory Capacity, Visual Attention and Hazard Perception in Driving. Journal of Applied Research in Memory and Cognition 5, 4: 454–462. [Google Scholar] [CrossRef]
- World Health Organization. 2018. Global Status Report on Road Safety 2018. World Health Organization. [Google Scholar]
- Wright, T. J., T. Vitale, W. R. Boot, and N. Charness. 2015. The impact of red light running camera flashes on younger and older drivers' attention and oculomotor control. Psychology and Aging 30, 4: 755–767. [Google Scholar] [CrossRef]
- Wu, L., S. Zhu, Q. Lu, and T. Zhu. 2016. Investigating the Impacts Caused by Manual Secondary Tasks on Drivers’ Visual Behavior. Proceedings of the 16th COTA International Conference of Transportation Professionals; pp. 152–161. [Google Scholar] [CrossRef]
- Xian, H., and L. Jin. 2015. The effects of using in-vehicle computer on driver eye movements and driving performance. Advances in Mechanical Engineering 7, 2. [Google Scholar] [CrossRef]
- Yamani, Y., W. J. Horrey, Y. Liang, and D.L. Fisher. 2015. Sequential in-vehicle glance distributions: An alternative approach for analyzing glance data. Human Factors 57, 4: 567–572. [Google Scholar] [CrossRef] [PubMed]
- Yang, Y., M. McDonald, and P. Zheng. 2012. Can drivers’ eye movements be used to monitor their performance? A case study. IET Intelligent Transport Systems 6, 4: 444–452. [Google Scholar] [CrossRef]
- Yang, Y., B. Reimer, B. Mehler, A. Wong, and M. McDonald. 2012. Exploring differences in the impact of auditory and visual demands on driver behavior. Proceedings of the 4th International Conference on Automotive User Interfaces and Interactive Vehicular Applications; ACM, pp. 173–177. [Google Scholar] [CrossRef]
- Yang, Y., A. Wong, and M. McDonald. 2015. Does gender make a difference to performing in-vehicle tasks? ET Intelligent Transport Systems 9, 4: 359–365. [Google Scholar] [CrossRef]
- Yoshizawa, A. I. 2017. Analysis of driver's visual attention using near-miss incidents. 2017 IEEE 16th International Conference on Cognitive Informatics & Cognitive Computing (ICCI* CC), July; IEEE, pp. 353–360. [Google Scholar] [CrossRef]
- Young, K.L., M.G. Lenné, P.M. Salmon, and N.A. Stanton. 2018. The impact of texting on driver behaviour at rail level crossings. Accident Analysis and Prevention 118: 269–276. [Google Scholar] [CrossRef] [PubMed]
- Young, K. L., E. Mitsopoulos-Rubens, C. M. Rudin-Brown, and M. G. Lenné. 2012. The effects of using a portable music player on simulated driving performance and task-sharing strategies. Applied Ergonomics 43, 4: 738–746. [Google Scholar] [CrossRef]
- Young, M. S., J. M. Mahfoud, N. A. Stanton, P. M. Salmon, D. P. Jenkins, and G. H. Walker. 2009. Conflicts of interest: The implications of roadside advertising for driver attention. Transportation Research Part F: Traffic Psychology and Behaviour 12, 5: 381–388. [Google Scholar] [CrossRef]
- Zahabi, M., and D. Kaber. 2018. Effect of police mobile computer terminal interface design on officer driving distraction. Applied Ergonomics 67: 26–38. [Google Scholar] [CrossRef]
- Zahabi, M., P. Machado, M. Y. Lau, Y. Deng, C. Pankok, J. Hummer, W. Rasdorf, and D. B. Kaber. 2017. Driver performance and attention allocation in use of logo signs on freeway exit ramps. Applied Ergonomics 65: 70–80. [Google Scholar] [CrossRef] [PubMed]
- Zahabi, M., P. Machado, C. Pankok, M. Y. Lau, Y.-F. Liao, J. Hummer, W. Rasdorf, and D. B. Kaber. 2017. The role of driver age in performance and attention allocation effects of roadway sign count, format and familiarity. Applied Ergonomics 63: 17–30. [Google Scholar] [CrossRef]
- Zahabi, M., C. Pankok, D. B. Kaber, P. Machado, M. Y. Lau, J. E. Hummer, and W. Rasdorf. 2017. On-road visual sign salience, driver attention allocation, and target detection accuracy. Transportation Research Record 2663, 1: 40–47. [Google Scholar] [CrossRef]
- Zhang, H., M. R. H. Smith, and G. J. Witt. 2006. Identification of real-time diagnostic measures of visual distraction with an automatic eye-tracking system. Human Factors 48, 4: 805–821. [Google Scholar] [CrossRef] [PubMed]
- Zhang, L., J. Zhang, Y. Liu, and J. Guo. 2017. The impact of over-bright highway billboards on driving behaviour. VEHITS 2017 Proceedings of the 3rd International Conference on Vehicle Technology and Intelligent Transport Systems; pp. 276–284. [Google Scholar]
- Zhang, W., and E. Kontou. 2014. Isolating stationary and temporal sources of driver distraction through eye tracking study. Advances in Transportation Studies 1: 87–100. [Google Scholar] [CrossRef]
- Zhang, Y., E. Harris, M. Rogers, D. Kaber, J. Hummer, W. Rasdorf, and J. Hu. 2013. Driver distraction and performance effects of highway logo sign design. Applied Ergonomics 44, 3: 472–479. [Google Scholar] [CrossRef] [PubMed]
- Zhang, Y., D. B. Kaber, M. Rogers, Y. Liang, and S. Gangakhedkar. 2014. The effects of visual and cognitive distractions on operational and tactical driving behaviors. Human Factors 56, 3: 592–604. [Google Scholar] [CrossRef]
- Zhang, Y., B. Reimer, B. Mehler, J. Dobres, S. Pala, and L. Angell I. 2013. An evaluation of the visual demands of portable telematics in young adult drivers. Proceedings of the 20th ITS World Congress. [Google Scholar]
- Zhou, H. I, and M. h I. 2009. How Do Cognitive Distraction Affect Driver Intent of Changing Lanes? In Intelligent Robotics and Applications. ICIRA 2009. Edited by M. Xie, Y. Xiong, C. Xiong, H. Liu and Z. Hu. Lecture Notes in Computer Science. Springer: Vol. 5928. [Google Scholar] [CrossRef]
- Zhou, H. I. 2015. Effect of Adaptive Caution on Driver’s Lane-Change Behavior under Cognitively Distracted Condition. In International Conference on Human Interface and the Management of Information. Springer: pp. 262–271. [Google Scholar] [CrossRef]
- Zhou, H. I, and M. h I. 2008. Influence of cognitively distracting activity on driver’s eye movement during preparation of changing lanes. In 2008 SICE Annual Conference. IEEE: pp. 866–871. [Google Scholar] [CrossRef]


 |
 |
  |
  |
  |
  |
Copyright © 2019. This article is licensed under a Creative Commons Attribution 4.0 International License.
Share and Cite
Cvahte Ojsteršek, T.; Topolšek, D. Eye Tracking Use in Researching Driver Distraction: A Scientometric and Qualitative Literature Review Approach. J. Eye Mov. Res. 2019, 12, 1-30. https://doi.org/10.16910/jemr.12.3.5
Cvahte Ojsteršek T, Topolšek D. Eye Tracking Use in Researching Driver Distraction: A Scientometric and Qualitative Literature Review Approach. Journal of Eye Movement Research. 2019; 12(3):1-30. https://doi.org/10.16910/jemr.12.3.5
Chicago/Turabian StyleCvahte Ojsteršek, Tina, and Darja Topolšek. 2019. "Eye Tracking Use in Researching Driver Distraction: A Scientometric and Qualitative Literature Review Approach" Journal of Eye Movement Research 12, no. 3: 1-30. https://doi.org/10.16910/jemr.12.3.5
APA StyleCvahte Ojsteršek, T., & Topolšek, D. (2019). Eye Tracking Use in Researching Driver Distraction: A Scientometric and Qualitative Literature Review Approach. Journal of Eye Movement Research, 12(3), 1-30. https://doi.org/10.16910/jemr.12.3.5