Abstract
Black mulberry (Morus nigra L.) is considered a medicinal and food-homologous plant in China. An obstacle to its widespread use is that its annual season and shelf life are extremely short. In this paper, fermented black mulberry juice (FBMJ) was prepared with various probiotic strains, and response surface methodology was used to determine the optimum production conditions for achieving the maximum active substance content in the resulting product. The fermentation process increased levels of biological enzymes and total phenols in the resulting juice. When the ratios of the Lactobacillus inocula to the total inoculum were 27.96% for L. paracasei, 15.37% for L. casei, 16.64% for L. plantarum, and 5.12% for L. delbrueckii, the B. animalis subsp. lactis content reached 15.83%, the L. fermentum content reached 19.08%, and the superoxide dismutase (SOD) activity reached 310 U/g. To study the antioxidant characteristics of the juice, C2C12 cells were treated with H2O2 to induce oxidative stress and the cytoprotective activity of FBMJ was subsequently evaluated. After treatment with FBMJ for 24 h, cell viability was found to be protected under H2O2 exposure, while SOD and glutathione peroxidase (GSH-Px) levels were increased. The reactive oxygen species level and malondialdehyde content were also decreased. These results provide molecular evidence for the antioxidant effect of FBMJ and demonstrate that lactic acid bacteria fermentation has a positive effect on black mulberry juice (BMJ).
1. Introduction
As one of the main corridors of the ancient Silk Road, Xinjiang in northwest China has a long history of sericulture and contains a preserved population of a wide variety of mulberry trees. These include black mulberry (Morus nigra L.), which was first developed in Iran and later planted in the southern Xinjiang region. The species only has a two-week harvest period in August each year [1]. In China, black mulberry is a medicinal and food-homologous material used in traditional Chinese medicine. It comprises a rich source of natural antioxidants, such as polyphenols, flavonoids, organic acids, pectin, and other carbohydrates [2]. These components have been found to exert direct and indirect effects on diabetes [3], oxidative stress [4], inflammation, tumor, hepatic diseases, immunomodulation, hyperlipidemia [5], neural damage [6], and chronic diseases [7], either synergistically with other materials or in their pure form. Unfortunately, black mulberry is a seasonal fruit that features a fragile pulp and high sugar content, thereby making it extremely difficult to preserve, store, and transport.
In recent years, researchers have demonstrated that lactic acid bacteria fermentation is a cheap and effective value-adding processing method for edible substances [8]. The fermentation process produces organic acids and other bioactive compounds that help extend the shelf life of fresh juices [9]. Furthermore, the pharmacological activities of many bioactive substances become enhanced under the action of probiotic biotransformation [10]. Tang et al. [11] used Lactobacillus plantarum to ferment mulberry pomace and found that its antioxidant activity was greatly improved. Kim et al. [12] used lactic acid bacteria to biotransform mulberries and found that the fermented mulberries had enhanced antibacterial and anti-inflammatory activities. Meanwhile, compared to single-strain fermentation, the metabolic mechanism of mixed-strain fermentation is more complex and produces a higher abundance of fermentation products [13]. Due to the different characteristics and substrate adaptability of individual strains, it is necessary to select relevant dominant bacteria that are beneficial to the fermentation of black mulberry in order to optimize the process of mixed bacterial fermentation.
In this paper, several fermented black mulberry juice (FBMJ) products containing different lactic acid bacteria were developed. Firstly, 6 bacterial strains with high acid production capacity, SOD production capacity, total phenol production capacity, and the ability to produce a desirable sensory evaluation profile were screened by a single-factor test, and the inoculum concentration was determined using a unified design test. Subsequently, based on the preliminary experiments, the fermentation process was optimized based on SOD activity and total phenol content using response surface methodology [14]. In addition, different concentrations of FBMJ were used to protect cells subjected to hydrogen peroxide-induced oxidative stress, and the effect of different doses of BMJ and FBMJ on levels of cellular reactive oxygen species (ROS) in C2C12 cells was determined by flow cytometry. SOD activity, glutathione peroxidase (GSH-Px) activity, and the malondialdehyde (MDA) content in the cells were measured to study the mechanism by which FBMJ prevents damage caused by oxidative stress.
2. Materials and Methods
2.1. Materials
Fresh black mulberries were purchased from a shop at a Kuqa market, Xinjiang, China. Ethanol, gallic acid, and Folin-Ciocalteu phenol were obtained from Tianjin Shengao Chemical Reagent Co., Ltd. (Tianjin, China). The MRS (DeMan, Rogosa and Sharpe) culture medium was purchased from Beijing Aoboxing Biotechnology Co., Ltd. (Beijing, China). Lactobacillus plantarum, Lactobacillus casei, Lactobacillus paracasei, Weissella spp., Lactobacillus fermentum, Lactobacillus acidophilus, Lactobacillus reuteri, Lactobacillus delbrueckii subsp. bulgaricus, Lactobacillus helveticus, Lactobacillus salivarius, Lactobacillus brevis, Leuconostoc lactis, Pediococcus acidilactici, Pediococcus pentosaceus, Leuconostoc mesenteroides, Wickerhamomyces anomalus, Kluyveromyces lactis, Streptococcus lactis, and Lactobacillus johnsonii, Bifidobacterium animalis subsp. lactis were obtained from the China Microbial Culture Preservation Center (Beijing, China). Pectinase, celluclast, and hemicellulase were purchased from Novozymes®, Ltd. (Beijing, China). All strains were activated twice and incubated at 37 ℃ for 24 h before use. C2C12 cells were obtained from Wuhan Procell Life Science & Technology Co., Ltd. (Wuhan, China). Pectinase, cellulase, and hemicellulase were purchased from Shanghai Yuanye Biotechnology Co., Ltd. (Shanghai, China). Dulbecco’s modified Eagle’s medium (DMEM), fetal bovine serum (FBS), and phosphate- buffered solution (PBS) were purchased from Biological Industries Company (Shanghai, China). Trypsin-EDTA (0.05%) and dimethyl sulfoxide (DMSO) were purchased from HyClone Corporation (Logan, UT, USA). Assay kits, including SOD, glutathione peroxidase (GSH-Px), and malondialdehyde (MDA), were purchased from the Nanjing Jiancheng Bioengineering Institute (Nanjing, China).
2.2. Preparation of Black Mulberry Juice and Inoculum
Black mulberries were washed with distilled water to remove dust and surface impurities. Then, the black mulberries were ground into a homogenate with a beater. Next, 0.2% (w/v) pectinase, 0.1% (w/v) cellulase, and 0.1% (w/v) hemicellulase were added to induce enzymatic hydrolysis for 3.5 h at 55 °C. The digested juice was pasteurized in a 70 °C water bath for 20 min and then cooled to room temperature. A volume of the strain suspension was added to the homogenate. Finally, the juice was fermented for 18 h at 37 °C.
2.3. Selection of the Fermentation Strains and Determination of their Proportions
Twenty strains were used to ferment the black mulberry homogenate, respectively. The monoculture inoculum was maintained at a bacterial concentration of 1 × 10⁶ CFU/mL, and the total soluble solid (TSS) content was adjusted to 18.5 °Brix. Then, fermentation was carried out in a 37 °C incubator for 20 h. After fermentation, the pH, SOD activity, total phenol concentration (TPC), and sensory score were determined for each resulting product, and the dominant strains were selected based on assessments of SOD, acid production capacity, TPC, and sensory score. The optimization test used a uniform design table U10 × (108), which is described as follows. Ten levels of six dominant strains in the total inoculum volume were set as factors. The uniform design table is shown in Table 1. SOD activity was used as the response value and SPSS 26.0 software was used to conduct a quadratic polynomial stepwise regression analysis to obtain the fermentation regression equation, with maximum SOD activity as the target. The equation was then solved using programming solver functions available in Excel. Finally, the percentages of the six strains in the inoculum were optimized.

Table 1.
Uniform design table for the experiment.
2.4. Optimization of the FBMJ Fermentation Process Using Response Surface Methodology (RSM)
After the fermentation strains and ratios were determined, SOD activity and TPC values obtained after fermentation were used as indicators. The single-factor experimental conditions for FBMJ production were as follows: soluble solid content (18.5, 19, 19.5, 20, and 20.5 °Brix), inoculum volume (1, 3, 5, 7, 9, and 12 × 106 CFU/mL), fermentation temperature (27, 32, 37, 42, and 47 °C), and fermentation time (3, 6, 9, 12, 15, 18, 21, and 24 h).
Based on the single-factor test, optimization (Table 2) was performed using RSM [15,16]. The Box–Behnken test was designed to obtain higher quality FBMJ. The factors and levels of the Box–Behnken test design are shown in Table 2.
Table 2.
Uncoded and coded levels of independent variables and combined model design expert test matrix and experimental data for responses in FBMJ.
2.5. Measurement of Physicochemical Indicators
The total soluble solid (TSS) content was measured using a handheld Brix meter. SOD activity was determined according to the instructions provided by the Nanjing Jiancheng kit. TPC was measured using the method reported by Rosl et al. [17], with the following modifications: in the pretreatment step, 85% anhydrous ethanol was slowly added to the juice and mixed with a vortex oscillator, which was followed by ultrasonic extraction carried out for 30 min at 25 °C in an ultrasonic extractor. After extraction, the supernatant was collected by centrifugation at 6000 r/min for 15 min. The resulting centrifugal precipitate was ultrasonically extracted with 85% ethanol 2–3 times, centrifuged at 6000 r/min for 15 min, combined with the supernatant, and stored in a 100 mL volumetric bottle. This ensured that the oligosaccharide components in each sample were removed. The TPC was calculated from the standard curve equation. Sensory evaluation was performed using the method reported by Liu et al. [8] combined with an assessment of the liquid-fermented juice sensory characteristics. Ten people who had received sensory evaluation training rated the appearance, flavor, smell, taste, and acceptability of the FBMJ products. During training and evaluation, approximately 20 mL of the respective BMJ samples were randomly served at room temperature. Water and white bread were provided for palate cleansing. Sensory evaluation of the 21 samples was carried out in duplicate. Training and evaluation were conducted in accordance with the guidelines of the International Organization for Standardization (I.S.O., 1993) in a sensory laboratory fulfilling the requirements provided by the American Society for Testing and Materials. The sensory evaluation scores are shown in Table 3. It is noteworthy that the fermented juices produced in this study had points deducted if they had an alcoholic flavor (there is a clear limit on the degree of alcohol contained in products in China’s JIAOSU standards).
Table 3.
Sensory attributes for fermented black mulberry juices.
2.6. Analysis of Cell Viability with the CCK-8 Assay
CCK-8 is a low-toxicity, high-sensitivity, and rapid detection kit based on WST-8, which is widely used to study cell proliferation and toxicity [18]. The effect of FBMJ on the viability of C2C12 cells was detected using the CCK-8 method. The CCK-8 experimental operation steps were as follows. The cell suspension was inoculated in a 96-well plate with 200 μL per well at a cell density of 6 × 10⁵ cells/well. BMJ and FBMJ were then added at concentrations of 0, 0.25, 0.5, 1, 2, 4, 6, 8, and 10 mg/mL to different well plates, respectively. Six duplicate wells were set for each concentration of each monomer, and blank control wells were set up in tandem with only medium added. Following administration of the treatments, the well plates were placed in an incubator. After culturing in the incubator for 6 h, the well plates were removed and quickly aspirated from the treated cell culture medium. Then, a volume of 100 μL of high-glucose medium (without serum) and 10 μL of CCK-8 solution were added per well. No air bubbles were generated during the process of changing the medium and adding the CCK-8 solution. The 96-well plate containing CCK-8 solution was then placed in an incubator for 2 h. A Bio-Tek microplate reader was used to measure the optical density (OD) value of each well at a wavelength of 450 nm. Cell viability was calculated using the following formula:
cell viability(%) = (ASample − ABlank)/(AControl − ABlank) × 100%.
The groups were treated as follows:
(i) sample group: the OD value was taken from wells containing FBMJ-treated cells and CCK-8 solution.
(ii) blank group: the OD value was taken only from wells containing medium and CCK-8 solution.
(iii) control group: the OD values were taken from wells containing cells and CCK-8 solution without treatment.
2.7. Cell Culture and Treatment
C2C12 cells were maintained in DMEM medium containing penicillin (100 U/mL), streptomycin (100 g/mL), and 10% FBS under an atmosphere of 95% relative humidity and 5% CO2 at 37 °C. The medium was changed every other day. The cells were divided into two groups: cells treated with H2O2 (oxidative stress model group) or left untreated (control group). The appropriate concentration of H2O2 was selected by treating cells with different concentrations of H2O2 (0, 125, 250, 500, 1000, and 2000 μmol/L) for 12, 24, and 48 h, and then evaluating cell viability using the CCK-8 assay (Section 2.6). In cells treated with 500 μmol/L H2O2 for 24 h, the cytotoxicity was approximately 27%; therefore, this condition was subsequently used for the experimental induction of oxidative stress.
To investigate the cytoprotective effect of FBMJ against oxidative damage, C2C12 cells were cultured in a 96-well microplate at 6 × 10⁵ cells/well for 24 h and then divided into the following eight groups: control (culture medium only), H2O2 (culture medium for 24 h + H2O2 for 24 h), BMJ (0.5, 1, or 2 mg/mL for 24 h) + H2O2 (for 24 h), and FBMJ (0.5, 1, or 2 mg/mL for 24 h) + H2O2 (for 24 h).
2.8. Evaluation of Antioxidant Activity
The cell suspensions were centrifuged at 1200 rpm for 4 min at 37 °C. The activities of MDA, SOD, and GSH-Px were evaluated using a commercial assay kit (Jiancheng Bioengineering, Nanjing, China) according to the manufacturer’s instructions. Intracellular ROS generation was detected by staining with DCFH-DA (BL714A; Biosharp; Anhui, China). Briefly, C2C12 cells were seeded in a 6-well plate (6 × 10⁵ cells/well) and cultured for 24 h. Following the different treatments, the cells were washed with phosphate-buffered saline and incubated with DCFH-DA (at a final concentration of 10 vM) in complete medium at 37 °C for 30 min. The cells were then analyzed by flow cytometry (CytoFLEX; Beckman Coulter, Brea, CA, USA).
2.9. Statistical Analysis
To obtain higher quality FBMJ, optimization (Table 2) using RSM was performed employing Design-Expert software (version 13). Box-Behnken design (BBD) was applied to determine the impact of the four independent variables: fermentation time (A), fermentation temperature (B), soluble solid content (C), and inoculum volume (D). SOD activity (Y1) and TPC (Y2) were set as responses for the FBMJ. The statistical significance of the terms in the regression equations was examined. The significant terms in the model were determined by analysis of variance (ANOVA) for each response (Table 4). The reliability of the model was based on the coefficient of determination (R2) and adjusted coefficient of determination (R2-adj). Analysis of the significance of each factor under single fermentation with different strains and analysis of variance (ANOVA) of the uniform design regression equation were performed using SPSS software (version 26.0) (IBM Corp., Armonk, NY, USA). The significance analysis of the cell assay content was performed using the t-test in Prism software (version 8.0.2.) (GraphPad, San Diego, CA, USA). All figures were drawn using Prism v8.0.2 software. All experiments were conducted using three or more parallel experiments and repeated three times.
Table 4.
Analysis of variance of SOD activity and TPC in FBMJ.
3. Results
3.1. Selection of Fermentation Strains and Determination of the Proportions of Strains
In this experiment, 20 strains were used to ferment BMJ and the highest values of SOD activity, TPC, and sensory evaluation scores were determined during the fermentation process. The moderate sweet-acid ratio was determined by pH and TSS values. Six strains were ultimately selected for mixed fermentation (Table 5).
Table 5.
Physicochemical properties of MBJ fermented by twenty strains.
SOD has a strong free radical scavenging ability. BMJ is naturally rich in SOD, which is also produced in the process of lactic acid bacteria metabolism [19]. Table 5 shows that the bacteria that generated the highest SOD values were Weissella spp., L. paracasei, L. plantarum, and L. acidophilus; their SOD values increased by 51.4, 50.17, 35.51, and 25.4 U/g, respectively, compared to the black mulberry stock solution (255.19 U/g). Fermentation by L. reuteri and L. mesenteroides showed an effect on SOD activity, but L. reuteri and L. mesenteroides exhibited the longest times to proliferate to 8 × 10⁶ CFU/mL, thereby demonstrating that their growth ability in BMJ was inferior to that of the other strains.
Mulberry (Morus) fruit contains high levels of anthocyanins, quercetin glycosides, and chlorogenic acid. Mulberry polyphenols have been shown to confer benefits to human health. Different fermentation environments produce different total phenolic contents [20]. The bacteria that generated the greatest increase in total phenolic content were L. fermentum, L. delbrueckii, and L. casei, with increases of 1.37, 1.01, and 1.02 mg/g, respectively.
Lactobacillus strains feature diverse metabolisms. Among them, L. delbrueckii [21], L. acidophilus, and P. acidilactici utilize sugar to produce lactic acid and galactose, while L. mesenteroides [22], L. brevis, L. fermentum, and B. animalis subsp. lactis [23] further use acid as a carbon source to produce metabolites such as carbon dioxide, ethanol, and acetic acid. The strains L. casei, L. paracasei, and L. plantarum [24] are not as capable of producing lactic acid as these previous types, but they also produce lactic acid.
The sensory score was affected by the ratio of sourness to sweetness and various flavor substances. The bacteria that yielded the highest sensory scores were B. animalis subsp. lactis, L. plantarum, L. delbrueckii subsp. bulgaricus, P. pentosaceus, and L. reuteri, with scores of 90.33, 88.33, 85.00, 82.67, and 81.00, respectively. Among them, the pH value of the fermentation broth produced by Weissella spp. and L. acidophilus were both 3.38. These two strains exhibited a strong acid-producing ability, which underlied their lower sensory scores, as high acidity destroys the sweet-acidity of the resulting fermentation broth.
Therefore, based on high TPC, SOD, and sensory scores, two optimal bacteria were selected for each factor. The selected bacteria were chosen based on not conferring negative effects on the other factors. Thus, L. paracasei, L. casei, L. fermentum, L. delbrueckii, L. plantarum, and B. animalis subsp. lactis were determined to be the optimal fermentation strains to ferment BMJ.
Studies have shown that the SOD content in mixed-bacteria fermentation broth is higher than that produced by single-bacteria fermentation [19]. This experiment was conducted using a uniform design table (Table 6). The response values were obtained by mixed bacterial fermentation according to the fermentation process conditions described in Section 2.3.
Table 6.
Results of uniform design experiments.
According to the uniform design of the experimental plan, the quadratic polynomial stepwise regression equation was established using SOD activity as the response value, as follows:
Y = −222.233 − 417.105X4 + 482.766X12 + 238.677X1X3 + 974.6674X1X5 + 81.662X1X6 + 1740.59X2X3 + 450.63X4X6
p = 0.0098 < 0.01 in the regression equation, thereby confirming that the equation had a good degree of fit. In summary, the optimal inoculation ratios of FBMJ were predicted to be L. paracasei (27.96%), L. casei (15.37%), L. plantarum (16.64%), L. delbrueckii (5.12%), B. animalis subsp. lactis (15.83%), and L. fermentum (19.08%). SOD activity reached 346.18 U/g. In the verification test, SOD activity reached 310 U/g, which was higher than that produced by single-strain bacterial fermentation.
3.2. Response Surface Experimental Results and Analysis of Variance
The lactic acid bacteria in the FBMJ required 6 h to reach the logarithmic growth phase and 12 h to reach the stable phase. The fermentation products in juice increased over time. As shown in Figure 1A, SOD activity rapidly increased from 3–15 h and reached its maximum value (314 U/g) at 15 h. Thereafter, SOD activity showed a slowly decreasing trend. The concentration of total phenols reached 8.98 mg/g at 18 h, and then decreased to 8.53 mg/g with increasing time. Therefore, we chose a fermentation time of 15 h for subsequent study.
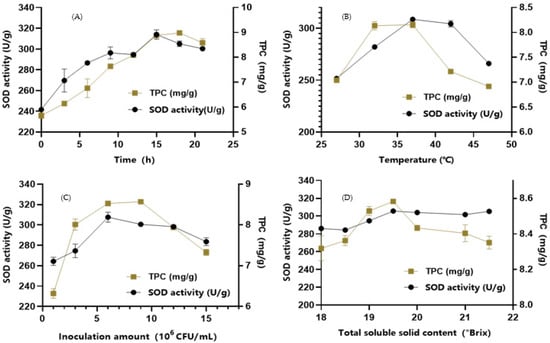
Figure 1.
Subfigures (A–D) show the influence of fermentation time, temperature, inoculum concentration, and total soluble solid content of FMBJ.
The fermentation temperature influences the metabolic activity of lactic acid bacteria, which in turn affects the fermentation quality [25]. As can be seen in Figure 1B, SOD activity reached its highest value (309 U/g) at 37 °C and then showed a decreasing trend with increasing temperature. The concentration of total phenols gradually stabilized at 8.15 mg/g at 37 °C and then showed a rapid downward trend above 37 °C. At high temperatures, bacterial intolerance to heat leads to a decrease in enzyme metabolism and activity [26], which consequently affects the biotransformation of phenolic substances in the system. Moreover, phenolic substances are readily degraded at high temperatures. Therefore, 37 °C was chosen as the optimal fermentation temperature.
As shown in Figure 1C, when the inoculum concentration reached 6 × 10⁶ CFU/mL, the growth and metabolism rate of the lactic acid bacteria was moderate, SOD activity reached its maximum value (308 U/g), and TPC also reached its maximum value (8.57 mg/g). There was no significant difference between the inoculum containing 6 × 10⁶ CFU/mL and that containing 9 × 10⁶ CFU/mL. After having reached 1.2 × 10⁷ CFU/mL, the lactic acid bacteria rapidly proliferated and produced acid, thus affecting SOD activity. Appropriately increasing the content of lactic acid bacteria is conducive to the conversion of macromolecular phenols into small molecular phenols by microorganisms and can also increase the concentration of total phenols [27]. However, when the inoculum content is too high, this can cause instability in the phenolic substances and loss of biological enzyme activity. Therefore, the optimum inoculum concentration was set as 6 × 10⁶ CFU/mL.
As shown in Figure 1D, SOD activity and total phenol content showed an upward trend with increasing added sugar. When the TSS content was adjusted to 19.5 °Brix, SOD activity reached its maximum value (306 U/g) and TPC reached 8.58 mg/g. From these results, we selected the TSS value of 19.5 °Brix.
On the basis of the single-factor experiment and according to the Box-Behnken central combinatorial design principle, the fermentation time (A), fermentation temperature (B), inoculum amount (C), and total soluble solid content (D) were selected as response surface optimization factors, while SOD activity (Y1) and total phenol content (Y2) were selected as optimization factors. The experimental results are shown in Table 2.
The values of the regression coefficients were calculated and the test variables were related by the following second-order polynomial equations:
Y1 = 317.75 + 26.31A + 12.76B + 16.57C + 9.36D−5.49AB + 1.29AC − 2.39AD + 1.08BC + 1.29BD + 3.81CD − 23.04A2 − 25.57B2 − 12.24C2 − 8.140D2
Y2=8.91 + 0.34A − 0.11B + 0.27C + 0.22D − 0.022AB − 7.500E − 003AC − 2.500E − 003AD + 0.087BC + 7.500E − 003BD − 0.02CD − 0.51A2 − 0.48B2 − 0.082C2 − 0.13D2
The analysis of variance and significance test results for SOD activity and TPC are shown in Table 4. The final results in terms of R2, adjusted-R2, C.V.%, and adequate precision are shown in Table 4.
The model regression equation coefficient significance test of Y1 (Figure 2) showed that the primary terms A, B, C, and D were highly significant; the interaction terms AB, AC, AD, BC, BD, and CD were not significant; and the quadratic terms A2, B2, C2, and D2 were highly significant. The Y2 model (Figure 2) regression equation coefficient significance test showed that the primary terms A, B, C, and D were highly significant; the interaction terms AB, AC, AD, BC, BD, and CD were not significant; the quadratic terms A2, B2, and D2 were highly significant; and the C2 term was not significant.
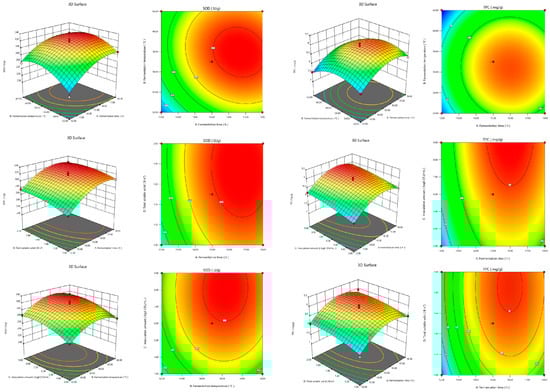
Figure 2.
Effects of interaction of various factors on SOD activity and total phenolic concentration of FBMJ.
It can be seen from Table 2 that the two regression equation models were highly significant (p < 0.0001), while the result of the lack of fit test was not significant. The correlation coefficient R2 value for SOD activity was 0.9814 and the R2 value for TPC was 0.9718, indicating a good degree of fit between the measured value and the predicted value and that the process parameters of FBMJ could be analyzed and predicted.
Through the prediction of the regression model, the optimal processing of FBMJ was obtained as follows: a fermentation time of 15.84 h, fermentation temperature of 34.41 °C, lactic acid bacteria inoculum of 8.16 × 10⁶ CFU/mL, and sugar addition of 1.85 °Brix. At this time, the predicted value of the SOD activity of the fermented mulberry enzymes was 332.67 U/g and the predicted value of TPC was 9.14 mg/g.
After comprehensive consideration, the optimal conditions were revised to a fermentation time of 16 h, fermentation temperature of 35 °C, lactic acid bacteria inoculum of 8.2 × 10⁶ CFU/mL, and sugar addition of 1.85 °Brix. Under these conditions, three parallel experiments were performed to verify that the SOD activity of FBMJ was 328.15 U/g and the total phenolic concentration was 9.12 mg/g. Compared with the predicted values, the error values of SOD activity and TPC were 1.16% and 0.24%, respectively, indicating that the model was effective.
3.3. Fermentation Kinetics and Specific Rate of FBMJ
As can be seen from Figure 3A, after 16 h, due to the reduced sugar content, and the increased total acid inhibited the growth of the bacteria and the specific growth rate of Lactobacillus spp. decreased. The Lactobacillus bacteria entered the stable period after 18 h and the highest number of lactic acid bacteria reached 8.79 × 10⁸ CFU/mL. As can be seen from Figure 3B, the initial growth rate was slow, thereafter gradually becoming faster following the adaptation period. Then, the growth rate gradually declined to zero. As shown in the figure, the specific growth rate of the lactic acid bacteria exhibited a bell-shaped curve. The generation of total acid content in the FBMJ showed a strong correlation with bacterial body growth and presented a growth-coupling-type relationship. Combined with the reducing sugar consumption rate curve shown in Figure 3A, the specific consumption rate was inversely correlated with the specific growth rate of Lactobacillus spp.
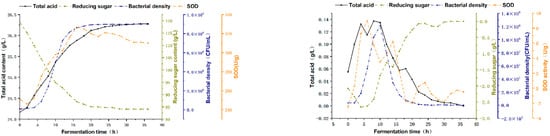
Figure 3.
(A) The trend change of lactic acid bacteria density, sugar content, total acid content, and SOD activity during the fermentation process; (B) Specific growth rate, sugar consumption rate, total acid production rate, and SOD production rate during the fermentation process used to produce FBMJ.
3.4. Antioxidant Activity
3.4.1. Effects of BMJ and FBMJ on H2O2-Induced Cytotoxicity in C2C12 Cells
To further evaluate the antioxidant activity of BMJ and FBMJ, mouse C2C12 cells were used to establish a cell model of oxidative stress. Hydrogen peroxide (H2O2) is an unstable chemical with high oxidative capacity that induces intracellular redox interference [28].
In this study, we used H2O2-treated C2C12 cells to construct an in vitro oxidative stress model to evaluate the antioxidant function of FBMJ. After 24 h of treatment with either BMJ or FBMJ at concentrations of 0, 0.25, 0.5, 1, 2, 4, 8, and 10 mg/mL, C2C12 cell viability was determined using the CCK-8 method (Figure 4). As shown in Figure 4, FBMJ concentrations below 4 mg/mL had no apparent toxic effect on the cells, and instead showed a certain promoting effect on cell proliferation. When the concentration of FBMJ was 1 mg/mL, the cell viability increased by 12.96%. In the subsequent oxidative damage protection experiments, 0.5–2 mg/mL of BMJ and FBMJ were selected as the experimental concentrations with an administration time of 24 h.
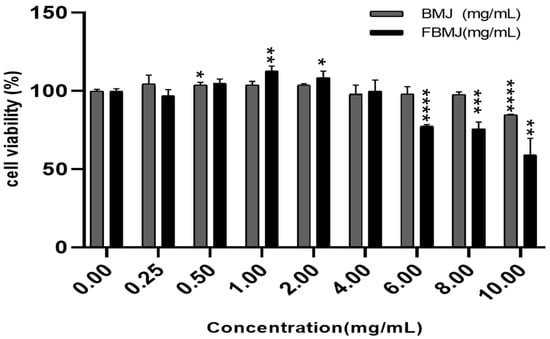
Figure 4.
Effects of different concentrations of BMJ and FBMJ on cell survival rate compared with the control group (* p < 0.05, ** p < 0.01, *** p < 0.001, **** p <0.0001).
Treatment of the model group with only 500 μmol/L H2O2 for 24 h resulted in a 24.85% decrease in cell viability (p < 0.001). In the drug group, the cells were exposed to different concentrations (0.5, 1, and 2 mg/mL) of either BMJ or FBMJ for 24 h and then treated with 500 μmol/L H2O2 for 24 h, whereby cell viability increased in a dose-dependent manner (Figure 5). Compared to the model group, the drug groups administered concentrations of 0.5 mg/mL BMJ and 1 mg/mL FBMJ exhibited the most significant protective effects against oxidative stress, whereby the cell viability of the two groups increased by 25.8% and 30.22%, respectively. (p < 0.001). These results suggested that both BMJ and FBMJ can protect C2C12 cells from oxidative stress.
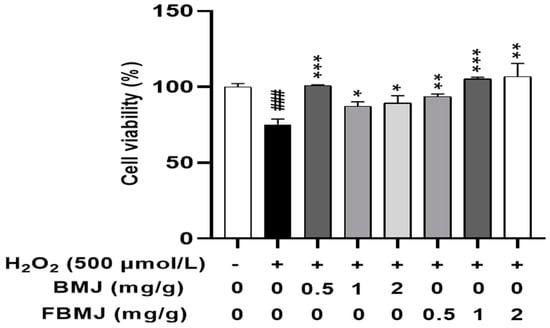
Figure 5.
The effects of BMJ and FBMJ on the survival rate of 500 μmol/L H2O2-oxidatively stimulated C2C12 cells compared with the control group (### p < 0.001) and damaged group (* p < 0.05, ** p < 0.01, *** p < 0.001.).
3.4.2. Effect of BMJ and FBMJ on Intracellular ROS Levels in C2C12 Cells
The ROS that are generated in cells oxidize biomolecules such as lipids, proteins, and DNA, thereby inducing mitochondrial damage and cell death [29]. To investigate the cytoprotective effect of FBMJ against oxidative stress in more detail, we assessed intracellular ROS production using the fluorescent ROS indicator DCFH-DA.
Compared to the control group, 500 μmol/L H2O2 treatment increased the level of ROS; however, BMJ and FBMJ each reversed this trend in a dose-dependent manner. The results obtained by flow cytometry analysis showed that compared to the control group, the degree of ROS fluorescence in the H2O2 group increased by 2.44 times. Compared to the H2O2 group, the ROS fluorescence in the high-dose MBJ group decreased by 3.26 times, while that of the high-dose FBMJ group decreased by 14.78 times. The high-dose FBMJ group results were 6 times lower than those in the control group, demonstrating that FBMJ had a stronger antioxidant effect (Figure 6). Consistent with our results, another study showed that mulberries fermented by gut bacteria inhibited ROS in cells and alleviated ROS-related diseases [30].
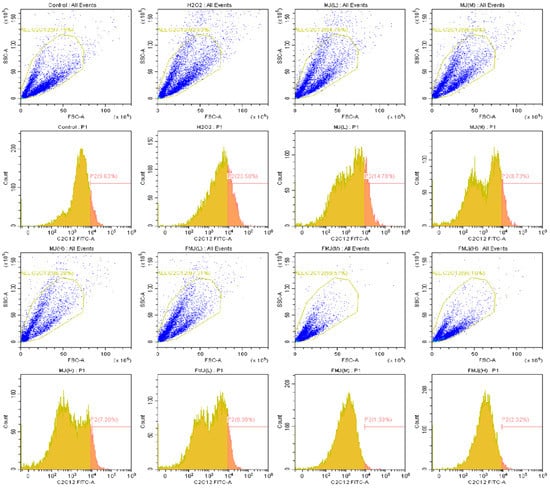
Figure 6.
The inhibitory effect of BMJ and FBMJ on H2O2-induced intracellular ROS production in C2C12 cells. The intracellular ROS production was determined using the DCFH-DA method with flow cytometry.
3.4.3. Effects of FBMJ on SOD and GSH-Px Activities and MDA Content
When cells are oxidatively stimulated, intracellular GSH-Px and SOD maintain redox homeostasis by scavenging oxidized lipids and oxygen free radicals [31], thereby achieving the REDOX reaction to return the cell to homeostasis.
The previous ROS experiments showed that FBMJ had a preventative effect on the oxidative stress injury of cells (Figure 6). Through the detection of intracellular SOD activity, GSH-Px activity, and MDA levels, it was found that the activities of SOD and GSH-Px in the cells of the model group were significantly decreased (p < 0.0001), while the content of MDA was significantly increased (p < 0.0001). Table 7 shows that, compared to the model group, adding FBMJ to the cells in advance significantly increased the SOD activity to 6.76 U/mL and GSH-Px activity to 29.04 U/mg Prot in the cells, thereby reducing the intracellular MDA content (1.68 nmol/mg Prot). The effect of FBMJ was greater than that of BMJ.
Table 7.
Effects of FBMJ on SOD activity, GSH-PX activity, and MDA content in C2C12 cells.
It is worth mentioning that the effect of FBMJ on each index was higher than that of BMJ, indicating that fermentation improved the antioxidant capacity of BMJ.
4. Conclusions
Healthy food is in increasing demand by modern consumers. Probiotic fermentation can be used to improve the nutrition and flavor of food. Therefore, in this study, we evaluated the suitability of 20 strains of probiotics for the fermentation of black mulberries and selected 6 of these strains as the most suitable. Then, a uniform design method was used to determine the optimum inoculum concentration of each strain in the fermentation process. The inoculation ratios of each strain were 27.96% for L. paracasei, 15.37% for L. casei, 16.64% for L. plantarum, 5.12% for L. delbrueckii, 15.83% for B. animalis subsp. lactis, and 19.08% for L. fermentum. According to the SOD activity and TPC, the fermentation process of FBMJ was optimized using RSM. The results showed that the optimum conditions for FBMJ production were as follows: fermentation time of 16 h, fermentation temperature of 35 °C, total bacterial content of 8.2 × 10⁶ CFU/mL, and sugar content of 1.85 °Brix. Experiments investigating the antioxidant activity of FBMJ indicated that FBMJ can promote the proliferation of C2C12 cells and has a significant protective effect against H2O2-induced oxidative stress. Compared to the model group, high-dose FBMJ treatment reduced the ROS content. The mechanism underlying this outcome is that FBMJ reduces the MDA content of injured cells and increases the activities of GSH-Px and SOD.
Author Contributions
Conceptualization, M.L. and L.W.; methodology, M.L. and A.A.; software, X.L.; data curation, N.T.; writing—original draft preparation, M.L.; writing—review and editing, L.W.; visualization, J.Y.; supervision, A.A.; project administration, L.W.; funding acquisition, K.C. and A.A. All authors have read and agreed to the published version of the manuscript.
Funding
This work is funded by the key technology research of the intensive processing of Xinjiang characteristic subsidiary agricultural products, the sub-project of the Autonomous Region’s (Xinjiang Uygur Autonomous Region, China) key research and development project (2022B02026-3).
Institutional Review Board Statement
Not applicable.
Informed Consent Statement
Not applicable.
Data Availability Statement
Data is contained within the article.
Acknowledgments
The authors are indebted to the anonymous reviewers for their constructive comments and suggestions for improvement of this manuscript.
Conflicts of Interest
The authors declare no conflict of interest.
References
- Jiang, Y.; Nie, W.-J. Chemical properties in fruits of mulberry species from the Xinjiang province of China. Food Chem. 2015, 174, 460–466. [Google Scholar] [CrossRef] [PubMed]
- Jan, B.; Parveen, R.; Zahiruddin, S.; Khan, M.U.; Mohapatra, S.; Ahmad, S. Nutritional constituents of mulberry and their potential applications in food and pharmaceuticals: A review. Saudi, J. Biol. Sci. 2021, 28, 3909–3921. [Google Scholar] [CrossRef] [PubMed]
- Li, E.; Long, X.; Liao, S.; Pang, D.; Li, Q.; Zou, Y. Effect of mulberry galacto-oligosaccharide isolated from mulberry on glucose metabolism and gut microbiota in a type 2 diabetic mice. J. Funct. Foods 2021, 87, 104836. [Google Scholar] [CrossRef]
- Huang, X.; Sun, L.; Dong, K.; Wang, G.; Luo, P.; Tang, D.; Huang, Q. Mulberry fruit powder enhanced the antioxidant capacity and gel properties of hammered minced beef: Oxidation degree, rheological, and structure. LWT 2022, 154, 112648. [Google Scholar] [CrossRef]
- Zhang, R.; Zhang, Q.; Zhu, S.; Liu, B.; Liu, F.; Xu, Y. Mulberry leaf (Morus alba L.): A review of its potential influences in mechanisms of action on metabolic diseases. Pharmacol. Res. 2022, 175, 106029. [Google Scholar] [CrossRef] [PubMed]
- Xu, X.; Huang, Y.; Xu, J.; He, X.; Wang, Y. Anti-neuroinflammatory and antioxidant phenols from mulberry fruit (Morus alba L.). J. Funct. Foods 2020, 68, 103914. [Google Scholar] [CrossRef]
- Bhattacharjya, D.; Sadat, A.; Dam, P.; Buccini, D.F.; Mondal, R.; Biswas, T.; Biswas, K.; Sarkar, H.; Bhuimali, A.; Kati, A.; et al. Current concepts and prospects of mulberry fruits for nutraceutical and medicinal benefits. Curr. Opin. Food Sci. 2021, 40, 121–135. [Google Scholar] [CrossRef]
- Liu, Y.; Sheng, J.; Li, J.; Zhang, P.; Tang, F.; Shan, C. Influence of lactic acid bacteria on physicochemical indexes, sensory and flavor characteristics of fermented sea buckthorn juice. Food Biosci. 2022, 46, 101519. [Google Scholar] [CrossRef]
- Ranjith, F.H.; Ariffin, S.H.; Muhialdin, B.J.; Yusof, N.L.; Mohammed, N.K.; Marzlan, A.A.; Hussin, A.S.M. Influence of natural antifungal coatings produced by Lacto-fermented antifungal substances on respiration, quality, antioxidant attributes, and shelf life of mango (Mangifera indica L.). Postharvest Biol. Technol. 2022, 189, 111904. [Google Scholar] [CrossRef]
- Tang, R.; Yu, H.; Qi, M.; Yuan, X.; Ruan, Z.; Hu, C.; Xiao, M.; Xue, Y.; Yao, Y.; Liu, Q. Biotransformation of citrus fruits phenolic profiles by mixed probiotics in vitro anaerobic fermentation. LWT 2022, 160, 113087. [Google Scholar] [CrossRef]
- Tang, S.; Cheng, Y.; Wu, T.; Hu, F.; Pan, S.; Xu, X. Effect of Lactobacillus plantarum-fermented mulberry pomace on antioxidant properties and fecal microbial community. LWT 2021, 147, 111651. [Google Scholar] [CrossRef]
- Kim, B.S.; Kim, H.; Kang, S.-S. In vitro anti-bacterial and anti-inflammatory activities of lactic acid bacteria-biotransformed mulberry (Morus alba Linnaeus) fruit extract against Salmonella Typhimurium. Food Control 2019, 106, 106758. [Google Scholar] [CrossRef]
- Yang, Z.; Wang, L. Development of Cistanche deserticola Fermented Juice and Its Repair Effect on Ethanol-Induced WRL68 Cell Damage. Fermentation 2022, 8, 178. [Google Scholar] [CrossRef]
- Maghamian, N.; Goli, M.; Najarian, A. Ultrasound-assisted preparation of double nano-emulsions loaded with glycyrrhizic acid in the internal aqueous phase and skim milk as the external aqueous phase. LWT 2021, 141, 110850. [Google Scholar] [CrossRef]
- Zaghian, N.; Goli, M. Optimization of the production conditions of primary (W1/O) and double (W1/O/W2) nano-emulsions containing vitamin B12 in skim milk using ultrasound wave by response surface methodology. J. Food Meas. Charact. 2020, 14, 3216–3226. [Google Scholar] [CrossRef]
- Sazesh, B.; Goli, M. Quinoa as a wheat substitute to improve the textural properties and minimize the carcinogenic acrylamide content of the biscuit. J. Food Process. Preserv. 2020, 44, e14563. [Google Scholar] [CrossRef]
- Mohd Rosli, N.N.H.; Harun, N.H.; Abdul Rahman, R.; Ngadi, N.; Samsuri, S.; Amran, N.A.; Safiei, N.Z.; Ab Hamid, F.H.; Zakaria, Z.Y.; Jusoh, M. Preservation of total phenolic content (TPC) in cucumber juice concentrate using non-thermal Progressive Freeze Concentration: Quantitative design characteristics and process optimization. J. Clean. Prod. 2022, 330, 129705. [Google Scholar] [CrossRef]
- Kou, G.; Li, Z.; Wu, C.; Liu, Y.; Hu, Y.; Guo, L.; Xu, X. Citrus Tangeretin Improves Skeletal Muscle Mitochondrial Biogenesis via Activating the AMPK-PGC1-α Pathway In Vitro and In Vivo: A Possible Mechanism for Its Beneficial Effect on Physical Performance. J. Agric. Food Chem. 2018, 66, 11917–11925. [Google Scholar] [CrossRef]
- Cai, L.; Wang, W.; Tong, J.; Fang, L.; He, X.; Xue, Q.; Li, Y. Changes of bioactive substances in lactic acid bacteria and yeasts fermented kiwifruit extract during the fermentation. LWT 2022, 164, 113629. [Google Scholar] [CrossRef]
- Salman, S.; Öz, G.; Felek, R.; Haznedar, A.; Turna, T.; Özdemir, F. Effects of fermentation time on phenolic composition, antioxidant and antimicrobial activities of green, oolong, and black teas. Food Biosci. 2022, 49, 101884. [Google Scholar] [CrossRef]
- Yue, Y.; Wang, S.; Lv, X.; Wang, C.; Xu, B.; Ping, L.; Guo, J.; Li, X.; Evivie, S.E.; Liu, F.; et al. Analysis of the complete genome sequence of Lactobacillus delbrueckii ssp. bulgaricus with post-acidification capacity and its influence on yogurt in storage. J. Dairy Sci. 2022, 105, 1058–1071. [Google Scholar] [CrossRef] [PubMed]
- Yang, X.; Hu, W.; Xiu, Z.; Ji, Y.; Guan, Y. Interactions between Leu. mesenteroides and L. plantarum in Chinese northeast sauerkraut. LWT 2022, 168, 113901. [Google Scholar] [CrossRef]
- Ceylan, H.G.; Atasoy, A.F. Optimization and characterization of prebiotic concentration of edible films containing Bifidobacterium animalis subsp. lactis BB-12® and its application to block type processed cheese. Int. Dairy J. 2022, 134, 105443. [Google Scholar] [CrossRef]
- Maciel da Silva, R.; Henrique Campelo, P.; Rodrigues, S. In vitro viability of L. Casei B-442 and fructooligosaccharides integrity in Amazonian sapota-do-solimões functional juice. Food Res. Int. 2022, 154, 111036. [Google Scholar] [CrossRef] [PubMed]
- Wang, Y.; He, L.; Xing, Y.; Zhou, W.; Pian, R.; Yang, F.; Chen, X.; Zhang, Q. Bacterial diversity and fermentation quality of Moringa oleifera leaves silage prepared with lactic acid bacteria inoculants and stored at different temperatures. Bioresour. Technol. 2019, 284, 349–358. [Google Scholar] [CrossRef]
- Zhao, Y.; Liu, S.; Han, X.; Zhou, Z.; Mao, J. Combined effects of fermentation temperature and Saccharomyces cerevisiae strains on free amino acids, flavor substances, and undesirable secondary metabolites in huangjiu fermentation. Food Microbiol. 2022, 108, 104091. [Google Scholar] [CrossRef]
- Li, S.; Tao, Y.; Li, D.; Wen, G.; Zhou, J.; Manickam, S.; Han, Y.; Chai, W.S. Fermentation of blueberry juices using autochthonous lactic acid bacteria isolated from fruit environment: Fermentation characteristics and evolution of phenolic profiles. Chemosphere 2021, 276, 130090. [Google Scholar] [CrossRef]
- Ramli, I.; Posadino, A.M.; Zerizer, S.; Spissu, Y.; Barberis, A.; Djeghim, H.; Azara, E.; Bensouici, C.; Kabouche, Z.; Rebbas, K.; et al. Low concentrations of Ambrosia maritima L. phenolic extract protect endothelial cells from oxidative cell death induced by H2O2 and sera from Crohn’s disease patients. J. Ethnopharmacol. 2023, 300, 115722. [Google Scholar] [CrossRef]
- Chen, Y.-F.; Liu, H.; Luo, X.-J.; Zhao, Z.; Zou, Z.-Y.; Li, J.; Lin, X.-J.; Liang, Y. The roles of reactive oxygen species (ROS) and autophagy in the survival and death of leukemia cells. Crit. Rev. Oncol. Hematol. 2017, 112, 21–30. [Google Scholar] [CrossRef]
- Bao, T.; Li, Y.; Xie, J.; Jia, Z.; Chen, W. Systematic evaluation of polyphenols composition and antioxidant activity of mulberry cultivars subjected to gastrointestinal digestion and gut microbiota fermentation. J. Funct. Foods 2019, 58, 338–349. [Google Scholar] [CrossRef]
- Chang, Q.; Cai, H.; Wei, L.; Lan, R. Chitosan oligosaccharides alleviate acute heat stress-induced oxidative damage by activating ERK1/2-mediated HO-1 and GSH-Px gene expression in breast muscle of broilers. Poult. Sci. 2022, 101, 101515. [Google Scholar] [CrossRef] [PubMed]
Publisher’s Note: MDPI stays neutral with regard to jurisdictional claims in published maps and institutional affiliations. |
© 2022 by the authors. Licensee MDPI, Basel, Switzerland. This article is an open access article distributed under the terms and conditions of the Creative Commons Attribution (CC BY) license (https://creativecommons.org/licenses/by/4.0/).