1. Introduction
The Sahara Desert spans one-third of Africa’s entire land area (9,200,000 km
2) [
1], while the Arabian Desert, Asia’s largest desert, covers 2,330,000 square kilometers [
2]. Algeria’s national borders encompass a fourth of the Sahara Desert [
3].
Sand encroachment and deposition in built environments poses a major threat to inhabitants, causing serious problems such as substantial coverage, or even complete burial, of urban features such as buildings and roads, which then need continuous clearance and incur continuing costs (
Figure 1). In addition, the coverage of vegetation and agricultural land by accumulating sand has led residents in some areas to abandon their houses, or even quit entire settlements. This presents a complex problem to architects, as it requires attention not only to certain aspects of building design, but also to planning a settlement as a whole. However, there is evidence that the specific layout and shape of some vernacular settlements in areas of active sand dunes, such as the region of El-Oued Souf in the Algerian Sahara, have helped settlements to survive, and even mitigate the impact of sand encroachment.
The lack of knowledge and awareness by planners, architects, engineers, and developers of suitable and adaptable design principles in areas affected by sand deposition is reflected adversely in the design of the new buildings. To control the urban spread of the towns and the demand for new housing, many new low and medium-raised buildings and houses have been built in areas threatened by sand encroachment (
Figure 1 and
Figure 2). Some of these new houses were designed to create a cultural image by using traditional features such as domes or vaults, and in some cases traditional building materials were also used (
Figure 3). However, even for these buildings, the layouts and shapes were based on the design of buildings constructed elsewhere or were designed by architects and engineers not concerned with or unaware of the effects of sand encroachment. As a result, the rate of sand accumulation around these buildings has substantially increased compared to the accumulation in the traditional quarters. In some cases, sand piling up has even led to the destruction of building walls, which in turn has led to many of these new buildings being deserted.
Wind tunnels in which sediment can be added to the airflow provide a good opportunity to test and investigate the effects of building design and configuration on sand encroachment. In several scientific disciplines, wind tunnels have been used to study the accumulation patterns of sand and dust over and around obstacles. Many of these obstacles are topographic objects such as hills and valleys [
4,
5,
6], ridges [
7], craters [
8,
9,
10], vertical cliffs [
11], and even complex topography [
12,
13]. The accumulation patterns of aeolian sand have also been investigated for man-made constructions such as wind and sand barriers [
14,
15,
16,
17] and railway structures [
18,
19]. Photos of sand encroachment patterns around various civil constructions can be consulted in Raffaele and Bruno, 2019 [
19]. Several of the above-mentioned studies compared the obtained wind tunnel results with field data, usually successfully. Slaat et al., 2011 [
20] performed wind tunnel experiments in which dust deposition patterns were studied on the frontal façade of regular wooden blocks serving as scale models of regular buildings. However, they did not verify the experimentally obtained patterns with field observations. Poppema et al., 2021 [
21] measured sand deposition patterns around cubic and rectangular objects on the beach in the Netherlands and investigated the effect of their dimensions on the deposition. McKenna Neuman and Bédart, 2015 [
22] studied sand patterns around vertical cylinders in a wind tunnel. Tominaga et al., 2018 [
23] used CFD (Computational Fluid Dynamics) to calculate wind and sand patterns around cubic elements. Zhou et al., 2016 [
24] and Tsuchiya et al., 2002 [
25] studied snow drift patterns on roofs using field and wind tunnel measurements, and Florescu et al., 1970 [
26] simulated snow drift on a segment of a road. These snow drift studies are relevant for sand encroachment because snow particles behave aerodynamically similar to sand particles.
To better understand the effect of building design and shape on sand accumulation, wind tunnel experiments were carried out in this study to investigate the relationships between alterations in building configuration and form (height, width, length) and the sand accumulation patterns that are created around them. Field observations in Algeria and the United Arab Emirates allowed us to evaluate the reliability of the wind tunnel results. This paper summarizes the major results of this study.
2. Vernacular Buildings in the Northern Sahara
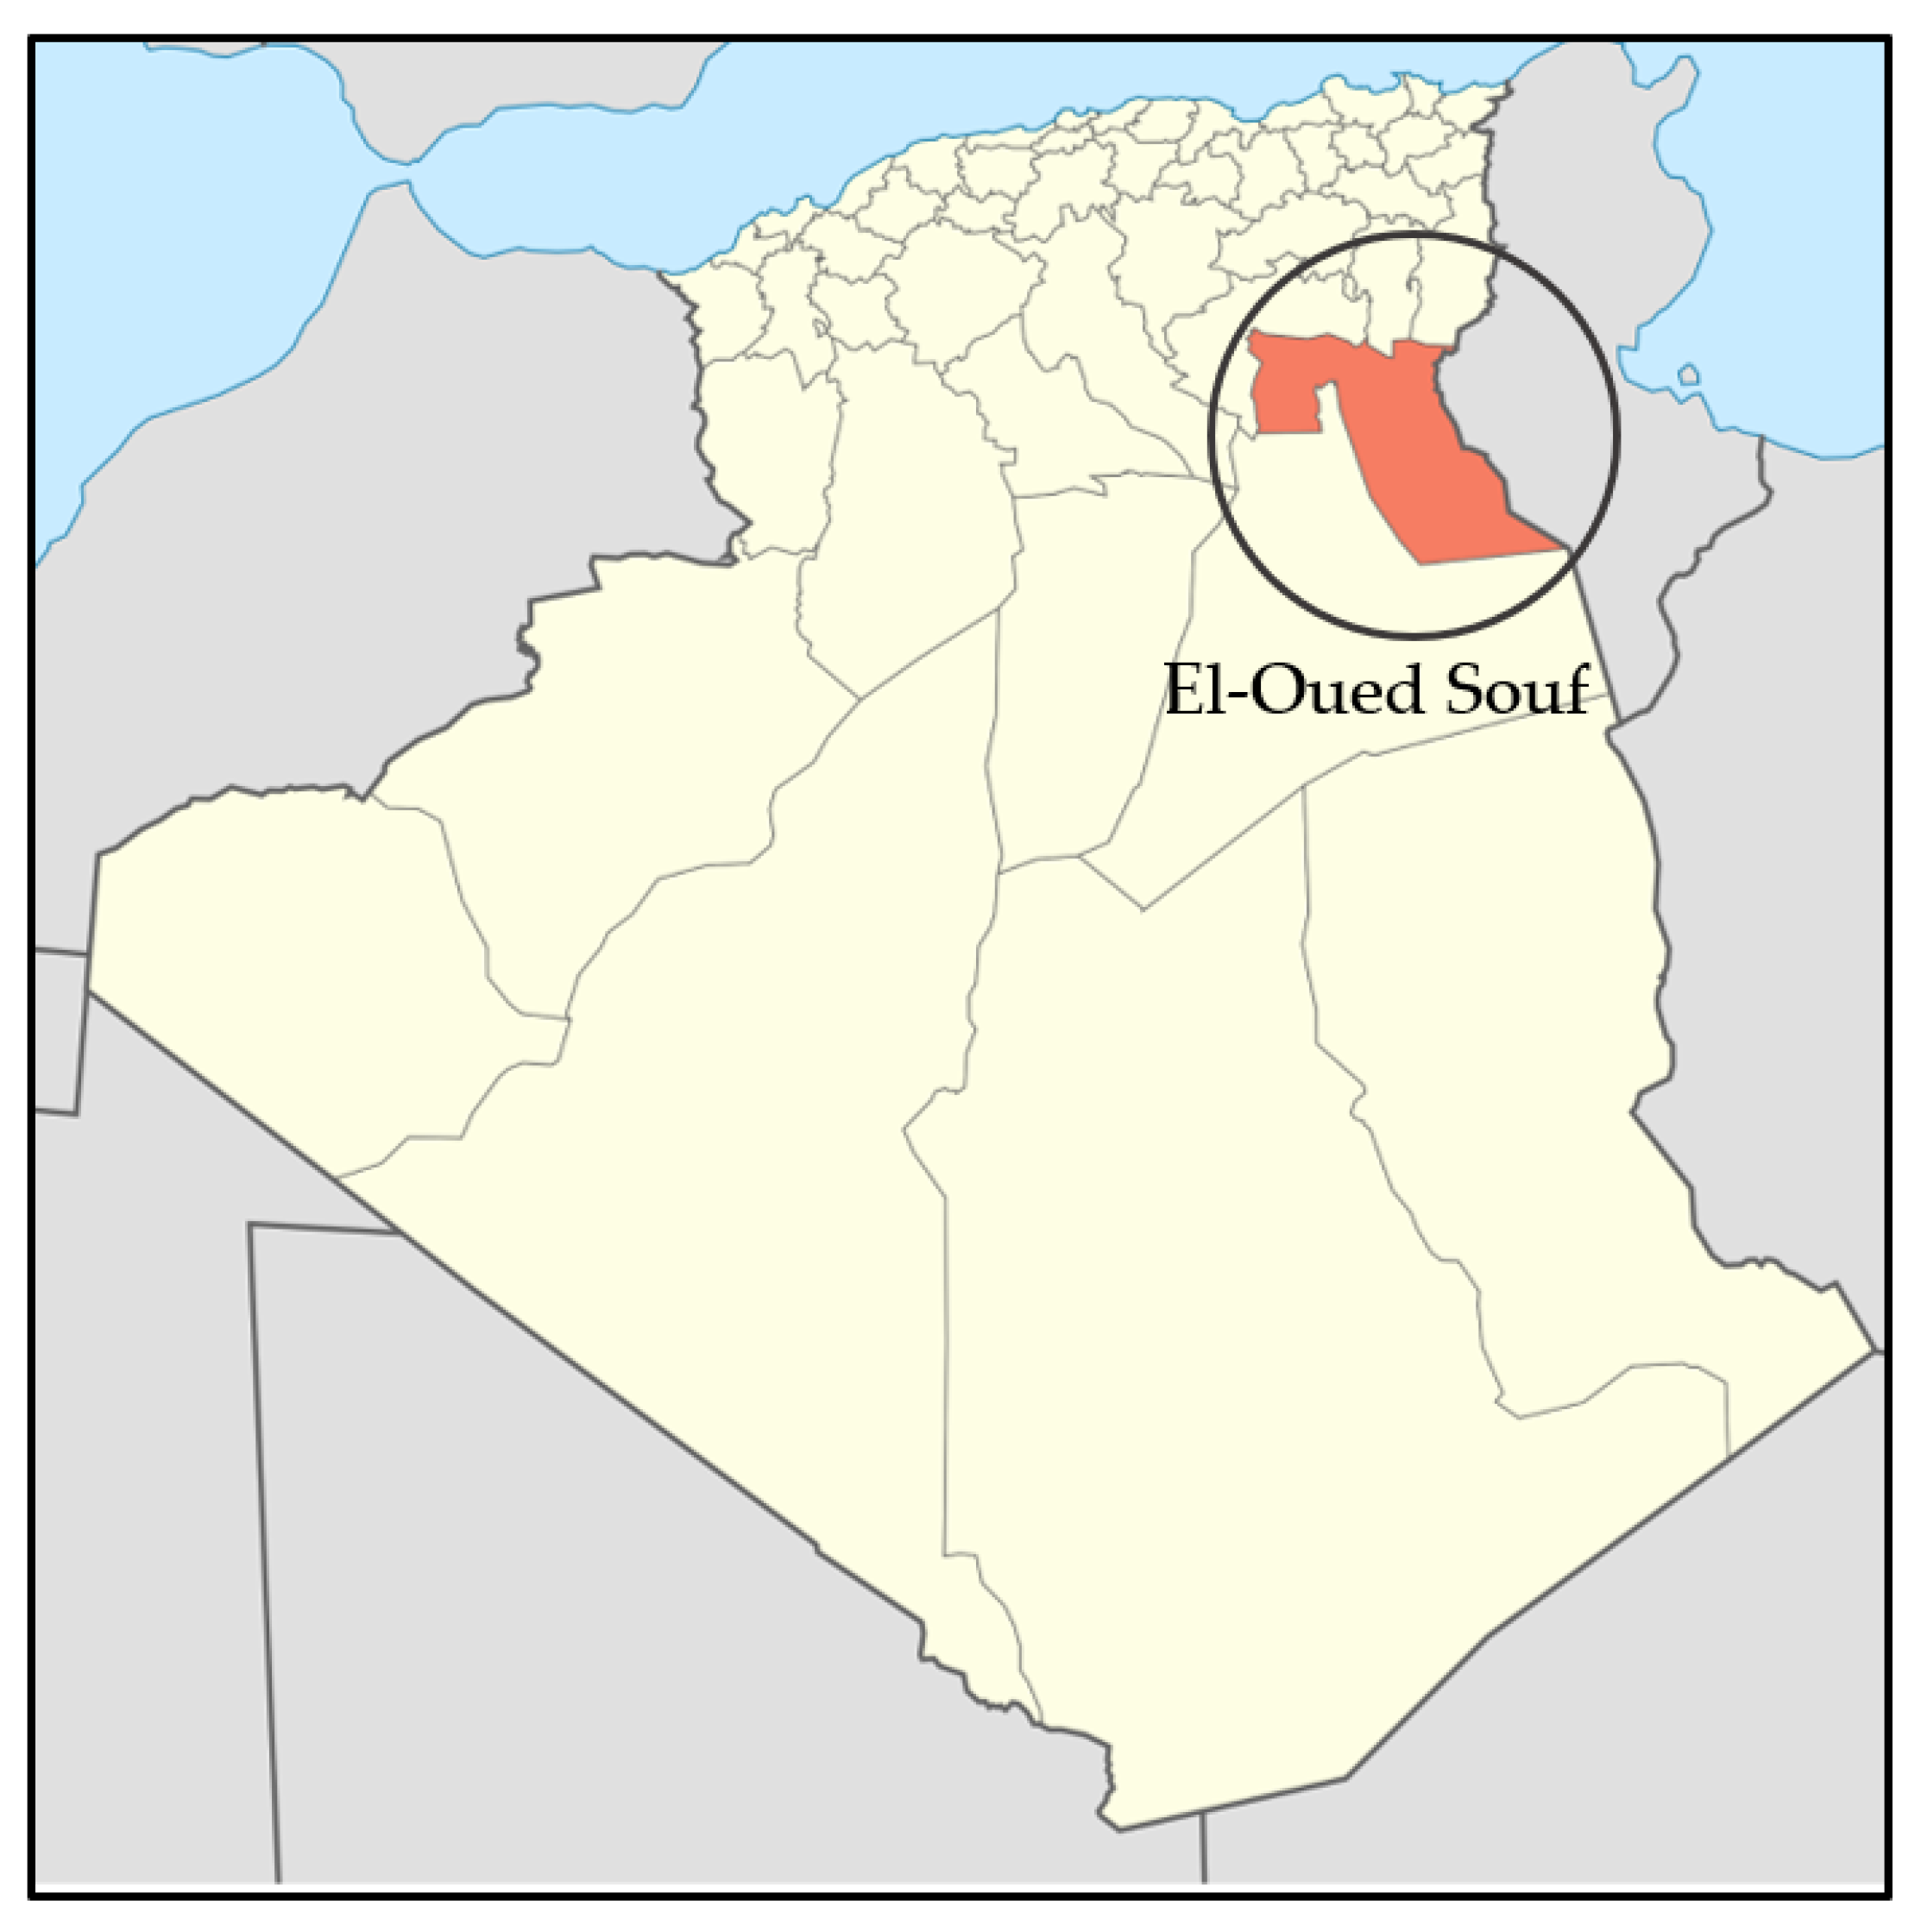
The region of El-Oued Souf is located in northeast Algeria (
Figure 4) and lies in the sand dunes of the Grand Erg Oriental [
27]. It extends over 54,573 km
2 [
28]. Human settlements such as the towns of El-Oued, Guemar, and Kouinine are situated in the middle of the sand dunes [
29]. The region of El-Oued Souf is characterized by a typical hot and dry desert climate. Wind is the most important physical constraint on the structure of the buildings and the lives of the settlers. The Bahari, the prevailing wind blowing from the east to 80 degrees northeast, is quite violent, causing heavy sand storms. In the region of El-Oued Souf, the annual average wind speed reaches values up to 9 m/s, which is well above the critical wind erosion threshold for dry sand (around 7 m/s) [
30,
31]. As a consequence, wind-blown sands frequently cover the streets and squares, in addition to causing problems by sand encroachment around the buildings.
2.1. Structure of the Settlements and Buildings
Two types of settlement occur in the regions of Souf and Gourara: ksar and nezlah [
32]. They are described below.
2.1.1. Ksar
The term ksar stands for concentrated desert villages with an urban pattern and a sedentary farming population in the Sahara Desert. The traditional quarters cluster around the market place (souk) and the main mosque [
33]. The main ksar-type settlements in the region of El-Oued Souf are El-Oued, Guemar, Taghzout, and Kouinine.
In most of the Sahara (but not in the region of El-Oued Souf), the settlements consist of a pattern of clustered and compact courtyard houses two or three storeys high, densely packed together and separated by narrow alleyways and cul de sacs [
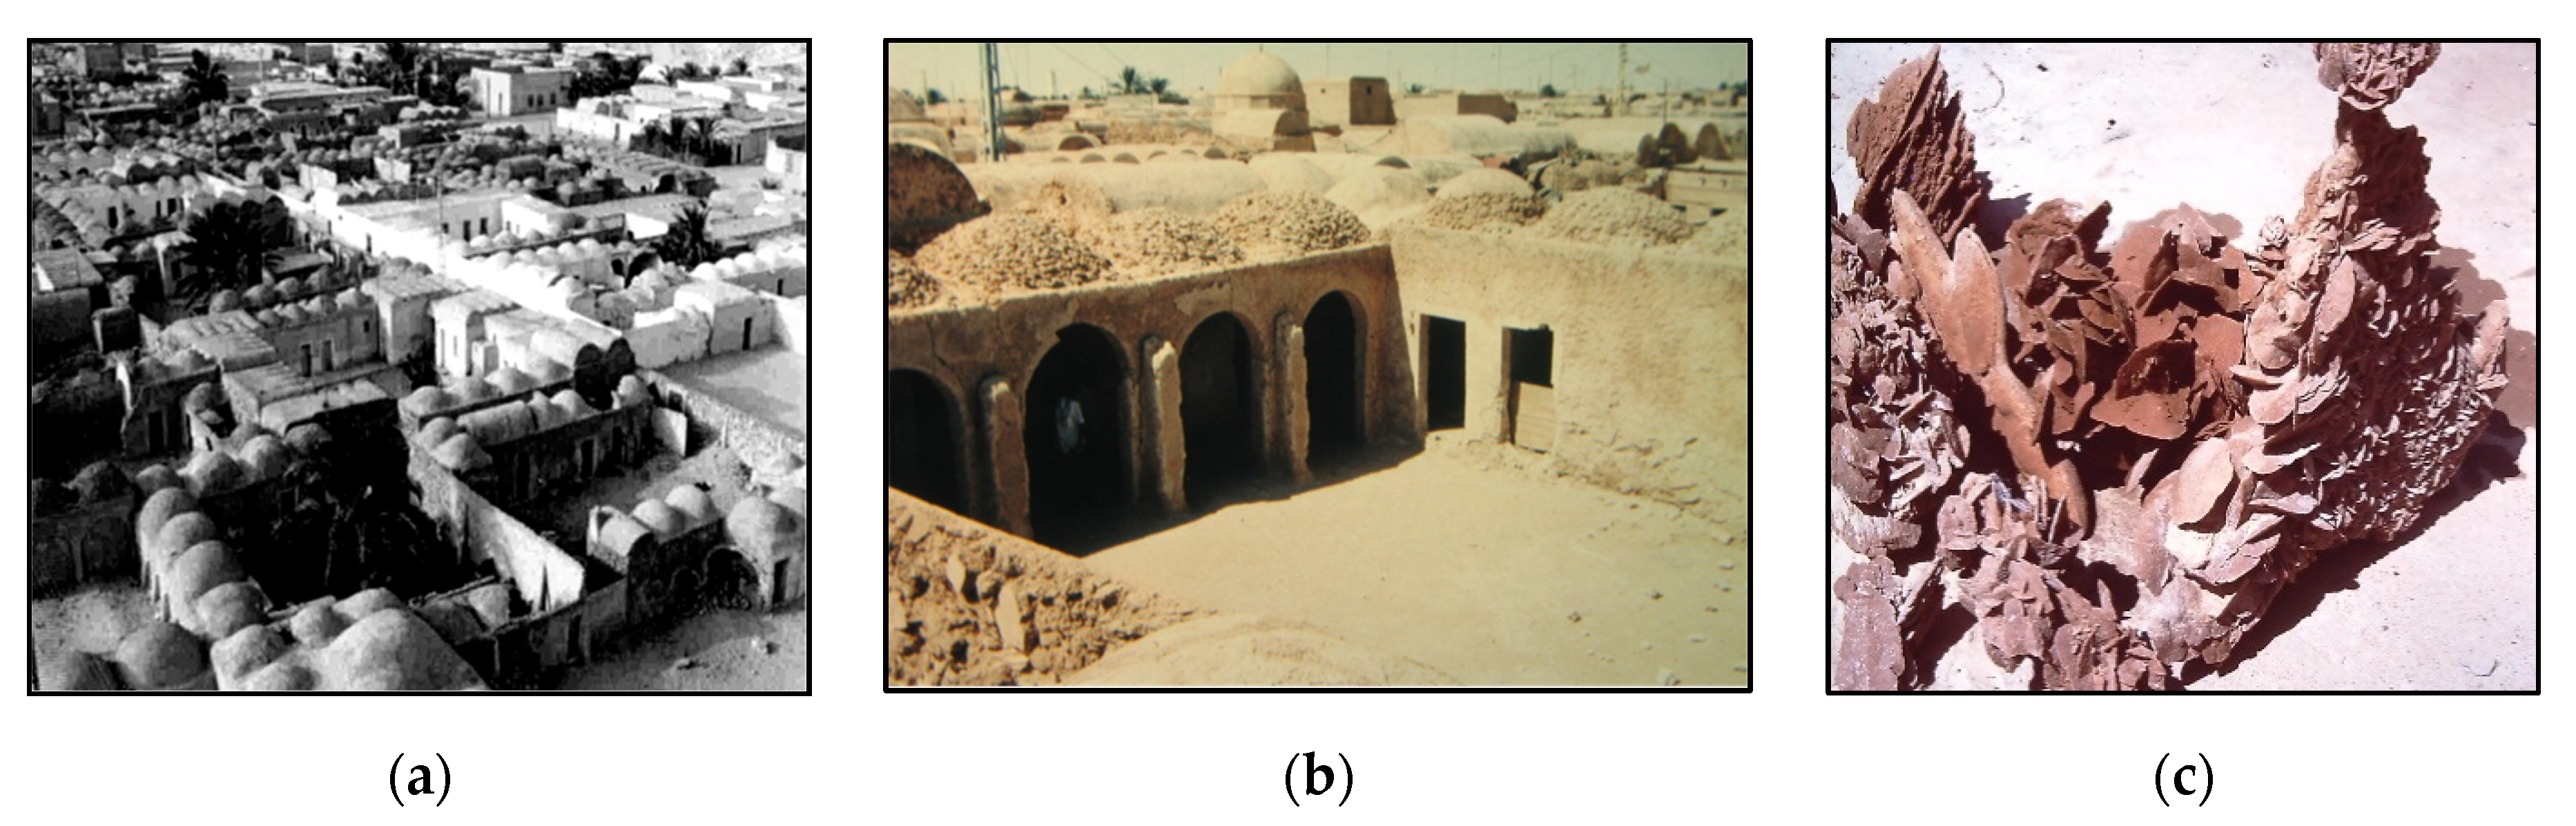
34]. This structure guarantees natural shading and minimizes the impacts of extensive heat, dryness, glare, direct radiation, and the frequent sand and dust storms that hit the area. In the region of El-Oued Souf, the layout is a modular plan of rectangular or square-shaped courtyard houses one storey high and connected together by a regular grid-like pattern of wide sandy streets and narrow alleyways (
Figure 5a). Houses are covered by plaster domes or vaults to prevent windblown sand accumulating on the roofs (
Figure 5b).
The main street axes are parallel to the prevailing wind direction. The striking uniform and regular layout of the El-Oued Souf settlements, which are located in the middle of active sand dunes and suffer from continuous sand drift and deposition, may raise the question of whether this layout could have been specially designed to minimize the undesirable consequences of sand deposition around and between the buildings.
Two main building materials—sandstone and gypsum—are available in the region, and both were used in constructing the traditional quarters of El-Oued Souf’s settlements [
35]. Sandstone (sand rose) (
Figure 5c) is created when gypsum becomes encrusted with quartz sand, forming firm and resistant irregular shapes of crystallized stone in the overlay of the sand bed [
36].
2.1.2. Nezlah
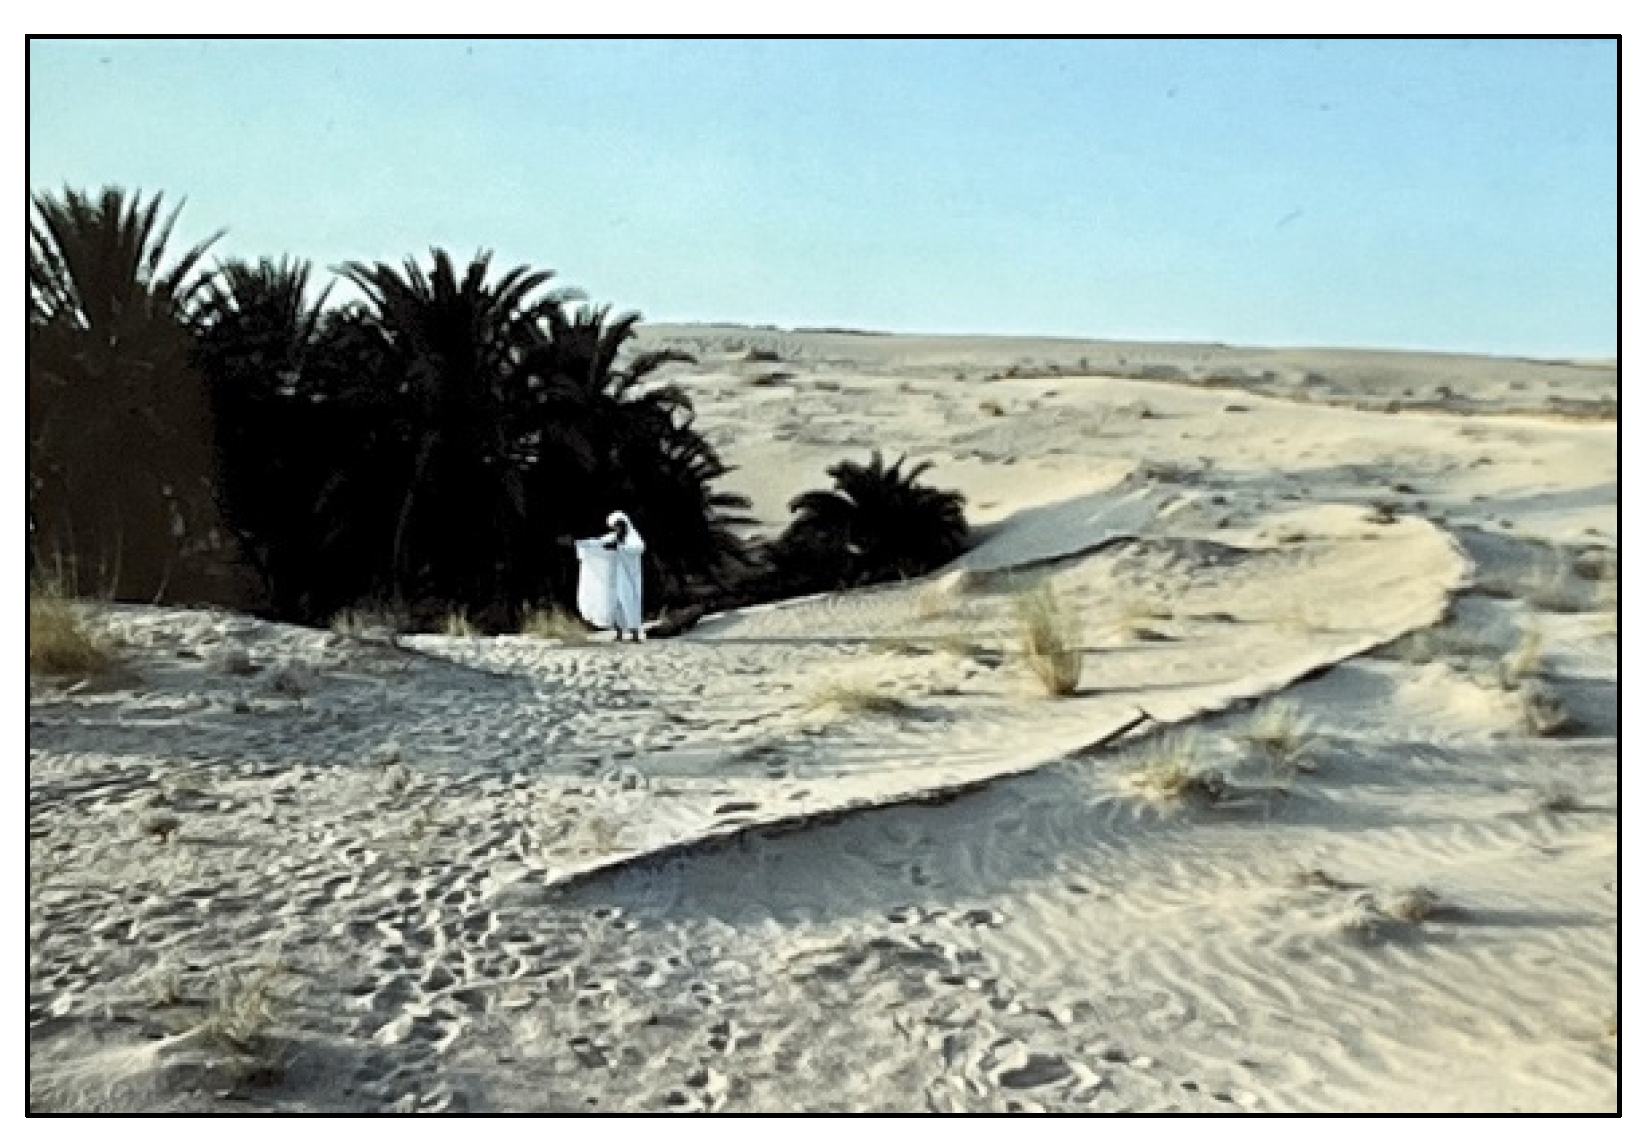
In the Souf region, Nezlah means hamlet (a small village), but elsewhere it means a settlement characterized by houses standing well apart from each other. This type of settlement is more typical for villagers and less for the nomadic population [
32]. The house-built forms are similar to those found in the ksar settlements; however, they stand more individually or are attached to each other in a spontaneously formed pattern. These hamlets are located between the palm groves or Ghouts (
Figure 6)—an old hydro agricultural system [
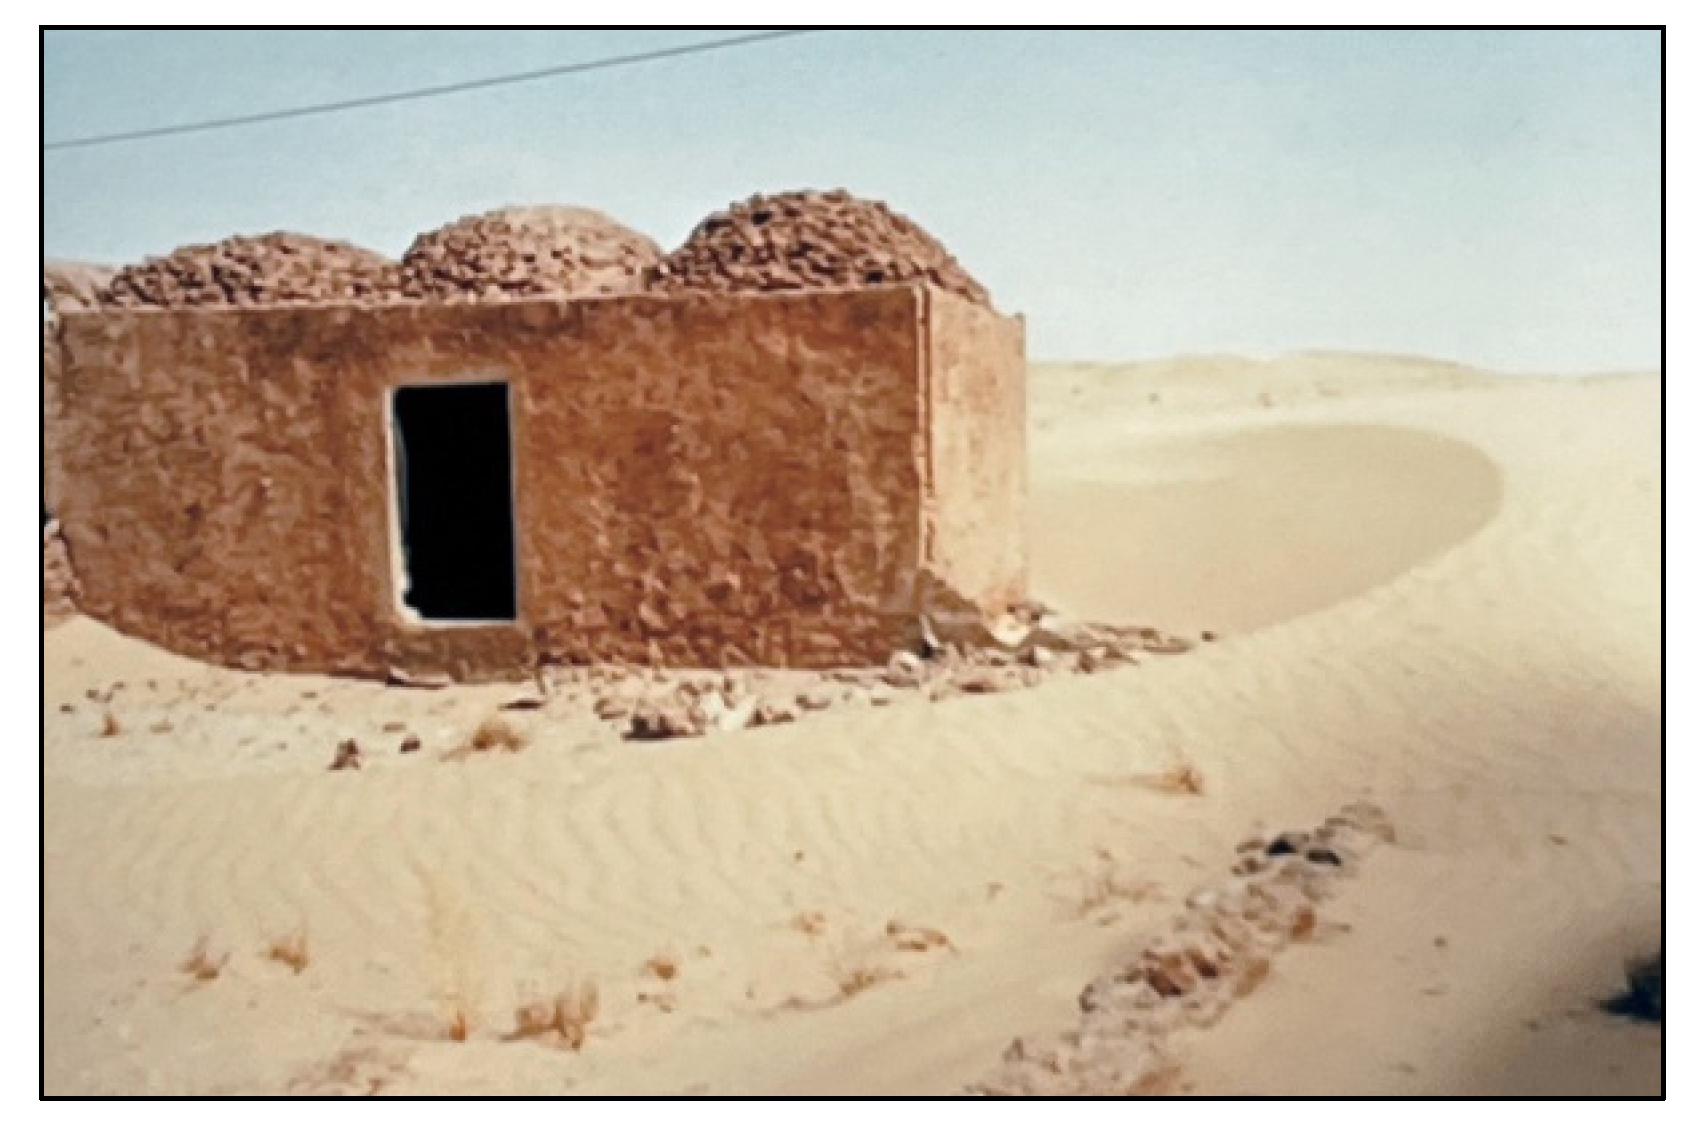
37]. They are used as summer residences by the farmers for the surveillance and maintenance of the Ghouts. Some are one-room dwellings, usually built for storage or for a short stay in the harvest season. Most of these hamlet buildings are rectangular in shape (
Figure 7), but they may differ in size. They are oriented perpendicular to the prevailing wind direction. The different patterns of sand deposition created around and between the building forms investigated in this study were all located in such hamlets.
2.1.3. Present Situation
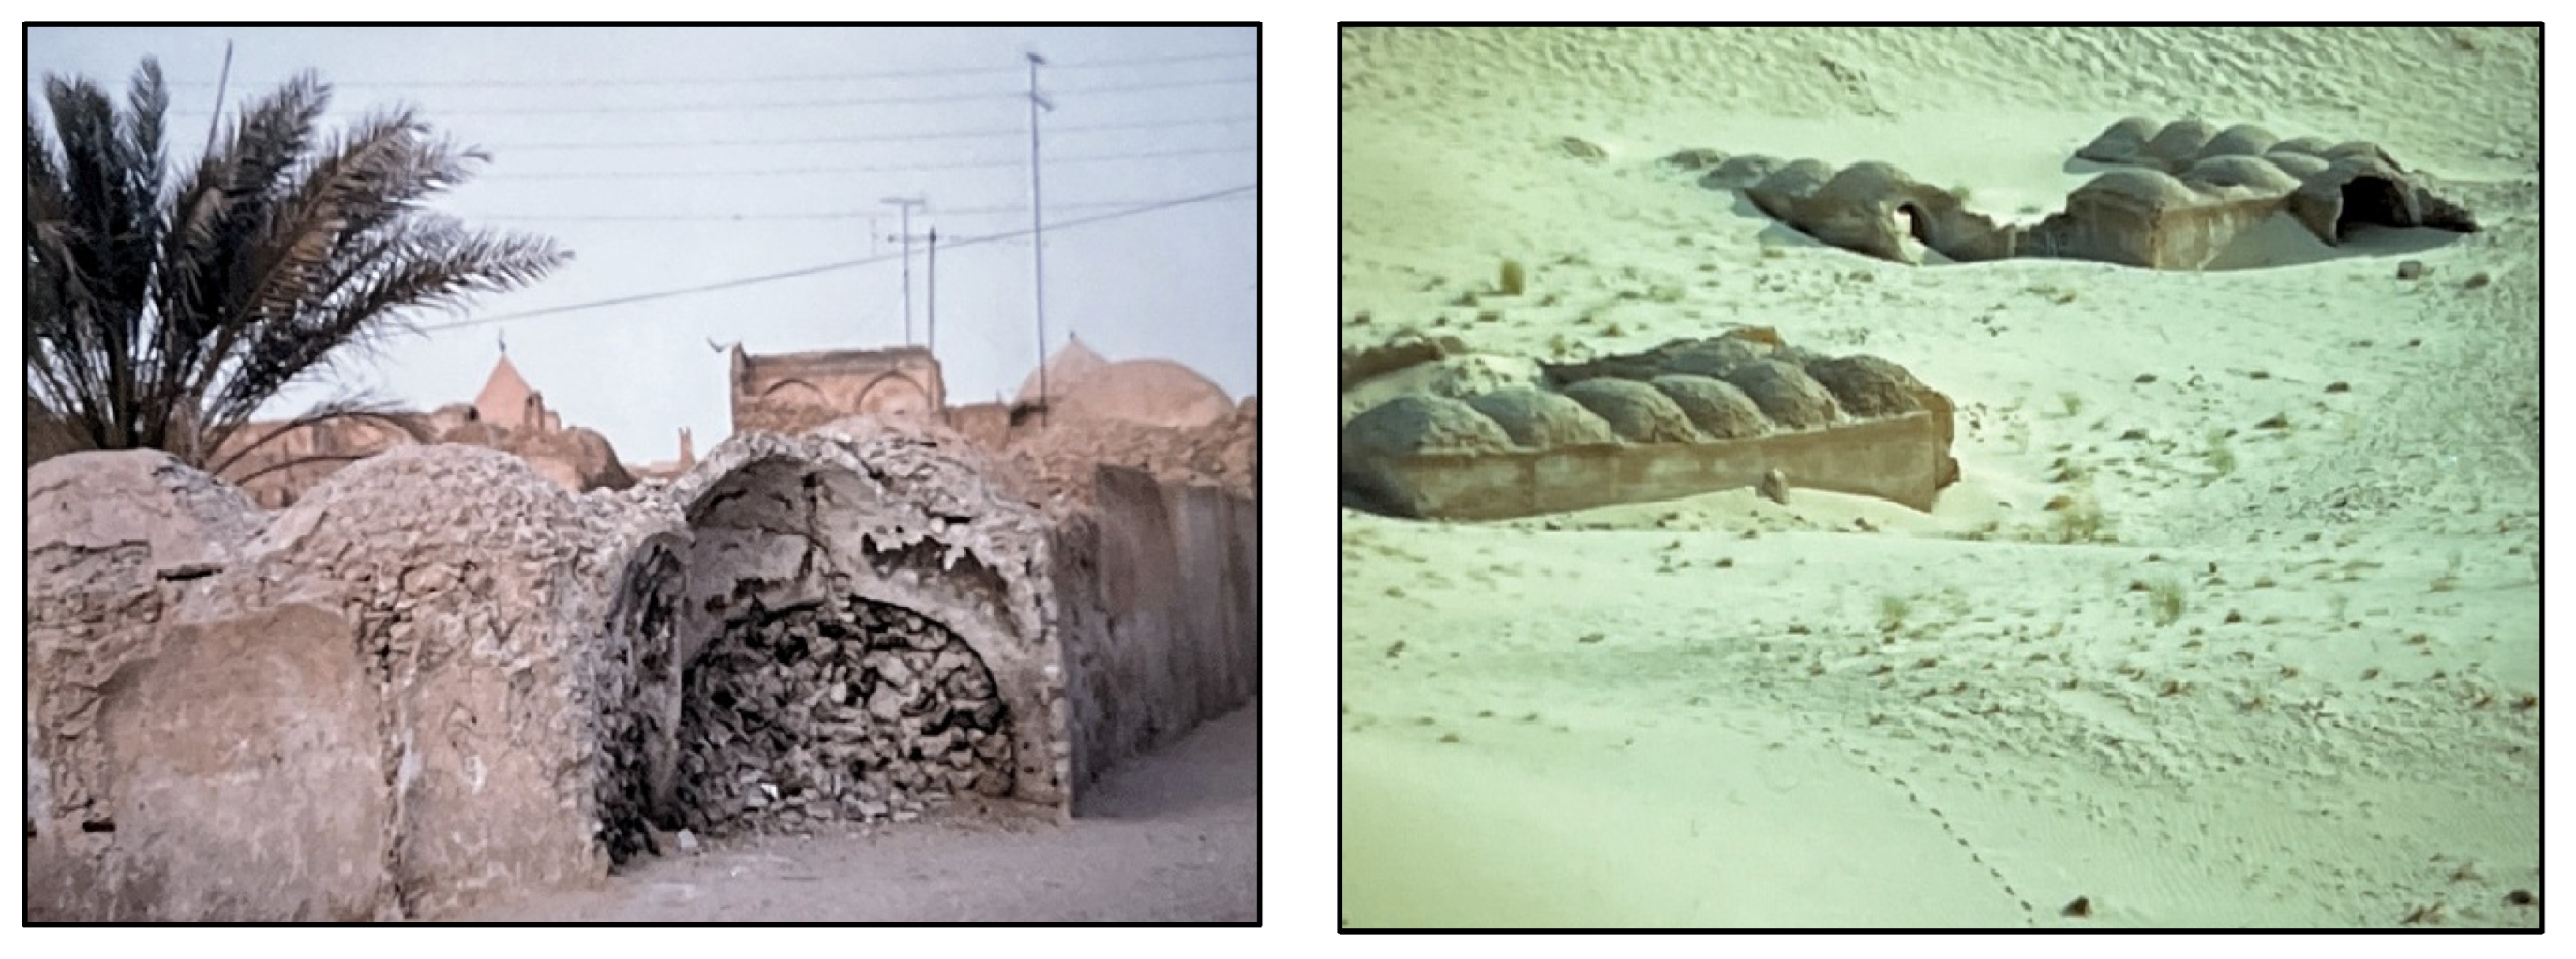
Although the traditional layout of settlements and buildings in the region of El-Oued Souf survived the destructive impact of sand deposition for hundreds of years, a large number of traditional houses are now slowly deteriorating and becoming overwhelmed by sand deposition due to changes in the physical structure of traditional quarters. For example, streets were widened to allow vehicular access, but this substantially increased the rate of sand deposition in these streets. Moreover, the poor and inadequate infrastructure in old settlements has led to the inadequate drainage of waste water and to leaking pipes. This has not only caused pollution of the water table, but also contributed to a local increase in it, which has led to the erosion of gypsum, a main building material in traditional houses. As a result, the load-bearing walls of the buildings have deteriorated and become very vulnerable to sand accumulation and burial (
Figure 8).
3. Al Madam Town in the Arabian Desert, United Arab Emirates
Sand encroachment in urban areas represents a high risk factor for urban development in the United Arab Emirates [
38]. The UAE climate is subtropical-arid, with temperatures reaching up to 45 °C in the summer. About 80% of the UAE is desert land consisting of plains, sand sheets, and sand dunes. The prevalent wind direction is west.
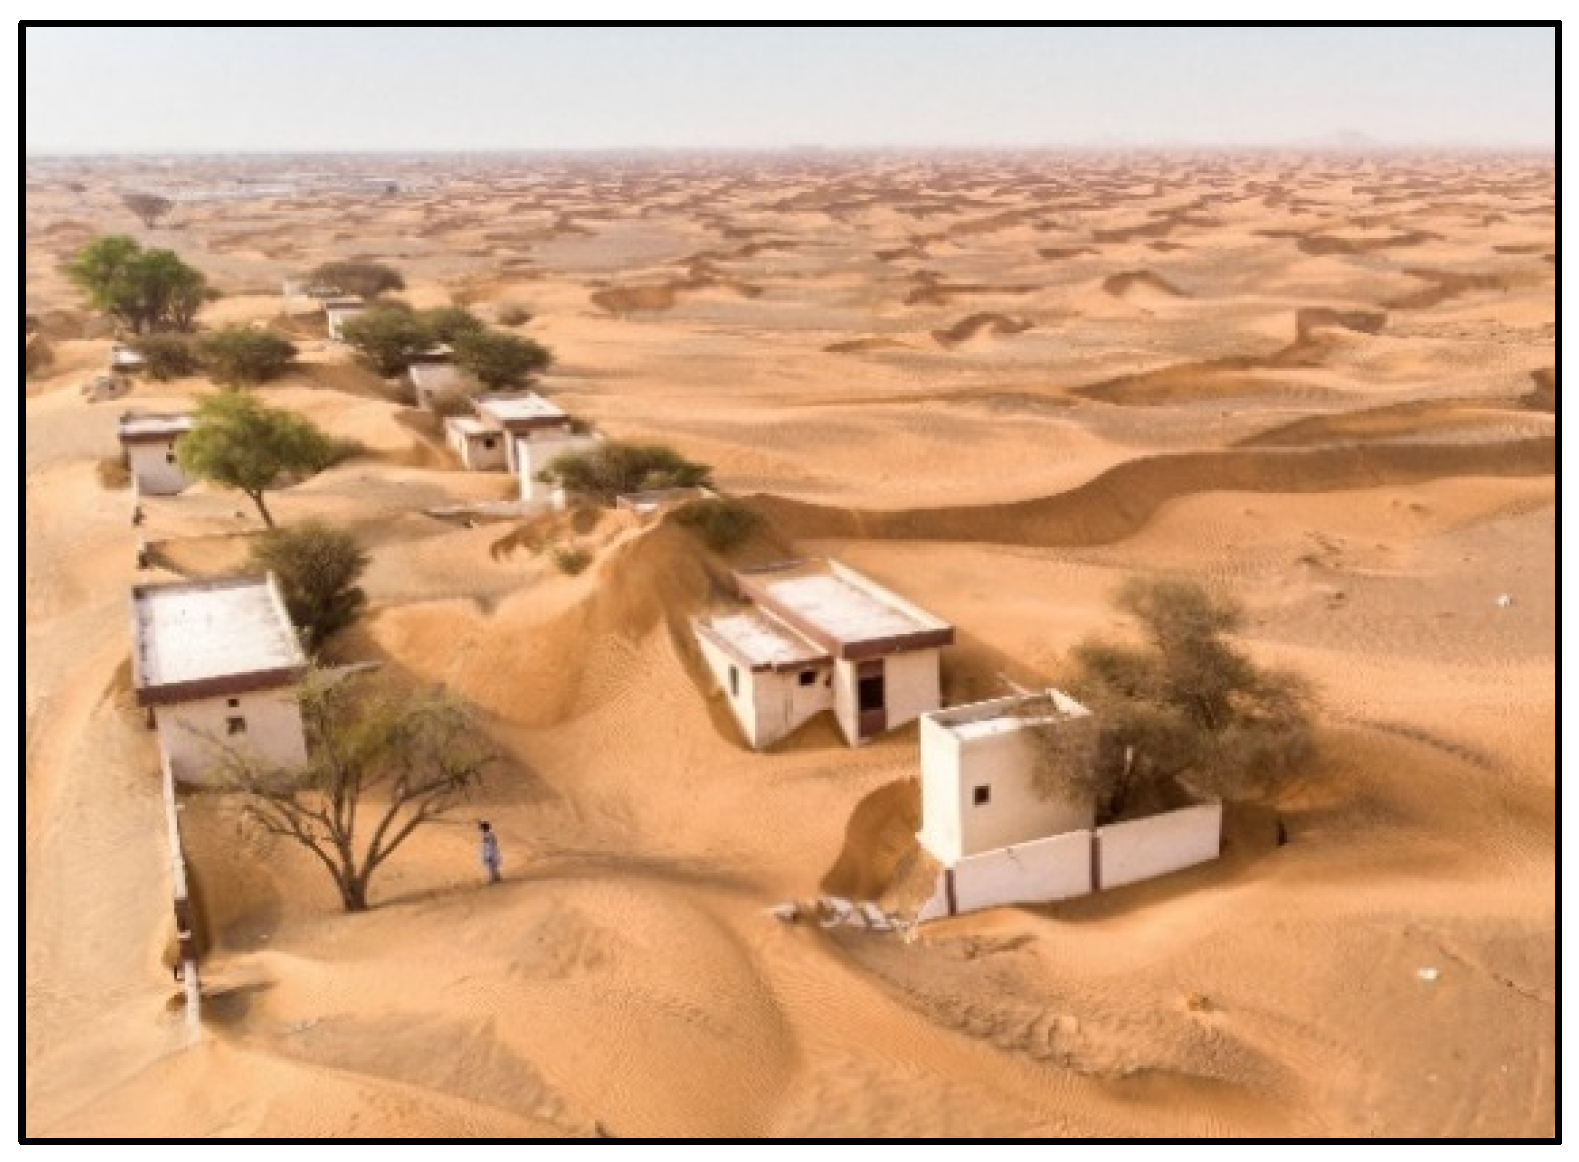
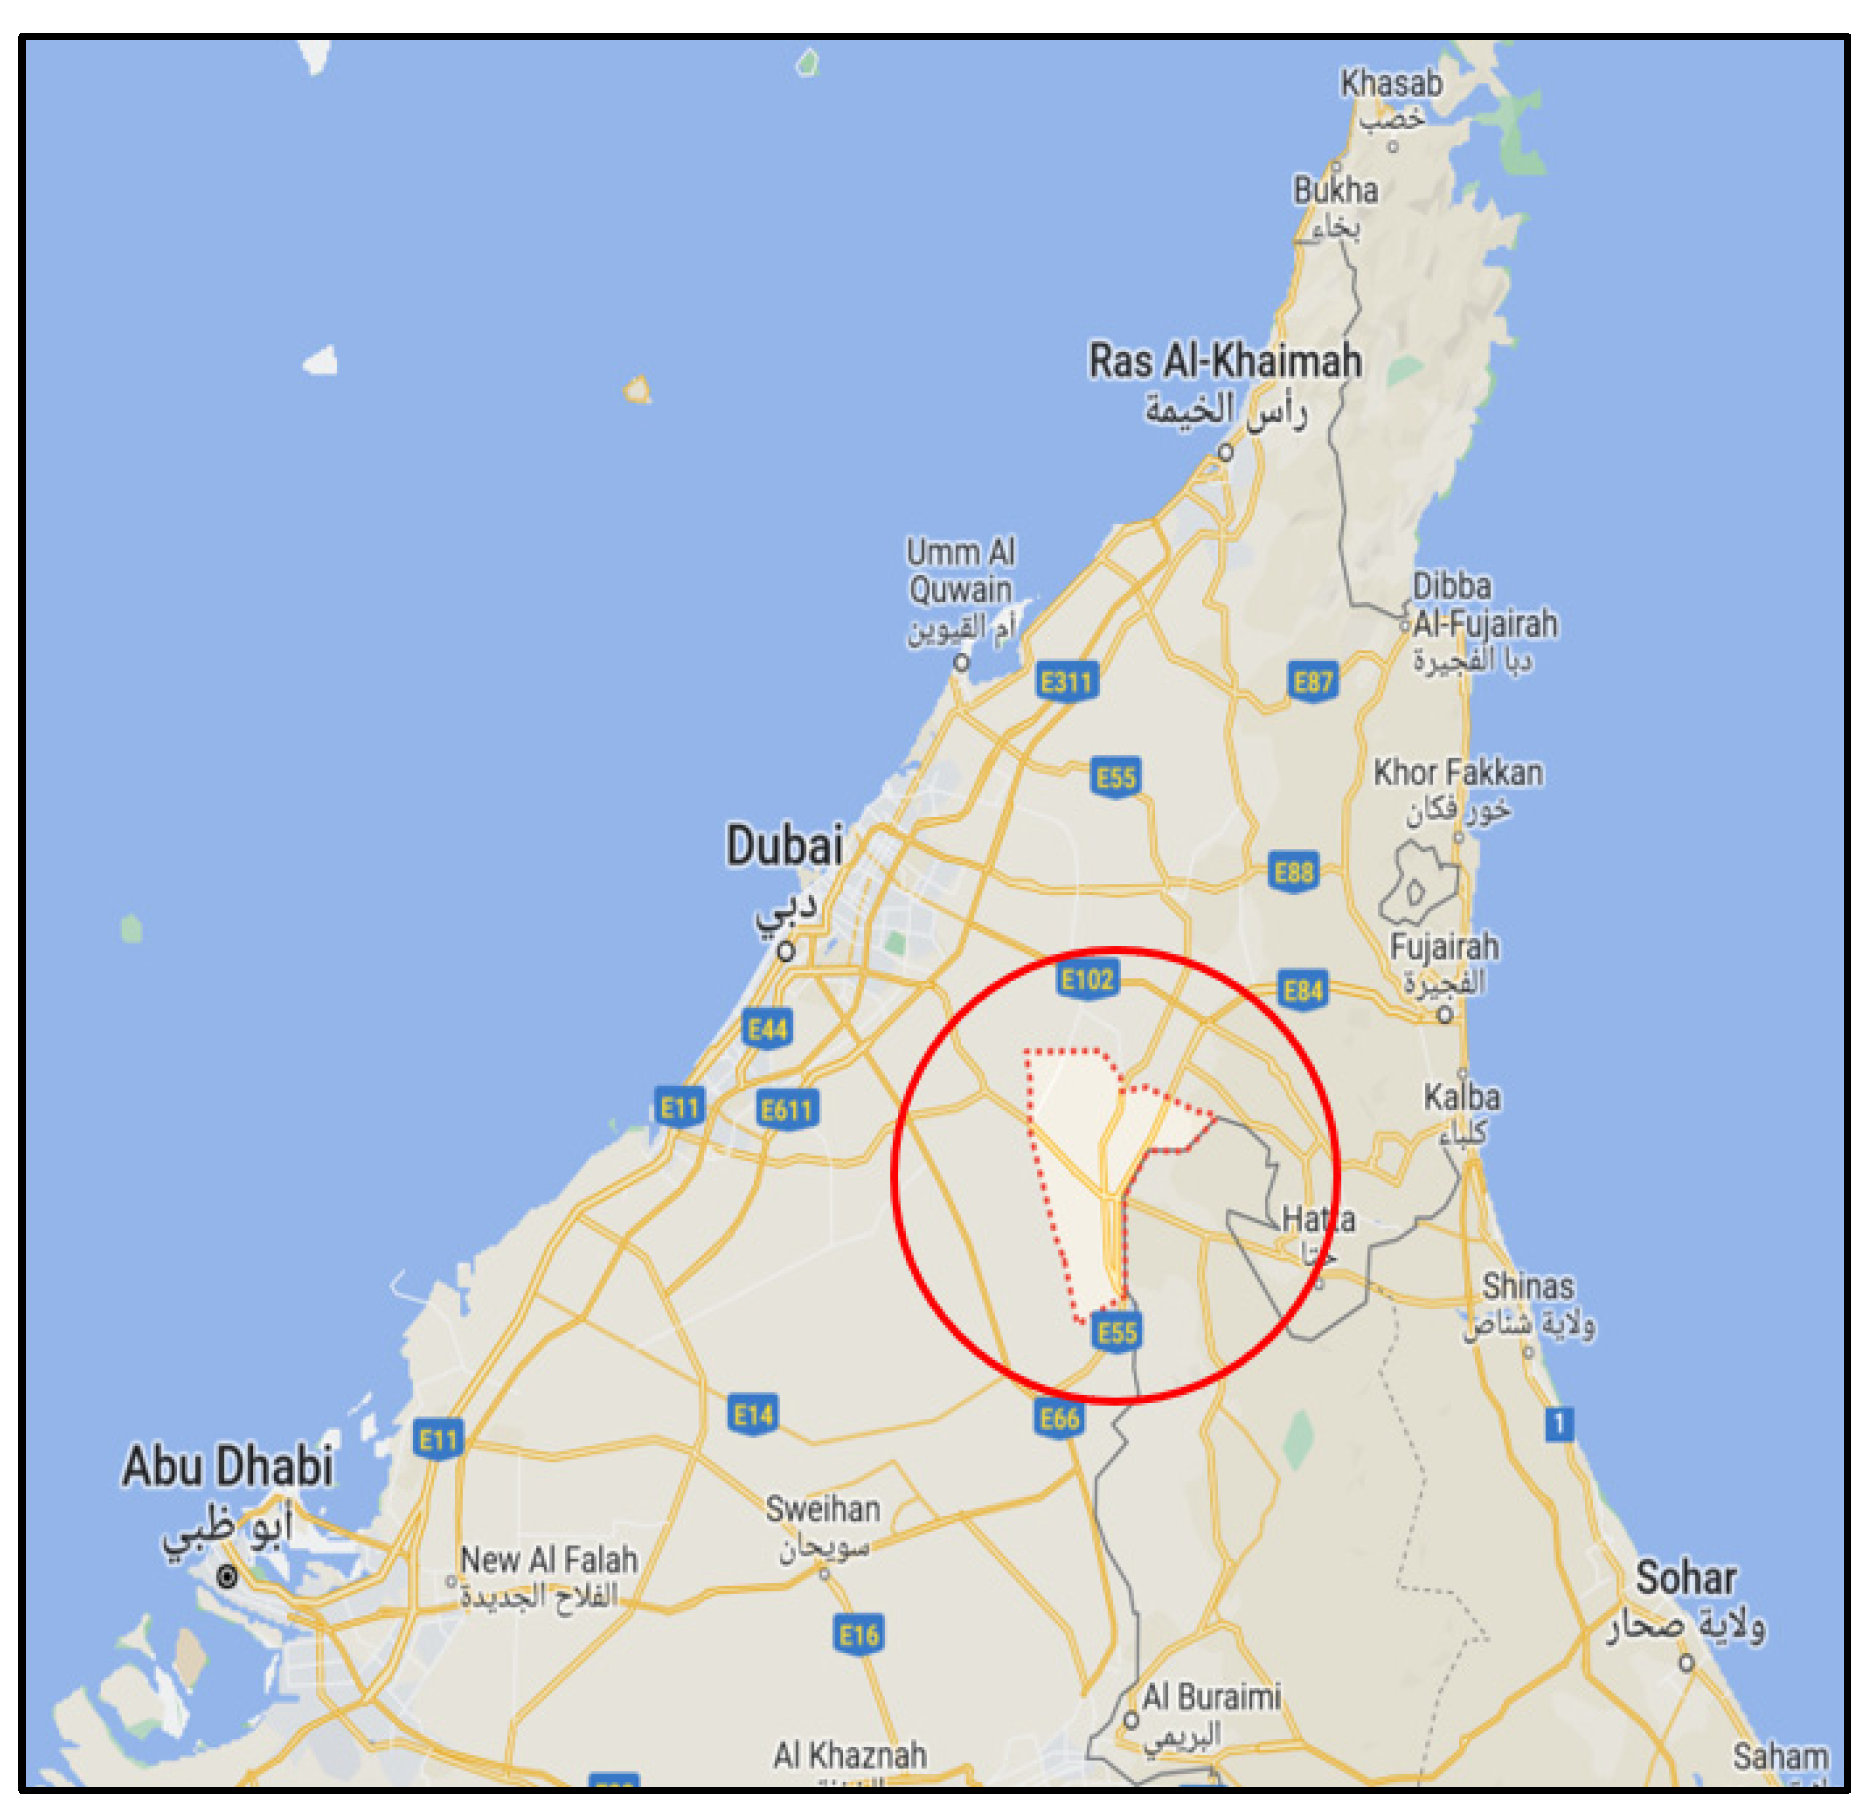
The town of Al Madam, also known as the “Buried Village”, was constructed around 1970 and is located approximately 50 km southeast of Dubai [
39] (
Figure 9). It was part of the government’s nationwide program to provide well-constructed and modern housing for the nomadic population [
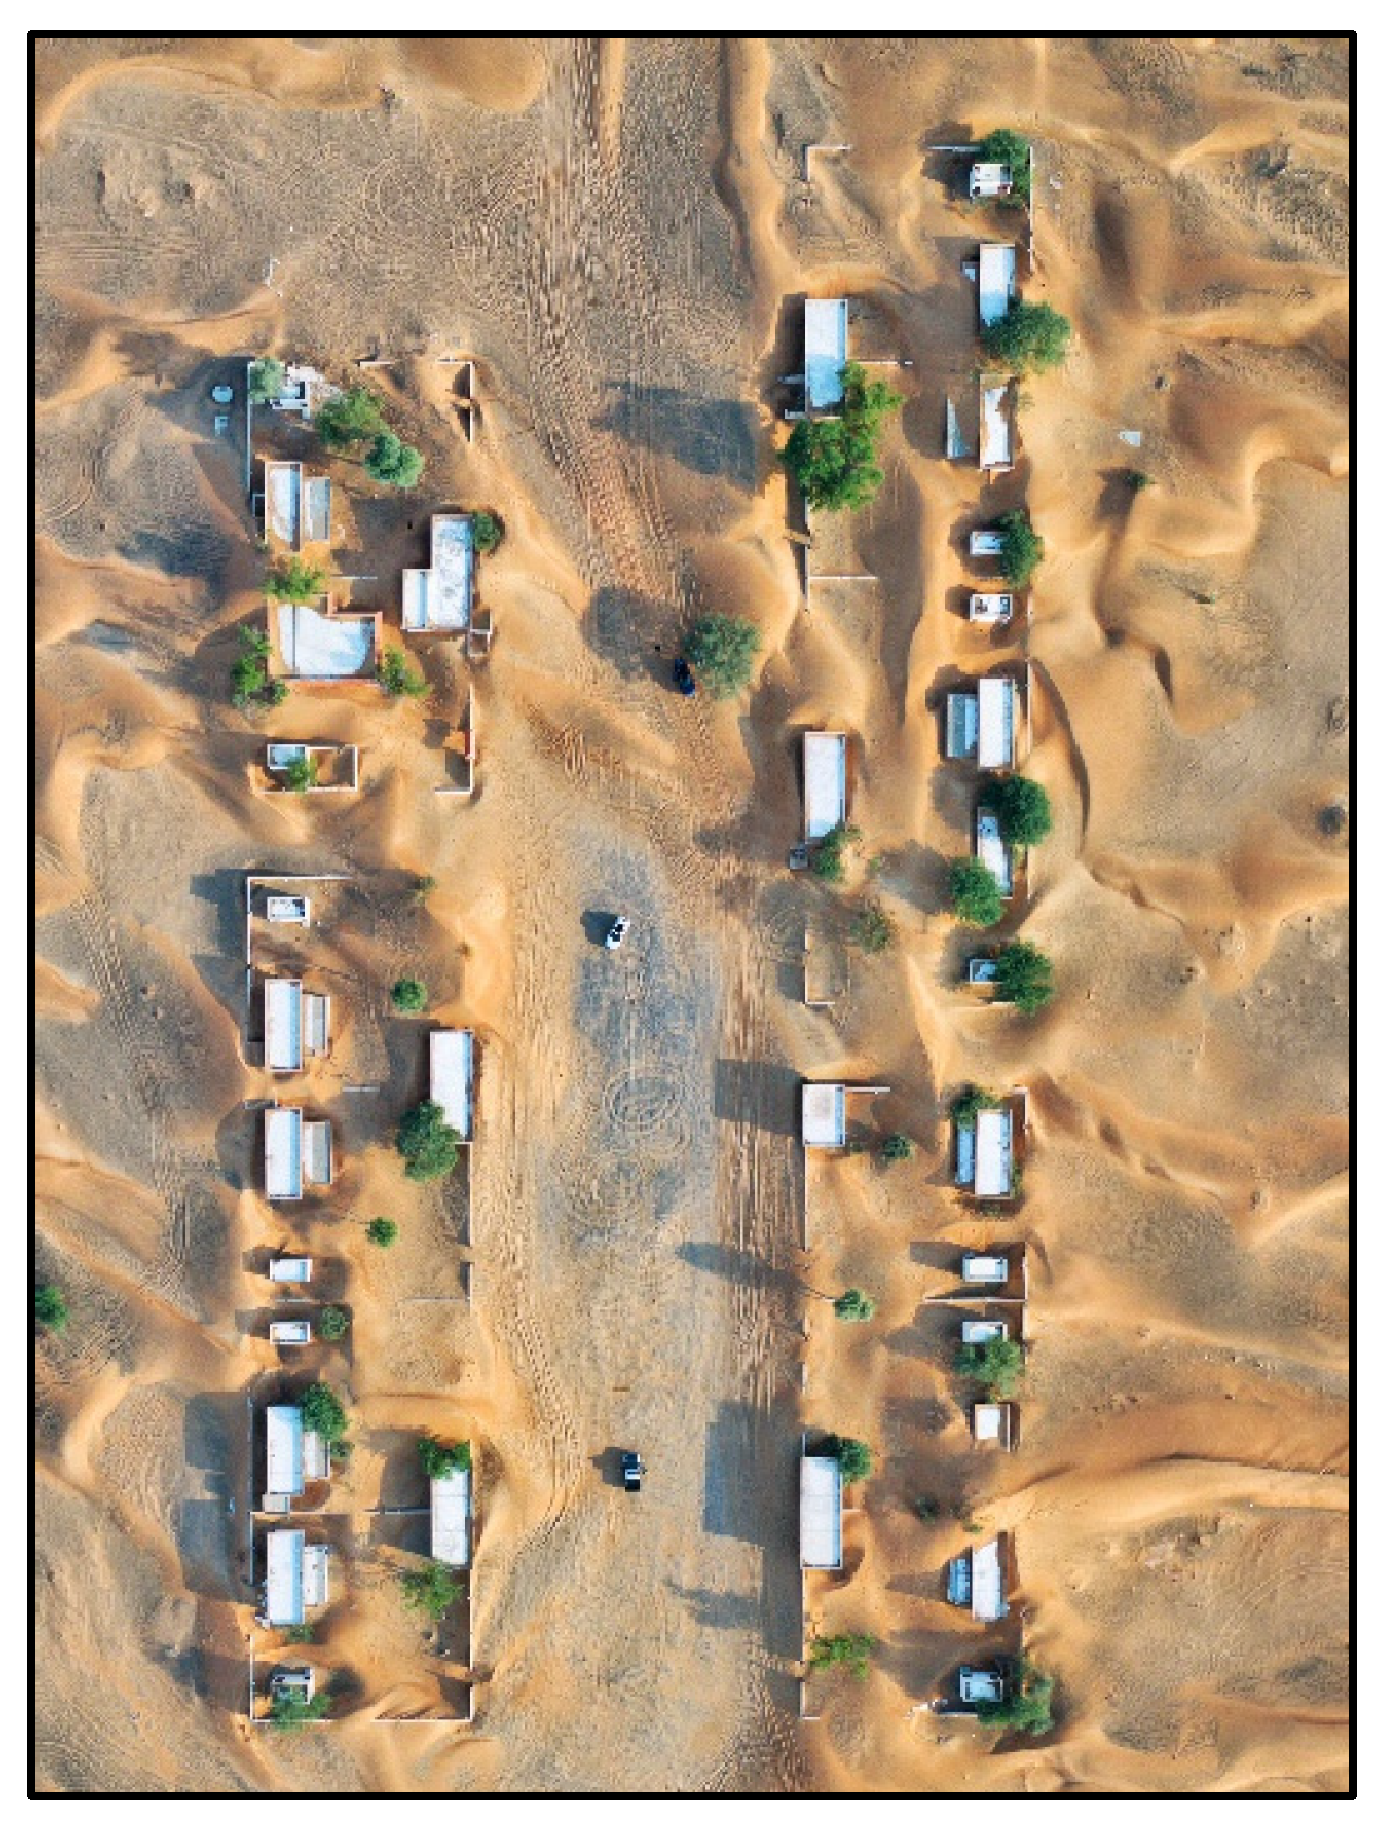
40]. Some of these new settlements were assembled very rapidly in locations close to active sand dunes (
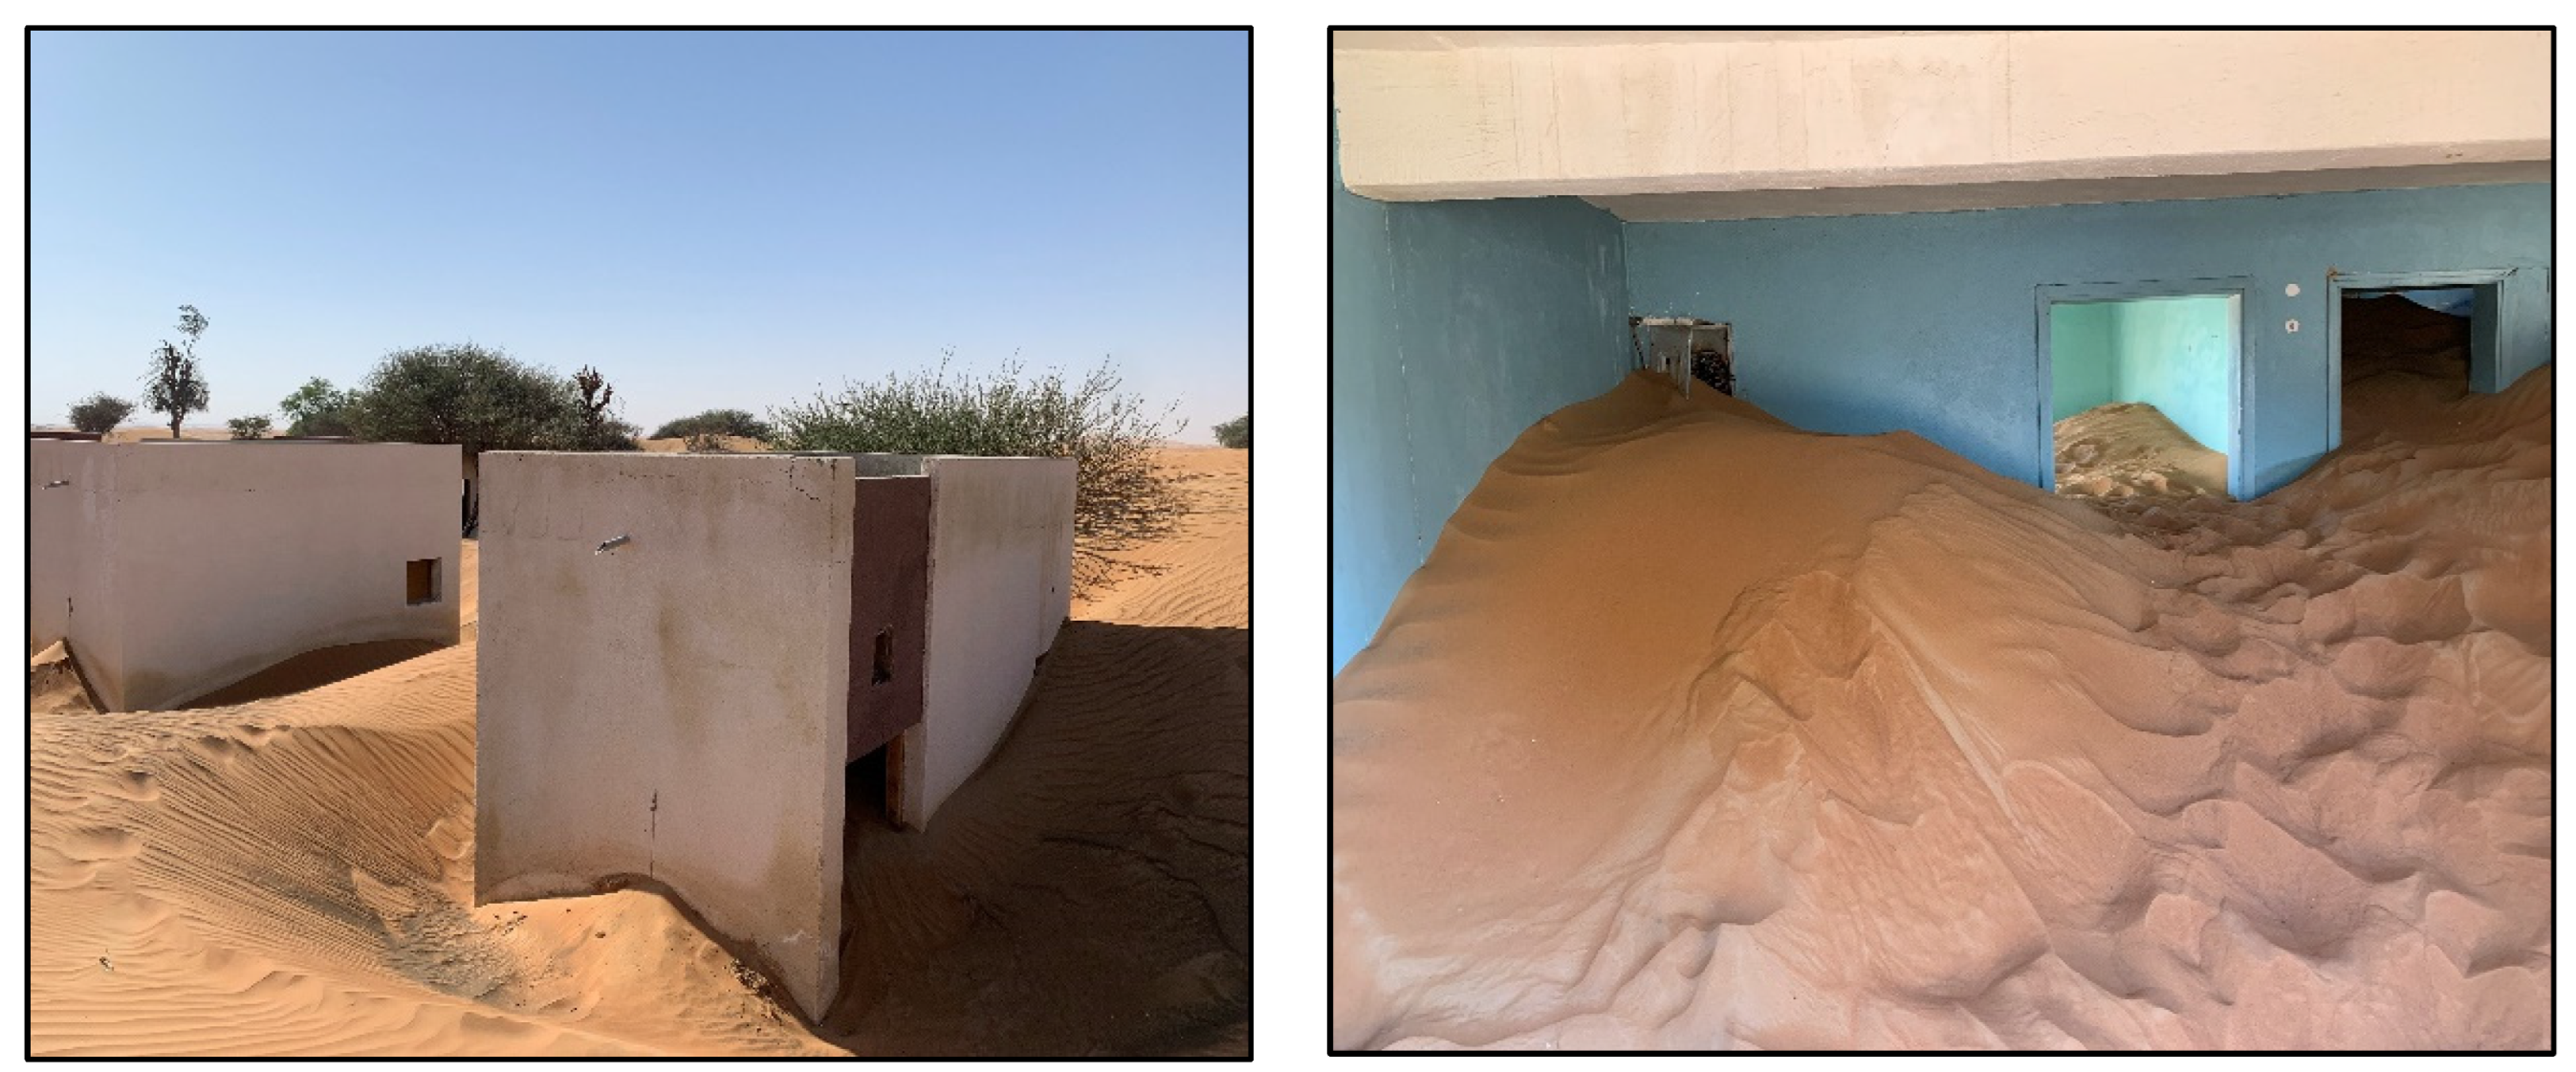
Figure 10). However, heavy sand encroachment and sand deposition around and inside the dwellings finally forced the inhabitants to abandon them (
Figure 11).
4. Experimental Design in the Wind Tunnel and Modeling Concepts
4.1. Facilities
Wind tunnel experiments were carried out in a wind tunnel at Arizona State University (ASU), Tempe, USA. It is an open-type tunnel 12.5 m long, 1 m wide, and 0.82 m high working at standard atmospheric conditions.
4.2. Similitude Parameters
The most important similarity criteria for the simulation of airflow over topography and surface objects are [
41]:
- -
Equal model and field densimetric Froude number: Fr = u/(g.L)0.5 (if there is no temperature scaling);
- -
Equal model and field Reynolds number: Re = u.L/ν
where u is the wind speed, L is a characteristic length, g is the gravitational acceleration, and ν is the kinematic viscosity. In addition, the boundary layer simulated in the wind tunnel should be a reasonable copy of at least the lowermost part of the boundary layer above the object in the field. This means that, in the wind tunnel, the object should be fully immersed in the simulated boundary layer, the shape (curvature) of the wind velocity profile must be identical to its shape in the field, and the roughness length in the simulation must be adequately scaled to the roughness length in the field. In addition, blockage in the wind tunnel should remain low enough to avoid artificial flow accelerations in the tunnel’s test section.
If sand deposition or erosion patterns are simulated adjacent to an obstacle, additional parameters that should be considered are (see also [
42,
43]):
- -
Deposition (or erosion) depth ratio (d/D);
- -
Ratio of grain diameter to obstacle diameter (Dp/D);
- -
Ratio of wind speed (at a given reference height) to the particle’s terminal fall velocity (u/u∞);
- -
Ratio of particle density to fluid density (ρp/ρf);
- -
Geometric similarity (scale reduction should be identical in all directions)
where d = dimension (depth or height) of the sand deposition or erosion structure. The other symbols are defined above.
For a theoretically perfect simulation, all the above-listed conditions have to be met. In reality, this is not possible, especially if the processes are to be simulated at a reduced scale. For example, matching the Froude number would lead to using unrealistically small particles, which will be transported in suspension instead of saltation. Moreover, the wind speed would be far below the threshold speed so that no sand motion would take place. On the other hand, a strict matching of the Reynolds number is not necessary once the airflow is sufficiently turbulent. The most recommended way to guarantee a reliable simulation is to ensure that a good compromise between the simulation criteria is achieved, in which the most critical requirements are met. The next section describes how this was carried out for the experiments reported in this study.
4.3. Experimental Setup
For the scale models of the buildings, we used wooden blocks cut to the desired shape (combination of length, width, and height). The scale reduction compared to the field buildings was 1:50, which was enough to retain sufficiently large models without introducing blockage problems to the wind tunnel. For the largest model used (8 cm × 8 cm × 24 cm) the blockage percentage was 2.3%, which is below the critical value of 3% suggested by [
44]. No distortion of length, width, or height was applied to the models; therefore, the requirement of geometric similarity was met.
According to Tsoar, 1983 [
11], for scale model simulations of sand deposition around objects (in air), it is recommended to use a combination of very fine sand and wind speeds just above the erosion threshold. To meet this, we used well-sorted sand with a median diameter of 125 µm and a free-stream wind velocity of 6.0 m/s during each experiment, which is only slightly above the erosion threshold (5.6 m/s for the sand we used). The ratio of particle fall velocity (for D
p = 125 µm) to friction velocity was 3.03, which is well above the critical value of 1.25 that guarantees particle transport in saltation [
45].
A 500-cm long sand bed was installed in the wind tunnel to create the boundary layer. This produced a boundary layer about 40 cm thick, which is well above the height of the building models. All models were, thus, fully immersed in the boundary layer. Curvature of the velocity profile (expressed by the exponent when the profile is described by a power function) was typical for flow over rather flat terrain (exponent of 0.14 or 1/7), similar to the field sites in Algeria and the UAE. Roughness length was 4.2 µm, corresponding to 208 µm at full scale.
The Reynolds number during the experiments was 2.1 × 10
6. This is sufficiently high to obtain Reynolds number independence for flow over surface roughness elements higher than 3 cm [
46,
47]. Since the minimum height of the building models used in the experiments was 8 cm, the simulated flow may thus be considered Reynolds number independent.
By performing the experiments with natural sand in air, the ratio of particle density to fluid density was identical in the wind tunnel and in the field.
4.4. Experimental Procedure
To create the boundary layer, a 500-cm long sand bed was installed over the entire width of the wind tunnel’s test section. As described in
Section 4.3, the median diameter of the sand was 125 µm. The bed was levelled with a wooden stick spanning the whole tunnel width until a thickness of 2 cm was reached. A freestream wind speed of 6.0 m s
−1 (measured with a Pitot tube above the tunnel’s center line) was then generated, creating a close-to-homogeneous sand stream from the sand bed.
To measure the dimensions (length, width, and thickness) of the sand accumulation patterns, graph paper with 2 cm × 2 cm grid lines was placed on the wind tunnel floor, with the grid axes parallel and perpendicular to the direction of wind and sand transport. Paper with 0.5 cm × 0.5 cm grid lines was also glued onto all sides of the building models. The models were then installed on the graph paper, near the center line of the wind tunnel, at a distance of 2 cm from the downwind end of the sand bed. The models’ frontal façades were always perpendicular to the sand supply.
Photographs were taken during and after the experiments to determine the length and width of the sand patterns that formed around the models. Both vertical and plan view photos (taken perpendicular to the sand flow direction) were used. To monitor the intermediate stages of sand deposition growth, stops were made at regular intervals throughout each run (see below) and pictures taken of the buildup of sand. In addition, video camera recordings were utilized to record the experimental procedure and process. The topographical features of sand deposition, such as the sand ridges and the crests, were observed or detected in the photographs by the shadows created by projecting a horizontal beam of light from the inlet section of the wind tunnel. The thickness of the sand accumulations was measured by using a small, gridded scale level.
The duration of the experiments depended on how long it took for the sand pattern to stabilize. To determine this, each run was stopped at intervals of approximately five minutes to photograph the growth of the sand accumulation. The experiment was terminated once a stage of equilibrium had been reached; at that time, the sand patterns in the wind tunnel were similar to those observed in the field. For most experiments, the run time was between 20 and 30 min.
4.5. Validity Tests
To check whether the experimental conditions described above (combination of wind speed just above the erosion threshold, particle size of around 125 µm, models fully immersed in the boundary layer, wind profile with a correct curvature, blockage percentage less than 3%) resulted in reliable sand patterns, three tests were performed in which the wind tunnel patterns were compared to the corresponding field patterns. The first two of these tests were performed in the Arizona State University wind tunnel, the third in the KU Leuven wind tunnel. The first test (
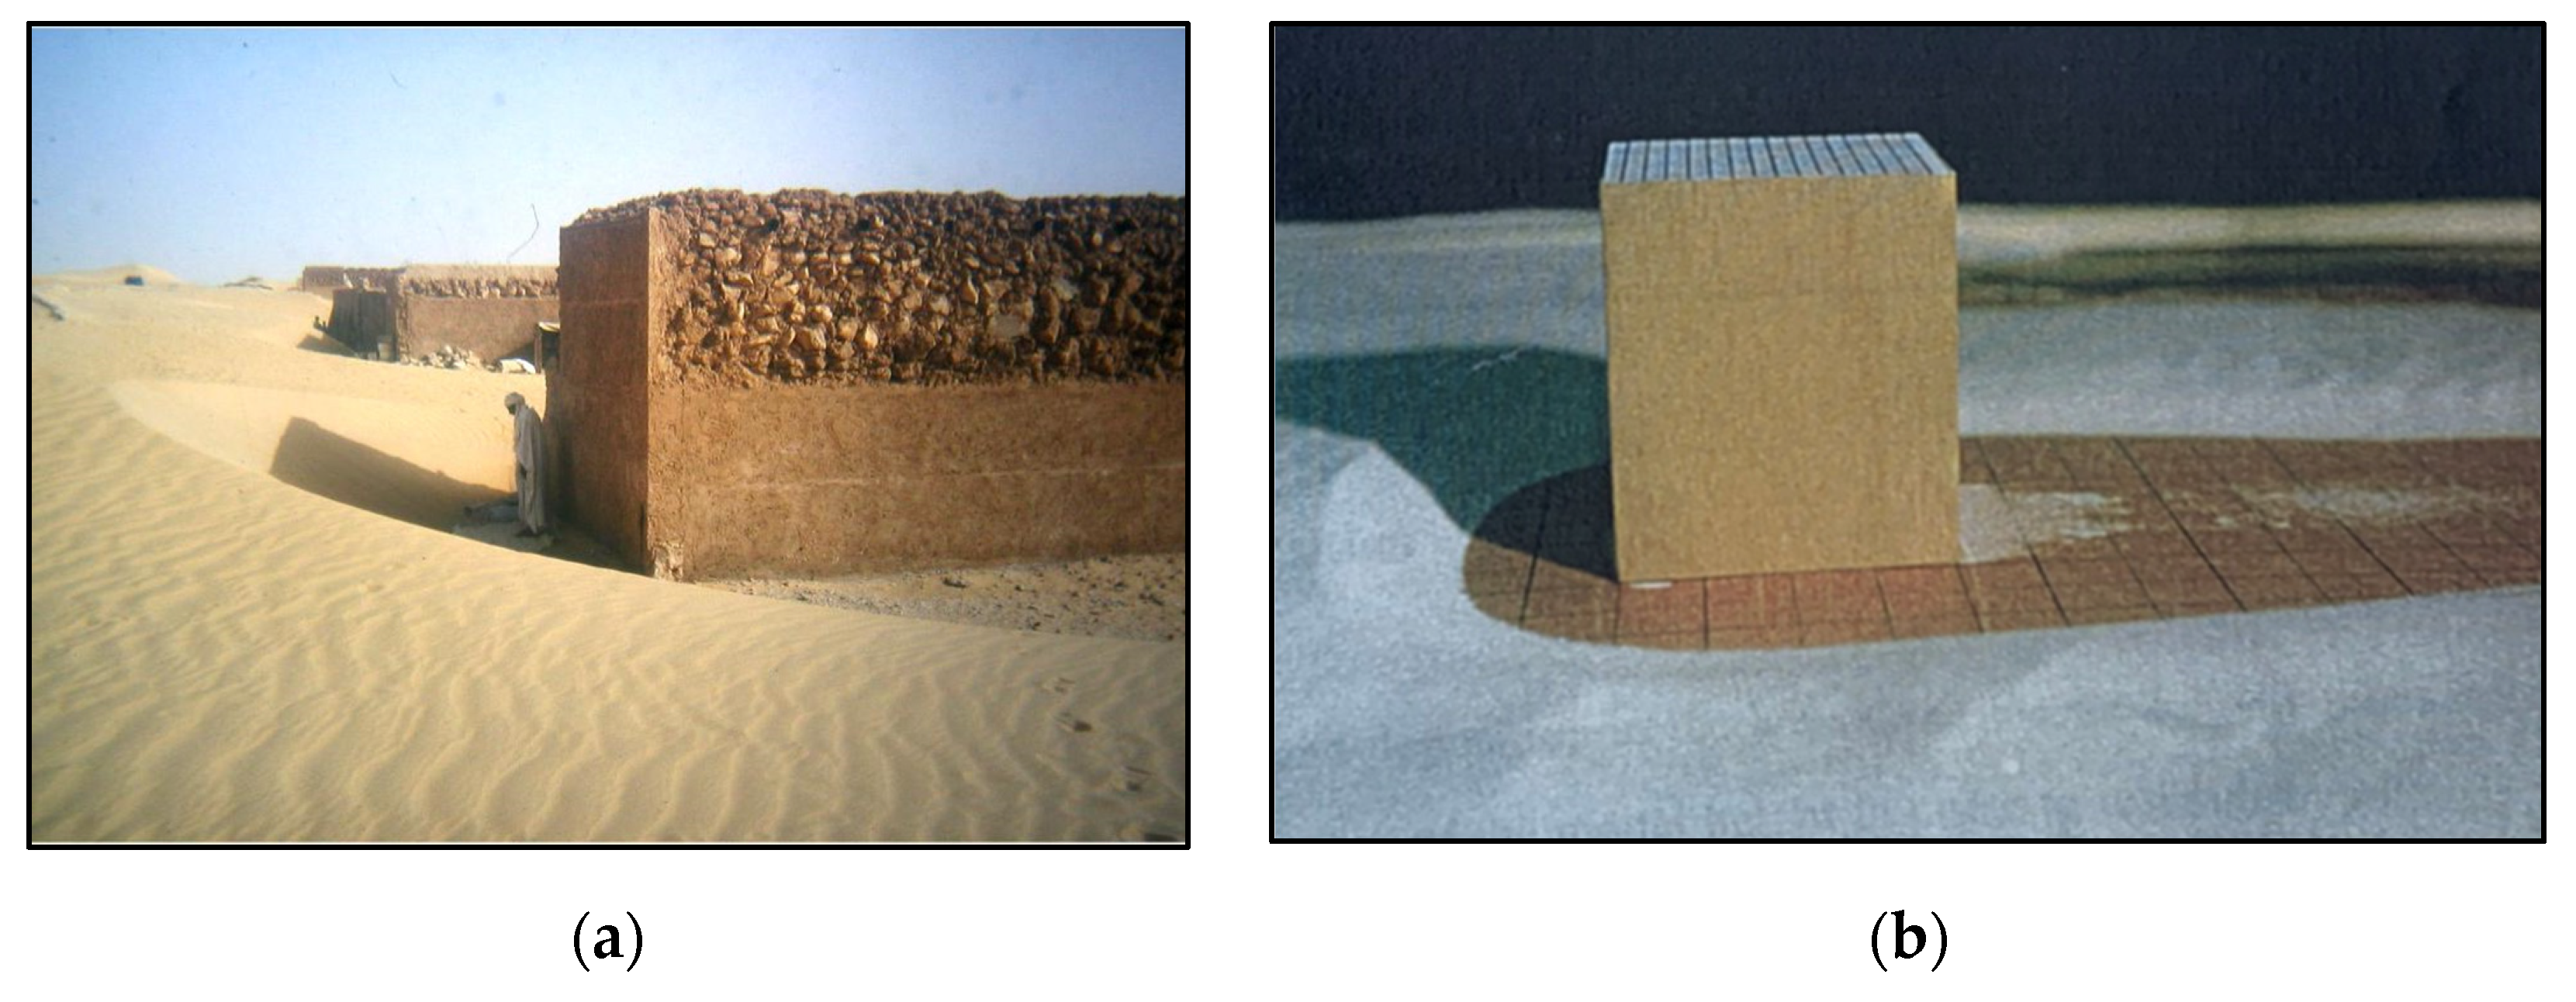
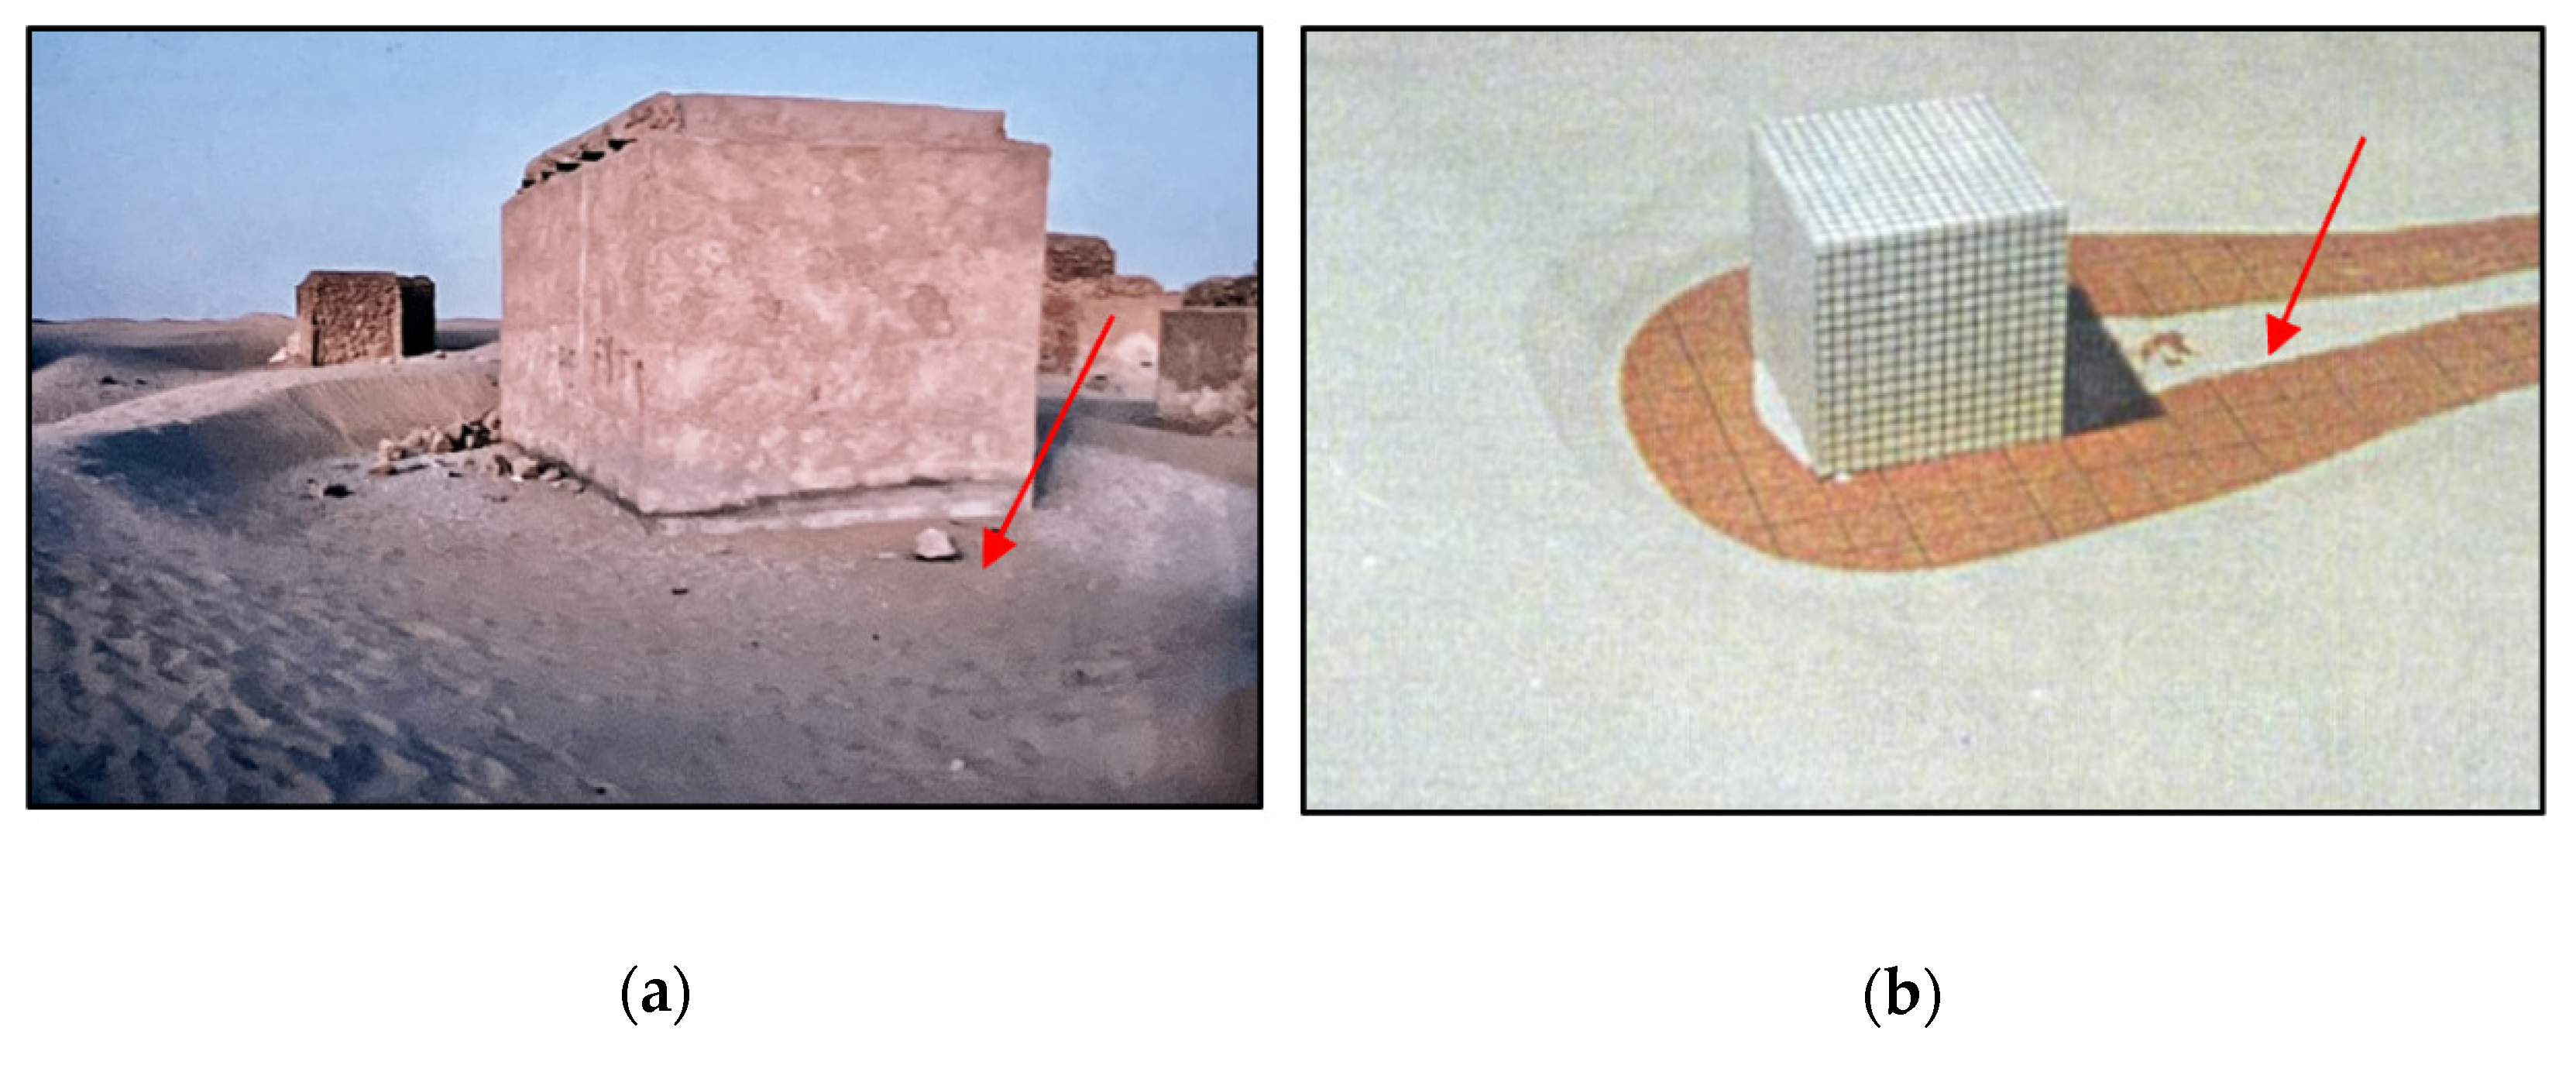
Figure 12) simulated the echo dune that develops around a cubic building with its frontal façade perpendicular to the sand transport direction. The field pattern was adequately simulated in the wind tunnel: the crescent sand accumulation wrapping around the building and the sand-free area just in front of and beside the building were correctly simulated. In the second test (
Figure 13), we examined the shallow sand tail that develops directly downwind of a building. A similar tail was formed in the wind tunnel. The third test (
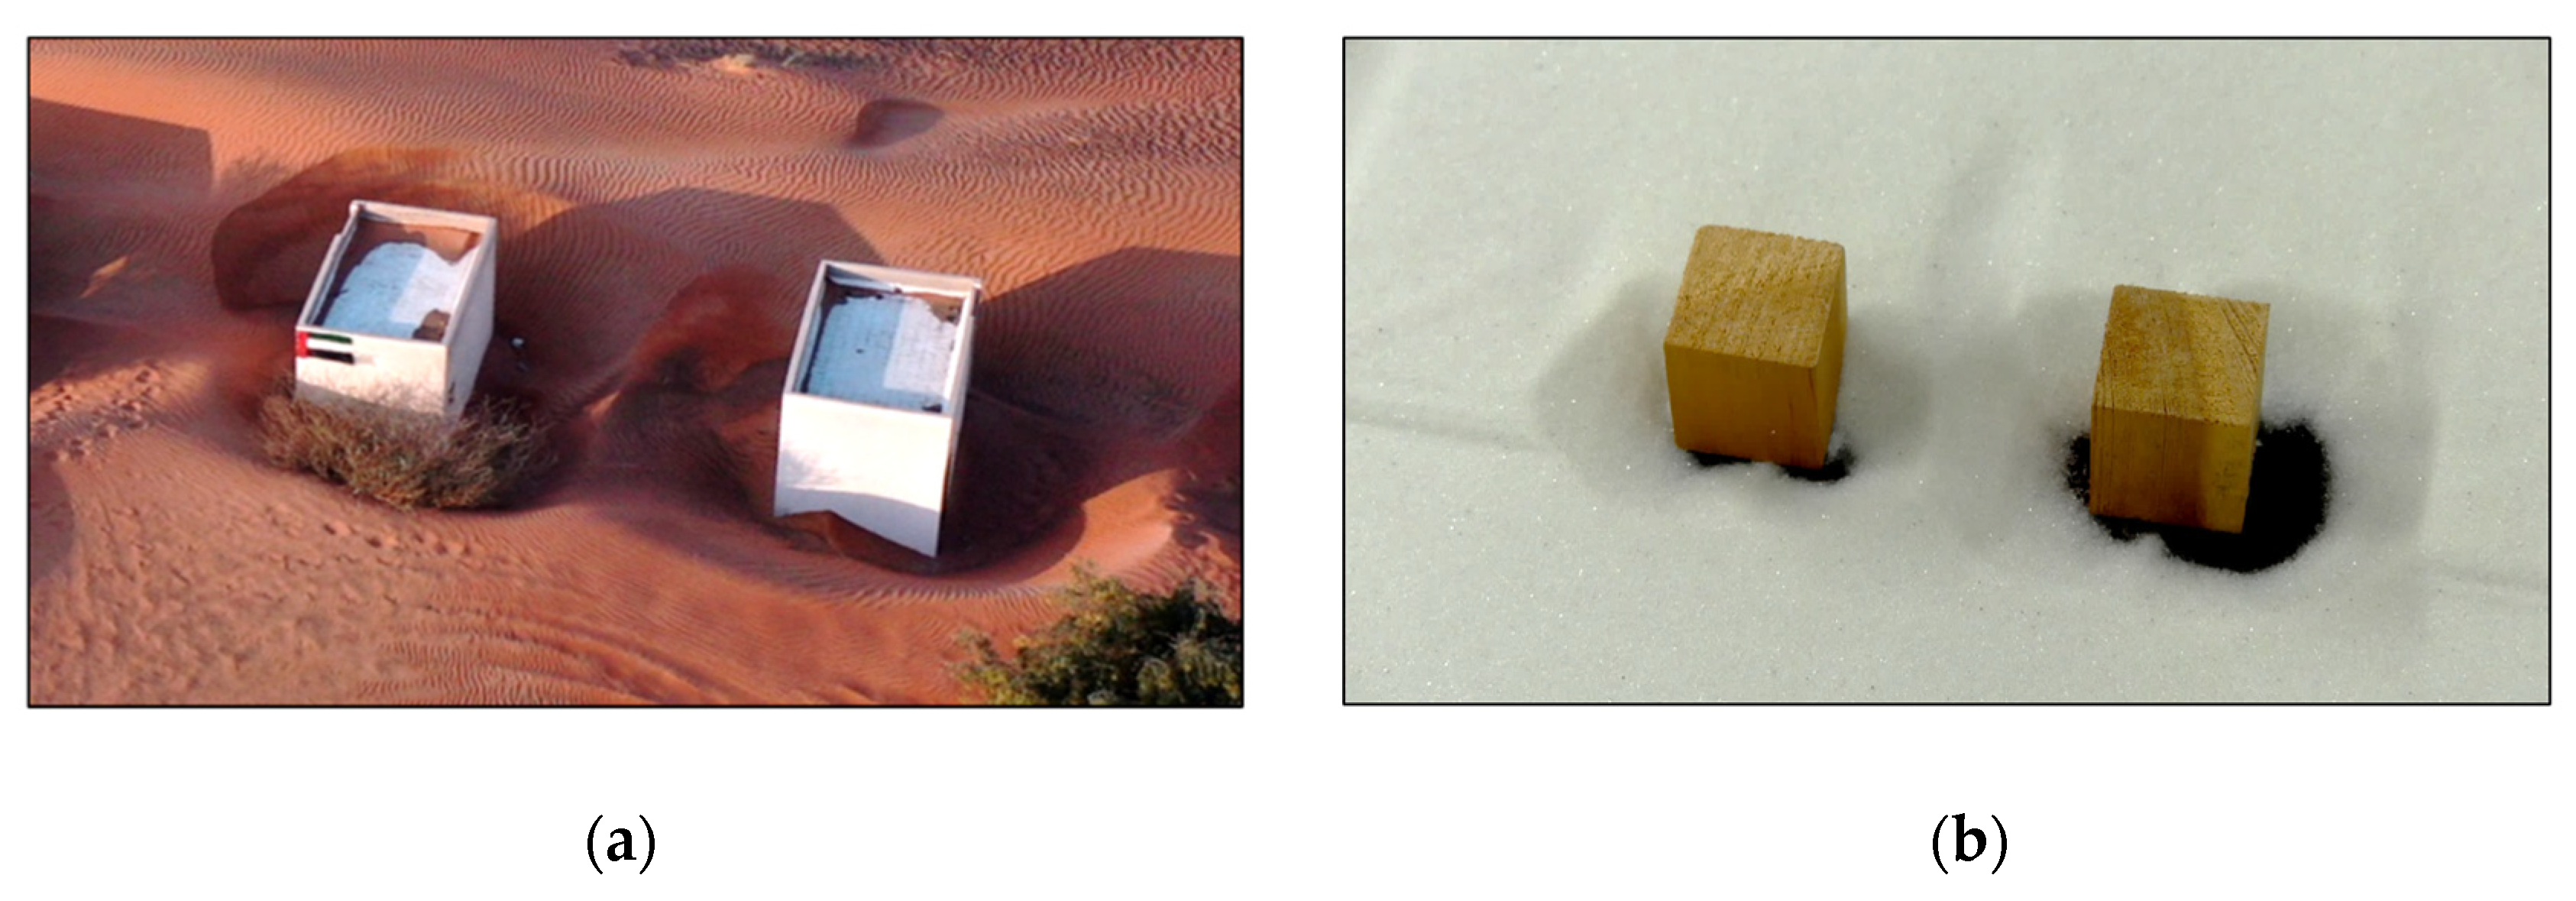
Figure 14) studied the sand pattern around two cubic buildings. Here too, the pattern was adequately simulated in the wind tunnel, even in the details. The experimental conditions described above thus lead to reliable sand patterns.
5. Results
5.1. Single-Standing Buildings
5.1.1. Airflow and Sand Accumulation Pattern
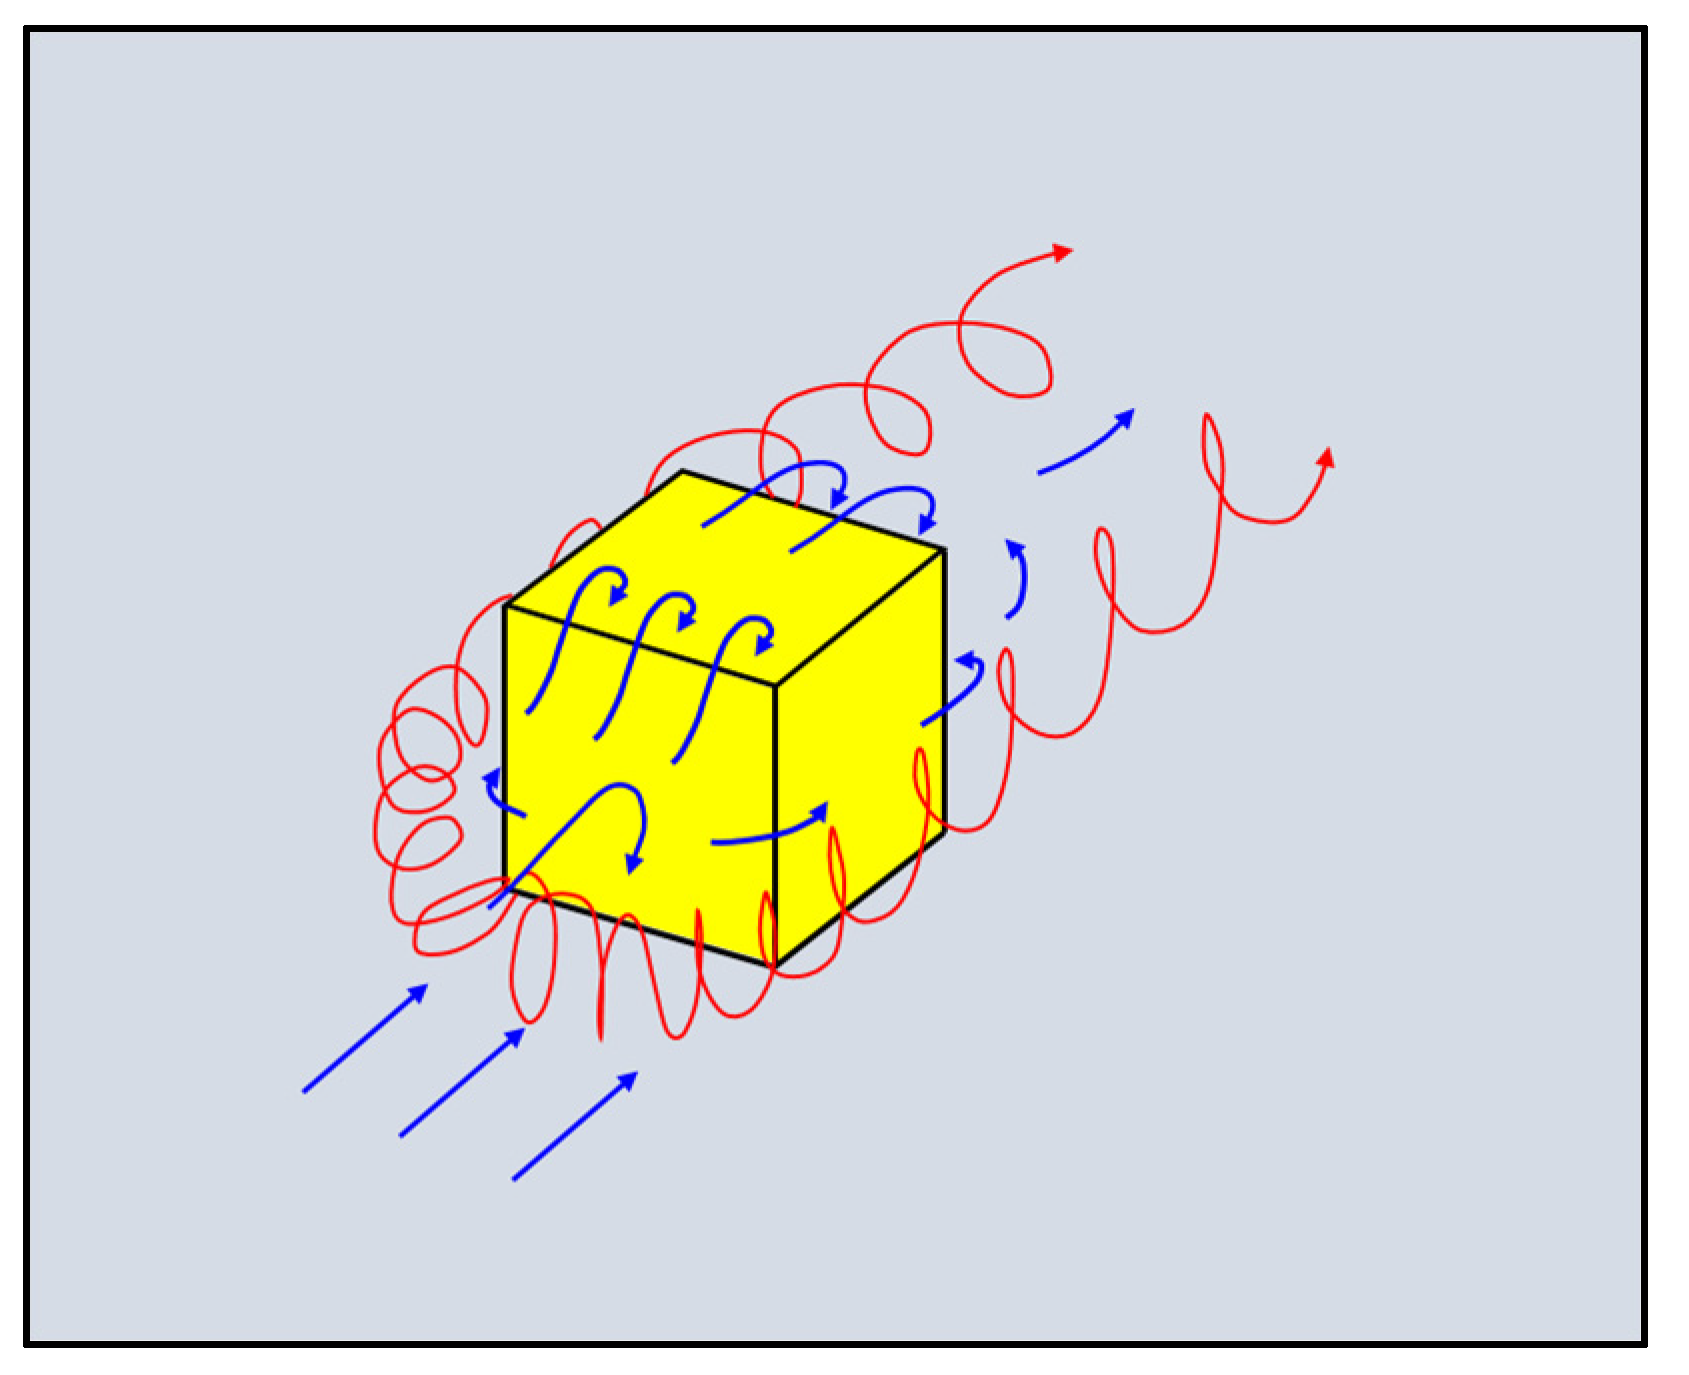
Most buildings are geometric objects with sharp corners. When wind flows over and around such an object, typically, a horseshoe vortex will form and a highly turbulent wake will develop behind the building (
Figure 15). Wind arriving at the building exerts a positive pressure on the frontal façade. Part of the wind will be deflected sideward and flow beside the building. The other part will partly be deflected upward and flow over the roof, whereas another part will be deflected downward, resulting in reverse flow. The reverse flow creates a rotating vortex in front of the building [
21]. When sand is carried by the wind, this flow pattern typically results in the formation of an echo dune [
11]. If the object is a single-standing building, the sand will accumulate in a symmetrical crescentic dune wrapping around the building (
Figure 16). The windward side of this dune has a gentle slope of approximately 10 degrees, whereas the inclination of the lee slope (or slip face) is typically between 32 and 36 degrees, corresponding to the angle of repose for unconsolidated dry dune sand [
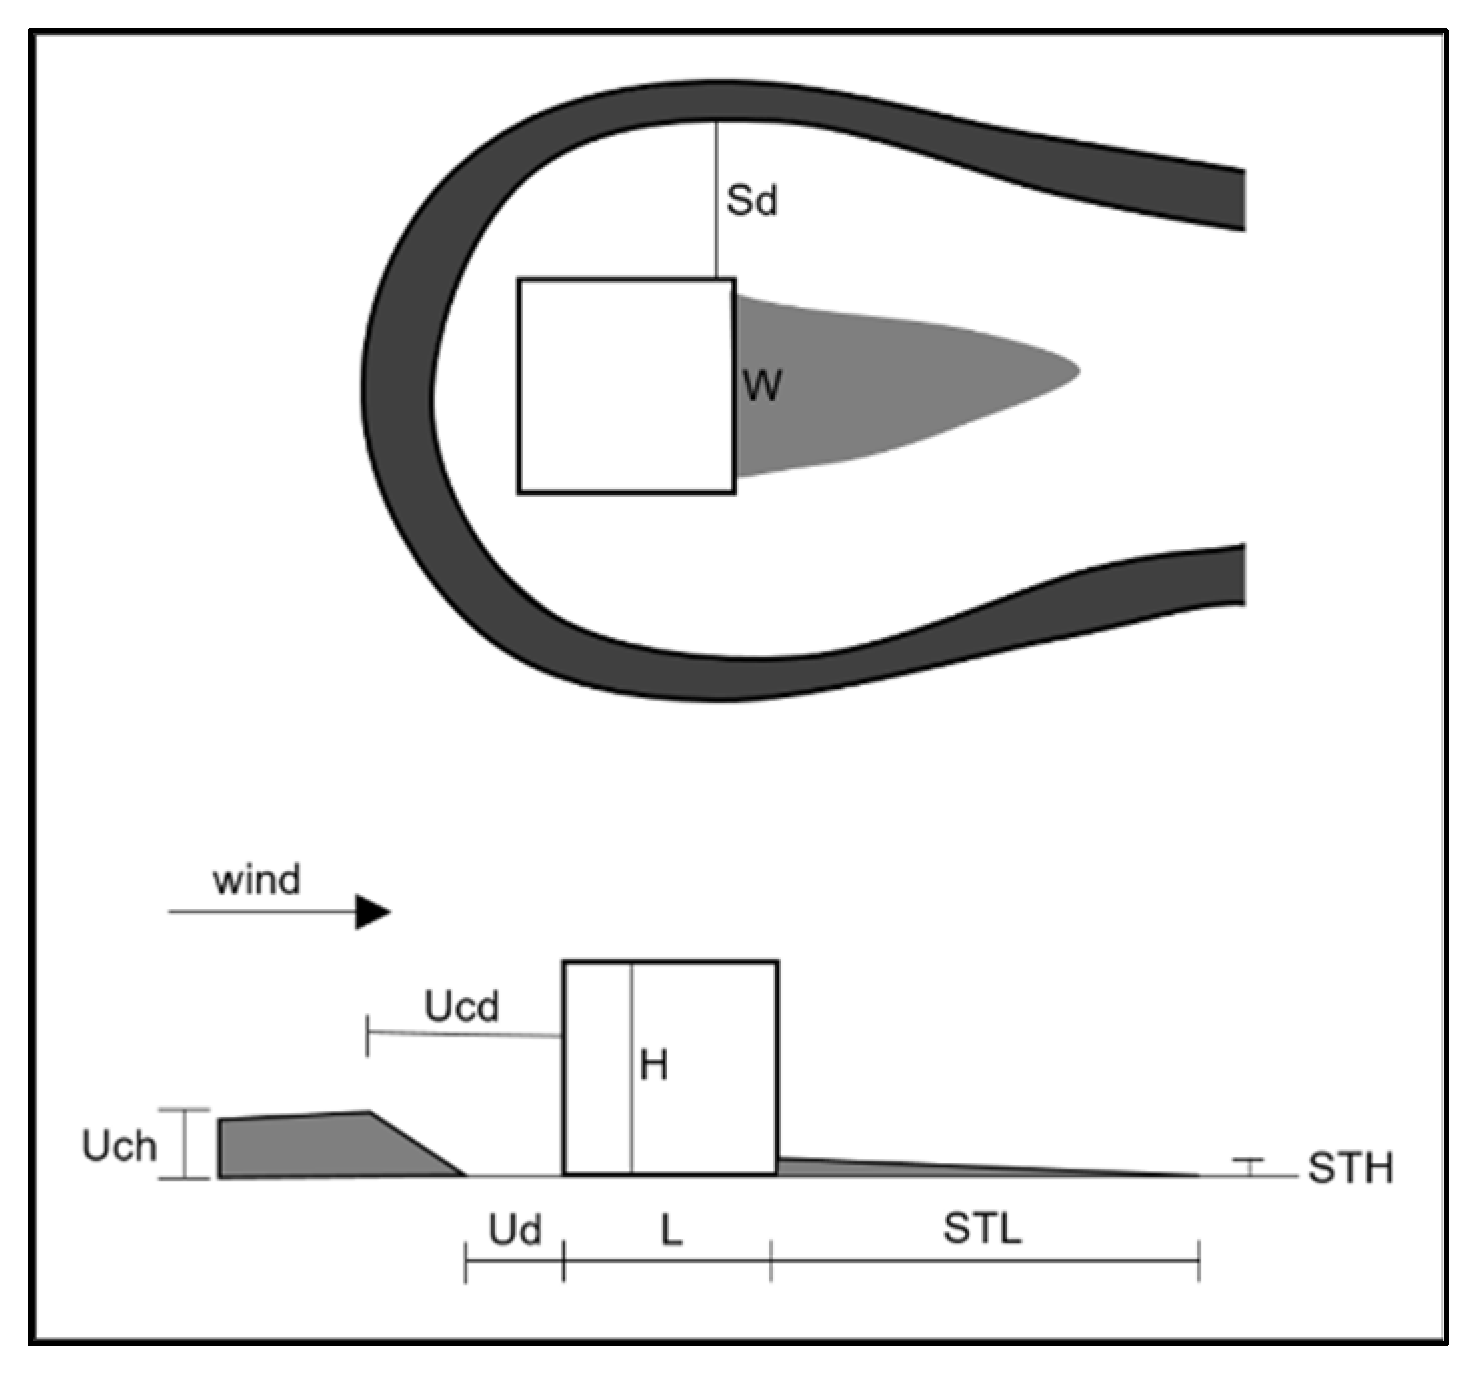
48]. In this study, we call the area between the slip face and the frontal façade of the building where no sand accumulates the upwind sand scour hole, and the areas between the dune horns and the lateral sides of the building, which are also free from sand, the sideways sand scour holes (
Figure 16).
The next paragraphs describe how the characteristics of the sand accumulation body around the building change with the building’s configuration.
5.1.2. Effect of Building Height
To test the effect of building height (H), experiments were performed with five building models, each 8 cm long (L) and 8 cm wide (W), and with heights of 8, 10, 12, 16, 20, and 24 cm, respectively. The following sand accumulation parameters were measured (see
Figure 16): the upwind sand deposition distance (Ud), the sideway sand deposition distance (Sd), the upwind sand crest height (Uch), the upwind sand crest distance (Ucd), the sand tail length (STL), and the sand tail height (STH).
Figure 17a shows that the taller the building, the larger the distance between the building and the surrounding dune: Both Ud, Sd, and Ucd increased with the normalized building height H/L. The height of the dune (Uch), on the other hand, did not change with the normalized building height. The length of the sand accumulation tail just downwind from the building (STL) decreased sharply when the building was higher (
Figure 17b).
5.1.3. Effect of Building Width
A total of seven building models were tested, each 8 cm long and 8 cm high, and 8, 10, 12, 14, 16, 20, and 24 cm wide, respectively.
Figure 18a shows that when the building became wider, the dune around it became less curved: Ud and Ucd decreased, whereas Sd increased. The dune attached to the windward face of the model when W/L was about 3. The dune height (Uch) became higher, and the sand accumulation tail downwind from the building became longer (
Figure 18b).
5.1.4. Effect of Building Length
In this series of experiments, we tested the effect of building length (measured along the flow) on the dimensions of the sand accumulation tail behind the building. A total of 12 building models were used, each 8 cm wide, 8 cm high, and 8, 10, 12, 14, 16, 20, 24, 28, 32, 36, 40, and 44 cm long, respectively. The data in
Figure 19 indicate that the length and thickness of the sand accumulation tail did not substantially change as the building became longer: only for very long buildings (L/H > 4) the sand accumulation tail became a little thicker.
5.1.5. Recommendations for Building Design
For a building to become less likely to be buried by sand, it is important that the size of the sand-free scour zones in front of and on the two sides of the building are large, and that the length and thickness of the sand accumulation tail behind the building are small. This way the building itself will remain (almost) free from sand accumulation. The wind tunnel results indicate that this is most likely for tall buildings that are also sufficiently narrow. The optimum combination tested in this study is for H/L ≥ 2.5 and W/L around 1.5. For single-standing buildings, narrow two-roof buildings are, thus, less sensitive to sand burial than wide or one-roof buildings.
5.2. Two Buildings Next to Each Other
5.2.1. Sand Accumulation Pattern
When two buildings are closely located to each other, interaction will occur between the sand accumulation patterns created by the individual buildings.
Figure 20 shows the pattern that will typically occur. Crescentic sand accumulations will still be formed around the two buildings, but in addition, a long-stretched pile of sand will form downwind from the open area between the buildings. That open area may be free from sand (merging of the scouring zones of the two buildings), but it may also contain a narrow tail of sand that extends into the sand pile downwind from the buildings. A sand-free zone separates the sand pile from the sand accumulations outside the wake created by the buildings (
Figure 20).
The next paragraphs describe how the characteristics of the sand accumulation pile change with the size of the gap between the two buildings.
5.2.2. Two Cubic Buildings
To test the effect of gap width (G), experiments were performed with two cubic buildings, each 8 cm long, 8 cm wide, and 8 cm high. The G-values tested were 2, 4, 6, 8, 10, 12, 14, 16, 20, 24, 28, and 34 cm. In each experiment, the following characteristics of the sand pile were measured (see also
Figure 20a): sand drift length (SDL), distance between the sand drift’s crest and the buildings’ leeside (SDCd), and the height of the sand drift’s crest (SDCh). The results are shown in
Figure 21, where the ratio G/H in the abscissa is the ratio of gap width to building height. Sand drift length increased as the gap between the buildings became larger, but it reached an equilibrium from a G/H ratio of 1.75 (
Figure 21a). The distance between the sand drift’s crest and the buildings’ leeside initially increased with increasing gap width, reached a maximum at G/L = 1, then decreased again. The height of the sand drift’s crest, on the other hand, did not change much with gap width (
Figure 21b).
5.2.3. Two Rectangular Buildings
To check the above-mentioned results for rectangular buildings, five gap widths were tested for two rectangular buildings, each 8 cm long, 8 cm high, and 24 cm wide and installed perpendicular to the sand supply direction. As can be seen in
Figure 21, the trends are identical to those of cubic buildings, although the sand pile was a little shorter, and also a little closer to the buildings when the latter were cubic. Its height, on the other hand, was almost identical for the two building types.
5.2.4. Recommendations for Building Design
With regard to the sand pile that forms downwind from the gap between two adjacent buildings, it is important that the accumulation occurs sufficiently downwind from the buildings. This guarantees that sufficient space behind the buildings will be free of sand, so that burial of the buildings by sand (for example, when the wind blows from the opposite direction) is less likely. Moreover, the volume of the sand pile should be as small as possible. The wind tunnel results indicate that both requirements are best met once the ratio G/H is smaller than 1, both in the case of cubic buildings and in the case of rectangular buildings. Constructing the buildings sufficiently close to each other (perpendicular to the direction of sand transport) is, therefore, recommended.
6. Discussion
Buildings in vernacular settlements in a desert often have complex geometrical shapes. In the El-Oued Souf in Algeria, the vernacular architecture created a harmony between the natural environment and the man-made environment. It integrated the elements of climate, landscape, and culture. The overall geometry of the buildings (square, rectangular), the distance between adjacent buildings, and the shape of the roof (dome, vaulting) substantially affected the patterns of sand erosion and deposition between and around the buildings and prevented sand accumulation on the roof. That the vernacular settlements in El-Oued Souf, which are located in the middle of active sand dunes and suffer from continuous sand drift and deposition, have survived for centuries, raises the question of whether their layout could have been specially designed to minimize sand encroachment. This study shows that wind tunnel experiments designed to simulate the patterns of sand erosion and deposition over and around scale models of buildings are a very useful tool to find building shapes and configurations that guarantee a minimum of sand encroachment. Computational Fluid Dynamics (CFD) offers an additional tool to study the wind-flow patterns over and around buildings. However, at the time of writing, CFD simulations of sand encroachment patterns have not yet been very successful, although the air flow patterns themselves can be accurately reproduced. Further developments in the field of CFD will hopefully fill this gap.
This study also shows that when careful attention is paid to fulfilling the simulation requirements related to sand dynamics, wind tunnel experiments with scale models can lead to correct predictions of the erosion and deposition patterns. Previous studies have shown that this is also true for dust patterns, as well as for snow (see, for example, [
4,
5,
6,
9,
11,
13]). This makes the wind tunnel a very useful tool for developing optimum designs for buildings to be erected in a desert environment where sediment dynamics is very high, due to the dry climate and the absence of a continuous vegetation cover.
This study hopes to increase the awareness and knowledge of the topic; moreover, it shows that more collaboration is needed between experts in the field of aeolian sand studies, on one hand, and planners and architects in the field of desert architecture on the other. This way, clear design guidelines can be developed and applied, leading to sustainable buildings constructed in harmony with the natural environment and with minimal encroachment problems.
7. Conclusions
This study provides a better understanding of the relationships between building size, shape, and configuration, on one hand, and aeolian sand depositional patterns on the other, from which some design guidance could be derived. By using wind tunnel simulations, optimum ratios of built form were suggested to help control the sand features around buildings by minimizing the piling up of sand and enlarging the sand-free areas around the buildings. The presented method can be applied in many areas affected by sand deposition.
For single-standing buildings, to guarantee that the size of the sand-free scour zones in front of and on the two sides of the building are large and that the length and thickness of the sand accumulation tail behind the building are small, it is recommended that buildings are tall enough (two-floor buildings are better than one-floor buildings), and they should also remain sufficiently narrow. The optimum combination tested in this study was for H/L ≥ 2.5 and W/L around 1.5, where H, L, and W are the height, length, and width of the building, respectively. Single-standing buildings constructed this way will remain reasonably free from sand accumulation.
For buildings constructed next to each other, it is important that the distance between them remains sufficiently small. This way, the sand pile that forms downwind from the gap between the buildings does not reach the buildings themselves, which guarantees that sufficient space behind the buildings will be free of sand, so that burial of the buildings by sand (for example, when the wind blows from the opposite direction) is less likely. Constructing buildings sufficiently close to each other also ensures that the volume of the sand pile will remain small. The wind tunnel results indicate that the ratio G/H, where G is the space between the buildings and H is building height, should be preferably smaller than 1, both in the case of cubic buildings and rectangular buildings.
It is important to point out some limitations of the current study:
- -
Only a selection of geometric building shapes were tested;
- -
Only a selection of building parameters were tested (height, width, and length);
- -
No configurations were tested with buildings behind each other: only single-standing buildings and buildings next to each other were tested;
- -
No multiple rows of buildings (a common situation in a larger settlement) were tested.
Future studies are recommended to provide a better understanding of the sand encroachment patterns under conditions not tested in this study.
Author Contributions
Conceptualization, M.F.S.; methodology, M.F.S.; validation, M.F.S. and D.G.; formal analysis, M.F.S. and D.G.; investigation, M.F.S. and D.G.; resources, M.F.S.; data curation, M.F.S. and D.G.; writing—original draft preparation, M.F.S. and D.G.; writing—review and editing, M.F.S. and D.G. All authors have read and agreed to the published version of the manuscript.
Funding
This research received no external funding.
Institutional Review Board Statement
Not applicable.
Informed Consent Statement
Not applicable.
Data Availability Statement
The original data are available from the authors upon request.
Conflicts of Interest
The authors declare no conflict of interest.
References
- Sahara. Available online: https://en.wikipedia.org/wiki/Sahara (accessed on 11 October 2022).
- Arabian Desert. Available online: https://www.newworldencyclopedia.org/entry/Arabian_Desert (accessed on 15 October 2022).
- Cloudsley-Thompson, J.L. Key Environments Sahara Desert; Pergamon Press: Oxford, UK, 1984. [Google Scholar]
- Goossens, D.; Offer, Z.Y. Eolian deposition of dust over symmetrical hills: An evaluation of wind tunnel data by means of terrain measurements. Z. Geomorphol. 1993, 37, 103–111. [Google Scholar] [CrossRef]
- Offer, Z.Y.; Goossens, D. Wind tunnel experiments and field measurements of aeolian dust deposition on conical hills. Geomorphology 1995, 14, 43–56. [Google Scholar] [CrossRef]
- Goossens, D. Long-term aeolian loess accumulation modelled in the wind tunnel: The Molenberg case (central loess belt, Belgium). Z. Geomorphol. 1997, 41, 115–129. [Google Scholar] [CrossRef]
- Goossens, D. Wind tunnel experiments of eolian dust deposition along ranges of hills. Earth Surf. Process. Landf. 1996, 21, 205–216. [Google Scholar] [CrossRef]
- Greeley, R.; Iversen, J.D.; Pollack, J.B.; Udovich, N.; White, B. Wind tunnel studies of Martian aeolian processes. Proc. R. Soc. Lond. Ser. A 1974, 341, 331–360. [Google Scholar]
- Greeley, R.; Iversen, J.D.; Pollack, J.B.; Udovich, N.; White, B. Wind tunnel simulations of light and dark streaks on Mars. Science 1974, 183, 847–849. [Google Scholar] [CrossRef] [PubMed]
- Goossens, D. Eolische processen op Venus. Heelal 1992, 37, 172–178. [Google Scholar]
- Tsoar, H. Wind tunnel modeling of echo and climbing dunes. Dev. Sedimentol. 1983, 38, 247–259. [Google Scholar]
- Goossens, D. Scale model simulations of the deposition of loess in hilly terrain. Earth Surf. Process. Landf. 1988, 13, 533–544. [Google Scholar] [CrossRef]
- Goossens, D.; Offer, Z.I. A wind tunnel simulation and field verification of desert dust deposition (Avdat Experimental Station, Negev Desert). Sedimentology 1990, 37, 7–22. [Google Scholar] [CrossRef]
- Watson, A. The control of windblown sand and moving dunes: A review of the methods of sand control in deserts, with observations from Saudi Arabia. Q. J. Eng. Geol. 1985, 18, 237–252. [Google Scholar] [CrossRef]
- Bruno, L.; Coste, N.; Fransos, D.; Lo Giudice, A.; Preziosi, L.; Raffaele, L. Shield for sand: An innovative barrier for windblown sand mitigation. Recent Patents Eng. 2018, 12, 237–246. [Google Scholar] [CrossRef]
- Bruno, L.; Fransos, D.; Lo Giudice, A. Solid barriers for windblown sand mitigation: Aerodynamic behaviour and conceptual design guidelines. J. Wind Eng. Ind. Aerodyn. 2018, 173, 79–90. [Google Scholar] [CrossRef]
- Bruno, L.; Horvat, M.; Raffaele, L. Windblown sand along railway infrastructures: A review of challenges and mitigation measures. J. Wind. Eng. Ind. Aerodyn. 2018, 177, 340–365. [Google Scholar] [CrossRef]
- Zhang, K.C.; Qu, J.J.; Liao, K.T.; Niu, Q.H.; Han, Q.J. Damage by wind-blown sand and its control along Qinghai-Tibet Railway in China. Aeolian Res. 2010, 1, 143–146. [Google Scholar] [CrossRef]
- Raffaele, L.; Bruno, L. Windblown sand action on civil structures: Definition and probabilistic modelling. Eng. Struct. 2019, 178, 88–101. [Google Scholar] [CrossRef]
- Slaat, G.E.; Blocken, B.J.E.; Goossens, D. Droge atmosferische depositie op gebouwen: Een oriënterend windtunnelonderzoek naar patronen van droge atmosferische depositie op gebouwgevels. Bouwfysica 2011, 11, 19–23. [Google Scholar]
- Poppema, D.W.; Wijnberg, K.M.; Mulder, J.P.M.; Vos, S.E.; Hulscher, S.J.M.H. The effect of building geometry on the size of aeolian deposition patterns: Scale model experiments at the beach. Coast. Eng. 2021, 168, 103866. [Google Scholar] [CrossRef]
- McKenna Neuman, C.; Bédard, O. A wind tunnel study of flow structure adjustment on deformable sand beds containing a surface-mounted obstacle. J. Geophys. Res. Earth Surf. 2015, 120, 1824–1840. [Google Scholar] [CrossRef]
- Tominaga, Y.; Okaze, T.; Mochida, A. Wind tunnel experiment and CFD analysis of sand erosion/deposition due to wind around an obstacle. J. Wind Eng. Ind. Aerodyn. 2018, 182, 262–271. [Google Scholar] [CrossRef]
- Zhou, X.; Kang, L.; Gu, M.; Qiu, L.; Hu, J. Numerical Simulation and Wind Tunnel Test for Redistribution of Snow on a Flat Roof. J. Wind. Eng. Ind. Aerodyn. 2016, 153, 92–105. [Google Scholar] [CrossRef]
- Tsuchiya, M.; Tomabechi, T.; Hongo, T.; Ueda, H. Wind Effects on Snowdrift on Stepped Flat Roofs. J. Wind. Eng. Ind. Aerodyn. 2002, 90, 1881–1892. [Google Scholar] [CrossRef]
- Florescu, E.-C. Snowdrift Modelling in the Wind Tunnel for Roads. 1970. Available online: https://www.semanticscholar.org/paper/SNOWDRIFT-MODELLING-IN-THE-WIND-TUNNEL-FOR-ROADS-Florescu/ccb5613dc2681f717b58f1be57bc6741958b6b48 (accessed on 16 November 2022).
- Gerster, G. Grand Design: The Earth from Above; Weidenfeld and Nicolson: London, UK, 1976. [Google Scholar]
- El Oued Province. Available online: https://en.wikipedia.org/wiki/El_Oued_Province (accessed on 6 September 2021).
- Med-O-Med. El-Oued Souf, Algeria. 2017. Available online: https://medomed.org/featured_item/great-eastern-sand-sea-oases-2-el-oued-souf-and-its-cultural-landscape-algeria/ (accessed on 16 November 2022).
- Salah-Salah, F. Cities in the Sahara: Spatial Structure and Generative Processes; University of London: London, UK, 1987. [Google Scholar]
- Weatherspark. El Oued Climate, Weather By Month, Average Temperature (Algeria)—Weather Spark. 2022. Available online: https://weatherspark.com/y/53031/Average-Weather-in-El-Oued-Algeria-Year-Round (accessed on 13 October 2022).
- Tindert, M. Housing in the Desert: El-Oued. Master’s Thesis, University of Newcastle upon Tyne, Newcastle upon Tyne, UK, 1986. [Google Scholar]
- Delval, B. Urban communities of the Algerian Sahara. Ekistics 1974, 38, 12–21. [Google Scholar]
- Golany, G. Desert Planning: International Lessons; Architectural Press: London, UK, 1983. [Google Scholar]
- Cherif, E. The Structural Properties of Gypsum Concrete Blocks with Reference to the Traditional Design and Construction of Buildings in the Souf Area of Algeria. Ph.D. Thesis, University of Bath, Bath, UK, 1988. [Google Scholar]
- Desert Rose (Crystal). Available online: https://en.wikipedia.org/wiki/Desert_rose_(crystal) (accessed on 12 July 2022).
- Miloudi, A.M.; Remini, B. The Ghout of Souf: An Original Hydroagricultural System. Geosci. Eng. 2018, 64, 30–37. [Google Scholar] [CrossRef]
- Alhosani, N. Modeling and Mapping Sand Encroachment Risk as an Aid for Urban Planning in the United Arab Emirates (UAE). J. Geogr. Inf. Syst. 2018, 10, 699–717. [Google Scholar] [CrossRef]
- Wilson, M. A Half-Buried Ghost Town near Dubai Is Attracting Explorers from across the World—But No One Knows Why It Was Abandoned. 2020. Available online: https://www.insider.com/half-buried-village-near-dubai-popular-tourists (accessed on 16 November 2022).
- The Secret of Sharjah’s Al Madam Ghost Village. A Blog about Homes, Trends, Tips & Life in the UAE. MyBayut. Available online: https://www.bayut.com/mybayut/al-madam-ghost-village/ (accessed on 13 October 2022).
- Hertig, J.-A.; Liska, P. Simulations of Regional Atmospheric Flows on Small Scale Topographical Models. Wind. Eng. 1983, 15, 77–89. [Google Scholar] [CrossRef]
- El-Baz, F.; El-Tayeb, I.A.; Hassan, M.H. Sand Transport and Desertification in Arid Lands. In Arid Lands—Proceedings of the International Workshop; World Scientific: Singapore, 1990. [Google Scholar] [CrossRef]
- Iversen, J.D. Small Scale Wind Tunnel Modelling of Particle Transport—Froude Number Effect. In Aeolian Geomorphology; Routledge: London, UK, 2020; pp. 19–33. [Google Scholar] [CrossRef]
- Liu, H. Wind Engineering: A Handbook for Structural Engineers; Prentice Hall: Englewood Cliffs, NJ, USA, 1991. [Google Scholar]
- Tsoar, H.; Pye, K. Dust Transport and the Question of Desert Loess Formation. Sedimentology 1987, 34, 139–153. [Google Scholar] [CrossRef]
- Schlichting, H. Boundary Layer Theory, 6th ed.; McGraw-Hill: New York, NY, USA, 1968. [Google Scholar]
- Cermak, J.E. Physical Modelling of Flow and Dispersion over Complex Terrain. Bound. Layer Meteorol. 1984, 30, 261–292. [Google Scholar] [CrossRef]
- Komar, P.D. Relative Quantities of Suspension versus Bed-Load Transport on Beaches. SEPM J. Sediment. Res. 1978, 48, 921–932. [Google Scholar] [CrossRef]
Figure 1.
Al-Madam town, UAE. Credit:
Shutterstock.com (accessed on 8 November 2022).
Figure 1.
Al-Madam town, UAE. Credit:
Shutterstock.com (accessed on 8 November 2022).
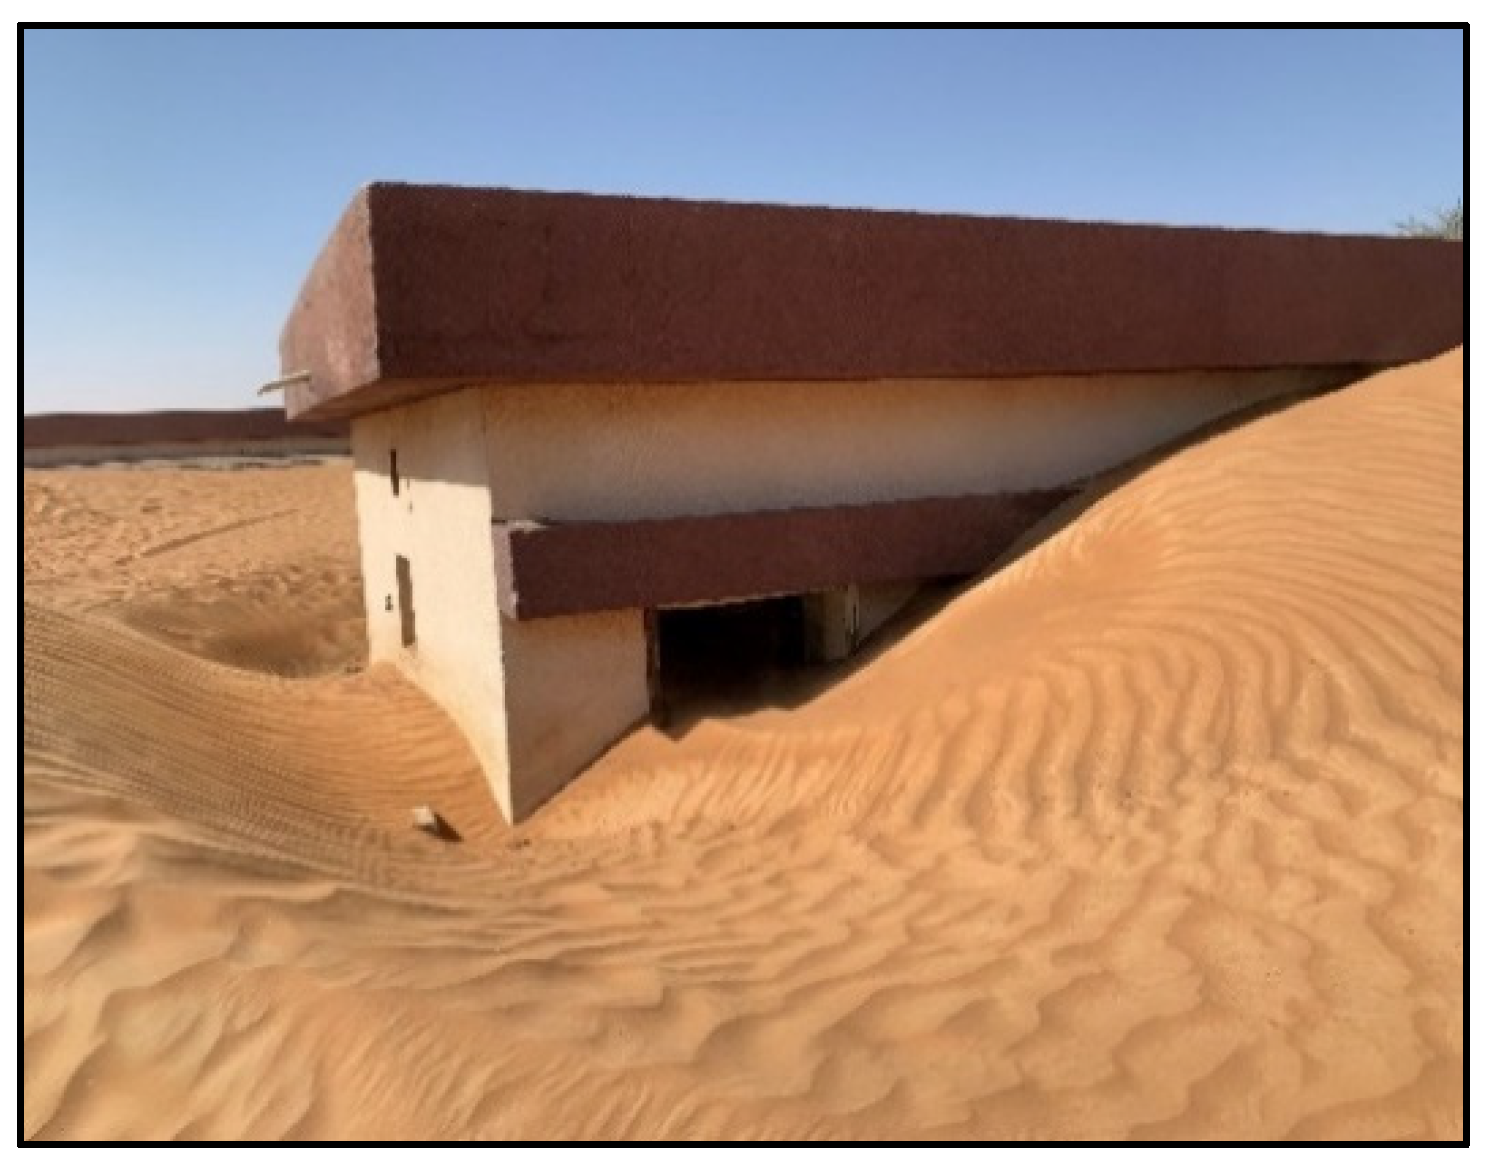
Figure 2.
Dwelling covered by sand in Al-Madam, UAE. (Photo: M. Sherzad).
Figure 2.
Dwelling covered by sand in Al-Madam, UAE. (Photo: M. Sherzad).
Figure 3.
Sand encroachment on a new housing project in the region of El-Oued Souf, Algeria. (Photos: M. Sherzad).
Figure 3.
Sand encroachment on a new housing project in the region of El-Oued Souf, Algeria. (Photos: M. Sherzad).
Figure 4.
Location of the El-Oued Souf region in Algeria (credit: Wikimedia Commons).
Figure 4.
Location of the El-Oued Souf region in Algeria (credit: Wikimedia Commons).
Figure 5.
Traditional quarter (Ksar) in El-Oued Souf, Algeria. (a) Settlement layout (photo: M. Sherzad); (b) courtyard house (photo: M. Sherzad); (c) sand stone (photo: M. Sherzad).
Figure 5.
Traditional quarter (Ksar) in El-Oued Souf, Algeria. (a) Settlement layout (photo: M. Sherzad); (b) courtyard house (photo: M. Sherzad); (c) sand stone (photo: M. Sherzad).
Figure 6.
Ghouts, region of El-Oued Souf, Algeria (photo: M. Sherzad).
Figure 6.
Ghouts, region of El-Oued Souf, Algeria (photo: M. Sherzad).
Figure 7.
Nezlah house, region of El-Oued Souf, Algeria (photo: M. Sherzad).
Figure 7.
Nezlah house, region of El-Oued Souf, Algeria (photo: M. Sherzad).
Figure 8.
Deterioration (left) and burial (right) of traditional housing in the town of Gumar, Algeria (photos: M. Sherzad).
Figure 8.
Deterioration (left) and burial (right) of traditional housing in the town of Gumar, Algeria (photos: M. Sherzad).
Figure 9.
Location of Al-Madam town, UAE. Google maps. Accessed on 15 October 2022.
Figure 9.
Location of Al-Madam town, UAE. Google maps. Accessed on 15 October 2022.
Figure 10.
Aerial view of the Al-Madam housing project. Credit: Shutterstock.com (accessed on 8 November 2022).
Figure 10.
Aerial view of the Al-Madam housing project. Credit: Shutterstock.com (accessed on 8 November 2022).
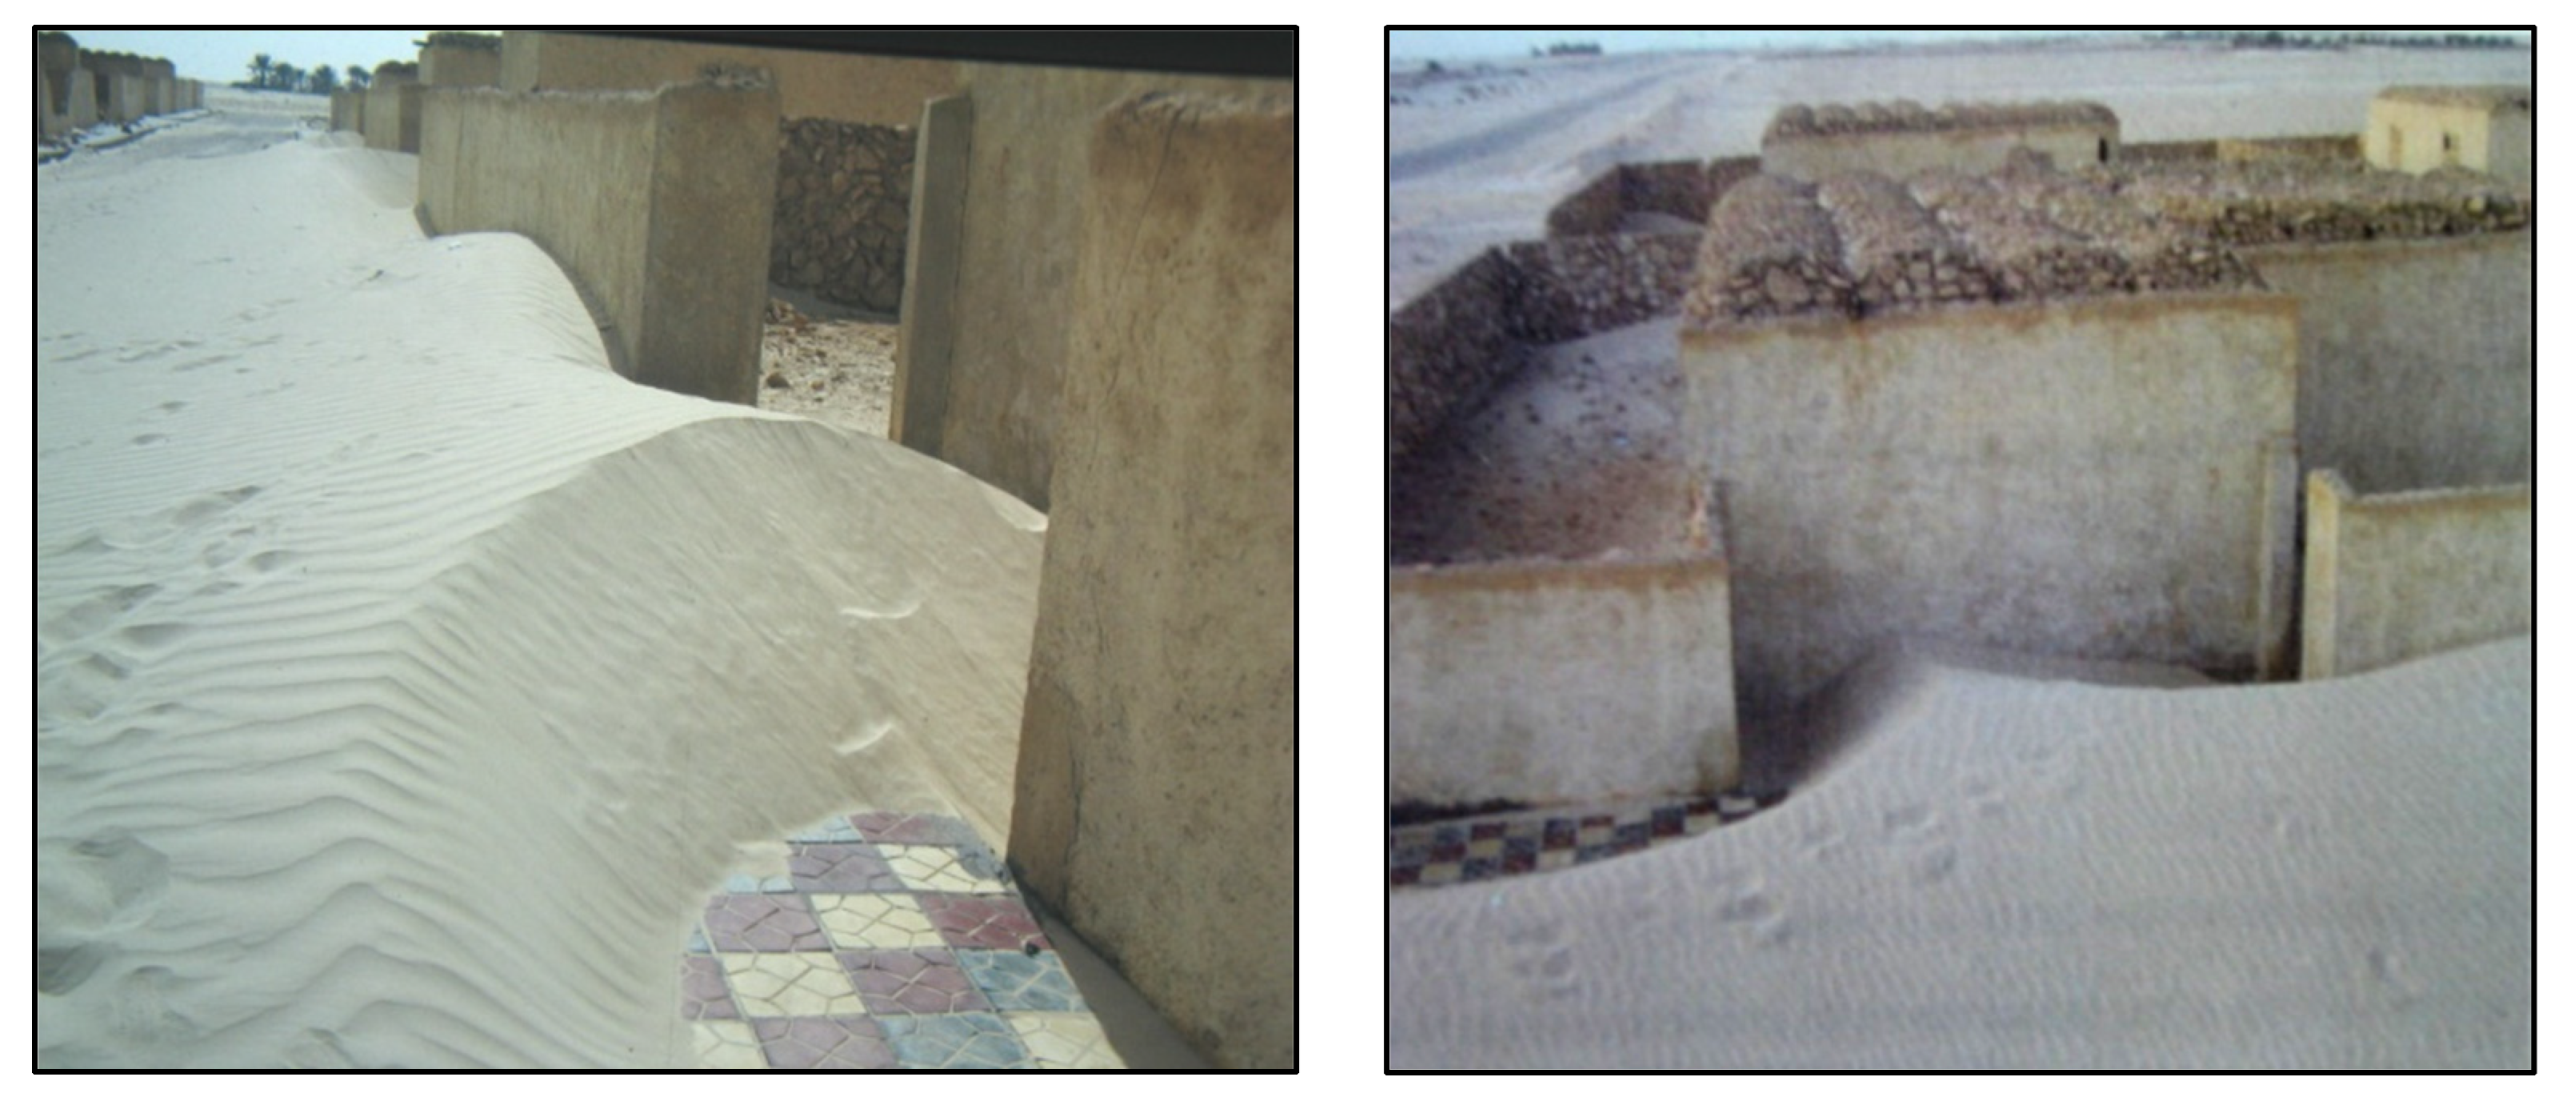
Figure 11.
Sand accumulations between two buildings (left) and inside a dwelling (right) in Al-Madam, UAE (photos: M. Sherzad).
Figure 11.
Sand accumulations between two buildings (left) and inside a dwelling (right) in Al-Madam, UAE (photos: M. Sherzad).
Figure 12.
Echo dune developing around a cubic building (a) in the field and (b) simulated in the wind tunnel. (photos: M. Sherzad).
Figure 12.
Echo dune developing around a cubic building (a) in the field and (b) simulated in the wind tunnel. (photos: M. Sherzad).
Figure 13.
Sand tail developing directly downwind of a building (a) in the field and (b) simulated in the wind tunnel (photos: M. Sherzad).
Figure 13.
Sand tail developing directly downwind of a building (a) in the field and (b) simulated in the wind tunnel (photos: M. Sherzad).
Figure 14.
Sand pattern around two cubic buildings in (a) the town of Al-Madam (photo: G. Cacace/AFP) and (b) simulated in the wind tunnel (photo: D. Goossens).
Figure 14.
Sand pattern around two cubic buildings in (a) the town of Al-Madam (photo: G. Cacace/AFP) and (b) simulated in the wind tunnel (photo: D. Goossens).
Figure 15.
Airflow pattern around a building oriented perpendicular to the wind.
Figure 15.
Airflow pattern around a building oriented perpendicular to the wind.
Figure 16.
Diagram illustrating the sand accumulation parameters for a single-standing building.
Figure 16.
Diagram illustrating the sand accumulation parameters for a single-standing building.
Figure 17.
Effect of building height on sand accumulation around single-standing buildings. (
a) Effect on Ud, Sd, Uch, and Ucd; (
b) Effect on STL. (See
Figure 16 for explanation of symbols).
Figure 17.
Effect of building height on sand accumulation around single-standing buildings. (
a) Effect on Ud, Sd, Uch, and Ucd; (
b) Effect on STL. (See
Figure 16 for explanation of symbols).
Figure 18.
Effect of building width on sand accumulation around single-standing buildings. (
a) Effect on Ud, Sd, Uch, and Ucd; (
b) Effect on STL. (See
Figure 16 for explanation of symbols).
Figure 18.
Effect of building width on sand accumulation around single-standing buildings. (
a) Effect on Ud, Sd, Uch, and Ucd; (
b) Effect on STL. (See
Figure 16 for explanation of symbols).
Figure 19.
Effect of building length on sand accumulation around single-standing buildings. (See
Figure 16 for explanation of symbols).
Figure 19.
Effect of building length on sand accumulation around single-standing buildings. (See
Figure 16 for explanation of symbols).
Figure 20.
(a) Diagram illustrating the sand accumulation parameters for two cubic buildings; (b) sand accumulation pattern in the wind tunnel (photo: M. Sherzad).
Figure 20.
(a) Diagram illustrating the sand accumulation parameters for two cubic buildings; (b) sand accumulation pattern in the wind tunnel (photo: M. Sherzad).
Figure 21.
Effect of gap size on sand accumulation for two cubic and two rectangular-shaped buildings next to each other. (
a) Effect on SDL; (
b) Effect on SDCd and SDCh. (See
Figure 20a for explanation of symbols).
Figure 21.
Effect of gap size on sand accumulation for two cubic and two rectangular-shaped buildings next to each other. (
a) Effect on SDL; (
b) Effect on SDCd and SDCh. (See
Figure 20a for explanation of symbols).
| Publisher’s Note: MDPI stays neutral with regard to jurisdictional claims in published maps and institutional affiliations. |
© 2022 by the authors. Licensee MDPI, Basel, Switzerland. This article is an open access article distributed under the terms and conditions of the Creative Commons Attribution (CC BY) license (https://creativecommons.org/licenses/by/4.0/).


