Plantar heel pain is a common condition that affects 10% of the population in their lifetime [
1,
2]. More than 1 million patients are reportedly treated for plantar fasciitis (PF) annually in the United States [
3]. The condition is more frequently observed in athletes and middle-aged people [
4,
5], which also affects their quality of life [
6]. The leading theory regarding PF etiology is biomechanical overuse [
7] resulting from prolonged standing or running with a chronic degenerative process [
8]. Some nonmodifiable factors associated with PF are plantar fascia thickness and calcaneal spur [
9]. However, given the widespread prevalence and considerable economic burden [
10] of PF, identifying more modifiable risk conditions other than higher body mass index (BMI [calculated as the weight in kilograms divided by the square of the height in meters]), or activity level, that previously determined PF [
11] is worthy of investigation.
Hyperlipidemia is associated with tendon disorders such as Achilles, lateral epicondylitis, and rotator cuff tendinopathies [
12,
13,
14], and thus, it may have a role in the pathophysiology of PF as well. Because deposition of cholesterol in tendon leads to persistent and mild inflammation, it can result in chronic tendon degeneration and biomechanical changes and compromise healing capacity [
15,
16], which might similarly affect the fascia. Diabetes is also associated with tendinopathies due to a poor healing process [
17]. One recent study reported the contributing role of total cholesterol (TC) level in PF development [
18]. We sought to investigate whether other lipid profile parameters and blood glucose levels are associated with PF. Thus, we could consider the strategy of improving body healing capacity through the modification of these factors.
In the present study, we, therefore, aimed to compare the 1) TC, 2) low-density lipoprotein cholesterol (LDL-C), 3) high-density lipoprotein cholesterol (HDL-C), 4) triglyceride (TG), and 5) fasting blood sugar (FBS) levels between patients with and without PF in a case-control study. The primary null hypothesis was that there is no difference in lipid profile and FBS levels between patients with and without PF.
Materials and Methods
Study Setting
This case-control study was performed in a tertiary hospital between January 1, 2017, and December 31, 2019. Patients were provided written informed consent forms before they enrolled. The study was approved by the Research Ethics Committee of Mashhad University of Medical Sciences (Mashhad, Iran) and was conducted in full compliance with the codes of ethical conduct of the Declaration of Helsinki.
Study Design and Patients
We enrolled 68 patients with the clinical diagnosis of PF in the case group and matched 136 healthy individuals at a ratio of 2:1 in the control group. Inclusion criteria were age 18 to 60 years; a PF clinical diagnosis, including start-up pain (pain during first steps in the morning or after a long time sitting, and reduction in pain with ambulation) with tenderness at the medial insertion of the plantar fascia to the calcaneus; and symptom duration of less than 3 months [
19]. In addition, patients with a history of trauma to the heel, injection or surgery due to previous heel pain, systemic arthritic problems (eg, rheumatoid arthritis, systemic lupus erythematosus, seronegative spondyloarthropathies), erythrocyte sedimentation rate greater than 20 mm/hr, and a positive C-reactive protein test were excluded from the study. The criteria for matching were age (±3 years) and sex. Patients in the control group were recruited from an orthopedic outpatient clinic and reported no history of heel pain or diagnosis of PF in their lifetime.
Variables
First, all of the patients in the case and control groups were asked to sign the consent form. After enrollment, the patients’ age, sex, unilateral or bilateral involvement, complete blood cell count, C-reactive protein level, and erythrocyte sedimentation rate were recorded. Patients’ height, weight, BMI, FBS level, lipid profile (including LDL-C, HDL-C, and TC levels), and TG level were checked at the first visit and saved in a coded spreadsheet file. Blood samples were obtained from participants in the control and case groups within 7 days of examination. The upper limit of normal values are as follows: cholesterol, 200 mg/dL; HDL-C, 40 mg/dL; LDL-C, 130 mg/dL; TG, 150 mg/dL; and FBS, 100 mg/dL.
Statistical Analysis
To find a meaningful difference between two independent groups using a t test with a medium effect size of 0.5 (minimal important difference), α error of 0.05, power of 90%, and an allocation ratio of 2:1, the sample size was 64 for the case group and 136 for the control group. Data were entered and analyzed using a statistical software program (IBM SPSS Statistics for Windows, Version 22.0; IBM Corp, Armonk, New York). For statistical calculations, the normality of variables was investigated for the interval variable. Mean differences of each variable between the two groups were tested using the independent t test. We calculated the odds ratio to quantify the strength of association between PF and elevated lipid profile using multivariate logistic regression analysis. The odds ratio is the ratio of the following: odds of developing the disease (D) given exposure (e) is De/He and of developing the disease given nonexposure (n) is Dn/Hn. Two events are independent if and only if the odds ratio equals 1.
The Kolmogorov-Smirnov test was used to evaluate the distribution of the variables. Because BMI has been previously shown to be related to lipid parameters' levels as well as the onset of PF, we examined the association of BMI with patients’ lipid profile and FBS levels to analyze the BMI variable as a confounder. Pearson and Spearman rank correlation coefficients were used to calculate the correlation between the normally and nonnormally distributed variables, respectively. A P < .05 was considered statistically significant.
Results
Descriptive Data
The mean ± SD age of the participants was 47 ± 11 years and 49 ± 12 years in the case and control groups, respectively (P = .32). The female-male ratio was 2.6:1 and was equal in the two groups. A total of 64.9% and 35.1% of the patients had unilateral and bilateral involvement, respectively. The obtained results showed no difference in the lipid profile parameters between males and females in either group.
Correlation Between Cholesterol Levels and PF
Patients with PF had a higher TC level, with a mean of 193 mg/dL (range, 134–275 mg/dL), than the control group, with a mean of 172 mg/dL (range, 117–221 mg/dL) (
P = .001). Hypercholesterolemia (TC level, >240 mg/dL) was detected in 23% of patients (n = 16) and in 13% of those in the control group (n = 18). The LDL-C level was significantly higher in patients with PF than in the control group (
P = .004). The HDL-C level was not different between the two groups (
P = .13) (
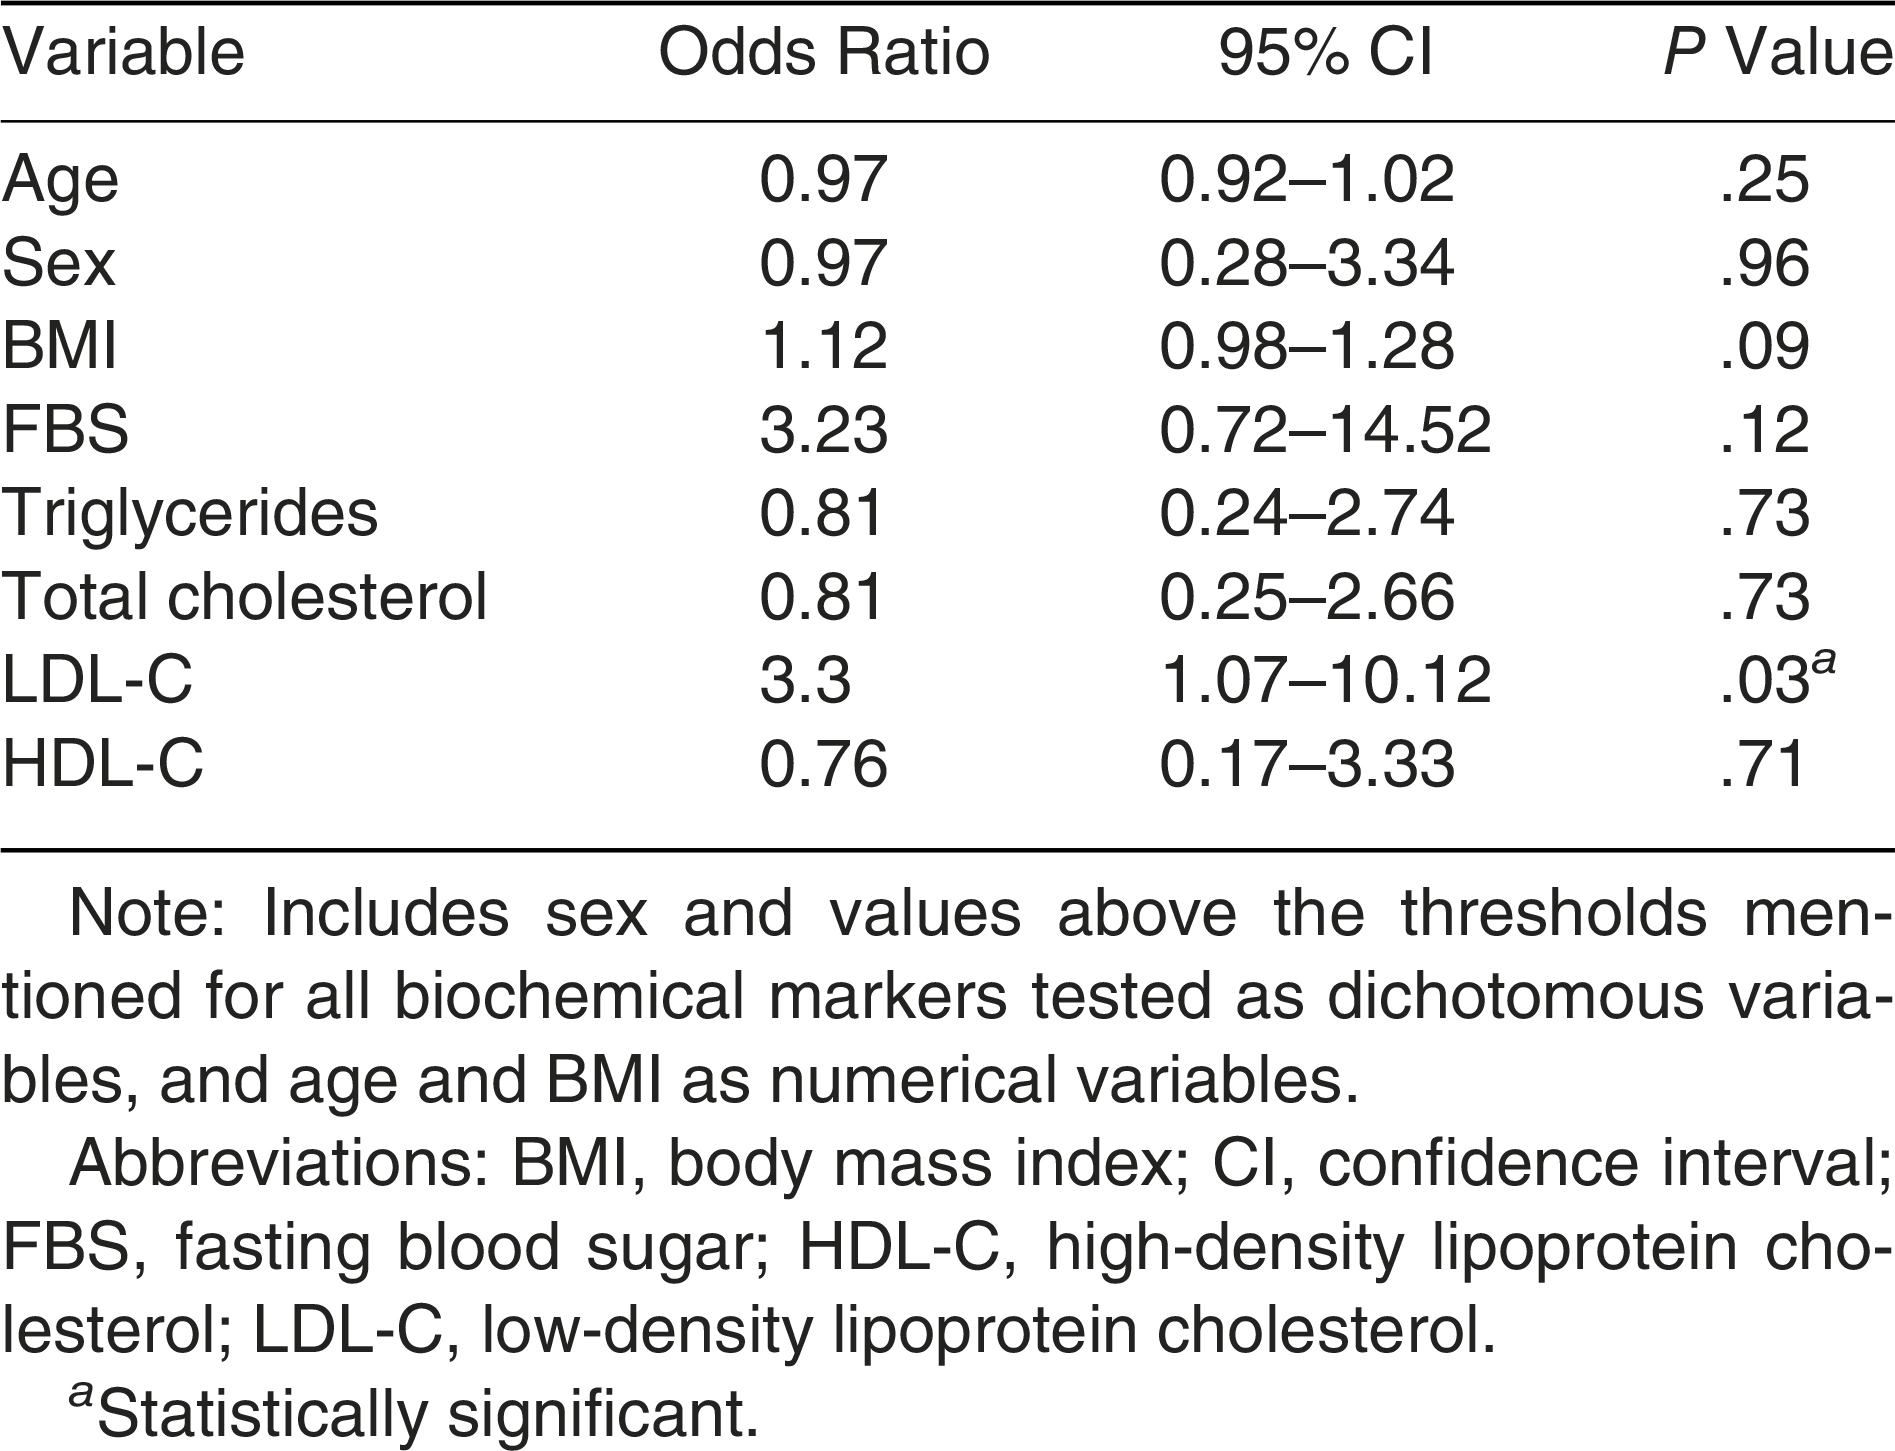
Table 1). Patients with serum levels of LDL-C greater than 130 mg/dL were 3.3 times more likely to have PF (
Table 2). The TC level did not result in significant association in the multivariate logistic regression model (
P = .73).
Table 1.
Comparison of Lipid Profile and Glucose Levels Between the Two Study Groups
Table 1.
Comparison of Lipid Profile and Glucose Levels Between the Two Study Groups
Table 2.
Multivariate Logistic Regression Analysis
Table 2.
Multivariate Logistic Regression Analysis
Association Between TG Level and PF
The TG level was significantly higher in patients with PF than in the control group (
P = .02) (
Table 1). In the multivariate logistic regression model, there was no significant difference (
P = .73).
Association Between Glucose Level and PF
The FBS level was not different between patients with PF and the control group (
P = .24) (
Table 1). In addition, in the multivariate logistic regression model, there was no significant difference (
P = .12).
Association Between BMI/Age and Biochemical Parameters
We found no association between lipid profile parameters and BMI in either of the two groups (
Table 3). Using multivariate regression analysis, no association was found regarding sex as a dichotomous variable and age and BMI as numerical variables between patients with and without PF (
Table 2).
Table 3.
Correlation of Body Mass Index with Lipid Profile Parameters
Table 3.
Correlation of Body Mass Index with Lipid Profile Parameters
Discussion
The etiology of PF is not clearly understood, and many factors may have contributed to the pathophysiology of this disorder. A relationship between hyperlipidemia and tendon disorders has been reported in several studies, which we speculate to have a role in the pathophysiology of PF. This study investigated whether patients with PF were more likely to have a higher lipid profile than control patients.
Key Findings
We found that patients with PF would be more likely to have higher LDL-C and FBS levels than patients with musculoskeletal problems other than PF. On the other hand, there was no correlation between lipid profile parameters and BMI among patients, indicating that the observed association between PF and lipid profile parameters was not confounded by their BMI. This combination of findings supports the modification of LDL-C and glucose levels when managing PF.
A systematic review showed higher rates of TC, LDL-C, and TG and lower HDL-C in people with altered tendon structure compared with those reported for healthy people [
20]. Ozgurtas et al [
13] identified hypercholesterolemia in 74% of patients with Achilles tendon rupture. Abboud and Kim [
12] reported significantly higher TC, LDL-C, and TG levels in patients with rotator cuff tears compared with normal rotator cuff tendons.
The deleterious role of a cholesterol-rich environment in embryonic animal fibroblasts, tail tendon, and skin, as well as tendon biomechanics, is confirmed by animal studies [
21]. It seems that deposition of cholesterol in tendons leads to persistent and mild inflammation, and it may also change the extracellular matrix of tendons and fascia [
22]. This can result in chronic tendon degeneration and biomechanical changes.
Metabolic parameters might rapidly worsen due to the limitation of physical activity resulting from PF, especially in those who have complete bed rest [
23,
24]. This phenomenon may have suggested the reverse causality between these two variables (ie, lipid profile and tendon disorder). However, the strong association of LDL-C and TG with recent-onset pain provides strong evidence against reverse causation.
Tendinopathy has been reported as both an adverse effect of statin drug use and a consequence of hyperlipidemia [
25,
26]. Long-term statin use changed how the collagen fibers were organized and reduced the structural integrity of the tendons, which made them more prone to rupture [
26]. On the other hand, having a high cholesterol level is related to tendon deterioration [
25]. It is critical to consider the tendinopathy mechanism (circulation impairment, inflammation, oxidative stress, etc), the researched model (human or animal), and the duration of statin treatment when evaluating the findings from studies that examine the associations among statin use, hypercholesterolemia, and tendinopathies.
In the present investigation, there was no noticeable difference in the FBS level between the case and control groups. However, according to another study, the prevalence of PF differs significantly between people who are healthy and people who have diabetes [
27]. Considering the diabetes criteria, the glucose level is substantially different between the two groups in the mentioned study, although the present recruited sample's glucose levels did not differ significantly from one another. The disparity in outcomes is explained by two different methods.
Limitations
This study has some limitations. The present study was a case-control study, and causation cannot be established based on such data. Therefore, it could not be claimed that there is a definitive relationship between PF and cholesterol levels. Long-term studies are required to determine whether there is a causal relationship between the lipid profile and fasciopathy. The systematic bias of blood lipid analysis as a standardized laboratory procedure is low. However, the blood collection process may introduce bias. Blood samples were taken from the patients at various times after the appearance of symptoms consistent with PF. In addition, we might have a selection bias because the control group was selected from patients referred to an orthopedic clinic with a musculoskeletal problem, and they may not be a true representation of the general population. Future studies with sampling from the general population would eliminate this bias.
Conclusions
A higher level of serum LDL-C parameters was seen in patients with PF, which may be a risk factor for developing this disorder. These results could provide enough justification for a future therapeutic clinical trial involving statins for persistent PF with elevated LDL-C level. Further studies should be designed to certify the cause and effect between hyperlipidemia and PF, and in the general population and not in orthopedic patients only.