Of the numerous functional soft tissues of the foot, the plantar fascia (PF) has received a lot of attention owing to its association with heel pain and the prevalence of several of its other pathologic abnormalities [
1,
2] Ultrasound (US) as a noninvasive method for examining the PF is well established and the focus of several existing literature articles [
3]. One distinct observable diagnostic criteria of plantar fasciitis is increased thickening and hypoechogenicity of the PF visible on US [
4]. Histologically, the PF has similar tissue characteristics when compared to most other tendons, consisting of a fibrous cellular matrix made up of collagen, reticulin and elastin [
4,
5], and shares physiological similarities during the tissue healing process. Increases in cross-sectional area (CSA) and width are primary observable findings of diagnostic US examinations of tendon pathologies [
6]. During rehabilitation of tendon pathologies, US may be used to monitor the changes in structural and morphological properties of soft tissues, including thickness, CSA, width, and echogenicity [
5,
6,
7], as well as investigating mechanical adaptations of tendons to loading [
5,
7].
Because of similarities in tissue characteristics of the PF and tendons, it is important that clinicians and researchers understand and are able to determine changes in PF width and CSA attributable to pathology, as well as structural adaptations of healthy asymptomatic PF following repetitive loading [
8,
9]. This has proven to be of immense clinical and scientific value in US examinations of healthy asymptomatic as well as pathological tendons, providing a greater understanding of both structural and biomechanical properties of both healthy and pathological tendons [
10,
11,
12].
Although US examination of the structural properties of the PF is a real-time and operatordependent technique, several factors, including transducer placement and handling, machine settings, and patient positioning, may influence the size and appearance of the PF [
12,
13,
14].
To our knowledge, no previous study has examined PF CSA or width measurement using US in humans. Authors who have previously investigated PF width measurements reported results using cadaver foot specimens [
15,
16,
17], reporting a mean width of 15.45 mm [
15]. We hypothesized that through the use of a standardized protocol described extensively for measurements of PF width and CSA, we will be able to obtain at least fair intrarater and interrater reliability for PF CSA and width measurements (intraclass correlation coefficient [ICC] 0.40-0.70) as well as a relative standard error of the mean (SEM%) and a relative limits of agreement (LOA%) of 20% or less. We also expected to obtain higher reliability using the mean of three measurements from three sonograms each measured once compared with using one measurement from one sonogram.
Methods
Participant Selection
Ten healthy volunteers (seven males and three females) aged 18 to 35 years and without lowerextremity symptoms were recruited for this study. The exclusion criteria were a history of surgery to the foot and current or previous pain in the PF. Participants provided informed consent on forms approved by the Ethics Committee of the University of Potsdam.
Test Procedure
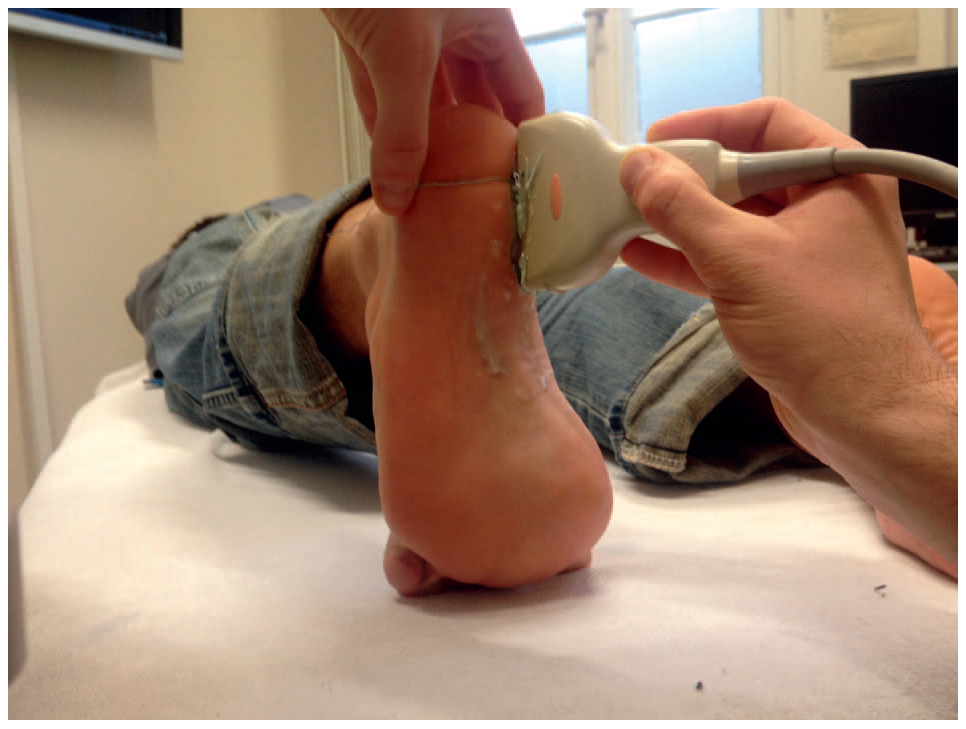
The scanner used was a Toshiba Xario (Toshiba Medical Systems Corporation, Japan) equipped with an 8-MHz linear transducer probe, with a contact surface area approximately 7 cm long and 1 cm wide. The settings of the US scanner, including the gain, depth (3 cm), and focus (1–2 cm), were kept constant during all measurements to avoid potential changes in the images. Participants were positioned prone with the toes dorsally flexed, and the talocrural joint was positioned in 08 flexion. Because the PF is attached at the plantar surface at the toes, dorsal flexion of the toes creates tension in the PF, making the borders of the fascia more clearly defined. A fine-wire technique was used in this study to enable the exact identification of different regions of the PF on the sole of the foot because there are no bony landmarks in the short axis. This technique also facilitates obtaining subsequent transverse scans for width and CSA measurements of the PF. The insertion of the central bundle of the PF at the medial calcaneal tubercle was first identified in real time by performing a longitudinal PF US examination (
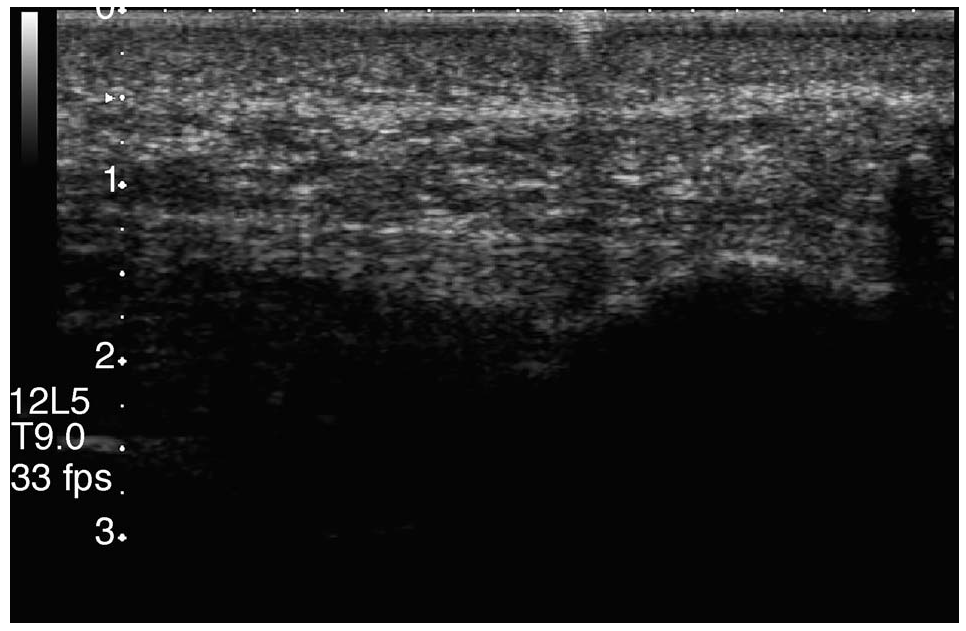
Figure 1), with the fine wire placed firmly on the plantar surface of the foot and underneath the transducer head. The fine wire was then moved while still underneath the transducer and visible in real time (
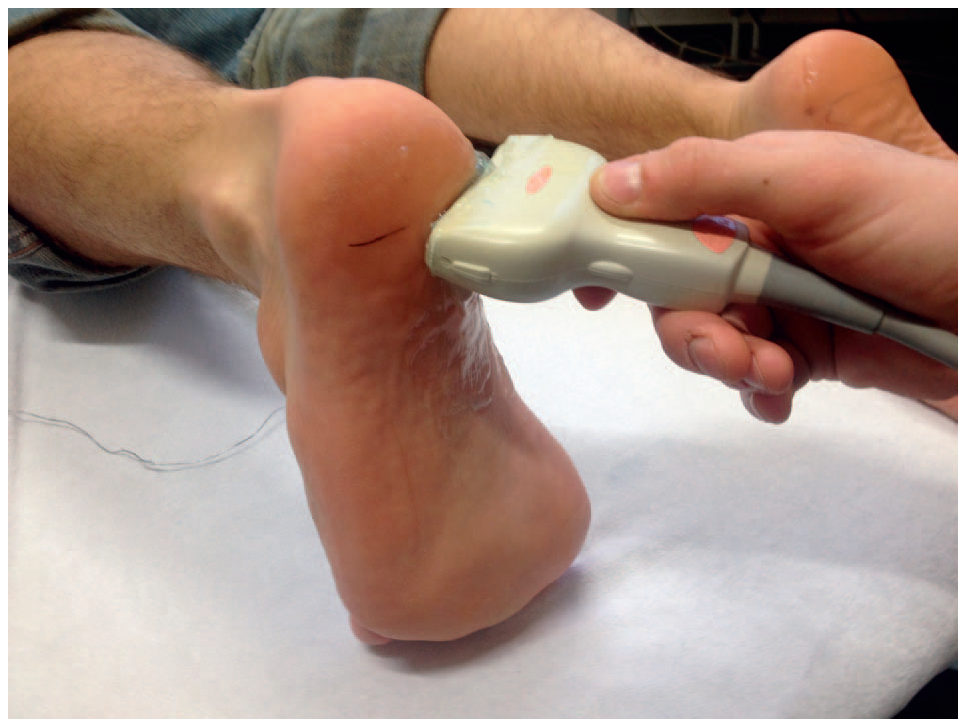
Figure 2) on the US display screen, to be aligned parallel with the insertion point of the PF central bundle. This position of the fine wire was noted and marked with a nonpermanent marker, and then the identified area was transversely imaged (
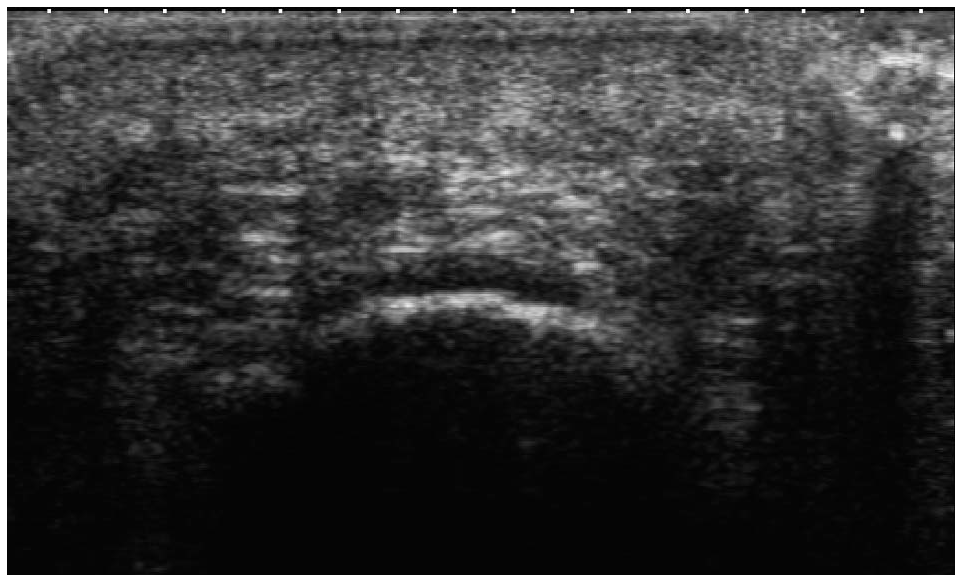
Figure 3). Three measurements were performed for each foot with the transducer head lifted off the sole of the foot and subsequently repositioned between measurements. The soles of both feet were wiped clean after three transverse scans (
Figure 4) were obtained for both left and right feet to clear off visible markings. The measurement protocol was then commenced and repeated by the second rater. The retest was performed approximately 45 minutes after the initial test. This resulted in a total of 240 images (3 × 3 × 2 [left and right foot] 3 × 10 [participants] 3 × 2 [test and retest] 3 × 2 [investigators]). Care was taken not to apply pressure to the foot through handling of the transducer head, to maintain the same standardized foot position and to keep the ultrasound’s settings constant to replicate the same measurement. The two raters (A.B. and M.R.) were experienced in musculoskeletal examinations of soft tissues using ultrasound.
Image Analysis
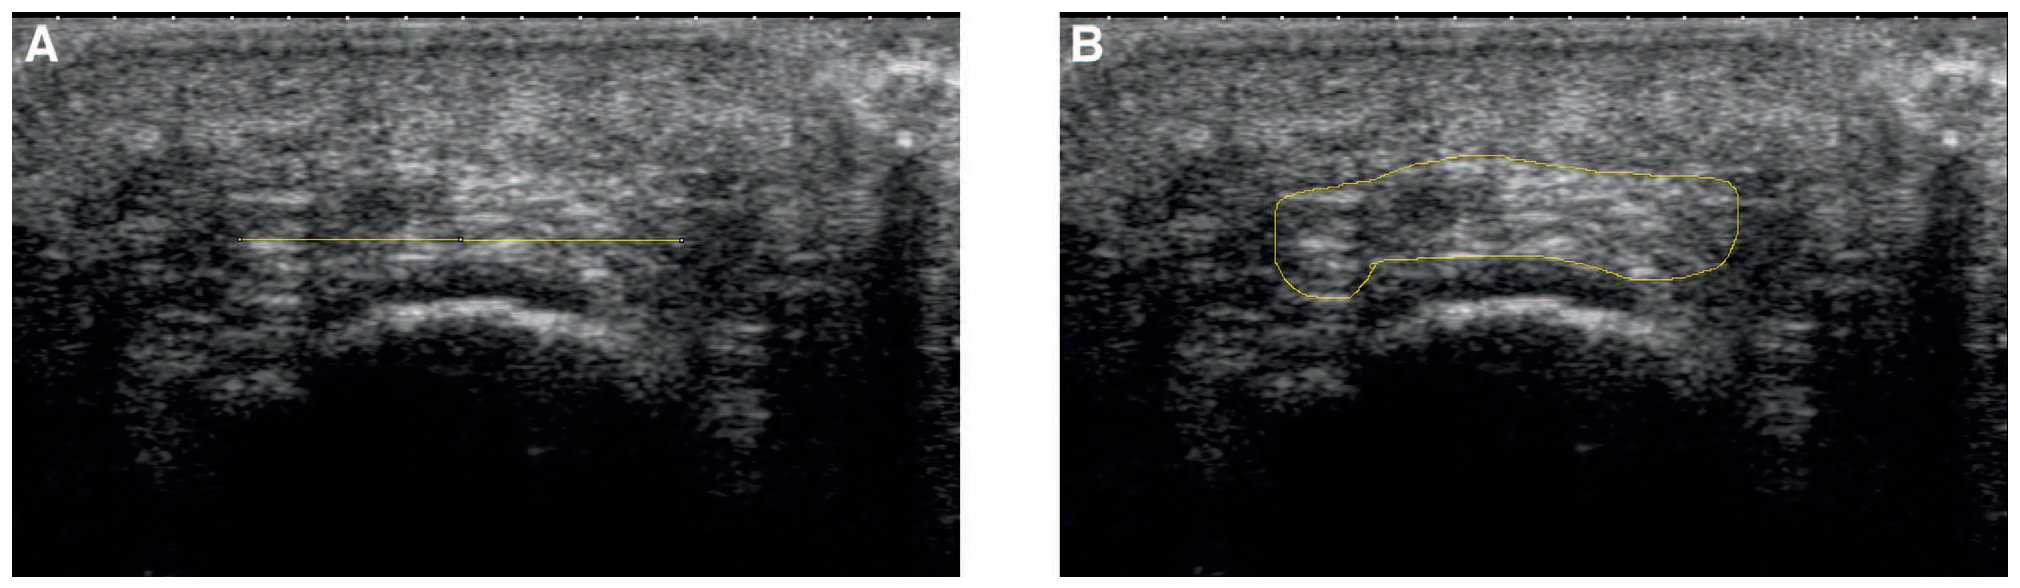
On each sonogram, PF CSA and width were measured using an image-processing and analysis software program (Image J, version 1.49; National Institutes of Health, Bethesda, Maryland), with a zoom of 300% and a calibrated scale of 12.7152 pixels/mm [
12]. The ends of the calibrated digital line were aligned with the echoic borders of the fascia at its most visible expansion on the sonogram for measurement of the PF width (
Figure 5A) and CSA (
Figure 5B). A mean of the three sonograms for each foot at test and retest for CSA and width was used as the final outcome.
Statistical Analysis
Statistical analysis was performed using IBM SPSS Statistics for Windows, Version 21.0 (IBM Corp, Armonk, New York). Data were descriptively described using mean and standard deviation (mean 6 SD) before a paired samples t test was performed to determine if there were differences in mean PF width and CSA between the left and right feet. The relative reliabilities were expressed as ICCs (95% confidence intervals) of the type (2,k) for interrater reliability and ICC type (3,k) for intrarater reliability group with agreement between ICC interpreted as poor ,0.50, moderate 0.50–0.75, good 0.75–0.90, and excellent,0.90. Absolute reliability was determined using the limits of agreement (LOA) and the standard error of measurement (SEM) expressed as a percentage of the mean. Relative and absolute reliability was compared between measurements from one sonogram and using the mean of three sonograms within both raters (intrareliability) and between both raters (interrater reliability).
Results
The results of the US measurements of the PF CSA and width are summarized in
Table 1.
Intrarater Reliability
Relative Reliability. The ICCs (95% CIs) for each rater are summarized in
Table 2. A lower ICC was derived for both raters when reliability was determined using one measurement from one sonogram compared with using the mean width and CSA from three sonograms. Results showed good-to-excellent reliability (ICC ≥ 0.84) for width (ICC = 0.84 and 0.91) and CSA (ICC = 0.92 and 0.97) measurements for raters 1 and 2, respectively (
Table 2).
Absolute Reliability. Random error and systematic bias were higher when absolute reliability was determined using one sonogram compared with using a mean width and CSA from three sonograms. Using a mean of three measurements from three sonograms, results showed SEMs for width measurements of 0.63 and 0.93 mm for both raters. Values for SEM% and LOA% of 10% or less were also observed for both raters (
Table 2). For CSA measurements, SEMs of 2.0 and 4.62 mm and SEM% and LOA% values of 10% or less were observed for bot h raters (
Table 2).
Interrater Reliability
Relative Reliability. A lower ICC was derived for both raters when reliability was determined using one measurement from one sonogram compared with using mean width and CSA values from three sonograms. Using a mean of three sonograms, results showed good interrater reliability (ICC ≥ 0.80) for width (ICC = 0.82; 95% CI, 0.56–0.93) and CSA (ICC = 0.87; 95% CI, 0.67–0.95) measurements between raters (
Table 2).
Absolute Reliability. Random error and systematic bias were higher when absolute reliability was determined using one sonogram compared with using mean width and CSA values from three sonograms. Using a mean of three sonograms, results showed an SEM for width measurements of 0.83 mm with a minimal detectable change at 95% CI of 2.32 mm between raters. Values for SEM% and LOA% of 10% or less were observed (
Table 2). For CSA measurement, a SEM of 4.93 mm
2 was observed between raters. Results also showed SEM% of 10% or less and LOA% of 20% or less (
Table 2).
Discussion
To our knowledge, this is the first study to examine either or both the width and CSA of the human PF in a healthy human population with similar levels of physical activity. In the present study, we described a new standardized protocol for US measurement of PF width and CSA in human subjects. In addition, we investigated the relative and absolute intrarater and interrater reliability of this protocol. In the present sample of physically active and healthy people with no lower-limb and, specifically, PF pathology, the results of this study showed an overall mean 6 SD for PF width and CSA measurement of 18.6 6 2.0 mm and 69.20 6 13.6 mm
2, respectively. This was similar to the results of Chen et al [
15], who reported a mean PF width of 15.45 mm measured from cadaver samples using a vernier caliper. The PF mean width measurement in this study is also similar to those reported by Saraffian [
16], who–using cadaver specimens–reported that PF width may range from 15 to 20 mm (1.5–2.0 cm). Whereas the present study determined PF width and CSA using US, both authors mentioned previously herein measured PF width using a vernier caliper on cadaveric specimens.
Another possible explanation that may account for the slight differences seen comparing the results of this study with those of Chen et al [
15] and Saraffian[
16] may be the inevitable morbid changes in structuraland morphological properties of soft tissues in thawed cadaver specimens, with an absence of vascularization, collagen and protein synthesis, and reduced microvascular volume. Studies have reported reduced maximum stress, stiffness, corresponding strain at maximum stress, strain energy densities up to corresponding strain, and from corresponding strain until complete rupture in cadaveric tendons[
18,
19,
20] Although, US measurements of PF width and CSA may not be considered the gold standard, which is derived from measurement of anatomical specimens, the results as shown in this study are similar. Although magnetic resonance imaging (MRI) may also be used for PF imaging, differences were reported by Moraes do Carmo et al [
17] in their study, which compared US and MRI measurement of PF central bundle thickness 1 cm distal from its medial calcaneal insertion using ten cadaveric specimens. The authors reported mean PF thicknesses of 3.8 mm (range, 3.3–4.9 mm) and 4.6 mm (range, 3.1–7.6 mm) for US and MRI, respectively. Although the authors could not provide a reason for these differences, one possible explanation for the wide range in PF width and CSA for MRI and US may be the difference in thaw cycles of the cadaveric specimens or preservation temperatures. Studies have shown that there are some reductions in properties of tendons after preservation under different temperatures and at different cadaveric thaw cycle increases [
18,
19,
20].
In addition, the present population included young and physically active individuals (70% male). Several studies have reported differences in width, thickness, and CSA of tendons between sedentary and active populations and between different age groups, sexes, and leg dominance [
6,
18,
20,
21,
22]. Physical activity participation by participants in this study and participant demographics may also have contributed to the overall mean results of CSA and width observed in this study.
Relative and absolute reliability were higher using a mean of width and CSA measurements from three sonograms compared with one sonogram with lower random error and systematic bias. Although obtaining three sonograms during clinical examination may not be practical due to time constraints, measurement of PF width and CSA derived from one measurement has relatively good reliability. Using a mean of three sonograms, the intrarater reliability for each rater was higher for PF CSA measurements compared with width measurements (ICC = 0.84 and 0.91; and ICC = 0.92 and 0.97, respectively). One possible explanation for the higher intrarater and interrater ICCs for CSA compared with width may be the variation in echogenicity of the tendons and surrounding tissues [
18]. Although the echoic superior and inferior borders of the PF were easily identifiable on the sonogram [
12], the same cannot be said of its lateral border due to variation in its echogenicity across its structure. This may have resulted in reduced accuracy in identifying its lateral borders at its most lateral expansion for width measurements. Limits of agreement based on intratester reliability shows that changes larger than 1.11 mm and 3.20 mm
2 for PF width and CSA, respectively, can be considered actual changes in width and CSA and not a result of measurement error.
Interrater reliability was good, with ICCs of 0.82 and 0.87 for width and CSA, respectively, corresponding to 4.48% and 7.12% SEM%, which approximately corresponds to LOA of 1.62 mm and 7.87 mm
2 for PF width and CSA, respectively. Although the SEM and LOA are comparable if study designs are similar [
23,
24,
25,
26], both were treated as separate measures for determining absolute reliability in this study.
Strengths and Limitations
This study was able to reproduce placement of the transducer head on the soles of the feet for obtaining the transverse sonogram of the PF at test and retest with use of the fine wire technique. Both raters measured PF width and CSA using their individual sonograms taken for each foot at test and retest. Studies have reported a higher interrater ICC for US measurements of PF structural properties when both observers measure the same scans compared with obtaining outcome values from separate scans. This may indicate that the scan itself may be an additional contributing source of measurement error. Furthermore, thickness of the PF is not identical across the entire insertion onto the calcaneus, thus resulting in increased measurement errors of its structural properties, in addition to the difficulty in identifying the portion of the PF being imaged when taking a transverse scan.
Conclusions
Measurement of PF width and CSA by US using the proposed standardized technique used in this study is reliable and may be of importance in clinical examinations of the PF for the diagnosis of pathologic abnormalities or in research. If the same observer measures the same PF twice, the difference recorded will be less than 1.11 to 1.49 mm (ICC = 0.84–0.91) for width and 3.20 to 6.76 mm2 (ICC = 0.92–0.97) for CSA in 95% of the examinations when using the mean of three sonograms. If two different observers examine the same individual twice, the measurement error will be a maximum of 1.62 mm (ICC = 0.82) for width and 7.87 mm2 (ICC = 0.87) for CSA in 95% of the examinations.
Brief Summary
US measurements of PF thickness and echogenicity as outcome measures have been found to be reliable in the literature.
Diagnostic utility in the measurement of PF width and CSA has not been explored.
Studies have reported changes in the width and CSA of Achilles and patella tendons as response to exercise loading, although no information exists on these adaptations in healthy or pathologic PF.
Highlight of Study Outcomes
This study introduced a technique using US for PF width and CSA measurement.
US measurement of PF width and CSA is reliable within and between raters.
US measurements of healthy PF width and CSA are similar to values from anatomical specimens, and US can be used as diagnostic outcomes in PF pathologies or in intervention studies on healthy PF adaptations or responses to exercise.