Financial Literacy, Trust, and Socioeconomic Determinants of Borrowers’ Behavior in Credit Card Use: A PLS-SEM Analysis

 ,
,  , , , and
Abstract
1. Introduction
2. Theoretical Framework
2.1. Credit Cards as Behavioral Financial Instruments
2.2. Socioeconomic and Demographic Determinants
- Purchasing power (income level): Higher income strengthens repayment capacity and reduces the likelihood of revolving balances. In comparison, lower income increases reliance on credit as a recurrent financing mechanism (Horvath et al., 2023).
- Employment stability: Regular income flows reduce delinquency risk and are positively associated with full repayment patterns (Aydın, 2022).
- Asset ownership: Holding financial or tangible assets enhances perceived financial security and encourages more disciplined credit management (Islam & Picault, 2025).
- Age: Younger consumers tend to exhibit higher risk tolerance and greater spending intensity, which increases the use of deferred payments. Older adults generally display more conservative repayment practices (Fulford & Schuh, 2024).
- Gender: Women typically exhibit greater budgeting discipline and financial caution, whereas men tend to display more convenience-driven or speculative use of credit (Bastidas-Guerrón et al., 2025).
- Education and financial literacy: Education facilitates analytical capacity and long-term planning, while financial literacy reinforces the ability to evaluate credit terms and manage repayment obligations (Méndez-Prado et al., 2023).
2.3. Cognitive and Attitudinal Mechanisms
2.4. Integrated Behavioral Model and Theoretical Closure
3. Materials and Methods
3.1. Definition of the Population and Sample
- e: sampling error
- Z: constant of the normal distribution (1.96 for a 95% confidence level)
- p: proportion of success = 0.5
- q: proportion of failure = 0.5
- N: population size = 3,786,867
- n: sample size = 550
3.2. Instrument Design
- Demographic variables characterizing the sample.
- Credit card ownership and number of cards held.
- Usage patterns (supermarkets, restaurants, online purchases, clothing/accessories, travel and entertainment, health, payment of other services, and others).
- Usage frequency (daily, weekly, monthly, or only in emergencies).
- Payment behavior (full payment, minimum payment, balance rotation, deferred payments with/without interest).
- Percentage of income allocated to payments (<10%, 10–25%, 26–50%, >50%).
- Difficulty in meeting payments (not difficult, slightly difficult, somewhat difficult, very difficult).
- Purchasing power (income and perceived sufficiency).
- Financial literacy, covering knowledge, attitudes, and behaviors:
- ⚬
- Knowledge: five statements rated on a five-point Likert scale.
- ⚬
- Attitudes and self-efficacy: three statements rated on a five-point Likert scale.
- ⚬
- Behavior: five statements rated on a five-point Likert scale.
- Trust in the financial system, assessed through six statements on a five-point Likert scale.
3.3. Constructs and Hypotheses
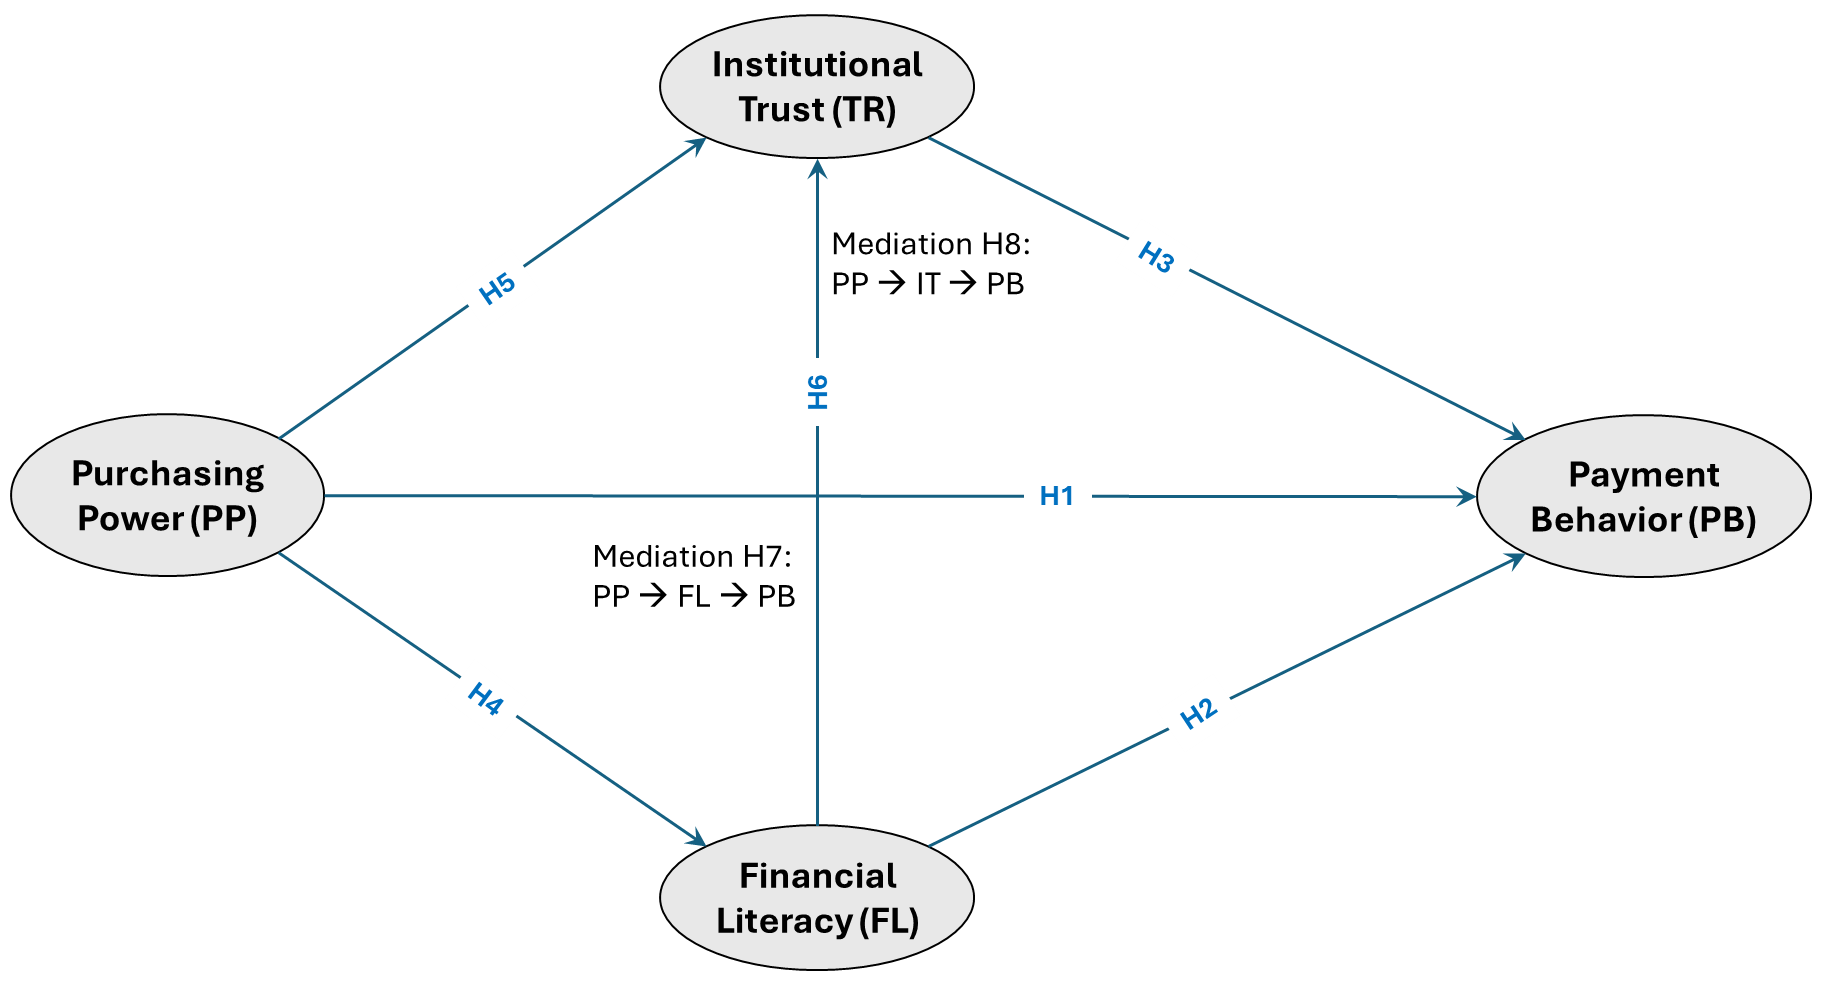
- Purchasing Power (PP): formative construct composed of monthly income and perceived sufficiency.
- Financial Literacy (FL): second-order reflective construct composed of three first-order dimensions—knowledge, behavior, and attitudes.
- Institutional Trust (IT): reflective construct.
- Payment Behavior (PB): formative construct including payment type, deferred payment use, proportion of income, and perceived difficulty.
3.4. Data Processing
4. Results
4.1. Individual Variables
4.2. Family-Related Variables
4.3. Employment- and Income-Related Variables
4.4. Statistical Significance and Construct Validation
4.5. Structural Model Evaluation and Final Results
5. Discussion
5.1. General Analysis of Results
5.2. Limitations and Recommendations for Future Research
- Adopt longitudinal designs to capture how credit use and repayment behavior evolve in response to macroeconomic fluctuations such as inflation, financial crises, or policy reforms.
- Deepen comparative analyses across gender and age groups, as behavioral differences observed in this study remain insufficiently examined in Ecuadorian research (Bastidas-Guerrón et al., 2025).
- Examine how social capital and the role of financial institutions influence credit card usage and repayment discipline, building on recent evidence of their importance in cooperative-based credit environments (Salinas Vásquez et al., 2024).
- Evaluate public policies and financial education initiatives oriented toward strengthening institutional trust and improving financial capability, assessing their direct effects on responsible borrowing and debt sustainability.
6. Conclusions
Author Contributions
Funding
Institutional Review Board Statement
Informed Consent Statement
Data Availability Statement
Acknowledgments
Conflicts of Interest
Appendix A. Detailed Demographic and Behavioral Tables

| Variable/Category | Gender | Age Group | Education Level | |||||||||||
|---|---|---|---|---|---|---|---|---|---|---|---|---|---|---|
| (a) | (b) | (c) | (d) | (e) | (f) | (g) | (h) | (i) | (j) | (k) | (l) | (m) | ||
| Number of credit cards | 1.82 | 1.89 | 2.31 | 1.74 | 1.84 | 2.01 | 1.89 | 1.89 | 1.81 | 1.68 | 1.91 | 1.91 | 1.86 | |
| Usage patterns | Supermarkets | 91 | 118 | 8 | 33 | 47 | 39 | 35 | 37 | 26 | 31 | 57 | 111 | 18 |
| Restaurants | 107 | 95 | 6 | 32 | 47 | 44 | 40 | 25 | 20 | 32 | 48 | 106 | 22 | |
| Online purchases | 94 | 117 | 3 | 32 | 47 | 43 | 42 | 29 | 21 | 37 | 53 | 100 | 24 | |
| Clothing | 82 | 118 | 6 | 26 | 46 | 44 | 45 | 32 | 13 | 35 | 50 | 106 | 15 | |
| Accessories | 114 | 110 | 9 | 38 | 54 | 36 | 37 | 42 | 26 | 35 | 50 | 106 | 15 | |
| Travel | 101 | 94 | 7 | 31 | 45 | 39 | 41 | 33 | 13 | 35 | 66 | 113 | 19 | |
| Health | 87 | 117 | 4 | 39 | 41 | 47 | 30 | 31 | 20 | 26 | 59 | 94 | 19 | |
| Payment of services | 90 | 105 | 3 | 0 | 0 | 0 | 59 | 87 | 52 | 33 | 46 | 102 | 21 | |
| Other | 22 | 26 | 2 | 16 | 11 | 14 | 10 | 12 | 13 | 32 | 53 | 97 | 26 | |
| Usage frequency | Daily | 36 | 38 | 2 | 15 | 20 | 11 | 12 | 11 | 7 | 12 | 22 | 39 | 3 |
| Weekly | 101 | 91 | 5 | 37 | 37 | 42 | 38 | 28 | 15 | 26 | 51 | 94 | 26 | |
| Monthly | 90 | 125 | 7 | 31 | 48 | 39 | 40 | 41 | 23 | 36 | 63 | 106 | 17 | |
| Occasional | 26 | 27 | 2 | 2 | 12 | 15 | 12 | 7 | 7 | 11 | 10 | 29 | 5 | |
| Payment behavior | Full payment | 143 | 168 | 8 | 58 | 68 | 55 | 59 | 52 | 27 | 44 | 85 | 156 | 34 |
| Minimum payment | 43 | 31 | 2 | 13 | 13 | 12 | 20 | 10 | 8 | 15 | 13 | 43 | 5 | |
| Balance rotation | 67 | 82 | 6 | 14 | 36 | 40 | 23 | 25 | 17 | 26 | 48 | 69 | 12 | |
| Installments with interest | 60 | 66 | 4 | 20 | 24 | 27 | 20 | 29 | 21 | 21 | 27 | 24 | 20 | |
| Interest-free installments | 131 | 160 | 9 | 64 | 51 | 54 | 58 | 45 | 58 | 56 | 56 | 55 | 47 | |
| Income allocated to payments | <10% | 135 | 149 | 9 | 48 | 59 | 53 | 51 | 55 | 27 | 41 | 79 | 149 | 24 |
| 10–25% | 73 | 77 | 4 | 22 | 35 | 32 | 33 | 18 | 14 | 22 | 40 | 77 | 15 | |
| 26–50% | 29 | 46 | 1 | 13 | 18 | 14 | 13 | 11 | 7 | 16 | 22 | 29 | 9 | |
| >50% | 16 | 9 | 2 | 2 | 5 | 8 | 5 | 3 | 4 | 6 | 5 | 13 | 3 | |
| Usefulness perception | Useful financial tool | 96 | 108 | 4 | 35 | 46 | 34 | 41 | 30 | 22 | 33 | 55 | 105 | 15 |
| Emergency aid | 70 | 77 | 3 | 20 | 33 | 36 | 23 | 26 | 12 | 23 | 43 | 72 | 12 | |
| Over-indebtedness source | 65 | 70 | 7 | 18 | 26 | 29 | 31 | 22 | 16 | 20 | 37 | 65 | 20 | |
| Other | 22 | 26 | 2 | 15.2 | 11 | 14 | 9.5 | 11.9 | 13.2 | 32 | 53 | 97 | 26 | |
| Difficulty paying balance | 3.54 | 3.55 | 3.79 | 3.81 | 3.92 | 3.62 | 3.50 | 3.64 | 3.83 | 3.63 | 3.59 | 3.73 | 3.70 | |
| Improves quality of life | 3.54 | 3.58 | 3.55 | 3.63 | 3.45 | 3.65 | 3.90 | 3.39 | 3.46 | 3.42 | 3.45 | 3.51 | 3.54 | |
| How the card is used | 3.61 | 3.62 | 3.62 | 2.88 | 3.48 | 3.49 | 3.68 | 3.59 | 3.72 | 3.65 | 3.85 | 3.56 | 3.57 | |
| Knowledge | 3.58 | 3.58 | 3.51 | 3.49 | 3.59 | 3.61 | 3.52 | 3.43 | 3.58 | 3.55 | 3.52 | 3.59 | 3.54 | |
| Attitudes | 2.96 | 2.96 | 2.96 | 3.02 | 2.97 | 2.89 | 3.01 | 2.90 | 3.02 | 3.01 | 2.87 | 2.94 | 2.93 | |
| Behavior | 3.02 | 3.02 | 2.90 | 2.99 | 2.90 | 2.94 | 2.95 | 3.03 | 3.00 | 2.90 | 2.98 | 2.90 | 2.99 | |
| Institutional trust | 3.05 | 3.06 | 3.00 | 3.04 | 3.07 | 3.05 | 3.05 | 3.08 | 2.99 | 3.04 | 3.03 | 3.04 | 2.88 | |
| Variables | Marital Status | Household Composition (Persons) | ||||||
|---|---|---|---|---|---|---|---|---|
| Single | Married | Divorced | 1 | 2–3 | 4–5 | >5 | ||
| Number of credit cards | 1.83 | 1.93 | 1.77 | 1.87 | 1.87 | 1.88 | 1.83 | |
| Usage patterns | Supermarkets | 95 | 96 | 26 | 29 | 77 | 83 | 28 |
| Restaurants | 94 | 94 | 20 | 22 | 73 | 88 | 25 | |
| Online purchases | 97 | 98 | 19 | 22 | 72 | 96 | 24 | |
| Clothing | 88 | 106 | 12 | 20 | 78 | 76 | 32 | |
| Accessories | 88 | 106 | 12 | 20 | 78 | 76 | 32 | |
| Travel | 109 | 102 | 22 | 23 | 74 | 108 | 28 | |
| Health | 0 | 150 | 48 | 29 | 63 | 86 | 20 | |
| Payment of services | 88 | 102 | 12 | 28 | 59 | 86 | 29 | |
| Other | 94 | 95 | 19 | 25 | 68 | 87 | 28 | |
| Usage frequency | Daily | 41 | 29 | 6 | 9 | 22 | 32 | 13 |
| Weekly | 91 | 91 | 15 | 16 | 66 | 90 | 25 | |
| Monthly | 92 | 108 | 22 | 30 | 72 | 87 | 33 | |
| Occasional | 20 | 30 | 5 | 8 | 20 | 23 | 4 | |
| Payment behavior | Full payment | 144 | 150 | 25 | 36 | 102 | 136 | 45 |
| Minimum payment | 33 | 36 | 7 | 11 | 28 | 25 | 12 | |
| Balance rotation | 67 | 72 | 16 | 16 | 50 | 71 | 18 | |
| Installments with interest | 23 | 24 | 21 | 21 | 21 | 25 | 28 | |
| Interest-free installments | 55 | 54 | 56 | 56 | 57 | 52 | 55 | |
| Income allocated to payment | <10% | 126 | 143 | 24 | 35 | 101 | 119 | 38 |
| 10–25% | 70 | 70 | 14 | 19 | 47 | 73 | 15 | |
| 26–50% | 36 | 33 | 7 | 4 | 25 | 32 | 15 | |
| >50% | 12 | 12 | 3 | 5 | 7 | 8 | 7 | |
| Usefulness perception | Useful financial tool | 94 | 94 | 20 | 24 | 70 | 92 | 22 |
| Emergency aid | 64 | 75 | 11 | 21 | 50 | 60 | 19 | |
| Over-indebtedness source | 57 | 70 | 15 | 14 | 40 | 60 | 28 | |
| Other | 94 | 95 | 19 | 25 | 68 | 87 | 28 | |
| Variables | Employment | Average Income Range | ||||||||||
|---|---|---|---|---|---|---|---|---|---|---|---|---|
| (a) | (b) | (c) | (d) | (e) | (f) | (g) | (h) | (i) | (j) | (k) | ||
| Number of credit cards | 1.85 | 1.74 | 1.87 | 1.90 | 1.99 | 1.81 | 1.74 | 1.86 | 1.91 | 1.88 | 1.79 | |
| Usage patterns | Supermarkets | 7 | 28 | 65 | 35 | 44 | 12 | 26 | 63 | 72 | 49 | 33 |
| Restaurants | 8 | 27 | 67 | 31 | 51 | 5 | 19 | 70 | 64 | 43 | 31 | |
| Online purchases | 8 | 27 | 66 | 29 | 55 | 10 | 19 | 71 | 63 | 50 | 30 | |
| Clothing | 5 | 22 | 62 | 32 | 58 | 15 | 12 | 68 | 61 | 45 | 32 | |
| Accessories | 5 | 22 | 62 | 32 | 58 | 15 | 12 | 68 | 61 | 45 | 32 | |
| Travel and entertainment | 9 | 35 | 73 | 36 | 39 | 19 | 22 | 80 | 65 | 54 | 34 | |
| Health | 20 | 0 | 0 | 89 | 11 | 31 | 47 | 63 | 59 | 47 | 29 | |
| Payment of services | 6 | 27 | 59 | 36 | 50 | 12 | 12 | 67 | 61 | 41 | 33 | |
| Other | 10 | 34 | 56 | 31 | 53 | 5 | 19 | 72 | 59 | 47 | 30 | |
| Usage frequency | Daily | 2 | 14 | 27 | 9 | 13 | 5 | 6 | 24 | 28 | 10 | 14 |
| Weekly | 6 | 33 | 55 | 32 | 47 | 10 | 14 | 70 | 58 | 48 | 21 | |
| Monthly | 12 | 24 | 66 | 39 | 47 | 12 | 22 | 78 | 62 | 53 | 29 | |
| Occasional | 0 | 2 | 17 | 9 | 18 | 4 | 5 | 16 | 17 | 9 | 13 | |
| Payment behavior | Full payment | 13 | 49 | 90 | 50 | 74 | 19 | 24 | 99 | 105 | 67 | 48 |
| Minimum payment | 1 | 12 | 20 | 15 | 18 | 3 | 7 | 26 | 20 | 19 | 11 | |
| Balance rotation | 6 | 12 | 55 | 24 | 33 | 9 | 16 | 63 | 40 | 34 | 18 | |
| Installments with interest | 30 | 23 | 24 | 26 | 21 | 29 | 21 | 27 | 26 | 21 | 16 | |
| Interest-free installments | 55 | 62 | 53 | 53 | 56 | 39 | 57 | 55 | 50 | 51 | 68 | |
| Income allocated to payment | <10% | 12 | 43 | 81 | 42 | 70 | 22 | 23 | 96 | 89 | 70 | 38 |
| 10–25% | 4 | 17 | 50 | 29 | 35 | 5 | 14 | 55 | 49 | 30 | 20 | |
| 26–50% | 3 | 11 | 25 | 14 | 14 | 2 | 7 | 29 | 20 | 15 | 12 | |
| >50% | 1 | 2 | 9 | 4 | 6 | 2 | 3 | 8 | 7 | 5 | 7 | |
| Usefulness perception | Useful financial tool | 10 | 29 | 63 | 33 | 42 | 11 | 20 | 63 | 60 | 49 | 36 |
| Emergency aid | 4 | 18 | 45 | 25 | 40 | 7 | 11 | 53 | 52 | 28 | 17 | |
| Over-indebtedness source | 4 | 16 | 39 | 26 | 33 | 10 | 14 | 56 | 37 | 33 | 16 | |
| Other | 10 | 34 | 56 | 31 | 53 | 5 | 19 | 72 | 59 | 47 | 30 | |
References
- Ajzen, I. (1991). The theory of planned behavior. Organizational Behavior and Human Decision Processes, 50(2), 179–211. [Google Scholar] [CrossRef] [Scilit]
- Aydın, A. E. (2022). Psychological and demographic factors influencing responsible credit card debt payment. Journal of Financial Services Marketing, 27(1), 17–26. [Google Scholar] [CrossRef] [Scilit]
- Álvarez-Gamboa, J., Cabrera-Barona, P., & Jácome-Estrella, H. (2021). Financial inclusion and multidimensional poverty in Ecuador: A spatial approach. World Development Perspectives, 22, 100311. [Google Scholar] [CrossRef] [Scilit]
- Baba, T. (2025). A doubly robust criterion for causal inference. Canadian Journal of Statistics, 53, e70001. [Google Scholar] [CrossRef] [Scilit]
- Bastidas-Guerrón, J. L., Cárdenas-Fierro, G. M., Mora-Lucero, A. C., Quinde-Sari, F. R., Sabando-García, A. R., & Moreira-Choez, J. S. (2025). Financial literacy and educational level in Ecuadorian students: A structural analysis. Frontiers in Education, 10, 1596635. [Google Scholar] [CrossRef] [Scilit]
- Chin, W. W. (1998). The partial least squares approach to structural equation modeling. In G. A. Marcoulides (Ed.), Modern methods for business research (pp. 295–336). Lawrence Erlbaum. [Google Scholar]
- Fornell, C., & Larcker, D. F. (1981). Evaluating structural equation models with unobservable variables and measurement error. Journal of Marketing Research, 18(1), 39–50. [Google Scholar] [CrossRef] [Scilit]
- Fulford, S. L., & Schuh, S. D. (2024). Credit cards, credit utilization, and consumption. Journal of Monetary Economics, 148, 103619. [Google Scholar] [CrossRef] [Scilit]
- Giannikos, C. I. (2025). Financial literacy and credit card payoff behaviors. International Journal of Financial Studies, 13(1), 22. [Google Scholar] [CrossRef] [Scilit]
- Guenther, P., Guenther, M., Ringle, C. M., Zaefarian, G., & Cartwright, S. (2023). Improving PLS-SEM use for business marketing research. Industrial Marketing Management, 111, 127–142. [Google Scholar] [CrossRef] [Scilit]
- Guzmán, M. M., Campdesuñer, R. P., Rodríguez, A. S., Vidal, G. G., & Vivar, R. M. (2018). Determination of qualitative and quantitative personnel requirements in hotel organizations. International Journal of Business and Management Science, 8(1), 1–19. [Google Scholar]
- Hair, J. F., Hult, G. T. M., Ringle, C. M., & Sarstedt, M. (2019). A primer on partial least squares structural equation modeling (PLS-SEM) (2nd ed.). SAGE. [Google Scholar]
- Henseler, J., Ringle, C. M., & Sarstedt, M. (2015). A new criterion for assessing discriminant validity in variance-based SEM. Journal of the Academy of Marketing Science, 43(1), 115–135. [Google Scholar] [CrossRef] [Scilit]
- Horvath, Á., Kay, B., & Wix, C. (2023). The COVID-19 shock and consumer credit: Evidence from credit card data. Journal of Banking & Finance, 152, 106854. [Google Scholar] [CrossRef] [Scilit]
- Islam, K. J., & Picault, J. (2025). One card fits all? Exploring the incidence, intensity, and extent of credit card use in Canada (1999–2019). Journal of Financial Services Marketing, 30(1), 5. [Google Scholar] [CrossRef] [Scilit]
- Kahneman, D. (2011). Thinking, fast and slow. Farrar, Straus and Giroux. [Google Scholar]
- Kaiser, H. F. (1974). An index of factorial simplicity. Psychometrika, 39(1), 31–36. [Google Scholar] [CrossRef] [Scilit]
- Kuchler, T., & Pagel, M. (2021). Sticking to your plan: The role of present bias for credit card paydown. Journal of Financial Economics, 139(2), 359–388. [Google Scholar] [CrossRef] [Scilit]
- Méndez-Prado, S. M., Rodriguez, V., Peralta-Rizzo, K., Everaert, P., & Valcke, M. (2023). An assessment tool to identify the financial literacy level of financial education programs participants executed by Ecuadorian financial institutions. Sustainability, 15(2), 996. [Google Scholar] [CrossRef] [Scilit]
- Méndez-Prado, S. M., Zambrano Franco, M. J., Zambrano Zapata, S. G., Chiluiza García, K. M., Everaert, P., & Valcke, M. (2022). A systematic review of financial literacy research in Latin America and the Caribbean. Sustainability, 14(7), 3814. [Google Scholar] [CrossRef] [Scilit]
- Narita, K., Tena, J. D., & Detotto, C. (2023). Causal inference with observational data: A tutorial on propensity score analysis. The Leadership Quarterly, 34(3), 101678. [Google Scholar] [CrossRef] [Scilit]
- Nunnally, J. C., & Bernstein, I. H. (1994). Psychometric theory (3rd ed.). McGraw-Hill. [Google Scholar]
- Reyes-Ramírez, L. A., Leyva-Del Toro, C., Pérez-Campdesuñer, R., & Sánchez-Rodríguez, A. (2022). Variables of corporate social responsibility. A structural equation model. Retos Ecuador, 12(24), 286–305. [Google Scholar] [CrossRef] [Scilit]
- Rubio, J. (2025). Digital payments trust in Latin America and the Caribbean. Economies, 13(5), 140. [Google Scholar] [CrossRef] [Scilit]
- Salinas Vásquez, J., Sarmiento Jara, J. P., Urgilés Salinas, M. P., & Oña Avendaño, D. F. (2024). Social capital and credit risk in a financial cooperative of Ecuador. Journal of Co-Operative Organization and Management, 12(2), 100247. [Google Scholar] [CrossRef] [Scilit]
- Sarstedt, M., Hair, J. F., Pick, M., Liengaard, B. D., Radomir, L., & Ringle, C. M. (2022). Progress in partial least squares structural equation modeling use in marketing research in the last decade. Psychology & Marketing, 39(5), 1035–1064. [Google Scholar] [CrossRef] [Scilit]
- Sánchez-Rodríguez, A., Martínez-Vivar, R., & Moreno-Lázaro, J. (2017). Labor competency management within the context of the process of political and economic changes in Cuba. Innovar, 27(66), 169–184. [Google Scholar] [CrossRef] [Scilit]
- Shefrin, H. M., & Thaler, R. H. (1988). The behavioral life-cycle hypothesis. Economic Inquiry, 26(4), 609–643. [Google Scholar] [CrossRef] [Scilit]
- Shy, O., & Stavins, J. (2024). Who is paying all these fees? An empirical analysis of bank account and credit card fees. Journal of Economics and Business 129, 106157. [Google Scholar] [CrossRef] [Scilit]
- Thaler, R. H. (2016). Misbehaving: The making of behavioral economics. W. W. Norton & Company. [Google Scholar]


| Variable | Recent Theoretical Findings | Cognitive or Contextual Limitations | Proposed Research Gap |
|---|---|---|---|
| Income level (purchasing power) | Direct relationship with repayment capacity and revolving tendency (Horvath et al., 2023). | Evidence focused on advanced economies; little research in emerging markets. | Explore how purchasing power conditions repayment patterns in Ecuador. |
| Employment stability | Higher stability reduces default risk (Aydın, 2022). | Few Latin American studies; most in Europe or North America. | Analyze the impact of labor informality on credit card payment behavior. |
| Asset ownership | Greater wealth correlates with responsible borrowing (Islam & Picault, 2025). | Limited evidence on middle-low-income households in Latin America. | Examine whether asset ownership affects multiple-card holding in Ecuador. |
| Age | Younger consumers show impulsive over-indebtedness; older adults favor full repayment (Fulford & Schuh, 2024). | Focus mainly on millennials in developed economies. | Characterize Ecuadorian youth behavior in card use and repayment. |
| Gender | Women are more cautious; men are more risk-prone (Bastidas-Guerrón et al., 2025). | Lack of systematic studies in Ecuador. | Explore gender differences in credit card behavior. |
| Education and financial literacy | Higher education fosters informed and responsible repayment (Méndez-Prado et al., 2023). | Instruments validated in Ecuador, but little evidence linking scores to real behavior. | Assess how financial literacy influences repayment choice (full, minimum, deferred). |
| Trust in the payment system | Digital payment trust determines usage frequency in LAC (Rubio, 2025). | Insufficient empirical evidence on perceived security in Ecuador. | Evaluate the role of trust in recurring credit card payments. |
| Social capital and local financial institutions | Social capital reduces default risk (Salinas Vásquez et al., 2024). | Findings limited to cooperatives; none for credit cards. | Incorporate community-trust dimensions into credit card behavior models. |
| Variables | Population | Sample | |
|---|---|---|---|
| Gender | Male | 1,614,010 | 247,963 |
| Female | 1,679,888 | 245,006 | |
| Age group | 18–25 | 457,852 | 69,509 |
| 25–40 | 876,177 | 137,538 | |
| 40–60 | 780,654 | 120,284 | |
| >60 | 345,859 | 47,325 | |
| Education level | I | 167,989 | 36,973 |
| II | 330,872 | 69,430 | |
| III | 488,847 | 78,647 | |
| IV | 207,407 | 22,521 | |
| Marital status | Single | 1,337,826 | 219,258 |
| Married or cohabiting | 1,356,147 | 208,776 | |
| Divorced or widowed | 217,424 | 25,140 | |
| Occupation | Public employee | 337,588 | 31,426 |
| Private employee | 968,732 | 163,275 | |
| Self-employed | 643,944 | 117,472 | |
| Student | 487,268 | 78,326 | |
| Unemployed | 126,742 | 21,586 | |
| Retired | 148,671 | 14,687 | |
| Other | 198,452 | 26,402 | |
| Personal income | <$500 | 1,746,838 | 271,904 |
| $501–1000 | 873,419 | 135,952 | |
| $1001–2000 | 232,912 | 36,254 | |
| >$2000 | 58,228 | 9063 | |
| Household size | 1 person | 387,945 | 50,891 |
| 2–3 persons | 1,082,774 | 172,622 | |
| 4–5 persons | 1,372,472 | 247,973 | |
| ≥6 persons | 455,382 | 75,560 | |
| Dependent Variable | Demographic Variable | Statistic | p-Value | Effect Size | Interpretation |
|---|---|---|---|---|---|
| Health spending | Occupation | 505.537 | 0.0000 | 0.920 | Large |
| Tourism spending | Occupation | 12.646 | 0.0490 | 0.012 | Small |
| Health spending | Age | 441.243 | 0.0000 | 0.802 | Large |
| Health spending | Marital status | 276.966 | 0.0000 | 0.503 | Large |
| Knowledge | Education | 14.772 | 0.0052 | 0.020 | Small |
| Knowledge | Household members | 10.684 | 0.0136 | 0.014 | Small |
| Knowledge | Occupation | 12.766 | 0.0469 | 0.012 | Small |
| Knowledge | Gender | 6.056 | 0.0484 | 0.007 | Negligible |
| Financial attitude | Income | 10.681 | 0.0304 | 0.012 | Small |
| Construct | Initial Items (n) | KMO (Value/Reference) | Bartlett’s Test (p) | Cronbach’s Alpha (Value/Reference) | Theoretical Support |
|---|---|---|---|---|---|
| Financial literacy | 13 | 0.75/≥0.70 | p < 0.001 | 0.80/≥0.70 | Kaiser (1974); Hair et al. (2019) |
| Institutional trust | 6 | 0.78/≥0.70 | p < 0.001 | 0.85/≥0.70 | Kaiser (1974); Hair et al. (2019) |
| Purchasing power | 4 | 0.72/≥0.70 | p < 0.05 | 0.78/≥0.70 | Kaiser (1974); Nunnally and Bernstein (1994) |
| Hypothesis | β Estimate | 95% CI | pboot | R2 |
|---|---|---|---|---|
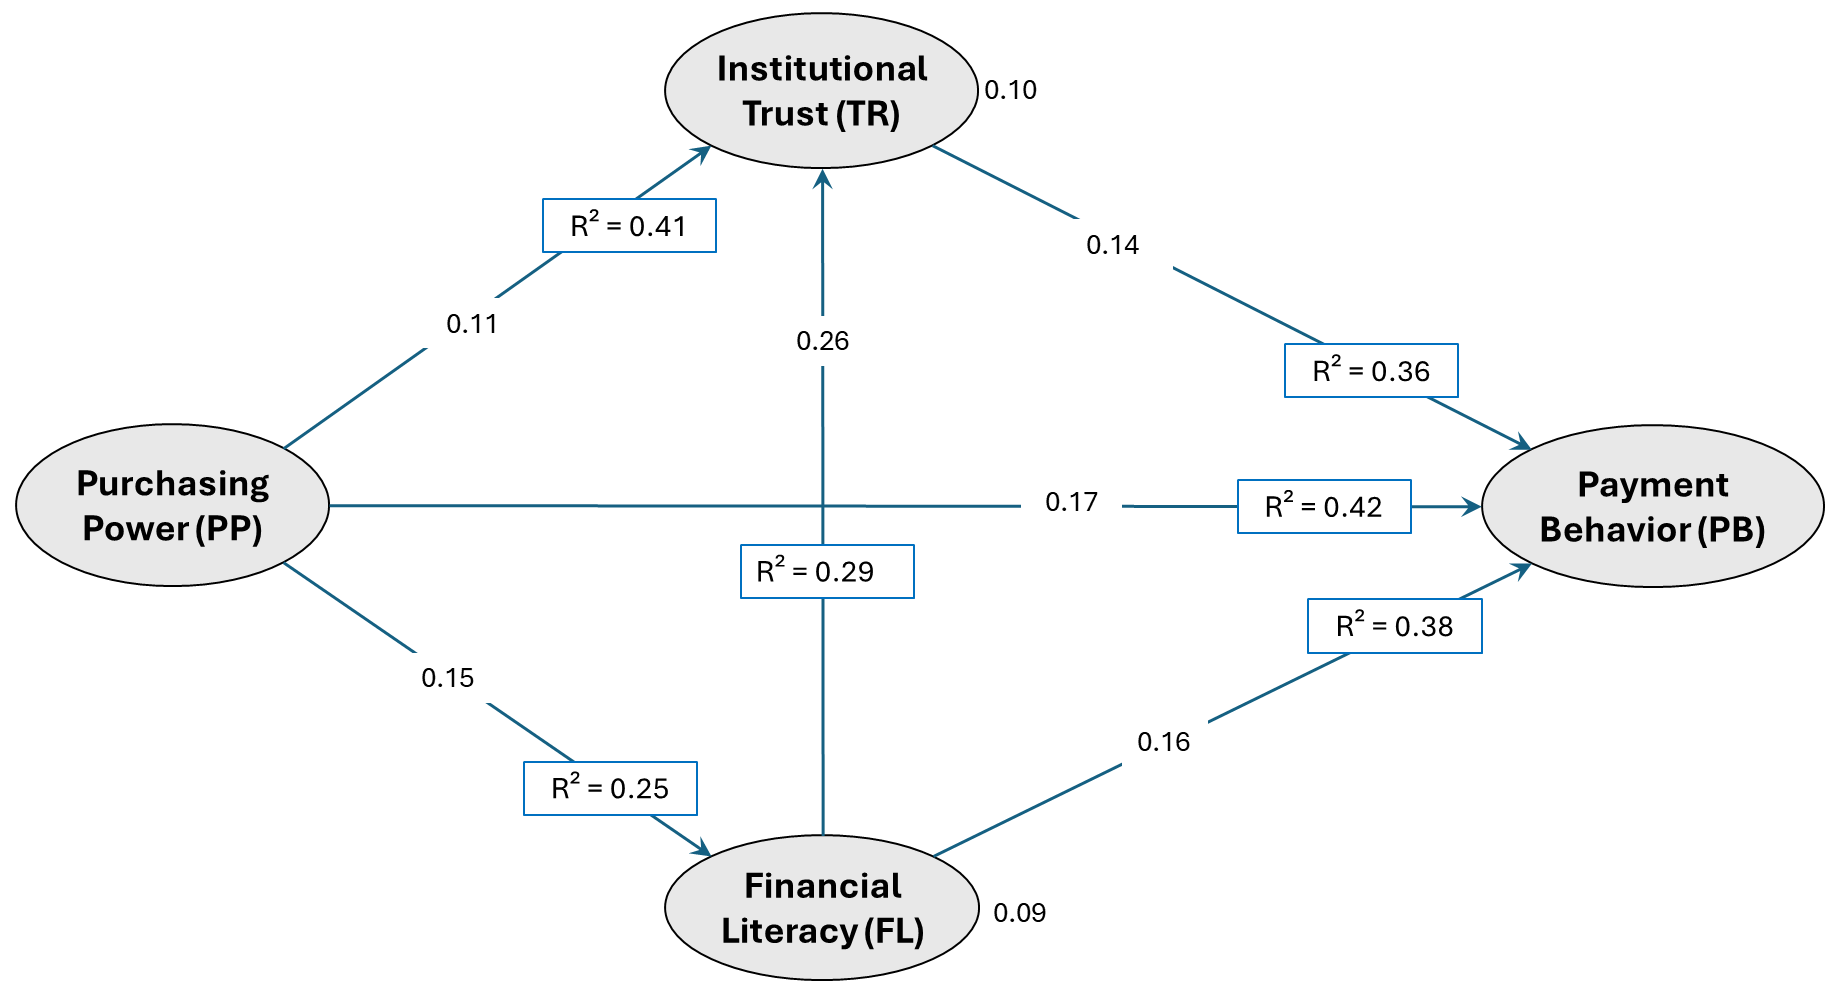
| H1: PP → PB | 0.173 | [0.080, 0.260] | 0.000 | 0.421 |
| H2: FL → PB | 0.169 | [0.070, 0.250] | 0.002 | 0.386 |
| H3: IT → PB | 0.147 | [0.050, 0.230] | 0.004 | 0.367 |
| H4: PP → FL | 0.152 | [0.060, 0.240] | 0.000 | 0.418 |
| H5: PP → IT | 0.119 | [0.030, 0.200] | 0.001 | 0.258 |
| H6: FL → IT | 0.261 | [0.170, 0.350] | 0.000 | 0.298 |
| H7: PP → FL → PB | 0.098 | [−0.010, 0.210] | 0.009 | — |
| H8: PP → IT → PB | 0.109 | [−0.005, 0.230] | 0.008 | — |
| Dimension | Cronbach’s Alpha (α) | Composite Reliability (CR) | AVE |
|---|---|---|---|
| PB | 0.783 | 0.919 | 0.740 |
| IR | 0.767 | 0.885 | 0.525 |
| PP | 0.816 | 0.915 | 0.684 |
| FL | 0.837 | 0.768 | 0.467 |
| Construct Pair | HTMT Value |
|---|---|
| FL–IT | 0.62 |
| FL–PP | 0.58 |
| FL–PB | 0.64 |
| IT–PP | 0.49 |
| IT–PB | 0.57 |
| PP–PB | 0.53 |
Disclaimer/Publisher’s Note: The statements, opinions and data contained in all publications are solely those of the individual author(s) and contributor(s) and not of MDPI and/or the editor(s). MDPI and/or the editor(s) disclaim responsibility for any injury to people or property resulting from any ideas, methods, instructions or products referred to in the content. |
© 2025 by the authors. Licensee MDPI, Basel, Switzerland. This article is an open access article distributed under the terms and conditions of the Creative Commons Attribution (CC BY) license.
Share and Cite
Pérez-Campdesuñer, R.; Sánchez-Rodríguez, A.; Martínez-Vivar, R.; Merizalde-Paredes, J.R.; De Miguel-Guzmán, M.; García-Vidal, G. Financial Literacy, Trust, and Socioeconomic Determinants of Borrowers’ Behavior in Credit Card Use: A PLS-SEM Analysis. J. Risk Financ. Manag. 2026, 19, 9. https://doi.org/10.3390/jrfm19010009
Pérez-Campdesuñer R, Sánchez-Rodríguez A, Martínez-Vivar R, Merizalde-Paredes JR, De Miguel-Guzmán M, García-Vidal G. Financial Literacy, Trust, and Socioeconomic Determinants of Borrowers’ Behavior in Credit Card Use: A PLS-SEM Analysis. Journal of Risk and Financial Management. 2026; 19(1):9. https://doi.org/10.3390/jrfm19010009
Chicago/Turabian StylePérez-Campdesuñer, Reyner, Alexander Sánchez-Rodríguez, Rodobaldo Martínez-Vivar, Jaime Ramiro Merizalde-Paredes, Margarita De Miguel-Guzmán, and Gelmar García-Vidal. 2026. "Financial Literacy, Trust, and Socioeconomic Determinants of Borrowers’ Behavior in Credit Card Use: A PLS-SEM Analysis" Journal of Risk and Financial Management 19, no. 1: 9. https://doi.org/10.3390/jrfm19010009
APA StylePérez-Campdesuñer, R., Sánchez-Rodríguez, A., Martínez-Vivar, R., Merizalde-Paredes, J. R., De Miguel-Guzmán, M., & García-Vidal, G. (2026). Financial Literacy, Trust, and Socioeconomic Determinants of Borrowers’ Behavior in Credit Card Use: A PLS-SEM Analysis. Journal of Risk and Financial Management, 19(1), 9. https://doi.org/10.3390/jrfm19010009