

Modelling Value-at-Risk and Expected Shortfall for a Small Capital Market: Do Fractionally Integrated Models and Regime Shifts Matter?


Abstract
1. Introduction
2. Literature Review
3. Methodology
3.1. Detection of Structural Breakpoints in the Variance
3.2. The Conditional Mean Specification Model
3.3. GARCH Models Without and with Structural Failures
3.3.1. FIGARCH (p, d, q)
3.3.2. HYGARCH (p, d, q)
3.3.3. FIAPARCH (p, d, q)
3.4. Conditional Distributions
3.5. Computing One-Step-Ahead VaR and ES Under Dual LM GARCH Models
3.6. Validation Tests
3.6.1. Kupiec Test
3.6.2. Dynamic Quantile Test
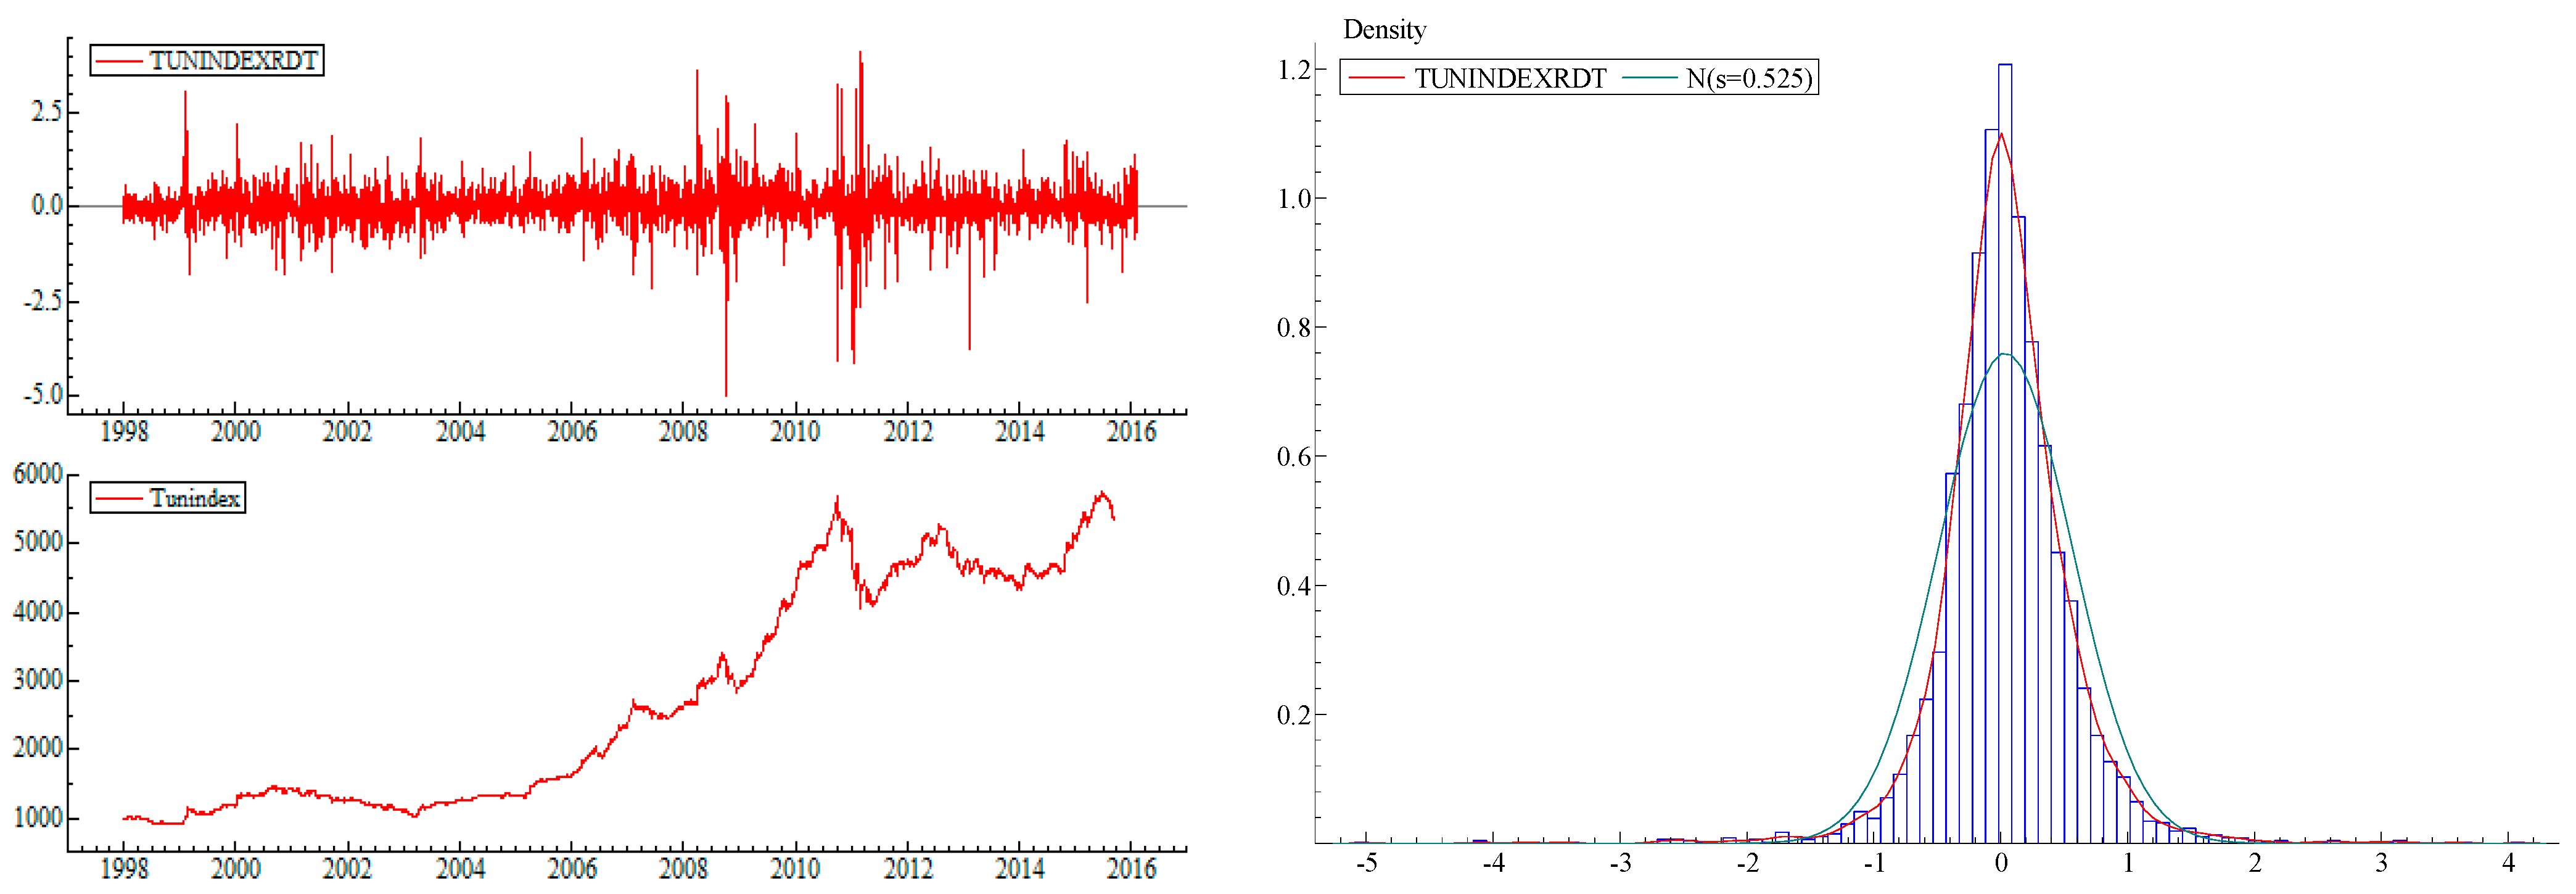
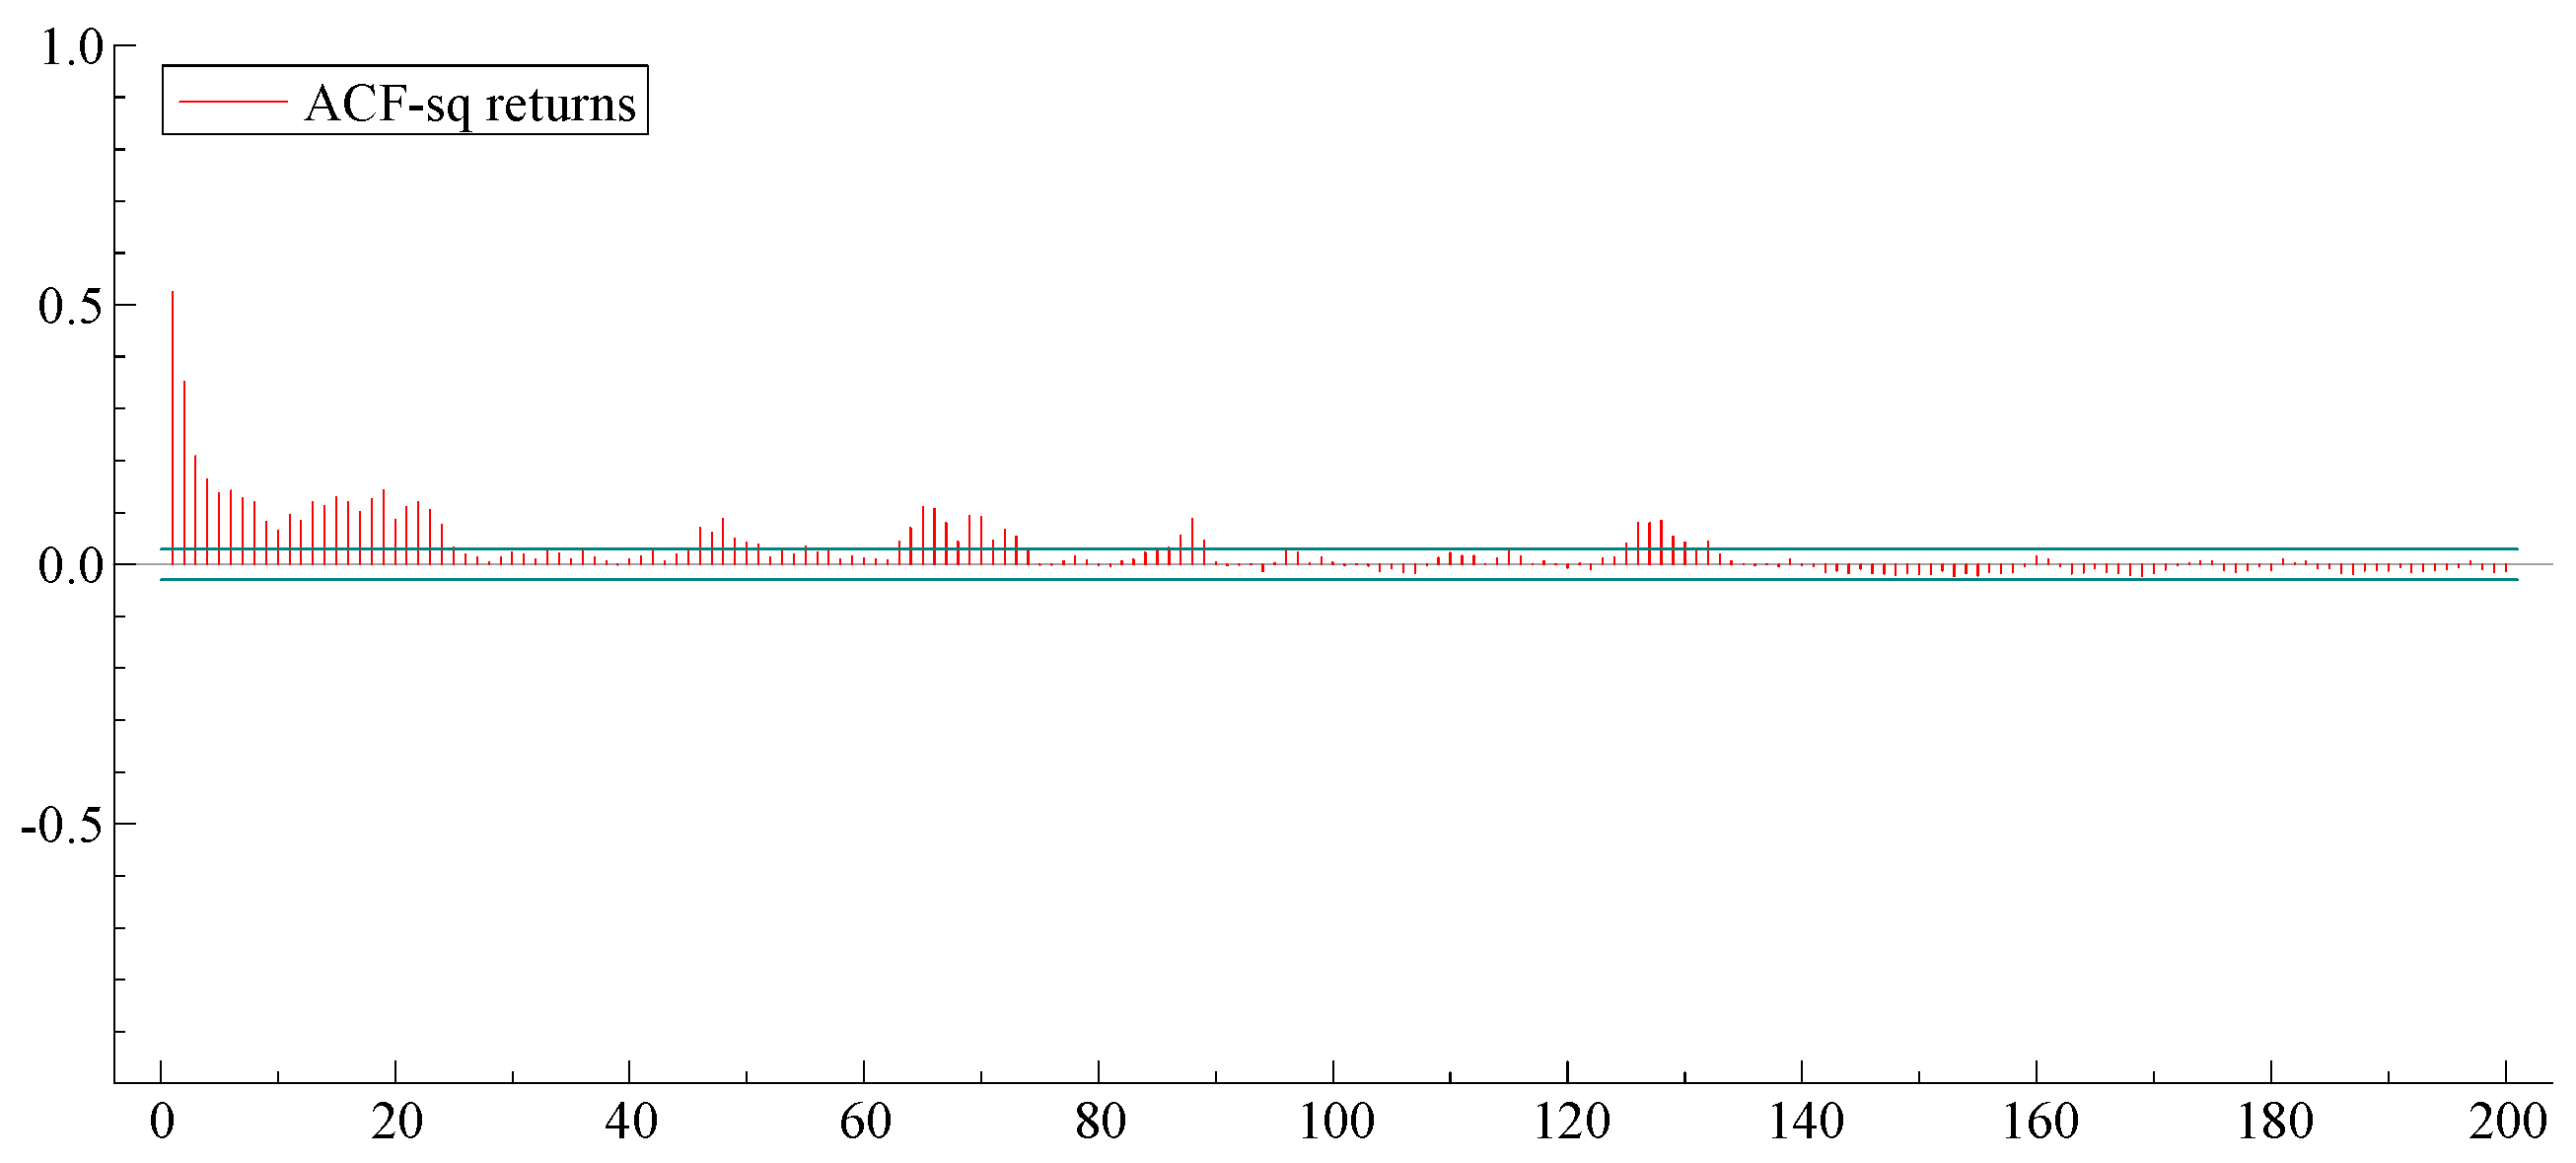
4. Data and Preliminary Statistics
5. Empirical Results
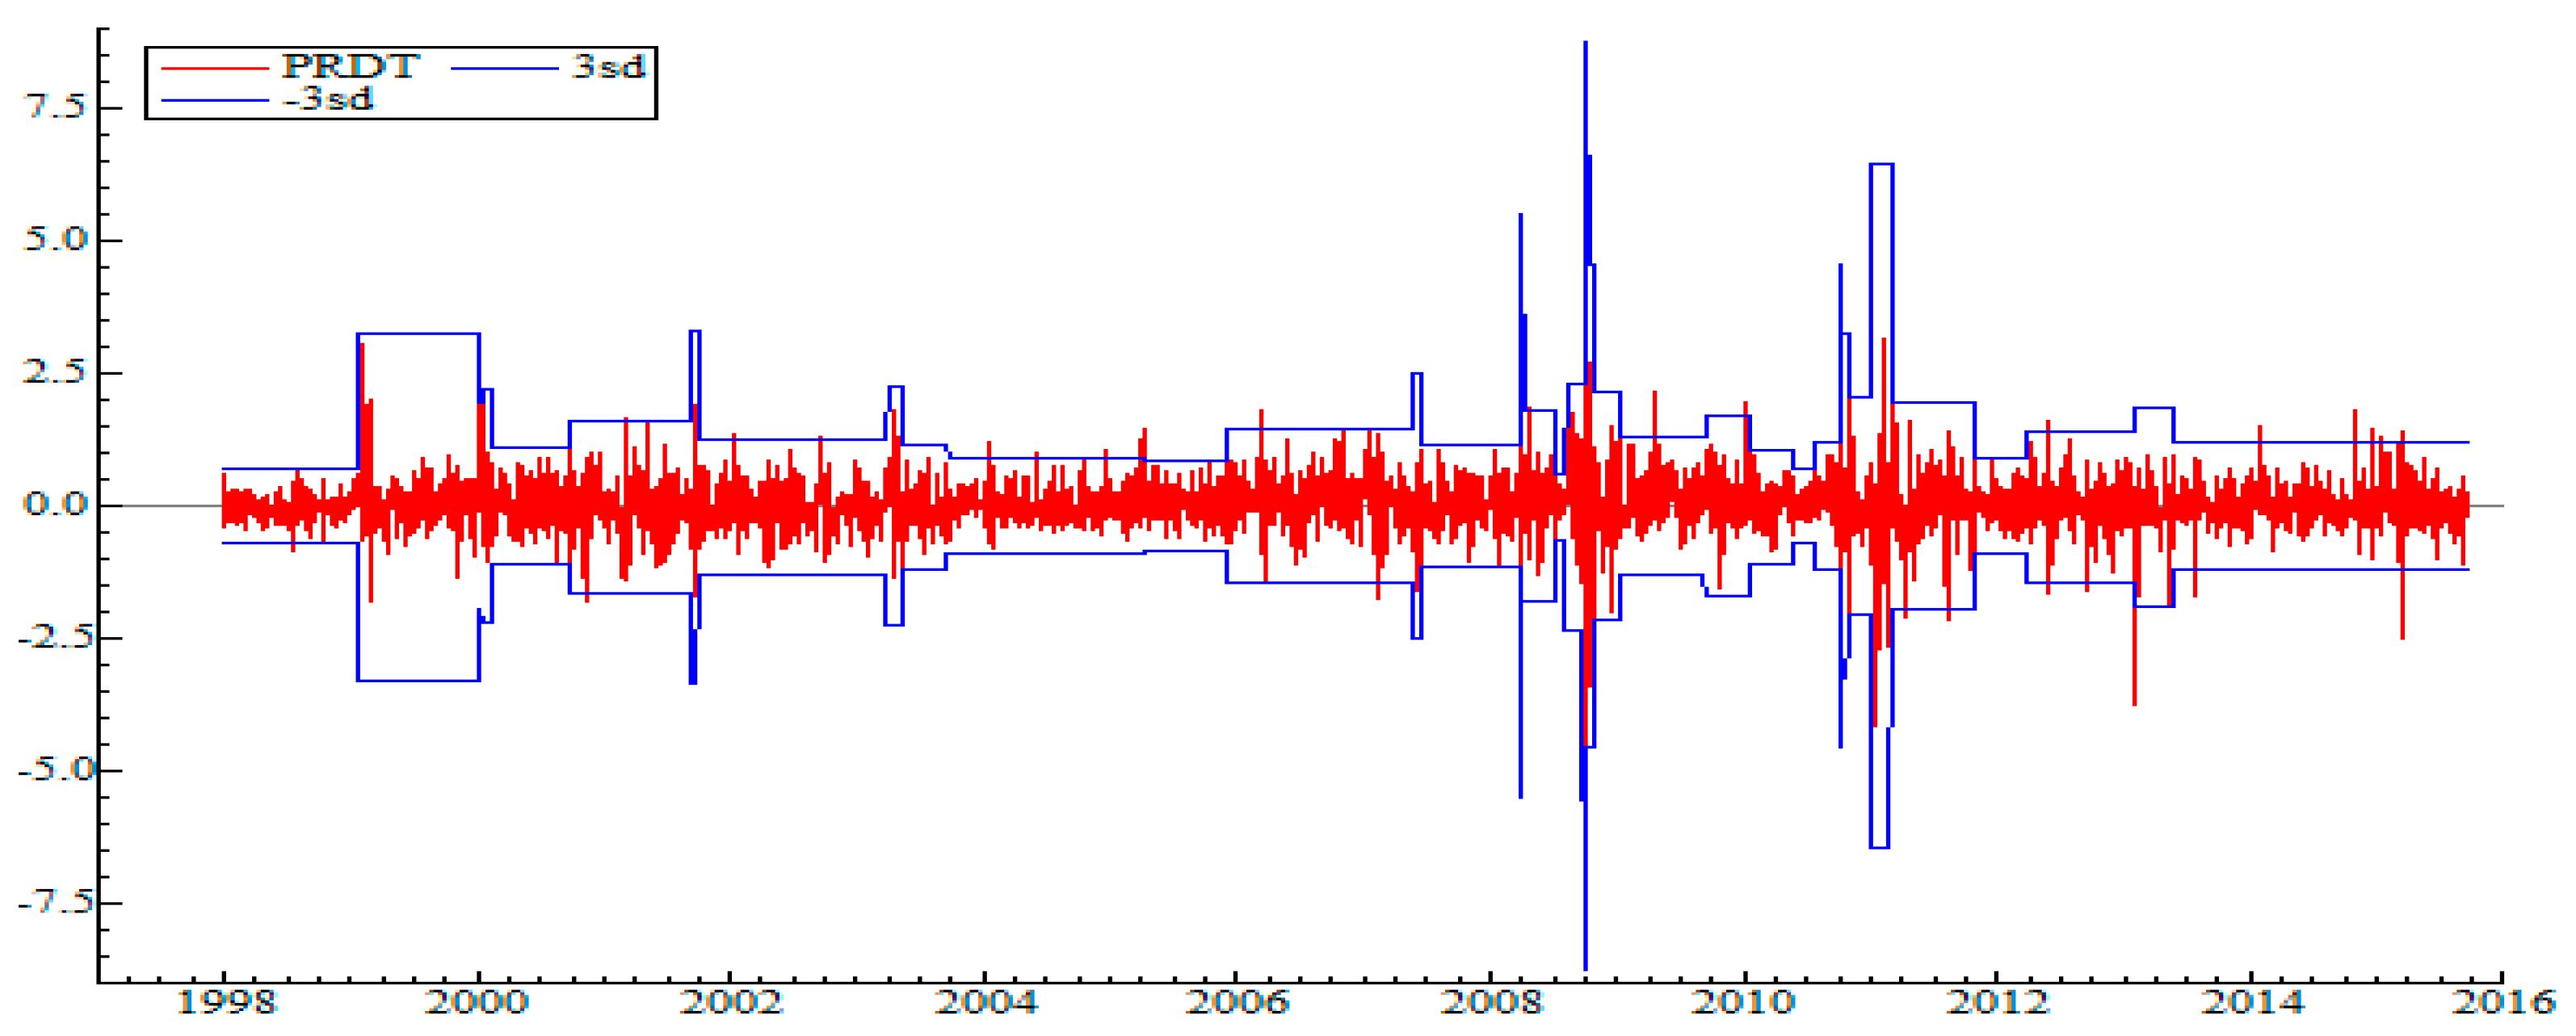
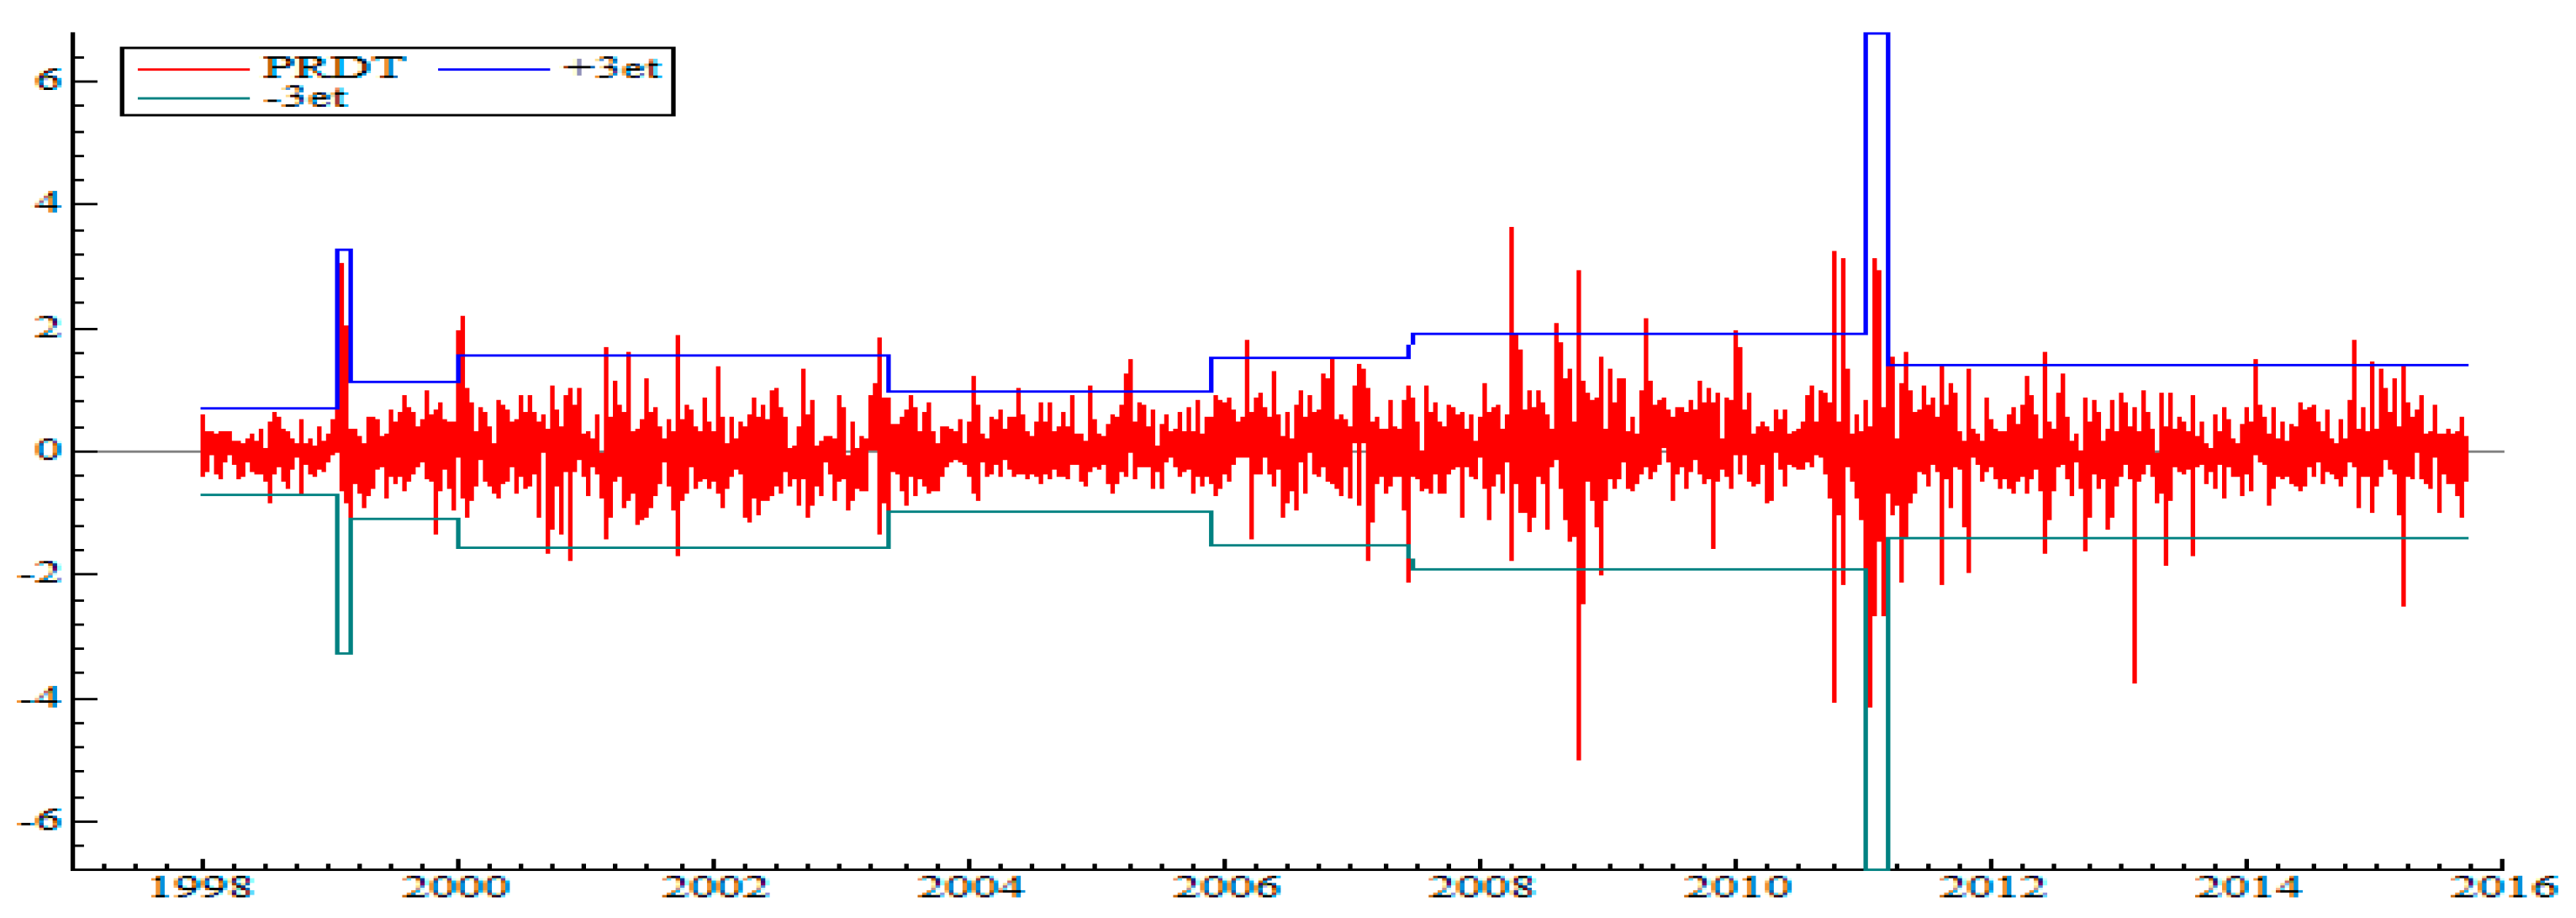
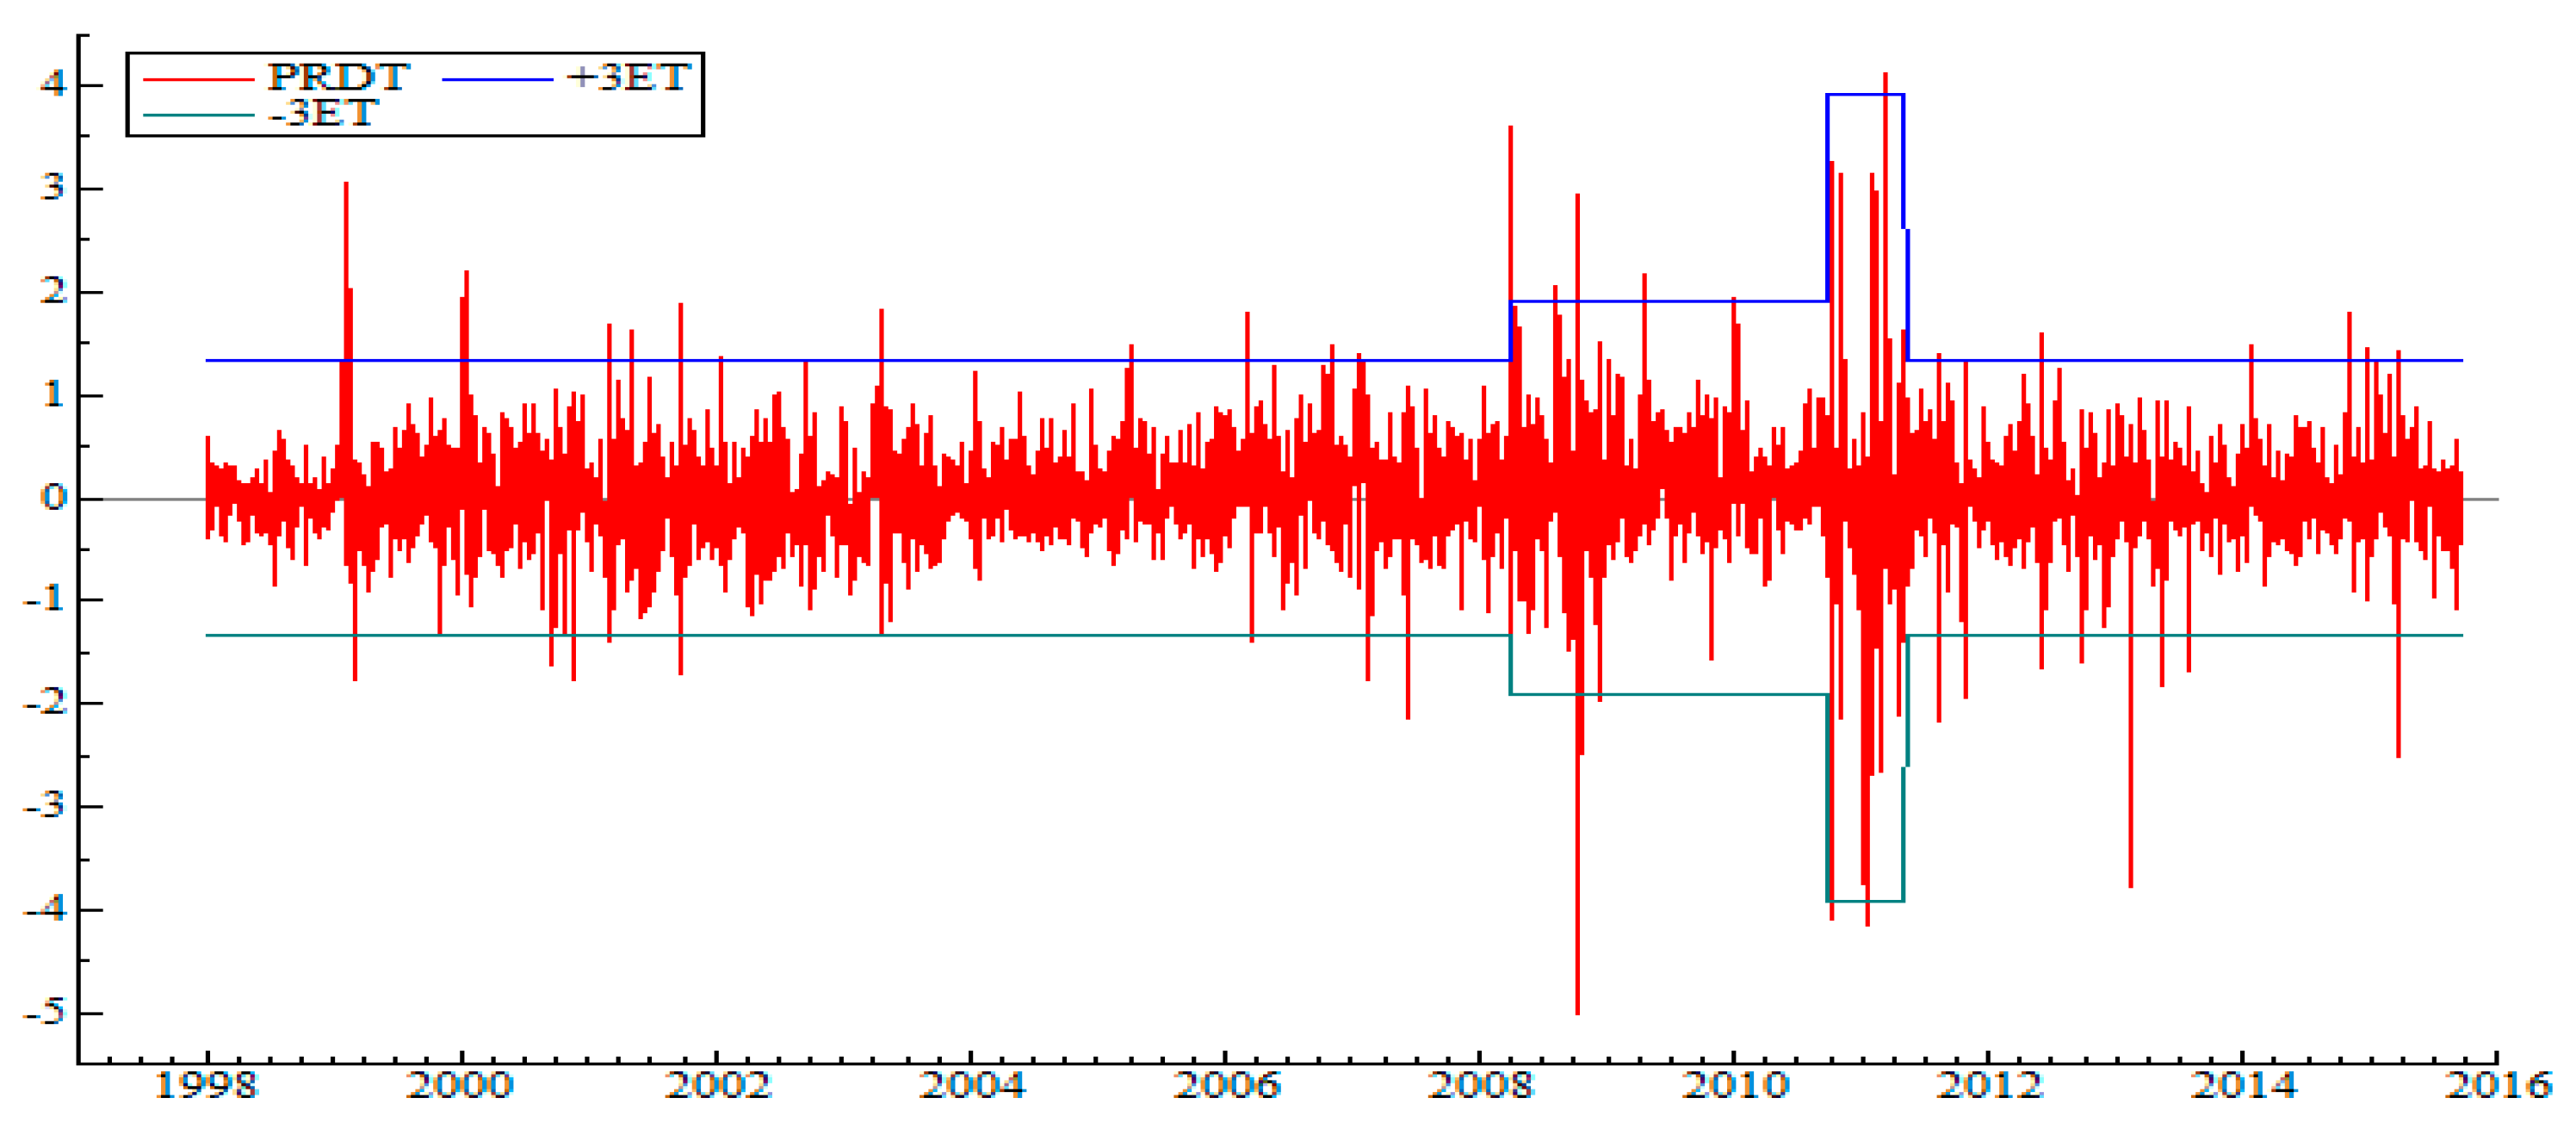
5.1. Detection of Regime Change Points in the Variance
- In 2008, a high-volatility regime was linked to the 2008 global economic and financial crisis.
- Late 2010–early 2011: The most turbulent and volatile regime, corresponding to popular uprisings, that is, the Tunisian revolution.
- May 2011: Return to relative calm directly linked to post-revolutionary hope (elections, democracy, and optimism).
5.2. DML GARCH-Type Models with Structural Break Estimation Results and Diagnostics
5.3. Model Predictive Performance
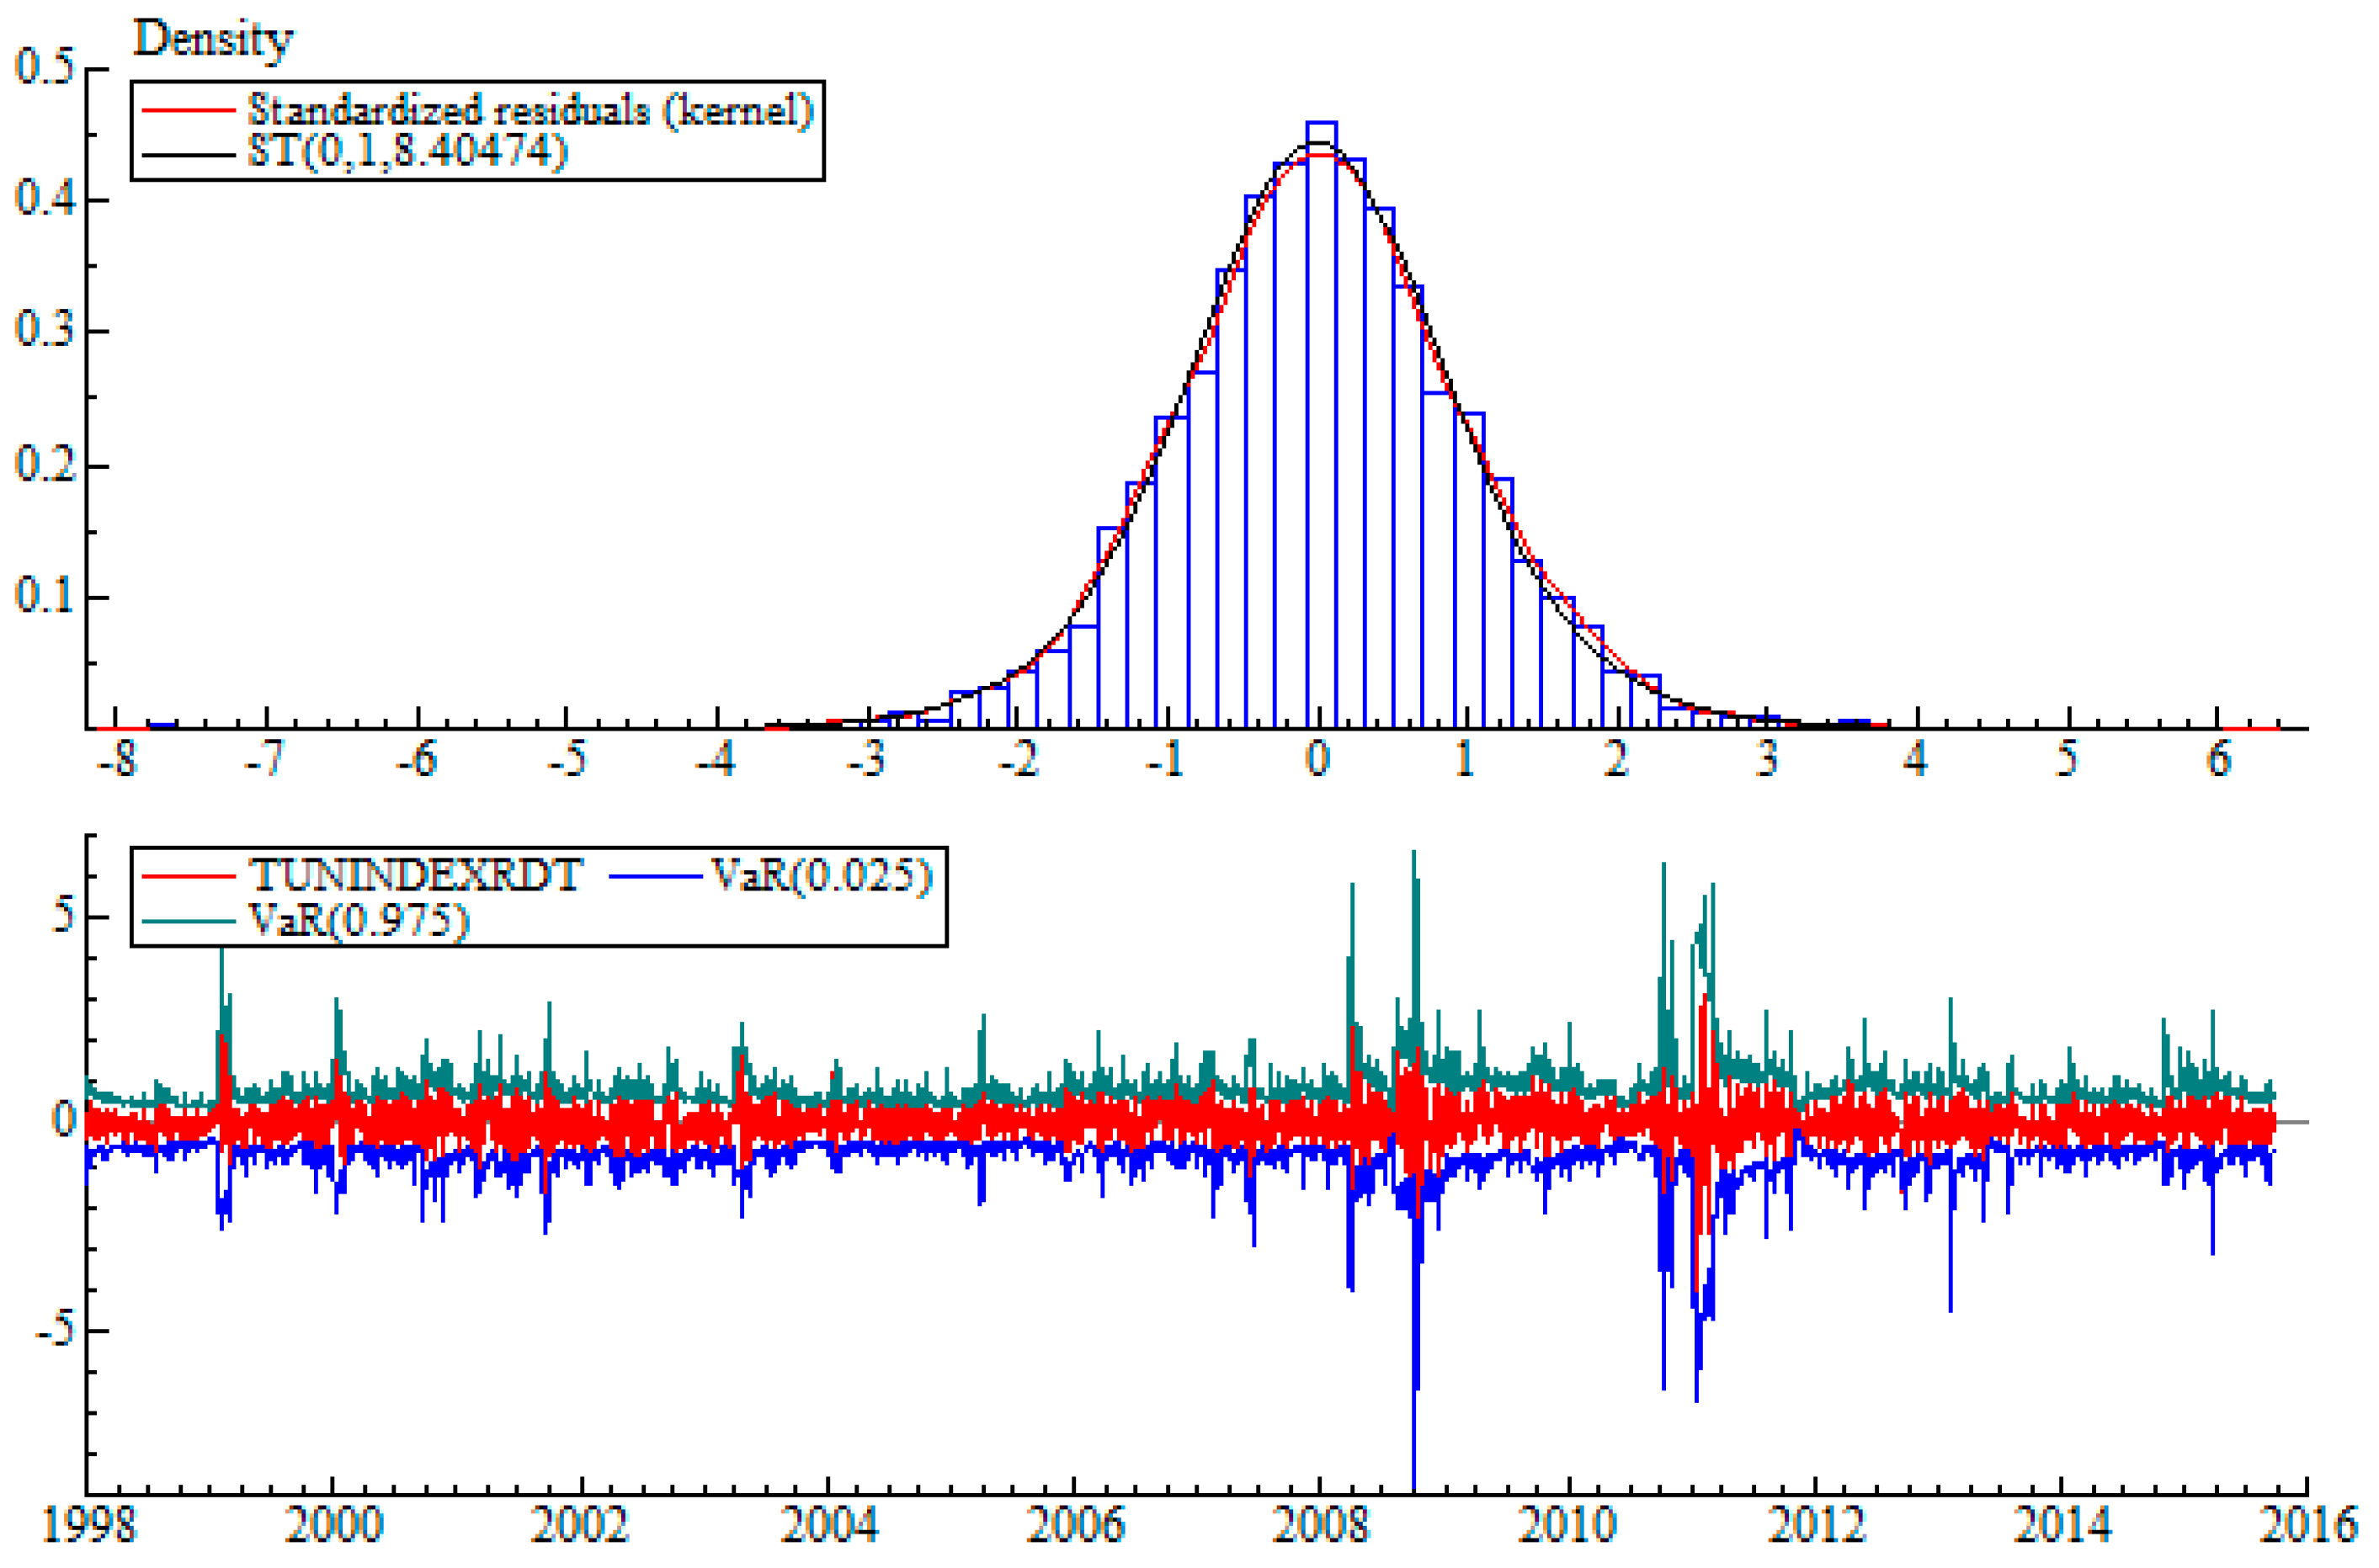
5.4. Value-at-Risk and ES Modelling
5.4.1. Backtesting In-Sample
5.4.2. Backtesting Out-of-Sample
6. Conclusions
Author Contributions
Funding
Institutional Review Board Statement
Informed Consent Statement
Data Availability Statement
Conflicts of Interest
| 1 | The κ1 test corrects for non-mesokurtosis, while the κ2 test takes into account the fourth moment and the persistence in variance. |
| 2 | The κ1 test accounts for non-mesokurtosis, whereas the κ2 test considers the fourth moment and the persistence in variance. |
| 3 | These estimations are not displayed here for conciseness’s sake, but they are available on request from the authors. |
| 4 |
References
- Abdi, A., Souffargi, W., & Boubaker, A. (2023). Family firms’ resilience during the COVID-19 pandemic: Evidence from French firms. Corporate Ownership and Control, 20(3), 1–18. [Google Scholar] [CrossRef]
- Aggarwal, R., Inclan, C., & Leal, R. (1999). Volatility in emerging stock markets. Journal of Financial and Quantitative Analysis, 34(01), 33–55. [Google Scholar] [CrossRef]
- Ahamada, I., & Aïssa, M. S. B. (2005). Changements Structurels dans la Dynamique de l’lnflation aux États-Unis: Approches Non Paramétriques. Annales d’Economie et de Statistique, 157–172. [Google Scholar] [CrossRef]
- Allen, D. E., Singh, A. K., & Powell, R. J. (2013). EVT and tail-risk modelling: Evidence from market indices and volatility series. The North American Journal of Economics and Finance, 26, 355–369. [Google Scholar] [CrossRef]
- Aloui, C., & Ben Hamida, H. (2014). Modelling and forecasting value at risk and expected shortfall for GCC stock markets: Do long memory, structural breaks, asymmetry, and fat-tails matter? The North American Journal of Economics and Finance, 29, 349–380. [Google Scholar] [CrossRef]
- Arouri, M. E. H., Hammoudeh, S., Lahiani, A., & Nguyen, D. K. (2012). Long memory and structural breaks in modeling the return and volatility dynamics of precious metals. The Quarterly Review of Economics and Finance, 52(2), 207–218. [Google Scholar] [CrossRef]
- Artzner, P., Delbaen, F., Eber, J. M., & Heath, D. (1999). Coherent measures of risk. Mathematical Finance, 9(3), 203–228. [Google Scholar] [CrossRef]
- Aydogan, K., & Booth, G. G. (1988). Are there long cycles in common stock returns? Southern Economic Journal, 55, 141–149. [Google Scholar] [CrossRef]
- Baillie, R. T., Bollerslev, T., & Mikkelsen, H. O. (1996). Fractionally integrated generalized autoregressive conditional heteroskedasticity. Journal of Econometrics, 74(1), 3–30. [Google Scholar] [CrossRef]
- Barkoulas, J., Labys, W. C., & Onochie, J. (1997). Fractional dynamics in international commodity prices. Journal of Futures Markets, 17(2), 161–189. [Google Scholar] [CrossRef]
- Barkoulas, J. T., & Baum, C. F. (1996). Long-term dependence in stock returns. Economics Letters, 53(3), 253–259. [Google Scholar] [CrossRef]
- Bellalah, M., Aloui, C., & Abaoub, E. (2005). Long-range dependence in daily volatility on Tunisian stock market. International Journal of Business, 10(3), 191–216. [Google Scholar]
- Bisaglia, L., & Guégan, D. (1998). A comparison of techniques of estimation in long memory processes. Computational Statistics & Data Analysis, 27(1), 61–81. [Google Scholar]
- Bollerslev, T. (1986). Generalized autoregressive conditional heteroskedasticity. Journal of Econometrics, 31(3), 307–327. [Google Scholar] [CrossRef]
- Bollerslev, T. (1987). A conditionally heteroskedastic time series model for speculative prices and rates of return. The Review of Economics and Statistics, 69, 542–547. [Google Scholar] [CrossRef]
- Charfeddine, L., & Ajmi, A. N. (2013). The Tunisian stock market index volatility: Long memory vs. switching regime. Emerging Markets Review, 16, 170–182. [Google Scholar] [CrossRef]
- Cheung, Y. W. (1993). Long memory in foreign-exchange rates. Journal of Business & Economic Statistics, 11(1), 93–101. [Google Scholar]
- Cheung, Y. W., & Lai, K. S. (1995). A search for long memory in international stock market returns. Journal of International Money and Finance, 14(4), 597–615. [Google Scholar] [CrossRef]
- Corazza, M., Malliaris, A. G., & Nardelli, C. (1997). Searching for fractal structure in agricultural futures markets. Journal of Futures Markets, 17(4), 433–473. [Google Scholar] [CrossRef]
- Crato, N. (1994). Some international evidence regarding the stochastic memory of stock returns. Applied Financial Economics, 4(1), 33–39. [Google Scholar] [CrossRef]
- Davidson, J. (2004). Moment and memory properties of linear conditional heteroscedasticity models, and a new model. Journal of Business & Economic Statistics, 22, 16–29. [Google Scholar]
- Degiannakis, S. (2004). Volatility forecasting: Evidence from a fractional integrated asymmetric power ARCH skewed-t model. Applied Financial Economics, 14(18), 1333–1342. [Google Scholar] [CrossRef]
- Degiannakis, S., Floros, C., & Dent, P. (2013). Forecasting value-at-risk and expected shortfall using fractionally integrated models of conditional volatility: International evidence. International Review of Financial Analysis, 27, 21–33. [Google Scholar] [CrossRef]
- Diebold, F. X. (1998). The past, present, and future of macroeconomic forecasting. Journal of Economic Perspectives, 12(2), 175–192. [Google Scholar] [CrossRef]
- Ding, Z., Granger, C. W., & Engle, R. F. (1993). A long memory property of stock market returns and a new model. Journal of Empirical Finance, 1(1), 83–106. [Google Scholar] [CrossRef]
- DiSario, R., Saraoglu, H., McCarthy, J., & Li, H. (2008). Long memory in the volatility of an emerging equity market: The case of Turkey. Journal of International Financial Markets, Institutions and Money, 18(4), 305–312. [Google Scholar] [CrossRef]
- Engle, R. F., & Manganelli, S. (2004). CAViaR: Conditional autoregressive value at risk by regression quantiles. Journal of Business & Economic Statistics, 22(4), 367–381. [Google Scholar]
- Ewing, B. T., & Malik, F. (2005). Re-examining the asymmetric predictability of conditional variances: The role of sudden changes in variance. Journal of Banking & Finance, 29(10), 2655–2673. [Google Scholar]
- Ewing, B. T., & Malik, F. (2010). Estimating volatility persistence in oil prices under structural breaks. Financial Review, 45(4), 1011–1023. [Google Scholar] [CrossRef]
- Ewing, B. T., & Malik, F. (2016). Volatility spillovers between oil prices and the stock market under structural breaks. Global Finance Journal, 29, 12–23. [Google Scholar] [CrossRef]
- Fang, H., Lai, K. S., & Lai, M. (1994). Fractal structure in currency futures price dynamics. Journal of Futures Markets, 14, 169–169. [Google Scholar] [CrossRef]
- Ferrara, L., & Guegan, D. (2000). Forecasting financial times series with generalized long memory processes. In Advances in quantitative asset management (pp. 319–342). Springer US. [Google Scholar]
- Fung, H. G., & Lo, W. C. (1993). Memory in interest rate futures. Journal of Futures Markets, 13(8), 865–872. [Google Scholar] [CrossRef]
- Fung, H. G., Lo, W. C., & Peterson, J. E. (1994). Examining the dependency in intra-day stock index futures. Journal of Futures Markets, 14(4), 405–419. [Google Scholar] [CrossRef]
- Geweke, J., & Porter-Hudak, S. (1983). The estimation and application of long memory time series models. Journal of Time Series Analysis, 4(4), 221–238. [Google Scholar] [CrossRef]
- Gil-Alana, L. A. (2006). Fractional integration in daily stock market indexes. Review of Financial Economics, 15(1), 28–48. [Google Scholar] [CrossRef]
- Giot, P., & Laurent, S. (2004). Modelling daily value-at-risk using realized volatility and ARCH type models. Journal of Empirical Finance, 11(3), 379–398. [Google Scholar] [CrossRef]
- Granger, C. W., & Joyeux, R. (1980). An introduction to long-memory time series models and fractional differencing. Journal of Time Series Analysis, 1(1), 15–29. [Google Scholar] [CrossRef]
- Greene, M. T., & Fielitz, B. D. (1977). Long-term dependence in common stock returns. Journal of Financial Economics, 4(3), 339–349. [Google Scholar] [CrossRef]
- Halbleib, R., & Pohlmeier, W. (2012). Improving the value at risk forecasts: Theory and evidence from the financial crisis. Journal of Economic Dynamics and Control, 36(8), 1212–1228. [Google Scholar] [CrossRef]
- Hammoudeh, S., & Li, H. (2008). Sudden changes in volatility in emerging markets: The case of Gulf Arab stock markets. International Review of Financial Analysis, 17(1), 47–63. [Google Scholar] [CrossRef]
- Hammoudeh, S., Santos, P. A., & Al-Hassan, A. (2013). Downside risk management and VaR-based optimal portfolios for precious metals, oil and stocks. The North American Journal of Economics and Finance, 25, 318–334. [Google Scholar] [CrossRef]
- Härdle, W., & Mungo, J. (2008). Value-at-risk and expected shortfall when there is long range dependence. (January 7, 2008). SFB 649 discussion paper 2008-006. Humboldt University of Berlin. [Google Scholar]
- Helms, B. P., Kaen, F. R., & Rosenman, R. E. (1984). Memory in commodity futures contracts. Journal of Futures Markets, 4(4), 559–567. [Google Scholar] [CrossRef]
- Hendricks, D. (1996). Evaluation of value-at-risk models using historical data. Economic Policy Review, 2(1), 39–70. [Google Scholar] [CrossRef]
- Henry, O. T. (2002). Long memory in stock returns: Some international evidence. Applied Financial Economics, 12(10), 725–729. [Google Scholar] [CrossRef]
- Hillebrand, E. (2005). Neglecting parameter changes in GARCH models. Journal of Econometrics, 129(1), 121–138. [Google Scholar] [CrossRef]
- Hosking, J. R. M. (1981). Fractional differencing. Biometrika, 68(1), 165–176. [Google Scholar] [CrossRef]
- Hurst, H. E. (1951). {Long-term storage capacity of reservoirs}. Transactions of the American Society of Civil Engineers, 116, 770–808. [Google Scholar] [CrossRef]
- Hurst, H. E. (1957). A suggested statistical model of some time series which occur in nature. Nature, 180, 494. [Google Scholar] [CrossRef]
- Inclan, C., & Tiao, G. C. (1994). Use of Cumulative sums of squares for retrospective detection of changes of variance. Journal of the American Statistical Association, 89(427), 913–923. [Google Scholar]
- Jacobsen, B. (1996). Long term dependence in stock returns. Journal of Empirical Finance, 3(4), 393–417. [Google Scholar] [CrossRef]
- Karolyi, G. (2006). Shock markets: What do we know about terrorism and the financial markets. Canadian Investment Review, 19(2), 9–15. [Google Scholar]
- Kasman, A., Kasman, S., & Torun, E. (2009). Dual long memory property in returns and volatility: Evidence from the CEE countries’ stock markets. Emerging Markets Review, 10(2), 122–139. [Google Scholar] [CrossRef]
- Kokoszka, P., & Leipus, R. (2000). Change-point estimation in ARCH models. Bernoulli, 6, 513–539. [Google Scholar] [CrossRef]
- Korkmaz, T., Cevik, E. I., & Özataç, N. (2009). Testing for long memory in ISE using ARFIMA-FIGARCH model and structural break test. International Research Journal of Finance and Economics, 1(26), 186–191. [Google Scholar]
- Kupiec, P. H. (1995). Techniques for verifying the accuracy of risk measurement models. The Journal of Derivatives, 3(2), 73–84. [Google Scholar] [CrossRef]
- Lamoureux, C. G., & Lastrapes, W. D. (1990). Persistence in variance, structural change, and the GARCH model. Journal of Business & Economic Statistics, 8(2), 225–234. [Google Scholar]
- Lo, A. W. (1991). Long-term memory in stock market prices. Econometrica, 59(5), 1279–1313. [Google Scholar] [CrossRef]
- Mabrouk, S., & Aloui, C. (2010). One-day-ahead value-at-risk estimations with dual long-memory models: Evidence from the Tunisian stock market. International Journal of Financial Services Management, 4(2), 77–94. [Google Scholar] [CrossRef]
- Mabrouk, S., & Saadi, S. (2012). Parametric Value-at-Risk analysis: Evidence from stock indices. The Quarterly Review of Economics and Finance, 52(3), 305–321. [Google Scholar] [CrossRef]
- Malik, F. (2003). Sudden changes in variance and volatility persistence in foreign exchange markets. Journal of Multinational Financial Management, 13(3), 217–230. [Google Scholar] [CrossRef]
- Malik, F. (2011). Estimating the impact of good news on stock market volatility. Applied Financial Economics, 21(8), 545–554. [Google Scholar] [CrossRef]
- Mandelbrot, B. (1972). Statistical methodology for nonperiodic cycles: From the covariance to R/S analysis. In Annals of economic and social measurement (volume 1, pp. 259–290). NBER. [Google Scholar]
- Mandelbrot, B. B., & Wallis, J. R. (1969). Some long-run properties of geophysical records. Water Resources Research, 5(2), 321–340. [Google Scholar] [CrossRef]
- Marzo, M., & Zagaglia, P. (2010). Volatility forecasting for crude oil futures. Applied Economics Letters, 17(16), 1587–1599. [Google Scholar] [CrossRef]
- McLeod, A. I., & Hipel, K. W. (1978). Preservation of the rescaled adjusted range: 1. A reassessment of the Hurst Phenomenon. Water Resources Research, 14(3), 491–508. [Google Scholar] [CrossRef]
- McMillan, D. G., & Kambouroudis, D. (2009). Are RiskMetrics forecasts good enough? Evidence from 31 stock markets. International Review of Financial Analysis, 18(3), 117–124. [Google Scholar] [CrossRef]
- Mikosch, T., & Stărică, C. (2004). Nonstationarities in financial time series, the long range dependence, and the IGARCH effects. Review of Economics and Statistics, 86(1), 378–390. [Google Scholar] [CrossRef]
- Perron, P., & Qu, Z. (2007). An analytical evaluation of the log-periodogram estimate in the presence of level shifts [Unpublished Manuscript]. Department of Economics, Boston University.
- Peters, E. E. (1989). Fractal structure in the capital markets. Financial Analysts Journal, 45(4), 32–37. [Google Scholar] [CrossRef]
- Robinson, P. M., & Henry, M. (1999). Long and short memory conditional heteroskedasticity in estimating the memory parameter of levels. Econometric theory, 15(3), 299–336. [Google Scholar] [CrossRef]
- Rodrigues, P. M., & Rubia, A. (2011). The effects of additive outliers and measurement errors when testing for structural breaks in variance. Oxford Bulletin of Economics and Statistics, 73(4), 449–468. [Google Scholar] [CrossRef]
- Rossignolo, A. F., Fethi, M. D., & Shaban, M. (2012). Value-at-Risk models and Basel capital charges: Evidence from Emerging and Frontier stock markets. Journal of Financial Stability, 8(4), 303–319. [Google Scholar] [CrossRef]
- Sadique, S., & Silvapulle, P. (2001). Long-term memory in stock market returns: International evidence. International Journal of Finance & Economics, 6(1), 59–67. [Google Scholar]
- Sansó, A., Aragó, V., & Carrion, J. L. (2004). Testing for changes in the unconditional variance of financial time series. Revista de Economia Financiera, 4, 32–53. [Google Scholar]
- Scaillet, O. (2004). Nonparametric estimation and sensitivity analysis of expected shortfall. Mathematical Finance: An International Journal of Mathematics, Statistics and Financial Economics, 14(1), 115–129. [Google Scholar] [CrossRef]
- Shieh, S. J. (2006). Long memory and sampling frequencies: Evidence in stock index futures markets. International Journal of Theoretical and Applied Finance, 9(05), 787–799. [Google Scholar] [CrossRef]
- So, M. K., & Philip, L. H. (2006). Empirical analysis of GARCH models in value at risk estimation. Journal of International Financial Markets, Institutions and Money, 16(2), 180–197. [Google Scholar] [CrossRef]
- Souffargi, W., & Boubaker, A. (2022). Structural breaks, asymmetry and persistence of stock market volatility: Evidence from post-revolution Tunisia. International Journal of Economics and Finance, 14(9), 1–51. [Google Scholar] [CrossRef]
- Souffargi, W., & Boubaker, A. (2023). The effects of rising terrorism on a small capital market: Evidence from Tunisia. Defence and Peace Economics, 34(3), 323–342. [Google Scholar] [CrossRef]
- Souffargi, W., & Boubaker, A. (2024). Impact of political uncertainty on stock market returns: The case of post-revolution Tunisia. Cogent Social Sciences, 10(1), 2324525. [Google Scholar] [CrossRef]
- Tang, T. L., & Shieh, S. J. (2006). Long memory in stock index futures markets: A value-at-risk approach. Physica A: Statistical Mechanics and its Applications, 366, 437–448. [Google Scholar] [CrossRef]
- Tolvi, J. (2003). Long memory in a small stock market. Economics Bulletin, 7(3), 1–13. [Google Scholar]
- Tse, Y. K. (1998). The conditional heteroscedasticity of the yen–dollar exchange rate. Journal of Applied Econometrics, 13(1), 49–55. [Google Scholar] [CrossRef]
- Yamai, Y., & Yoshiba, T. (2005). Value-at-risk versus expected shortfall: A practical perspective. Journal of Banking & Finance, 29(4), 997–1015. [Google Scholar]

| Panel A: Basic descriptive statistics | |
| Mean | 0.038027 |
| Median | 0.021586 |
| Maximum | 4.1086 |
| Minimum | −5.0037 |
| Std. dev | 0.52516 |
| Skewness | −0.285003 |
| Kurtosis | 13.98541 |
| JB | 22,209.31 *** |
| Q(10) | 503.68 *** |
| Q2(10) | 2439.0 *** |
| 6450.8 *** | |
| Panel B: Unit root tests | |
| ADF | −27.45200 *** |
| PP | −48.60005 *** |
| Panel C: Heteroskedasticity test | |
| ARCH LM test | 175.3621 *** |
| Geweke and Porter-Hudak (1983) test | |
| |
| m = T0.5 | 0.3373 [0.0001] |
| m = T0.6 | 0.2376 [0.0000] |
| m = T0.8 | 0.2468 [0.0000] |
| |
| m = T0.5 | 0.4776 [0.0000] |
| m = T0.6 | 0.3346 [0.0000] |
| m = T0.8 | 0.3190 [0.0000] |
| Robinson and Henry (1999) test | |
| |
| m = T/4 | 0.2491 [0.0000] |
| m = T/16 | 0.3276 [0.0000] |
| m = T/64 | 0.3141 [0.0000] |
| |
| m = T0.5 | 0.5415 [0.0000] |
| m = T0.6 | 0.3935 [0.0000] |
| m = T0.8 | 0.3425 [0.0000] |
| Lo (1991) test | |
| |
| m = 10 | 2.3516 |
| m = 40 | 1.7475 |
| m = 110 | 1.4550 |
| |
| m = 10 | 2.5661 |
| m = 40 | 1.8627 |
| m = 110 | 1.5167 |
| T | κ1 | κ2 |
|---|---|---|
| 27-01-1999 02-03-1999 05-01-2000 14-01-2000 10-02-2000 21-09-2000 14-09-2001 01-10-2001 31-03-2003 16-05-2003 22-09-2003 31-03-2005 08-04-2005 30-11-2005 24-05-2007 18-06-2007 27-03-2008 04-04-2008 11-07-2008 07-08-2008 29-09-2008 08-10-2008 23-10-2008 12-01-2009 11-09-2009 18-01-2010 24-05-2010 26-07-2010 05-10-2010 07-10-2010 02-11-2010 07-01-2011 08-03-2011 26-10-2011 30-03-2012 05-02-2013 28-05-2013 | 27-01-1999 02-03-1999 05-01-2000 22-05-2003 30-11-2005 18-06-2007 07-01-2011 08-03-2011 | 27-03-2008 01-10-2010 09-05-2011 |
| Coefficient | t-Prob | |
|---|---|---|
| d-ARFIMA | 0.0888 *** | 0.0000 |
| AR(1) | −0.6624 *** | 0.0000 |
| MA(1) | 0.8058 *** | 0.0000 |
| MA(2) | 0.1318 *** | 0.0000 |
| IT1 | 0.9834 *** | 0.0936 |
| IT2 | −0.5366 * | 0.0222 |
| IT3 | 1.0875 * | 0.0667 |
| IT4 | −0.6598 | 0.1883 |
| IT5 | −0.1418 | 0.1184 |
| IT6 | 0.2431 | 0.1756 |
| IT7 | 0.6586 * | 0.0938 |
| IT8 | −0.4959 * | 0.0627 |
| IT9 | 0.3859 ** | 0.0343 |
| IT10 | −0.1417 | 0.1131 |
| IT11 | −0.0548 * | 0.0581 |
| IT12 | 0.7669 *** | 0.0070 |
| IT13 | −0.6376 *** | 0.0059 |
| IT14 | 0.1770 ** | 0.0413 |
| IT15 | 0.5358 * | 0.0908 |
| IT16 | −0.3076 * | 0.0767 |
| IT17 | 3.7894 * | 0.0800 |
| IT18 | −2.9453 * | 0.0935 |
| IT19 | −0.1639 *** | 0.0000 |
| IT20 | 0.6961 ** | 0.0438 |
| IT21 | 10.0941 | 0.1166 |
| IT22 | −9.6629 * | 0.0885 |
| IT23 | 0.3536 | 0.6961 |
| IT24 | −0.1232 | 0.3146 |
| IT25 | 0.1994 | 0.1625 |
| IT26 | −0.0701 | 0.2162 |
| IT27 | −0.0783 *** | 0.0000 |
| IT28 | 0.0693 | 0.2036 |
| IT29 | 9.2775 | 0.2174 |
| IT30 | −8.9530 | 0.1988 |
| IT31 | 1.6249 * | 0.0819 |
| IT32 | −1.6244 ** | 0.0447 |
| IT33 | 4.3378 *** | 0.0098 |
| IT34 | −2.1860 *** | 0.0017 |
| IT35 | −0.3154 *** | 0.0000 |
| IT36 | 0.0615 | 0.5207 |
| IT37 | 0.0942 | 0.7317 |
| IT38 | −0.1411 *** | 0.0000 |
| d-Figarch | 0.2268 *** | 0.0000 |
| ARCH (Phi1) | 0.9537 *** | 0.0000 |
| GARCH (Beta1) | 0.9623 *** | 0.0000 |
| Student (DF) | 8.4889 *** | 0.0000 |
| Log Alpha (HY) | 0.1202 * | 0.0597 |
| Q2 (20) | 18.3968 | 0.4298 |
| ARCH (10) | 0.6815 | 0.7426 |
| h = 1 | ARFIMA-FIGARCH-St | ARFIMA-ICSS-FIGARCH-St | ARFIMA-κ1-FIGARCH-St | ARFIMA-κ2-FIGARCH-St | ||||
| MSE | 0.009254 | (0.004818) | 0.003512 | (0.002793) | 0.004068 | (0.004236) | 0.003893 | (0.004425) |
| MAE | 0.0962 | (0.06941) | 0.05926 | (0.05284) | 0.06378 | (0.06508) | 0.06239 | (0.06652) |
| TIC | 0.4274 | (0.4679) | 0.2262 | (0.401) | 0.2477 | (0.4519) | 0.241 | (0.4573) |
| RMSE | 0.0962 | (0.06941) | 0.05926 | (0.05284) | 0.06378 | (0.06508) | 0.06239 | (0.06652) |
| h = 5 | ARFIMA FIAPARCH-St | ARFIMA-ICSS-FIAPARCH-St | ARFIMA-κ1-FIAPARCH-St | ARFIMA-κ2-FIAPARCH-St | ||||
| MSE | 0.003966 | (0.004414) | 0.003349 | (0.003923) | 0.009386 | (0.004606) | 0.003933 | (0.00437) |
| MAE | 0.06298 | (0.06644) | 0.05787 | (0.06264) | 0.09688 | (0.06786) | 0.06272 | (0.0661) |
| TIC | 0.2438 | (0.457) | 0.2197 | (0.4424) | 0.4317 | (0.4623) | 0.2426 | (0.4558) |
| RMSE | 0.06298 | (0.06644) | 0.05787 | (0.06264) | 0.09688 | (0.06786) | 0.06272 | (0.0661) |
| h = 10 | ARFIMA-HYGARCH-St | ARFIMA-ICSS-HYGARCH-St | ARFIMA-κ1-HYGARCH-St | ARFIMA-κ2-HYGARCH-St | ||||
| MSE | 0.003941 | (0.004691) | 0.00955 | (0.005005) | 0.009379 | (0.005505) | 0.003856 | (0.004558) |
| MAE | 0.06278 | (0.06849) | 0.09772 | (0.07074) | 0.09684 | (0.07419) | 0.06209 | (0.06751) |
| TIC | 0.2429 | (0.4646) | 0.4371 | (0.4726) | 0.4315 | (0.4845) | 0.2396 | (0.461) |
| RMSE | 0.06278 | (0.06849) | 0.09772 | (0.07074) | 0.09684 | (0.07419) | 0.06209 | (0.06751) |
| Panel A. Short Position | Panel B. Long Position | ||||||||
|---|---|---|---|---|---|---|---|---|---|
| Quantile | Success Rate | Kupiec LRT | DQT | ESF | Quantile | Failure Rate | Kupiec LRT | DQT | ESF |
| Without dummies ARFIMA-FIGARCH | |||||||||
| 0.95000 | 0.93666 | 15.267 (9.3335 × 10⁻⁵) | 19.780 (0.0030303) | 0.92612 | 0.050000 | 0.051078 | 0.10711 (0.74346) | 4.2166 (0.64739) | −0.94183 |
| 0.97500 | 0.97072 | 3.1477 (0.076033) | 8.9401 (0.17698) | 1.0682 | 0.025000 | 0.028150 | 1.7239 (0.18919) | 12.806 (0.046224) | −1.0756 |
| 0.99000 | 0.98842 | 1.0541 (0.30456) | 6.2504 (0.39574) | 1.2728 | 0.010000 | 0.010443 | 0.085948 (0.76939) | 7.4811 (0.27863) | −1.4611 |
| 0.99500 | 0.99410 | 0.68136 (0.40912) | 12.554 (0.050692) | 1.4565 | 0.0050000 | 0.0063564 | 1.4996 (0.22073) | 12.377 (0.054065) | −1.7704 |
| 0.99750 | 0.99614 | 2.7954 (0.094537) | 45.438 (3.8305 × 10⁻⁸) | 1.4680 | 0.0025000 | 0.0038593 | 2.7954 (0.094537) | 3.7817 (0.70619) | −1.8591 |
| ARFIMA-FIAPARCH | |||||||||
| 0.95000 | 0.94302 | 4.3327 (0.037386) | 10.779 (0.095454) | 0.93101 | 0.050000 | 0.048354 | 0.25387 (0.61437) | 3.1743 (0.78667) | −0.95550 |
| 0.97500 | 0.97276 | 0.88288 (0.34741) | 7.0652 (0.31486) | 1.0806 | 0.025000 | 0.024064 | 0.16044 (0.68875) | 5.4236 (0.49073) | −1.1233 |
| 0.99000 | 0.98956 | 0.085948 (0.76939) | 2.9911 (0.80997) | 1.2187 | 0.010000 | 0.0095346 | 0.097882 (0.75439) | 3.0611 (0.80113) | −1.5197 |
| 0.99500 | 0.99432 | 0.38690 (0.53393) | 12.949 (0.043849) | 1.4907 | 0.0050000 | 0.0056754 | 0.38690 (0.53393) | 7.0252 (0.31852) | −1.7746 |
| 0.99750 | 0.99659 | 1.2992 (0.25436) | 1.8026 (0.93693) | 1.4840 | 0.0025000 | 0.0024972 | 1.4229 × 10⁻⁵ (0.99699) | 0.13948 (0.99995) | −2.1762 |
| ARFIMA-HYGARCH | |||||||||
| 0.95000 | 0.94597 | 1.4689 (0.22552) | 5.8227 (0.44334) | 0.94781 | 0.050000 | 0.044949 | 2.4456 (0.11786) | 5.7780 (0.44851) | −0.98197 |
| 0.97500 | 0.97594 | 0.16044 (0.68875) | 2.8905 (0.82247) | 1.1007 | 0.025000 | 0.021793 | 1.9410 (0.16356) | 5.8868 (0.43598) | −1.1677 |
| 0.99000 | 0.99047 | 0.097882 (0.75439) | 3.0021 (0.80859) | 1.2725 | 0.010000 | 0.0086266 | 0.88021 (0.34814) | 4.2017 (0.64940) | −1.5851 |
| 0.99500 | 0.99501 | 2.8530 × 10⁻⁵ (0.99574) | 15.067 (0.019740) | 1.3361 | 0.0050000 | 0.0047673 | 0.048699 (0.82534) | 8.2654 (0.21929) | −1.9254 |
| 0.99750 | 0.99728 | 0.086238 (0.76902) | 0.27002 (0.99963) | 1.5995 | 0.0025000 | 0.0022701 | 0.096315 (0.75630) | 0.19800 (0.99985) | −2.2720 |
| RiskMetrics | |||||||||
| 0.95000 | 0.93961 | 9.4080 (0.0021604) | 83.850 (5.5511 × 10⁻¹⁶) | 0.97461 | 0.050000 | 0.044268 | 3.1642 (0.075269) | 35.633 (3.2485 × 10⁻⁶) | −0.99722 |
| 0.97500 | 0.96549 | 14.628 (0.00013095) | 145.48 (0.00000) | 1.1196 | 0.025000 | 0.025199 | 0.0071123 (0.93279) | 37.312 (1.5305 × 10⁻⁶) | −1.2032 |
| 0.99000 | 0.98138 | 26.340 (2.8633 × 10⁻⁷) | 109.96 (0.00000) | 1.3415 | 0.010000 | 0.014302 | 7.2664 (0.0070255) | 57.188 (1.6735 × 10⁻¹⁰) | −1.4571 |
| 0.99500 | 0.98729 | 36.829 (1.2893 × 10⁻⁹) | 237.16 (0.00000) | 1.4927 | 0.0050000 | 0.0088536 | 10.684 (0.0010808) | 44.471 (5.9610 × 10⁻⁸) | −1.6461 |
| 0.99750 | 0.98888 | 70.648 (0.00000) | 274.46 (0.00000) | 1.5367 | 0.0025000 | 0.0065834 | 20.258 (6.7667 × 10⁻⁶) | 90.773 (0.00000) | −1.8042 |
| With dummies ARFIMA-FIGARCH | |||||||||
| 0.95000 | 0.94279 | 4.6131 (0.031729) | 18.449 (0.0052031) | 0.89055 | 0.050000 | 0.048808 | 0.13273 (0.71562) | 4.5418 (0.60377) | −0.85211 |
| 0.97500 | 0.97299 | 0.71512 (0.39775) | 4.7810 (0.57219) | 1.0030 | 0.025000 | 0.025426 | 0.032563 (0.85680) | 5.9818 (0.42523) | −0.99780 |
| 0.99000 | 0.98978 | 0.020549 (0.88601) | 2.6673 (0.84929) | 1.1595 | 0.010000 | 0.011124 | 0.54213 (0.46155) | 3.4825 (0.74630) | −1.2357 |
| 0.99500 | 0.99432 | 0.38690 (0.53393) | 1.2378 (0.97498) | 1.1623 | 0.0050000 | 0.0061294 | 1.0532 (0.30477) | 2.1823 (0.90219) | −1.3679 |
| 0.99750 | 0.99682 | 0.74777 (0.38718) | 1.1009 (0.98150) | 1.4176 | 0.0025000 | 0.0027242 | 0.086238 (0.76902) | 0.27002 (0.99963) | −1.5662 |
| ARFIMA-FIAPARCH | |||||||||
| 0.95000 | 0.94597 | 1.4689 (0.22552) | 13.086 (0.041685) | 0.90051 | 0.050000 | 0.046538 | 1.1367 (0.28636) | 3.6434 (0.72481) | −0.87643 |
| 0.97500 | 0.97526 | 0.011827 (0.91340) | 5.3098 (0.50474) | 1.0315 | 0.025000 | 0.023610 | 0.35589 (0.55080) | 4.8888 (0.55815) | −1.0177 |
| 0.99000 | 0.99024 | 0.025482 (0.87317) | 2.7578 (0.83857) | 1.1836 | 0.010000 | 0.010216 | 0.020549 (0.88601) | 2.5986 (0.85727) | −1.2499 |
| 0.99500 | 0.99523 | 0.048699 (0.82534) | 0.54004 (0.99732) | 1.2352 | 0.0050000 | 0.0047673 | 0.048699 (0.82534) | 0.54004 (0.99732) | −1.5277 |
| 0.99750 | 0.99728 | 0.086238 (0.76902) | 0.27002 (0.99963) | 1.4970 | 0.0025000 | 0.0024972 | 1.4229 × 10⁻⁵ (0.99699) | 0.13948 (0.99995) | −1.5826 |
| ARFIMA-HYGARCH | |||||||||
| 0.95000 | 0.94665 | 1.0185 (0.31287) | 9.4534 (0.14964) | 0.91518 | 0.050000 | 0.043587 | 3.9794 (0.046060) | 6.6709 (0.35236) | −0.89863 |
| 0.97500 | 0.97616 | 0.24841 (0.61820) | 3.1524 (0.78949) | 1.0865 | 0.025000 | 0.022247 | 1.4211 (0.23323) | 8.5323 (0.20164) | −1.0450 |
| 0.99000 | 0.99115 | 0.60828 (0.43544) | 2.9439 (0.81586) | 1.2327 | 0.010000 | 0.0083995 | 1.2052 (0.27228) | 3.5046 (0.74335) | −1.3337 |
| 0.99500 | 0.99591 | 0.78866 (0.37450) | 1.0481 (0.98372) | 1.3101 | 0.0050000 | 0.0045403 | 0.19310 (0.66035) | 0.61174 (0.99620) | −1.5572 |
| 0.99750 | 0.99750 | 1.4229 × 10⁻⁵ (0.99699) | 0.13948 (0.99995) | 1.5695 | 0.0025000 | 0.0018161 | 0.91363 (0.33915) | 0.87963 (0.98977) | −1.8439 |
| Panel A. Short Position | Panel B. Long Position | ||||||||
|---|---|---|---|---|---|---|---|---|---|
| Quantile | Success Rate | Kupiec LRT | DQT | ESF | Quantile | Failure Rate | Kupiec LRT | DQT | ESF |
| With dummies ARFIMA-HYGARCH | |||||||||
| 0.95000 | 0.94762 | 0.14817 (0.70029) | 0.15038 (0.69818) | 0.34162 | 0.050000 | 0.049206 | 0.016793 (0.89689) | 0.016708 (0.89715) | −0.42699 |
| 0.97500 | 0.97381 | 0.072153 (0.78823) | 0.073260(0.78665) | 0.38899 | 0.025000 | 0.025397 | 0.0080984 (0.92829) | 0.0081400 (0.92811) | −0.49772 |
| 0.99000 | 0.99127 | 0.21442 (0.64333) | 0.20523 (0.65053) | 0.46804 | 0.010000 | 0.0063492 | 1.9489 (0.16271) | 1.6963 (0.19277) | −0.56897 |
| 0.99500 | 0.99603 | 0.29023 (0.59007) | 0.26960 (0.60360) | 0.56656 | 0.0050000 | 0.0031746 | 0.97017 (0.32464) | 0.84390 (0.35828) | −0.65495 |
| 0.99750 | 0.99841 | 0.48403 (0.48660) | 0.42089 (0.51649) | 0.38525 | 0.0025000 | 0.0023810 | 0.0072769 (0.93202) | 0.0071608 (0.93256) | −0.77941 |
| ARFIMA-FIAPARCH | |||||||||
| 0.95000 | 0.91587 | 25.868 (3.6557 × 10⁻⁷) | 30.894 (2.7253 × 10⁻⁸) | 0.32255 | 0.050000 | 0.071429 | 10.815 (0.0010067) | 12.180 (0.00048293 | −0.38649 |
| 0.97500 | 0.95714 | 13.626 (0.00022305) | 16.484 (4.9075 × 10⁻⁵) | 0.38541 | 0.025000 | 0.040476 | 10.459 (0.0012208) | 12.381 (0.00043374) | −0.46576 |
| 0.99000 | 0.98175 | 6.9696 (0.0082905) | 8.6708 (0.0032334) | 0.43339 | 0.010000 | 0.016667 | 4.7114 (0.029964) | 5.6566 (0.017390) | −0.69602 |
| 0.99500 | 0.98968 | 5.4703 (0.019343) | 7.1612 (0.0074497) | 0.46698 | 0.0050000 | 0.0071429 | 1.0260 (0.31111) | 1.1630 (0.28085) | −0.68582 |
| 0.99750 | 0.99524 | 2.0388 (0.15334) | 2.5850 (0.10788) | 0.55245 | 0.0025000 | 0.0039683 | 0.92308 (0.33667) | 1.0892 (0.29664) | −0.74953 |
| ARFIMA-FIGARCH | |||||||||
| 0.95000 | 0.92619 | 13.199 (0.00028015) | 15.038 (0.00010539) | 0.32951 | 0.050000 | 0.062698 | 3.9723 (0.046255) | 4.2774 (0.038623) | −0.40151 |
| 0.97500 | 0.96270 | 6.8114 (0.0090576) | 7.8225 (0.0051598) | 0.37591 | 0.025000 | 0.034921 | 4.5374 (0.033162) | 7.8225 (0.0051598) | −0.48474 |
| 0.99000 | 0.98651 | 1.3991 (0.23687) | 1.5520 (0.21284) | 0.43983 | 0.010000 | 0.0095238 | 0.029325 (0.86403) | 0.028860 (0.86510) | −0.58175 |
| 0.99500 | 0.99206 | 1.8516 (0.17359) | 2.1839 (0.13946) | 0.47945 | 0.0050000 | 0.0055556 | 0.075438 (0.78358) | 0.078169 (0.77979) | −0.62533 |
| 0.99750 | 0.99603 | 0.92308 (0.33667) | 1.0892 (0.29664) | 0.56656 | 0.0025000 | 0.0023810 | 0.0072769 (0.93202) | 0.0071608 (0.93256) | −0.77941 |
| Without dummies ARFIMA-HYGARCH | |||||||||
| 0.95000 | 0.94444 | 0.79149 (0.37365) | 0.81871 (0.36556) | 0.34067 | 0.050000 | 0.049206 | 0.016793 (0.89689) | 0.016708 (0.89715) | −0.43280 |
| 0.97500 | 0.97302 | 0.1984 (0.65597) | 0.20350 (0.65191) | 0.39069 | 0.025000 | 0.026190 | 0.072153 (0.78823) | 0.073260 (0.78665) | −0.46395 |
| 0.99000 | 0.99127 | 0.21442 (0.64333) | 0.20523 (0.65053) | 0.46804 | 0.010000 | 0.0063492 | 1.9489 (0.16271) | 1.6963 (0.19277) | −0.56897 |
| 0.99500 | 0.99603 | 0.29023 (0.59007) | 0.26960 (0.60360) | 0.56656 | 0.0050000 | 0.0031746 | 0.97017 (0.32464) | 0.84390 (0.35828) | −0.65495 |
| 0.99750 | 0.99841 | 0.48403 (0.48660) | 0.42089 (0.51649) | 0.38525 | 0.0025000 | 0.0023810 | 0.0072769 (0.93202) | 0.0071608 (0.93256) | −0.77941 |
| ARFIMA-FIAPARCH | |||||||||
| 0.95000 | 0.92063 | 19.563 (9.7349 × 10⁻⁶) | 22.874 (1.7299 × 10⁻⁶) | 0.32870 | 0.050000 | 0.073810 | 13.199 (0.00028015) | 15.038 (0.00010539) | −0.37557 |
| 0.97500 | 0.95794 | 12.531 (0.00040031) | 15.051 (0.00010465) | 0.38982 | 0.025000 | 0.038889 | 8.5501 (0.0034551) | 9.9715 (0.0015898) | −0.47546 |
| 0.99000 | 0.98175 | 6.9696 (0.0082905) | 8.6708 (0.0032334) | 0.44786 | 0.010000 | 0.015873 | 3.7254 (0.053591) | 4.3899 (0.036152) | −0.70995 |
| 0.99500 | 0.99048 | 4.0905 (0.043124) | 5.1831 (0.022808) | 0.47913 | 0.0050000 | 0.0087302 | 2.8792 (0.089728) | 3.5240 (0.060487) | −0.78024 |
| 0.99750 | 0.99524 | 2.0388 (0.15334) | 2.5850 (0.10788) | 0.55245 | 0.0025000 | 0.0039683 | 0.92308 (0.33667) | 1.0892 (0.29664) | −0.74953 |
| ARFIMA-FIGARCH | |||||||||
| 0.95000 | 0.92619 | 13.199 (0.00028015) | 15.038 (0.00010539) | 0.33053 | 0.050000 | 0.065873 | 6.1032 (0.013494) | 6.6834 (0.0097316) | −0.38926 |
| 0.97500 | 0.96587 | 3.8723 (0.049090) | 4.3061 (0.037977) | 0.36784 | 0.025000 | 0.035714 | 5.2496 (0.021951) | 5.9341 (0.014851) | −0.48170 |
| 0.99000 | 0.98413 | 3.7254 (0.053591) | 4.3899 (0.036152) | 0.44005 | 0.010000 | 0.011111 | 0.15167 (0.69695) | 0.15713 (0.69182) | −0.68124 |
| 0.99500 | 0.99206 | 1.8516 (0.17359) | 2.1839 (0.13946) | 0.47945 | 0.0050000 | 0.0055556 | 0.075438 (0.78358) | 0.078169 (0.77979) | −0.62533 |
| 0.99750 | 0.99603 | 0.92308 (0.33667) | 1.0892 (0.29664) | 0.56656 | 0.0025000 | 0.0023810 | 0.0072769 (0.93202) | 0.0071608 (0.93256) | −0.77941 |
| RiskMetrics | |||||||||
| 0.95000 | 0.93492 | 5.5311 (0.018682) | 6.0317 (0.014051) | 0.80584 | 0.050000 | 0.051587 | 0.066174 (0.79699) | 0.066834 (0.79600) | −1.0352 |
| 0.97500 | 0.95952 | 10.459 (0.0012208) | 12.381 (0.00043374) | 0.93511 | 0.025000 | 0.033333 | 3.2553 (0.071193) | 3.5897 (0.058137) | −1.1936 |
| 0.99000 | 0.97778 | 14.107 (0.00017267) | 19.012 (1.2988 × 10⁻⁵) | 1.0623 | 0.010000 | 0.020635 | 11.013 (0.00090463) | 14.395 (0.00014822) | −1.4150 |
| 0.99500 | 0.98492 | 16.677 (4.4318 × 10⁻⁵) | 25.730 (3.9263 × 10⁻⁷) | 1.1197 | 0.0050000 | 0.014286 | 14.503 (0.00013993) | 21.838 (2.9670 × 10⁻⁶) | −1.6806 |
| 0.99750 | 0.98810 | 23.232 (1.4362 × 10⁻⁶) | 44.690 (2.3080 × 10⁻¹¹) | 1.2002 | 0.0025000 | 0.011111 | 20.160 (7.1217 × 10⁻⁶) | 37.466 (9.3026 × 10⁻¹⁰) | −1.8526 |
Disclaimer/Publisher’s Note: The statements, opinions and data contained in all publications are solely those of the individual author(s) and contributor(s) and not of MDPI and/or the editor(s). MDPI and/or the editor(s) disclaim responsibility for any injury to people or property resulting from any ideas, methods, instructions or products referred to in the content. |
© 2025 by the authors. Licensee MDPI, Basel, Switzerland. This article is an open access article distributed under the terms and conditions of the Creative Commons Attribution (CC BY) license (https://creativecommons.org/licenses/by/4.0/).
Share and Cite
Souffargi, W.; Boubaker, A. Modelling Value-at-Risk and Expected Shortfall for a Small Capital Market: Do Fractionally Integrated Models and Regime Shifts Matter? J. Risk Financial Manag. 2025, 18, 203. https://doi.org/10.3390/jrfm18040203
Souffargi W, Boubaker A. Modelling Value-at-Risk and Expected Shortfall for a Small Capital Market: Do Fractionally Integrated Models and Regime Shifts Matter? Journal of Risk and Financial Management. 2025; 18(4):203. https://doi.org/10.3390/jrfm18040203
Chicago/Turabian StyleSouffargi, Wafa, and Adel Boubaker. 2025. "Modelling Value-at-Risk and Expected Shortfall for a Small Capital Market: Do Fractionally Integrated Models and Regime Shifts Matter?" Journal of Risk and Financial Management 18, no. 4: 203. https://doi.org/10.3390/jrfm18040203
APA StyleSouffargi, W., & Boubaker, A. (2025). Modelling Value-at-Risk and Expected Shortfall for a Small Capital Market: Do Fractionally Integrated Models and Regime Shifts Matter? Journal of Risk and Financial Management, 18(4), 203. https://doi.org/10.3390/jrfm18040203