1. Introduction
Numerous firm-specific factors that both influence and reflect a company’s capital structure have been the focus of previous research.
Hall et al. (
2004) identified attributes such as age, size, profitability, asset structure, growth, and risk as key factors. A meta-analysis by
Kumar et al. (
2017) uncovered a significant gap in the existing literature, particularly in exploring the connection between several board characteristics, including age, gender, education, and experience, and financing choices in corporations across both developed and developing nations.
According to
Afify (
2009), a higher percentage of independent directors enhances board supervision of management. A diverse board, especially one with more independent directors, enhances oversight and business performance, according to agency theory (
Basuony & Mohamed, 2014). Previous research shows that the board has a significant impact on the capital organization (
Tarus & Ayabei, 2016) and has a crucial role in management, controlling performance, and making important strategic decisions, such as those pertaining to capital structure (
Fama & Jensen, 1983;
McGuinness, 2021). Moreover,
Khan et al. (
2020) reveal that better corporate governance leads to a lower cost of capital. Therefore, board composition is a crucial consideration in financial decisions since boards have the power to discuss and adopt financial strategies like stock issuance or leverage (
Elmoursy, 2020).
Consequently, this study examines how board diversity influences capital structure decisions in UK-listed firms on the London Stock Exchange (LSE) under varying market conditions from 2002 to 2021. While extensive research exists on capital structure determinants, limited studies have specifically explored the role of board diversity—considering gender, nationality, age, and education—within different UK financial market states. Prior research has largely focused on static conditions, failing to account for how market fluctuations affect the relationship between board diversity and capital structure. This gap creates uncertainty for corporate decision-makers, policymakers, and financial analysts in understanding how board diversity factors into financial decision-making.
Using a quantitative methodology, this study draws on financial and governance data from BoardEx, ORBIS, and DataStream. Capital structure is the dependent variable, while board diversity serves as the independent variable. This research applies linear regression, fixed effect models, and transition regime regression models, categorizing market conditions into extremely good, moderate, and extremely bad states.
To the best of our knowledge, this study makes two key contributions. First, while the existing research has touched on the impact of board diversity on the capital structure, this study specifically emphasizes the influence of board diversity, considering factors such as nationality, gender, age, and education board diversity. Second, this study is the first to moderate the current of the market state and economic returns by employing transition regime regression models, which is achieved by analyzing how board diversity impacts capital structure under two different market states: when the financial market is performing good and when it is bad. This study then categorizes these into three regime states: high (extremely good), moderate, and low (extremely bad) conditions of the financial market.
This study is limited to UK-listed firms. It focuses on board diversity but excludes other governance mechanisms like ownership structure and managerial incentives. Additionally, while the model captures market fluctuations, it does not explicitly consider macroeconomic policies or industry-specific dynamics.
The remainder of this paper is organized as follows.
Section 2 discusses the literature review, presenting theoretical background and hypotheses development.
Section 3 outlines the research methods and methodology used.
Section 4 covers data analysis and discussions. Finally,
Section 5 addresses the conclusions of this paper.
2. Literature Review
2.1. Theoretical Background
The trade-off theory seeks to maximize the net benefits of debt issuance by matching the use of equity and debt to regulate the optimal capital structure. According to this theory, debt financing is more economical than equity financing as the interest payments are tax-deductible, given the benefit known as a tax shield, which lowers the weighted average cost of capital. Nevertheless, the reduction in the weighted average cost of capital is offset by the higher financial risk associated with debt financing. These risks include bankruptcy risk and agency costs related to financial distress (
Jensen & Meckling, 2019;
Kraus & Litzenberger, 1973). Consequently, while the marginal cost of debt financing upsurges, the marginal benefit falls. Companies must therefore manage the trade-off between the benefits and the debt financing cost to establish the optimal capital structure (
Elmoursy, 2020).
Pecking order theory and trade-off theory fundamentally differ in their perspectives on capital structure. The trade-off theory suggests that managers strive for an optimal leverage ratio, whereas the pecking order theory argues that managers prioritize internal funds, resorting to debt when necessary and issuing equity only as a last resort (
Myers, 1984). Critics contend that the pecking order theory may lead managers to excessively avoid equity issuance. However, evidence from Gu et al., (2023) suggests that managers may still adhere to this theory even while maintaining target leverage ratios (
Lemmon & Zender, 2010).
External financing can exacerbate marginalization in a firm’s investment decisions, ultimately reducing welfare, though insolvency costs may help mitigate this effect (
Huberts et al., 2024). Additionally, agency costs arise from conflicts between shareholders and directors (
Fama & Jensen, 1983), with agency theory aiming to align their interests.
Voluntary disclosure can reduce agency costs by providing debt suppliers with information on the firm’s repayment capacity (
Jensen & Meckling, 2019), though it also increases costs. Similarly, investors require more information to assess a company’s performance (
Elmoursy, 2020). To address agency costs, increasing debt levels can serve as a mechanism to align interests and, in turn, enhance firm performance (
Ahmed et al., 2023).
2.2. Hypotheses’ Development
2.2.1. Board Size
Some studies argue that boards that are bigger promote director collegiality, leading to reduced information asymmetry, enhance firm performance (
Abiad et al., 2025;
Appah & Emeh, 2013;
EmadEldeen et al., 2021;
Potharla & Amirishetty, 2021;
Samaha & Dahawy, 2010), and improve sustainable development goals disclosures (
Denhere, 2024). Large boards provide reasonable control on the cost of debt, hence less need for more debt (
Ezeani et al., 2023;
Rehman et al., 2010;
Vakilifard et al., 2011).
On the other hand, the coordination, communication, and decision-making problems reduce the effectiveness of larger boards (
Awad et al., 2024); the power of the CEO is also curtailed (
Basuony & Mohamed, 2014), and agency issues worsen, which may lead to a higher debt ratio (
Puntaier et al., 2022;
Queiri et al., 2024) and high leverage (
Chowdhury et al., 2024).
Based on the previous results, the following hypothesis can be derived:
H1: The board size has a positive significant effect on the capital structure.
2.2.2. Board Independence
When a company constructs its board of directors to minimize the information asymmetry between managers and investors, it becomes easier to obtain external funding, even for the riskier options. As a result, independent board members probably have the tendency to be positively justified with financing from riskier sources. According to
Chowdhury et al. (
2024) and
Tarus & Ayabei (
2016), independent directors have shown a positive relation with leverage; this is because agency theory dictates that debt is the preferred choice of financing in light of considerable ownership conflicts between shareholders and management and hence, limited managerial influence (
Maug, 1997). This approach limits the free cash flow that managers can use at their discretion (
Jensen, 1986). On the other hand, some studies have shown a negative relationship between independent directors and capital structure (
Wen et al., 2002), arguing that the latter may be seen as weak policymakers who would tend to avoid risk and cost (
Ezeani et al., 2023;
Wen et al., 2002). Based on the previous results, the following hypothesis can be derived:
H2: The board’s independence has a positive significant effect on the capital structure.
2.2.3. Board Diversity
The diverse roles a stakeholder or member of society can play mean that a board of directors must contain sufficient diversity within its representation (
Ibrahim & Hanefah, 2016). This diversity is crucial to increasing board independence (
Carter et al., 2003), enhancing decision-making values (
Bear et al., 2010;
Bussoli et al., 2023), improving CSR practices (
Byron & Post, 2016), and sustainability performance (
EmadEldeen et al., 2025;
Shakil et al., 2020), which in turn enhances the firm’s performance (
Ararat et al., 2015;
Basuony et al., 2023b;
Bouaddi et al., 2023).
Gender Diversity
According to the human capital theory, board diversity, such as gender diversity, enhances firms’ performance due to diverse perspectives that foster creativity, innovation, and more effective leadership (
Rose, 2007). Moreover, according to the mass theory, having a minimum of three females on the board has a notable impact on companies. This influence extends to the board’s decisions concerning debt financing. Specifically, female directors contribute to stronger performance in management reporting (
Basuony et al., 2023a;
Gul et al., 2011;
Lee & Thong, 2023), public disclosure, and voluntary intellectual disclosure (
Nadeem, 2020), as well as overall firm performance (
Basuony et al., 2023a;
EmadEldeen et al., 2021). They are more likely to increase liquidity (
Shahrour et al., 2024), reduce loan covenant violations (
Alam et al., 2024), sit on monitoring committees and demonstrate greater punctuality, which substantially leads to better corporate governance (
Adams & Ferreira, 2008) and positively impacts firm leverage (
Amin et al., 2022;
Yakubu & Oumarou, 2023). Boards with greater female director representation may prefer internal funds, consistent with the pecking order theory.
Other studies suggest that gender diversity is negatively correlated with debt financing but significantly promotes equity financing (
Alves et al., 2015;
Ezeani et al., 2023). This risk aversion, often attributed to women, may, however, contribute to their difficulty in reaching top management positions, reinforcing the so-called glass ceiling (
Dwyer et al., 2003;
Johnson & Powell, 1994). Interestingly,
Weber & Zulehner (
2010) found that start-ups led by women have a greater chance of survival compared to those led by men.
While
Ria (
2023) found no significant relationship between gender diversity and the capital structure,
Ben Saad & Belkacem (
2022) suggest that its impact can be enabling, voluntary, or coercive depending on the specific context. Based on these findings, the following hypothesis can be derived:
H3: Gender diversity has a positive significant effect on the capital structure.
Nationality Diversity
Similarly, diverse nationalities on corporate boards can enhance or shrink a firm’s capital structure. Therefore, foreign directors may strengthen independence at the board level by fostering transparency in disclosures and reducing opportunistic behaviors to enhance efficiency and quality of financial statements (
Armstrong et al., 2010). Foreign directors have a broader vision and cross-cultural knowledge that ensures social responsibility and corporate governance, which may positively impact the reputation and firms’ performance (
Basuony et al., 2023b), thus possibly shaping their capital structure by reducing agency conflicts (
EmadEldeen et al., 2021;
Erhard et al., 2003;
Gu et al., 2023;
Hillman, 2015).
Some studies show that the presence of foreign directors on a company’s board has a negative impact on capital structure (
Fitriyani & Kristanti, 2023). The cultural differences caused by nationality, even with mixed board members, can lead to agency problems—that is, conflict of interest problems—between managers and shareholders in a negative way, resulting in higher agency costs, as well as the decision-making process being tougher. Such a scenario could lead to firms leveraging up that further degrades the quality of the capital structure (
Jensen & Meckling, 2019;
Kumar et al., 2017;
Yousef et al., 2020). Based on the previous results, the following hypothesis can be derived:
H4: Nationality diversity has a positive significant effect on the capital structure.
Age Diversity
Some studies show that there is a negative link between the age of board members and the debt ratio of the firm. More traditional board members typically have a lower risk appetite and thus prefer conservative capital structures with relatively low debt levels while prioritizing stability over high risk (
Orens & Reheul, 2013;
Serfling, 2014), which leads to smaller contraction to leverage (
McGuinness, 2021). However, younger members of the board are more familiar with new methods and innovation, which can increase social responsibility and firm performance (
Bussoli et al., 2023;
Cheng et al., 2010;
EmadEldeen et al., 2021). A possible reason is that younger boards may favor debt financing because of their openness to risk (
McGuinness, 2021).
Another strand of the research suggests the positive link, as the age diversity makes the board create more balanced decisions, which will be translated into their capital structure decision (
Thabhiranrak & Jermsittiparsert, 2019). The diversity will bring in some conserved and novel thoughts that can, at large, positively affect the firm’s financial decisions and performance. Based on the previous results, the following hypothesis can be derived:
H5: Board age diversity has a significant positive relationship with capital structure.
Education Diversity
Some studies argue there is a positive link between educational heterogeneity and firm performance by stimulating discussion about corporate strategies, enhancing the students’ variety of strategic choices, and increasing the quality of each alternative. This results in higher team innovation (
Basuony et al., 2023b;
Harjoto et al., 2019), which may lead to better capital structure decisions (
Syariati & Kadir, 2019).
In contrast, some researchers discovered that the more varied the education of the members of a firm, the worse its performance (
EmadEldeen et al., 2021;
Kagzi & Guha, 2018). The differing levels of education might signal a concern to investors, predicting fights and possibly affecting the value of the firm. Therefore, a higher value of education diversity on boards might be associated with an adverse effect, which may lead shareholders to value such boards negatively (
Kagzi & Guha, 2018), which could influence capital structure decisions negatively (
Hatane et al., 2020).
Based on the previous results, the following hypothesis can be derived:
H6: Board education diversity is positively and significantly associated with capital structure.
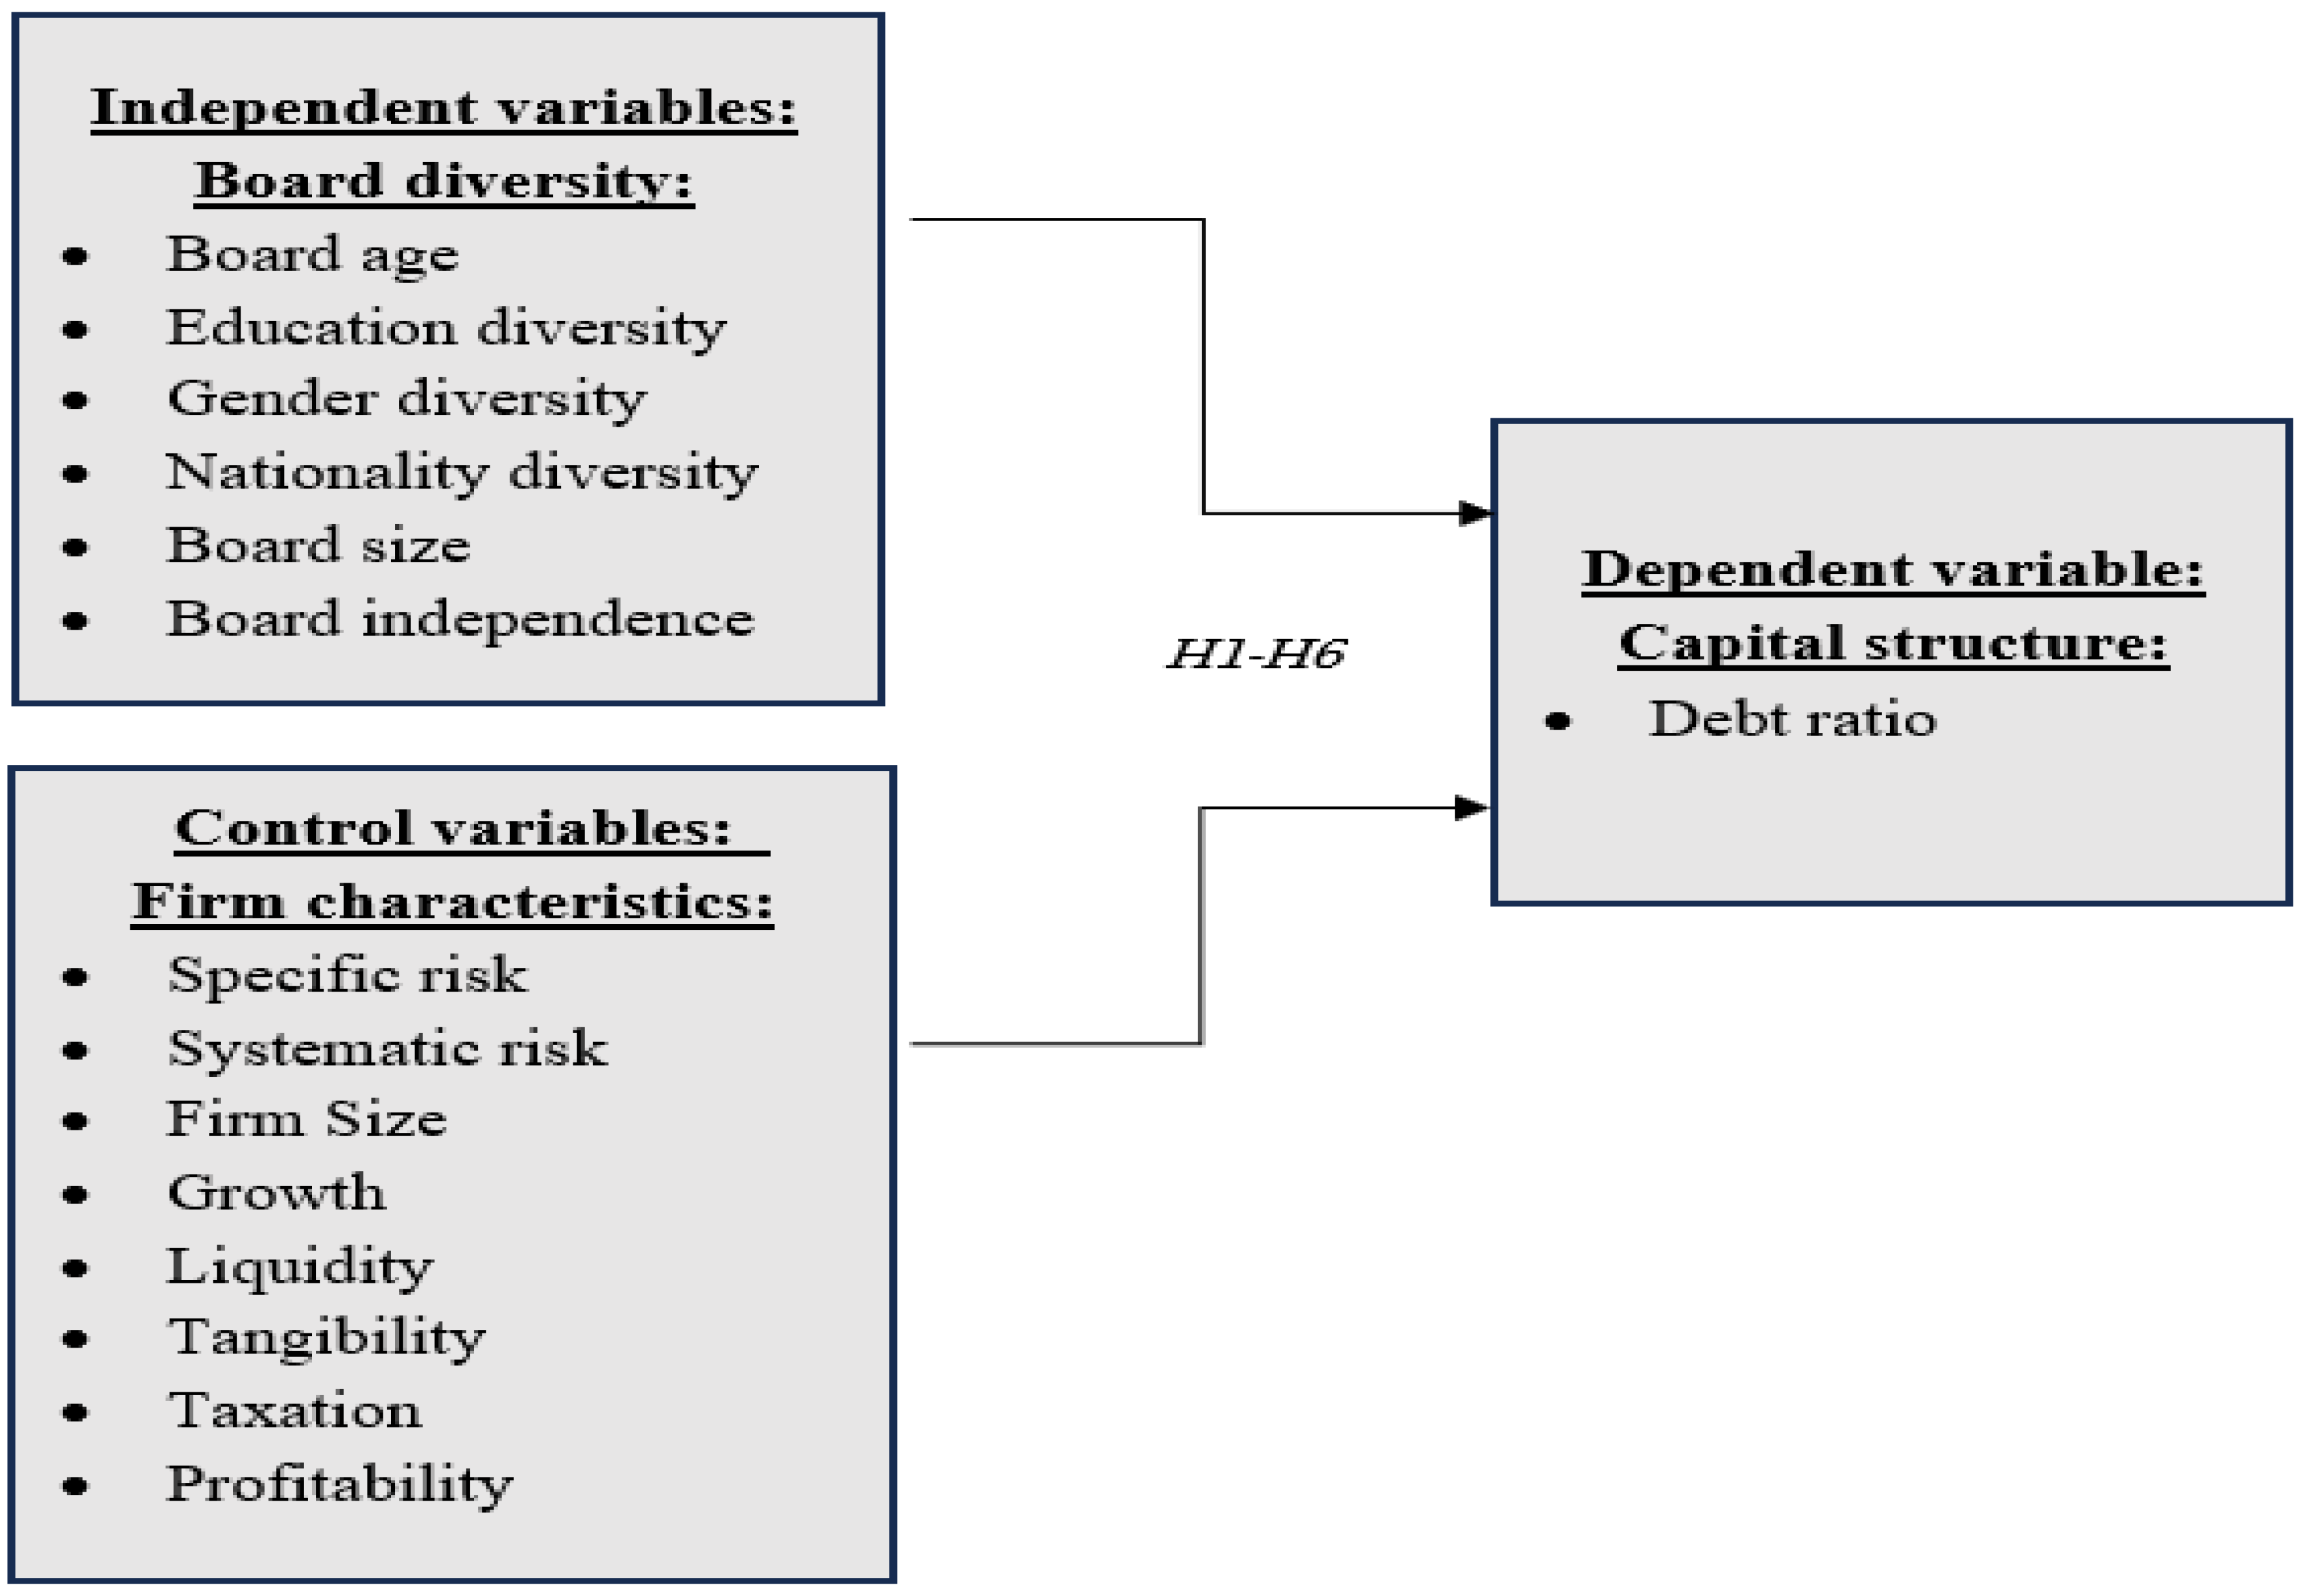
Based on the previous discussions, the conceptual framework of this study can be as follows in
Figure 1:
3. Research Methodology
3.1. Samples and Population
This study aims to examine the impact of board diversity on the capital structure of firms listed on the LSE. The analysis focuses on 1814 non-financial UK-listed firms, excluding financial institutions, yielding a total of 36,280 observations.
3.2. Data Collection
BoardEx provides data on board diversity, while ORBIS and DataStream are the sources for firm-specific determinants and capital structure variables. All variables have data covering a 20-year period, from 2002 to 2021.
3.3. Variable Measurement
Table 1 provides an overview of the measured variables in this study. Panel (A) encompasses independent variables, including board diversity and other firm-specific determinants. Panel (B) shows that the debt ratio is the dependent variable.
3.4. The Model
Our model focuses on how the relationship between the dependent variable (Debt ratio) and the explanatory variables changes over time. Specifically, we propose a transition regime regression model, where the impact of the explanatory variables on the debt ratio depends on the state of the financial market in the previous period.
The model can be expressed as follows:
where
: The debt ratio for entity i at time t.
: jth explanatory variable for entity i at time t − 1.
: Global constant vector capturing the response of the debt ratio to the explanatory variables in good and bad regimes, respectively.
: Cross-sectional fixed effect for entity i.
: Entity-specific error term.
: Dummy variable indicating the state of the financial market in the previous period (1 for good, 0 for bad).
To avoid any possible endogeneity in the explanatory variables, we used their lagged values (time t − 1 instead of time t realizations).
In essence, our model allows for a dynamic relationship between the debt ratio and the explanatory variables, where the nature of this relationship shifts based on the prevailing financial market conditions that can be depicted as follows:
where
is the unexpected shock to the market returns that captures the effect of the unexpected news arrivals to the market. This news can be bad (
) or good (
). That is,
if the market is hit by bad news or
if the news is good.
The shock
is estimated using the best ARMA model for the market returns. The model has the following form:
where
is the market return at time
t,
,
and
are constants, and
is the unexpected shock to the return of the market.
Once the parameters are estimated, the unexpected shock at time
t − 1 can be computed recursively as follows:
where
,
and
are the estimated values of the parameters, and
is the estimated shock at time
t − 1.
Systematic risk is measured by realized volatility. Realized volatility is computed as the sum of squared returns of daily stock returns over a year and then takes the square root to obtain the realized volatility.
Realized volatility is computed as follows:
where
n is the number of days in the year
t. Similarly, specific risk is measured by
where
is as defined in Equation (4)
It is worth mentioning that our model in Equation (1) nests the usual cross-section fixed effect model in Equation (2) (One regime model). To see this, just set
to obtain the following:
Therefore, when the effect of the explanatory variables on the dependent variable does not depend on the state of the market, then the model reduces to the usual panel cross-section fixed effect model.
From Equation (1), one can notice that there exist four possibilities regarding the effect of on . The effect can be positive and negative in both regimes of the market when both and have the same sign. The other two scenarios come from the fact that one of the two parameters or is negative, and the other is positive. This means that any given explanatory variable can have an effect in the same direction regardless of the prevailing regime in the market or can exhibit an opposite direction effect in different regimes. In addition, even if the explanatory variable has the same direction effect on the dependent variable, the size of the response may be different across the two regimes (bad and good) since one of the sensitivity parameters can be greater than the other .
We fitted an autoregressive moving average model to market returns (FTSE index). In the case of two regimes, we define a bad regime as a negative shock to market return (negative residual) and a good regime as a positive shock. In the case of three regimes, we computed the lower 5% quantile and the top 95% quantile. That is, we defined the extremely bad regime as the situation where the unexpected shock to the return of the market is below the 5% quantile, and the extremely good regime as when the unexpected shock to the return of the market is higher than the 5% quantile.
4. Data Analysis
4.1. Descriptive Analysis
The descriptive statistics in
Table 2 show that the average age of board members is 57 years. Also, on average, directors typically hold two educational degrees, women make up 11% of board members, while 30% are foreign directors. Additionally, 78% of board members are independent, and the average board size is 11. The mean debt-to-asset ratio is −0.737. A negative debt ratio can result from negative total assets, asset write-downs, impairments, or accumulated losses leading to liquidation, often indicating financial distress or insolvency.
4.2. Correlation Analysis
Table in
Appendix A displays the correlation between the independent and dependent variables, as well as the correlations among the independent variables. A correlation that is greater than 0.80 can be a sign of multicollinearity. The table shows that there is no indication that multicollinearity among the independent variables exists; correlations range between −0.45 (between sysRisk and specRisk) and very close to zero (it reaches as low as 0.00 for several independent variable pairings).
4.3. Stationarity Test for the Variables
The variables average age, education, gender, nationality, board size, and board independence are by nature stationary as they represent proportions and cardinal numbers. For other variables, we run the Levin-Lin-Chu test (ADF test (
Levin et al., 2002)). The results are shown in
Table 3. The test strongly rejects the null hypothesis of the presence of a unit root (all the variables are stationary). Since all the variables are stationary, there is no possibility of spurious regression.
4.4. Multivariate Analysis:
4.4.1. Pooled and Fixed Effect Models
Table 4 shows the Hausman test, in which the
p-value is (0.000), thus, we reject the null hypothesis that the random effects model is appropriate. Therefore, the fixed effects model should be preferred over the random effects model.
Table 5 presents the pooled and fixed effect models for capital structure in UK-listed firms. The fixed effect model shows that educational diversity significantly reduces the debt ratio, suggesting lower leverage. Nevertheless, gender diversity has a significant positive effect, implying that greater female representation on the board increases leverage. Moreover, board size and independence have a positive impact, indicating that larger and more independent boards are associated with higher leverage. However, age and nationality diversity have no significant impact on the debt ratio.
4.4.2. State of the Market Effect (Two-Regime Regression)
In
Table 6, we report fixed effects analysis results for UK-listed firms under both good and bad market regimes. Determinants were equally significant across conditions. In both regimes, the debt ratio was significantly negatively influenced by board education but positively affected by gender diversity and board independence. Board size positively affects the debt ratio in the good regime but has no significant effect in the bad regime. Age and nationality diversity have no significant effect in either regime.
4.4.3. State of the Market Effect (Three-Regime Regression)
Table 7 presents a fixed effects analysis of UK-listed firms across three market regimes: extremely good, moderate, and extremely bad. Age diversity has a negative effect on the debt ratio only in extremely bad markets, as younger directors tend to prefer debt over equity. However, it has no significant impact on the debt ratio in moderate or extremely good markets, indicating that age diversity does not influence capital structure decisions in these conditions. Moreover, regime independence and educational diversity consistently exert a negative impact on capital structure, regardless of market conditions.
Furthermore, in extreme market conditions, gender diversity and board independence do not affect capital structure but have a positive impact when markets are moderate (stable). Additionally, board size has a positive effect on capital structure in the moderate and extremely good markets but has no significant impact in the extremely bad market. Lastly, nationality diversity has no significant effect on the capital structure in all regimes.
4.5. Generalized Method of Moments Estimator Results
The GMM (Generalized Method of Moments) estimator is conducted in
Table 8 to address potential endogeneity issues in the model, ensuring that the estimators remain consistent. A well-specified GMM model confirms that endogeneity concerns are effectively controlled, strengthening the reliability of the estimated relationships between variables.
5. Discussion
The outcomes align with the conclusions covered in the literature review. Regarding board diversity and its impact on capital structure, also, the result is consistent with
Thabhiranrak and Jermsittiparsert (
2019), who highlight how board characteristics can influence capital structure decisions differently.
The findings show that the impact of educational diversity on capital structure is consistently negative and regime-independent (not sensitive to market conditions). Investors may perceive a threat and negative value from diverse education levels, anticipating conflicts and a potential impact on company value (
Kagzi & Guha, 2018), which could influence capital structure decisions negatively (
Hatane et al., 2020). The result is inconsistent with
Emoni et al. (
2017), who found that education diversity positively affects the capital structure using a sample of listed firms on the Nairobi Stock Exchange.
Moreover, gender diversity positively influences capital structure in most market conditions, except for extreme states (both bad and good). Female directors, known for their timeliness and active participation in monitoring committees, contribute to improved corporate performance. This finding aligns with
Amin et al. (
2022) and
Yakubu and Oumarou (
2023). Additionally, while women are not always risk-averse, their role in shaping a company’s funding choices can be understood within this context (
Dwyer et al., 2003). According to the mass theory, having at least three women on the board significantly impacts corporate decisions, particularly regarding debt financing. This challenges the notion of a glass ceiling and supports the findings of
Babalos et al. (
2015), suggesting that women are willing to take risks and utilize debt financing when they foresee growth opportunities for their firms. These insights are consistent with
Sun et al. (
2022). Furthermore, the results contradict the pecking order theory, as boards with greater female representation may prefer internal funds.
In the same vein, board independence positively influences capital structure in all but extreme market conditions (both bad and good). According to the agency theory, independent directors are more likely to favor debt financing (
Chowdhury et al., 2024;
Tarus & Ayabei, 2016) as it aligns with shareholders’ interests, reduces managerial influence (
Maug, 1997), and limits free cash flow available to management (
Jensen, 1986).
Thus, gender diversity and board independence positively influence the capital structure decisions primarily when markets are stable (not in extremes), allowing firms the flexibility to make strategic financing choices. However, in extremely good markets, companies generate strong profitability and internal cash flows, reducing their reliance on debt and making gender diversity and board independence less relevant in shaping capital structure decisions. Similarly, in extremely bad markets, firms focus on financial survival, relying on emergency financing or distressed borrowing, which diminishes the influence of governance mechanisms.
In contrast, age diversity has a negative significant impact on capital structure only in extremely bad markets. During downturns, older board members typically have a lower risk appetite and prefer conservative capital structures with low debt levels, prioritizing stability (
Orens & Reheul, 2013;
Serfling, 2014). This results in a smaller reduction in leverage (
McGuinness, 2021). However, younger board members, being more familiar with innovation, may enhance social responsibility and firm performance (
Bussoli et al., 2023;
Cheng et al., 2010;
EmadEldeen et al., 2021). A possible reason is that younger boards may favor debt financing due to their greater risk tolerance (
McGuinness, 2021).
Nationality diversity has no significant effect on capital structure and remains regime-independent, meaning it is not sensitive to market conditions across different economic environments. Therefore, the presence of foreign directors does not influence a firm’s capital structure, regardless of market states. A possible justification is that while foreign directors may bring diverse perspectives and governance practices, capital structure decisions are often driven by firm-specific financial policies, regulatory constraints, and industry dynamics rather than the existence of foreign directors. Additionally, firms may adhere to standardized financing strategies that limit the discretionary impact of foreign directors, reinforcing the neutrality of nationality diversity in shaping capital structure.
However, board size positively affects capital structure only in the moderate, good, and extremely good market conditions. Prior research suggests that a larger board may lead to higher leverage (
Chowdhury et al., 2024;
Puntaier et al., 2022;
Queiri et al., 2024), as firms seek expansion opportunities requiring external financing. It also improves access to financing and risk management expertise, helping firms secure debt more effectively in good and extremely good market conditions.
6. Conclusions
The aim of this study is to examine how board diversity influences capital structure decisions in UK-listed firms on the London Stock Exchange (LSE) under varying market conditions from 2002 to 2021. Data were collected from BoardEx, ORBIS, and DataStream databases to achieve this goal. The dependent variable is the capital structure, and the independent variable is board diversity. The study tested the impact of board diversity on capital structure using a fixed-effect model and linear regression. Additionally, to demonstrate the impact of board diversity on the capital structure in various market conditions, the study employed a fixed-effect analysis utilizing a two-regime model and a three-regime regression model.
The findings indicate that the impact of educational diversity on capital structure is consistently negative and regime-independent, meaning it is not sensitive to market conditions. Additionally, nationality diversity is also regime-independent but has no significant effect on capital structure across all market states. Moreover, gender diversity and board independence contribute to improved capital structure in all market states, except under extreme conditions (both extremely bad and extremely good market states). In contrast, age diversity has a negative and economically significant impact on capital structure only in extremely bad markets, with no significant effect in other states. Furthermore, board size positively influences capital structure in moderate, good, and extremely good market states.
In conclusion, the results highlight different impacts of board diversity on capital structure. Some factors, such as educational diversity and nationality diversity, remain stable across regimes, while others, including age diversity, gender diversity, board independence, and board size, are regime-dependent. These results align with pecking order, trade-off, and agency theories, emphasizing the need to balance debt and equity; see
Appendix B.
This study makes two key contributions. First, it examines the impact of board diversity—including nationality, gender, age, and education—on capital structure. Second, it uniquely employs transition regime regression models to analyze how board diversity influences capital structure across different market conditions, categorizing them into extremely good, moderate, and extremely bad market states.
The practical implications of this study highlight the importance of aligning board diversity with market conditions to optimize capital structure decisions. Firms should enhance gender diversity and board independence, as these factors support better debt financing in all market conditions except during extreme downturns or booms. Additionally, companies should regularly assess and adjust their board composition to respond to financial market fluctuations, ensuring resilience in volatile environments. In stable markets, firms should prioritize improving gender diversity and independence. However, in extreme market conditions, firms should carefully consider age diversity and board size, as they significantly influence capital structure decisions. Firms should balance age diversity with experience to enhance decision-making in financial distress, as high age diversity may slow responses in crises in extremely bad market states. Meanwhile, larger boards improve capital structure in moderate, good, and extremely good markets by providing expertise and oversight, but excessive size may reduce efficiency. Optimizing board composition can strengthen governance and financial flexibility across market conditions. Also, educational diversity may complicate capital structure decisions, requiring strong financial expertise and clear frameworks to enhance decision-making efficiency. Policymakers and corporate leaders can use these insights to develop governance strategies that enhance financial stability, particularly by fostering diverse boards that contribute to more balanced decision-making in varying economic conditions.
This study has some limitations, primarily its focus on UK-listed firms. Additionally, while it examines board diversity dimensions—gender, nationality, age, and education—it does not account for other corporate governance mechanisms, such as ownership structure or managerial incentives, which may also influence capital structure decisions. Moreover, although the transition regime regression model captures financial market fluctuations, external factors like macroeconomic policies and industry-specific dynamics are not explicitly considered. Future research could extend the analysis to different regions, incorporate additional governance factors, and explore broader economic influences for a more comprehensive understanding.
Author Contributions
Conceptualization, M.B. and H.E.; methodology, M.B., H.E. and N.K.; software, M.B. and H.E.; validation, M.A.K.B., R.E. and N.K.; formal analysis, M.A.K.B., R.E. and H.E.; investigation, M.B. and M.A.K.B.; resources, R.E. and H.E.; data curation, R.E. and H.E.; writing—original draft preparation, M.B., R.E. and H.E.; writing—review and editing, M.A.K.B., R.E. and N.K.; visualization, R.E, H.E. and N.K.; supervision, M.B. and M.A.K.B.; project administration, M.A.K.B. and R.E.; funding acquisition, M.A.K.B. All authors have read and agreed to the published version of the manuscript.
Funding
American University in Cairo.
Institutional Review Board Statement
Not applicable.
Informed Consent Statement
Not applicable.
Data Availability Statement
The data used in our research were obtained from third-party sources—specifically, AUC and GUC—under institutional agreements that restrict direct sharing of the data. As per the third-party data statement, while we do not have permission to share the data ourselves, interested researchers may seek access through these institutions, subject to their respective policies and licensing agreements.
Acknowledgments
The authors would like to express their gratitude to the American University in Cairo (AUC) for funding this research. Additionally, we acknowledge the resources and facilities provided by the American University in Cairo (AUC) and the German University in Cairo (GUC) that made this work possible.
Conflicts of Interest
The authors declare no conflicts of interest.
Abbreviations
The following abbreviations are used in this manuscript:
| UK | United Kingdom |
| CEO | Chief Executive Officer |
| OLS | Ordinary Least Squares |
| LSE | London Stock Exchange |
Appendix A
Table A1.
Correlation analysis table.
Table A1.
Correlation analysis table.
| | BrdAge | BrdEd | FemBrd | NatBrd | BS | BrdInd | specRisk | sysRisk | FrmSiz | GRW | Liq | Tang | TX | ROA |
|---|
| BrdAge | 1.000 | | | | | | | | | | | | | |
| BrdEd | 0.157 *** | 1.000 | | | | | | | | | | | | |
| FemBrd | 0.009 | 0.028 *** | 1.000 | | | | | | | | | | | |
| NatBrd | −0.066 *** | 0.111 *** | 0.091 *** | 1.000 | | | | | | | | | | |
| BS | 0.004 | 0.017 ** | 0.061 *** | 0.166 *** | 1.000 | | | | | | | | | |
| BrdInd | 0.238 *** | 0.289 *** | 0.032 *** | −0.114 *** | 0.161 *** | 1.0000 | | | | | | | | |
| specRisk | −0.072 *** | −0.014 * | −0.054 *** | −0.017 ** | −0.104 *** | −0.023 *** | 1.000 | | | | | | | |
| sysRisk | −0.035 *** | −0.007 | −0.074 *** | −0.017 ** | 0.011 | −0.023 *** | 0.457 *** | 1.000 | | | | | | |
| FrmSiz | 0.312 *** | 0.259 *** | 0.120 *** | 0.121 *** | 0.432 *** | 0.370 *** | −0.142 *** | −0.014 * | 1.000 | | | | | |
| GRW | 0.004 | 0.005 | 0.001 | 0.009 | 0.0003 | 0.002 | −0.012 * | −0.017 ** | 0.002 | 1.000 | | | | |
| Liq | 0.038 *** | 0.048 *** | −0.062 *** | −0.087 *** | −0.159 *** | −0.010 | 0.108 *** | −0.014 * | −0.179 *** | 0.004 | 1.000 | | | |
| Tang | 0.137 *** | 0.162 *** | 0.058 *** | 0.075 *** | 0.131 *** | 0.194 *** | −0.071 *** | 0.005 | 0.369 *** | −0.009 | −0.370 *** | 1.000 | | |
| TX | −0.009 | 0.003 | 0.014 * | 0.015 ** | 0.002 | 0.001 | 0.001 | −0.006 | 0.004 | −0.0002 | −0.004 | −0.002 | 1.000 | |
| ROA | 0.009 | −0.061 *** | 0.011 | 0.009 | −0.056 *** | −0.113 *** | −0.287 *** | −0.066 *** | −0.099 *** | 0.017 ** | 0.027 *** | −0.110 *** | −0.006 | 1.000 |
Appendix B
Table A2.
Summary of the result of the regime switching models.
Table A2.
Summary of the result of the regime switching models.
| Variable | Extremely Bad | Bad Regime | Moderate | Good Regime | Extremely Good |
|---|
| BrdAge | −ve, significant | Not significant | Not significant | Not significant | Not significant |
| BrdEd | −ve, significant | −ve, significant | −ve, significant | −ve, significant | −ve, significant |
| FemBrd | Not significant | +ve, significant | +ve, significant | +ve, significant | Not significant |
| NatBrd | Not significant | Not significant | Not significant | Not significant | Not significant |
| BS | Not significant | Not significant | +ve, significant | +ve, significant | +ve, significant |
| BrdInd | Not significant | +ve, significant | +ve, significant | +ve, significant | Not significant |
| specRisk | +ve, significant | +ve, significant | +ve, significant | +ve, significant | +ve, significant |
| sysRisk | +ve, significant | −ve, significant | −ve, significant | −ve, significant | +ve, significant |
| FrmSiz | +ve, significant | +ve, significant | +ve, significant | +ve, significant | +ve, significant |
| GRW | Not significant | Not significant | Not significant | Not significant | Not significant |
| Liq | −ve, significant | Not significant | Not significant | Not significant | Not significant |
| Tang | +ve, significant | +ve, significant | +ve, significant | +ve, significant | +ve, significant |
| TX | Not significant | −ve, significant | −ve, significant | Not significant | Not significant |
| ROA | −ve, significant | −ve, significant | −ve, significant | −ve, significant | −ve, significant |
References
- Abiad, Z., Abraham, R., El-Chaarani, H., & Binsaddig, R. O. (2025). The impact of board of directors’ characteristics on the financial performance of the banking sector in gulf cooperation council (GCC) countries: The moderating role of bank size. Journal of Risk and Financial Management, 18(1), 40. [Google Scholar] [CrossRef]
- Adams, R. B., & Ferreira, D. (2008). Women in the boardroom and their impact on governance and performance. Journal of Financial Economics, 94(2), 291–309. [Google Scholar] [CrossRef]
- Afify, H. A. E. (2009). Determinants of audit report lag: Does implementing corporate governance have any impact? Empirical evidence from Egypt. Journal of Applied Accounting Research, 10(1), 56–86. [Google Scholar] [CrossRef]
- Ahmed, A. M., Nugraha, D. P., & Hágen, I. (2023). The relationship between capital structure and firm performance: The moderating role of agency cost. Risks, 11(6), 102. [Google Scholar] [CrossRef]
- Alam, M. S., Atif, M., Cumming, D., & Islam, M. S. (2024). The impact of board gender composition on loan covenant violations. Corporate Governance: An International Review, 32(4), 703–731. [Google Scholar] [CrossRef]
- Alves, P., Couto, E. B., & Francisco, P. M. (2015). Board of directors’ composition and capital structure. Research in International Business and Finance 35, 1–32. [Google Scholar] [CrossRef]
- Amin, A., ur Rehman, R., Ali, R., & Mohd Said, R. (2022). Corporate governance and capital structure: Moderating effect of gender diversity. Sage Open, 12(1). [Google Scholar] [CrossRef]
- Appah, E., & Emeh, Y. (2013). Corporate governance structure and timeliness of financial reports of quoted firms in Nigeria. European Journal of Business and Management, 5(32), 34–45. [Google Scholar]
- Ararat, M., Aksu, M., & Tansel Cetin, A. (2015). How board diversity affects firm performance in emerging markets: Evidence on channels in controlled firms. Corporate Governance: An International Review, 23(2), 83–103. [Google Scholar] [CrossRef]
- Armstrong, C. S., Guay, W. R., & Weber, J. P. (2010). The role of information and financial reporting in corporate governance and debt contracting. Journal of Accounting and Economics, 50(2–3), 179–234. [Google Scholar] [CrossRef]
- Awad, A. B., Gharios, R., Abu Khalaf, B., & Seissian, L. A. (2024). Board characteristics and bank stock performance: Empirical evidence from the MENA region. Risks, 12(5), 81. [Google Scholar] [CrossRef]
- Babalos, V., Stavroyiannis, S., & Gupta, R. (2015). Do commodity investors herd? Evidence from a time-varying stochastic volatility model. Resources Policy, 46, 281–287. [Google Scholar] [CrossRef]
- Basuony, M. A. K., Bouaddi, M., EmadEldeen, R., & Noureldin, N. (2023a). The effect of gender board diversity across market quotation on firm performance: Evidence from the UK. Corporate Ownership and Control, 20(2), 146–155. [Google Scholar] [CrossRef]
- Basuony, M. A. K., & Mohamed, E. K. A. (2014). Board composition, ownership concentration, and voluntary internet disclosure by MSM-listed companies. Corporate Board: Role, Duties and Composition, 10(1), 60–70. [Google Scholar] [CrossRef]
- Basuony, M. A. K., Zaher, A. A., Bouaddi, M., & Noureldin, N. (2023b). Sustainability, corporate governance, and firm performance: Evidence from emerging markets. Corporate Ownership and Control, 20(3), 268–276. [Google Scholar] [CrossRef]
- Bear, S., Rahman, N., & Post, C. (2010). The impact of board diversity and gender composition on corporate social responsibility and firm reputation. Journal of Business Ethics, 97(2), 207–221. [Google Scholar] [CrossRef]
- Ben Saad, S., & Belkacem, L. (2022). Does board gender diversity affect capital structure decisions? Corporate Governance: The International Journal of Business in Society, 22(5), 922–946. [Google Scholar] [CrossRef]
- Bouaddi, M., Basuony, M. A. K., & Noureldin, N. (2023). The Heterogenous effects of carbon emissions and board gender diversity on a firm’s performance. Sustainability, 15(19), 14642. [Google Scholar] [CrossRef]
- Bussoli, C., Conte, D., & Barone, M. (2023). Board diversity as a determinant of the social performance in the European banking sector. Equality, Diversity and Inclusion, 42(2), 248–265. [Google Scholar] [CrossRef]
- Byron, K., & Post, C. (2016). Women on boards of directors and corporate social performance: A meta-analysis. Corporate Governance: An International Review, 24(4), 428–442. [Google Scholar] [CrossRef]
- Carter, D. A., Simkins, B. J., & Simpson, W. G. (2003). Corporate governance, board diversity, and firm value. Financial Review, 38(1), 33–53. [Google Scholar] [CrossRef]
- Cheng, L. T. W., Chan, R. Y. K., & Leung, T. Y. (2010). Management demography and corporate performance: Evidence from China. International Business Review, 19(3), 261–275. [Google Scholar] [CrossRef]
- Chowdhury, S. P., Ahmed, R., Debnath, N. C., Ali, N., & Bhowmik, R. (2024). Corporate governance and capital structure decisions: Moderating role of inside ownership. Risks, 12(9), 144. [Google Scholar] [CrossRef]
- Denhere, V. (2024). Does board gender diversity influence SDGs disclosure? Insight from top 15 JSE-listed mining companies. Journal of Risk and Financial Management, 17(10), 429. [Google Scholar] [CrossRef]
- Dwyer, S., Richard, O. C., & Chadwick, K. (2003). Gender diversity in management and firm performance: The influence of growth orientation and organizational culture. Journal of Business Research, 56(12), 1009–1019. [Google Scholar] [CrossRef]
- Elmoursy, H. M. (2020). The effect of board diversity on capital structure: An empirical study from the UK [Master’s Thesis, The American University in Cairo]. [Google Scholar]
- EmadEldeen, R., Elbayoumi, A. F., Basuony, M. A. K., & Mohamed, E. K. A. (2021). The effect of the board diversity on firm performance: An empirical study on the UK. Corporate Ownership and Control, 18(3), 337–347. [Google Scholar] [CrossRef]
- EmadEldeen, R., Elbayuomi, A. F., Elmoursy, H., Bouaddi, M., & Basuony, M. A. K. (2025). Does board diversity drive sustainability? Evidence from UK-listed companies. Sustainability, 17(3), 1177. [Google Scholar] [CrossRef]
- Emoni, E. L., Muturi, W., & Wandera, R. W. (2017). Effect of board diversity on capital structure among listed firms in Nairobi Stock Exchange, Kenya. International Journal of Management and Commerce Innovations, 4(2), 141–150. [Google Scholar]
- Erhard, N. L., Werbel, J. D., & Shrader, C. B. (2003). Board of director diversity and firm financial performance. Corporate Governance: An International Review, 11(2), 102–111. [Google Scholar] [CrossRef]
- Ezeani, E., Kwabi, F., Salem, R., Usman, M., Alqatamin, R. M. H., & Kostov, P. (2023). Corporate board and dynamics of capital structure: Evidence from UK, France and Germany. International Journal of Finance and Economics, 28(3), 3281–3298. [Google Scholar] [CrossRef]
- Fama, E. F., & Jensen, M. C. (1983). Agency problems and residual claims. The Journal of Law and Economics, 26(2), 327–349. [Google Scholar] [CrossRef]
- Fitriyani, H., & Kristanti, F. T. (2023). Corporate governance and capital structure: Evidence from Indonesian banking. IEOM Society International. [Google Scholar] [CrossRef]
- Gu, Y., Huang, H. Y., Ho, K. C., & Liu, S. (2023). The effects of executives with foreign experience on capital structure adjustments toward targets: Evidence from China. Economic Research-Ekonomska Istrazivanja, 36(1), 1470–1489. [Google Scholar] [CrossRef]
- Gul, F. A., Srinidhi, B., & Ng, A. C. (2011). Does board gender diversity improve the informativeness of stock prices? Journal of Accounting and Economics, 51(3), 314–338. [Google Scholar] [CrossRef]
- Hall, G. C., Hutchinson, P. J., & Michaelas, N. (2004). Determinants of the capital structures of European SMEs. Journal of Business Finance and Accounting, 31(5–6), 711–728. [Google Scholar] [CrossRef]
- Harjoto, M. A., Laksmana, I., & Yang, Y. w. (2019). Board nationality and educational background diversity and corporate social performance. Corporate Governance (Bingley), 19(2), 217–239. [Google Scholar] [CrossRef]
- Hatane, S. E., Wiyono, F., & Tarigan, J. (2020). Capital structure and board characteristics in firm performances of Indonesian LQ45 companies. The Indonesian Journal of Accounting Research, 23(02), 213–240. [Google Scholar] [CrossRef]
- Hillman, A. J. (2015). Board diversity: Beginning to unpeel the onion. Corporate Governance: An International Review, 23(2), 104–107. [Google Scholar] [CrossRef]
- Huberts, N. F. D., Wen, X., Dawid, H., Huisman, K. J. M., & Kort, P. M. (2024). Double marginalization because of external financing: Capacity investment under uncertainty. Management Science. [Google Scholar] [CrossRef]
- Ibrahim, A. H., & Hanefah, M. M. (2016). Board diversity and corporate social responsibility in Jordan. Journal of Financial Reporting and Accounting, 14(2), 279–298. [Google Scholar] [CrossRef]
- Jensen, M. C. (1986). Agency costs of free cash flow, corporate finance, and takeovers agency costs of free cash flow, corporate finance, and takeovers. American Economic Review, 76(2), 323–329. [Google Scholar] [CrossRef]
- Jensen, M. C., & Meckling, W. H. (2019). Theory of the firm: Managerial behavior, agency costs and ownership structure. In Corporate governance: Values, ethics and leadership. Taylor & Francis Group. [Google Scholar] [CrossRef]
- Johnson, J. E. V., & Powell, P. L. (1994). Decision making, risk and gender: Are managers different? British Journal of Management, 5(2), 123–138. [Google Scholar] [CrossRef]
- Kagzi, M., & Guha, M. (2018). Does board demographic diversity influence firm performance? Evidence from Indian-knowledge intensive firms. Benchmarking, 25(3), 1028–1058. [Google Scholar] [CrossRef]
- Khan, M. Y., Javeed, A., Cuong, L. K., & Pham, H. (2020). Corporate governance and cost of capital: Evidence from emerging market. Risks, 8(4), 104. [Google Scholar] [CrossRef]
- Kraus, A., & Litzenberger, R. H. (1973). A state-preference model of optimal financial leverage. The Journal of Finance, 28(4), 911–922. [Google Scholar] [CrossRef]
- Kumar, S., Colombage, S., & Rao, P. (2017). Research on capital structure determinants: A review and future directions. International Journal of Managerial Finance, 13(2), 106–132. [Google Scholar] [CrossRef]
- Lee, K. W., & Thong, T. Y. (2023). Board gender diversity, firm performance and corporate financial distress risk: International evidence from tourism industry. Equality, Diversity and Inclusion, 42(4), 530–550. [Google Scholar] [CrossRef]
- Lemmon, M. L., & Zender, J. F. (2010). Debt capacity and tests of capital structure theories. Journal of Financial and Quantitative Analysis, 45(5), 1161–1187. [Google Scholar] [CrossRef]
- Levin, A., Lin, C.-F., & James Chu, C.-S. (2002). Unit root tests in panel data: Asymptotic and finite-sample properties. Journal of Econometrics, 108(1), 1–24. [Google Scholar] [CrossRef]
- Maug, E. (1997). Boards of directors and capital structure: Alternative forms of corporate restructuring. Journal of Corporate Finance, 3(2), 113–139. [Google Scholar] [CrossRef]
- McGuinness, P. B. (2021). Board member age, stock seasoning and the evolution of capital structure in Chinese firms. International Business Review, 30(3), 101769. [Google Scholar] [CrossRef]
- Myers, S. (1984). Capital structure puzzle. National Bureau of Economic Research. [Google Scholar] [CrossRef]
- Nadeem, M. (2020). Does board gender diversity influence voluntary disclosure of intellectual capital in initial public offering prospectuses? Evidence from China. Corporate Governance: An International Review, 28(2), 100–118. [Google Scholar] [CrossRef]
- Orens, R., & Reheul, A. M. (2013). Do CEO demographics explain cash holdings in SMEs? European Management Journal, 31(6), 549–563. [Google Scholar] [CrossRef]
- Potharla, S., & Amirishetty, B. (2021). Non-linear relationship of board size and board independence with firm performance—Evidence from India. Journal of Indian Business Research, 13(4), 503–532. [Google Scholar] [CrossRef]
- Puntaier, E., Zhu, T., & Hughes, P. (2022). Board diversity as strategic choice and why it should matter to SMEs. International Journal of Entrepreneurial Behaviour and Research. [Google Scholar] [CrossRef]
- Queiri, A., Madbouly, A., Dwaikat, N., & Husain, U. (2024). Corporate governance and capital structure decision: Insights from Oman. Cogent Business and Management, 11(1), 2297463. [Google Scholar] [CrossRef]
- Rehman, M., Rehman, R., & Raoof, A. (2010). Does corporate governance lead to a change in the capital structure? American Journal of Social and Management Sciences, 1(2), 191–195. [Google Scholar] [CrossRef]
- Ria, R. (2023). Determinant factors of corporate governance on company performance: Mediating role of capital structure. Sustainability, 15(3), 2309. [Google Scholar] [CrossRef]
- Rose, C. (2007). Does female board representation influence firm performance? The Danish evidence. Corporate Governance: An International Review, 15(2), 404–413. [Google Scholar] [CrossRef]
- Samaha, K., & Dahawy, K. (2010). Factors influencing corporate disclosure transparency in the active share trading firms: An explanatory study. Research in Accounting in Emerging Economies, 10, 87–118. [Google Scholar] [CrossRef]
- Serfling, M. A. (2014). CEO age and the riskiness of corporate policies. Journal of Corporate Finance, 25, 251–273. [Google Scholar] [CrossRef]
- Shahrour, M. H., Lemand, R., & Wojewodzki, M. (2024). Board diversity, female executives and stock liquidity: Evidence from opposing cycles in the USA. Review of Accounting and Finance, 23(5), 581–597. [Google Scholar] [CrossRef]
- Shakil, M. H., Tasnia, M., & Mostafiz, M. I. (2020). Board gender diversity and environmental, social and governance performance of US banks: Moderating role of environmental, social and corporate governance controversies. International Journal of Bank Marketing, 39(4), 661–677. [Google Scholar] [CrossRef]
- Sun, X., Ahmad, M., Tahir, K., & Zafar, H. (2022). Diversity in boardroom and debt financing: A case from China. Frontiers in Psychology, 13, 1006293. [Google Scholar] [CrossRef] [PubMed]
- Syariati, N. E., & Kadir, N. (2019). Board diversity, capital structure, and firm value in service companies listed in Indonesia stock exchange. Jurnal Iqtisaduna, 1(1), 235–246. [Google Scholar]
- Tarus, D. K., & Ayabei, E. (2016). Board composition and capital structure: Evidence from Kenya. Management Research Review, 39(9), 1056–1079. [Google Scholar] [CrossRef]
- Thabhiranrak, T., & Jermsittiparsert, K. (2019). Towards sustainable functioning of organization: Women empowernment and corporate management culture. Journal of Security and Sustainability Issues, 9(1), 321–332. [Google Scholar] [CrossRef]
- Vakilifard, H. R., Gerayli, M. S., Yanesari, A. M., & Ma’atoofi, A. R. (2011). Effect of corporate governance on capital structure: Case of the Iranian listed firms. European Journal of Economics, Finance and Administrative Sciences, 35, 165–172. [Google Scholar]
- Weber, A., & Zulehner, C. (2010). Female hires and the success of start-up firms. American Economic Review, 100(2), 358–361. [Google Scholar] [CrossRef]
- Wen, Y., Rwegasira, K., & Bilderbeek, J. (2002). Corporate governance and capital structure decisions of the Chinese listed firms. Corporate Governance, 10(2), 75–83. [Google Scholar] [CrossRef]
- Yakubu, I. N., & Oumarou, S. (2023). Boardroom dynamics: The power of board composition and gender diversity in shaping capital structure. Cogent Business & Management, 10(2), 2236836. [Google Scholar] [CrossRef]
- Yousef, I., Almoumani, H., & Samara, I. (2020). The impact of internationalization of the boardroom on capital structure. Journal of Risk and Financial Management, 13(12), 307. [Google Scholar] [CrossRef]
| Disclaimer/Publisher’s Note: The statements, opinions and data contained in all publications are solely those of the individual author(s) and contributor(s) and not of MDPI and/or the editor(s). MDPI and/or the editor(s) disclaim responsibility for any injury to people or property resulting from any ideas, methods, instructions or products referred to in the content. |
© 2025 by the authors. Licensee MDPI, Basel, Switzerland. This article is an open access article distributed under the terms and conditions of the Creative Commons Attribution (CC BY) license (https://creativecommons.org/licenses/by/4.0/).


 ,
, 