

Factors, Forecasts, and Simulations of Volatility in the Stock Market Using Machine Learning

Abstract
1. Introduction
2. Literature Review
3. Materials and Methods
3.1. Objectives and Research Question
- RQ:
- What has been the progress of stock market volatility analysis using machine learning (ML) in the last 20 years?
- RQ1:
- What is stock market volatility?
- RQ2:
- What are the factors that determine it?
- RQ3:
- Which ML algorithms have been applied to its forecast?
- RQ4:
- Which simulation models are available?
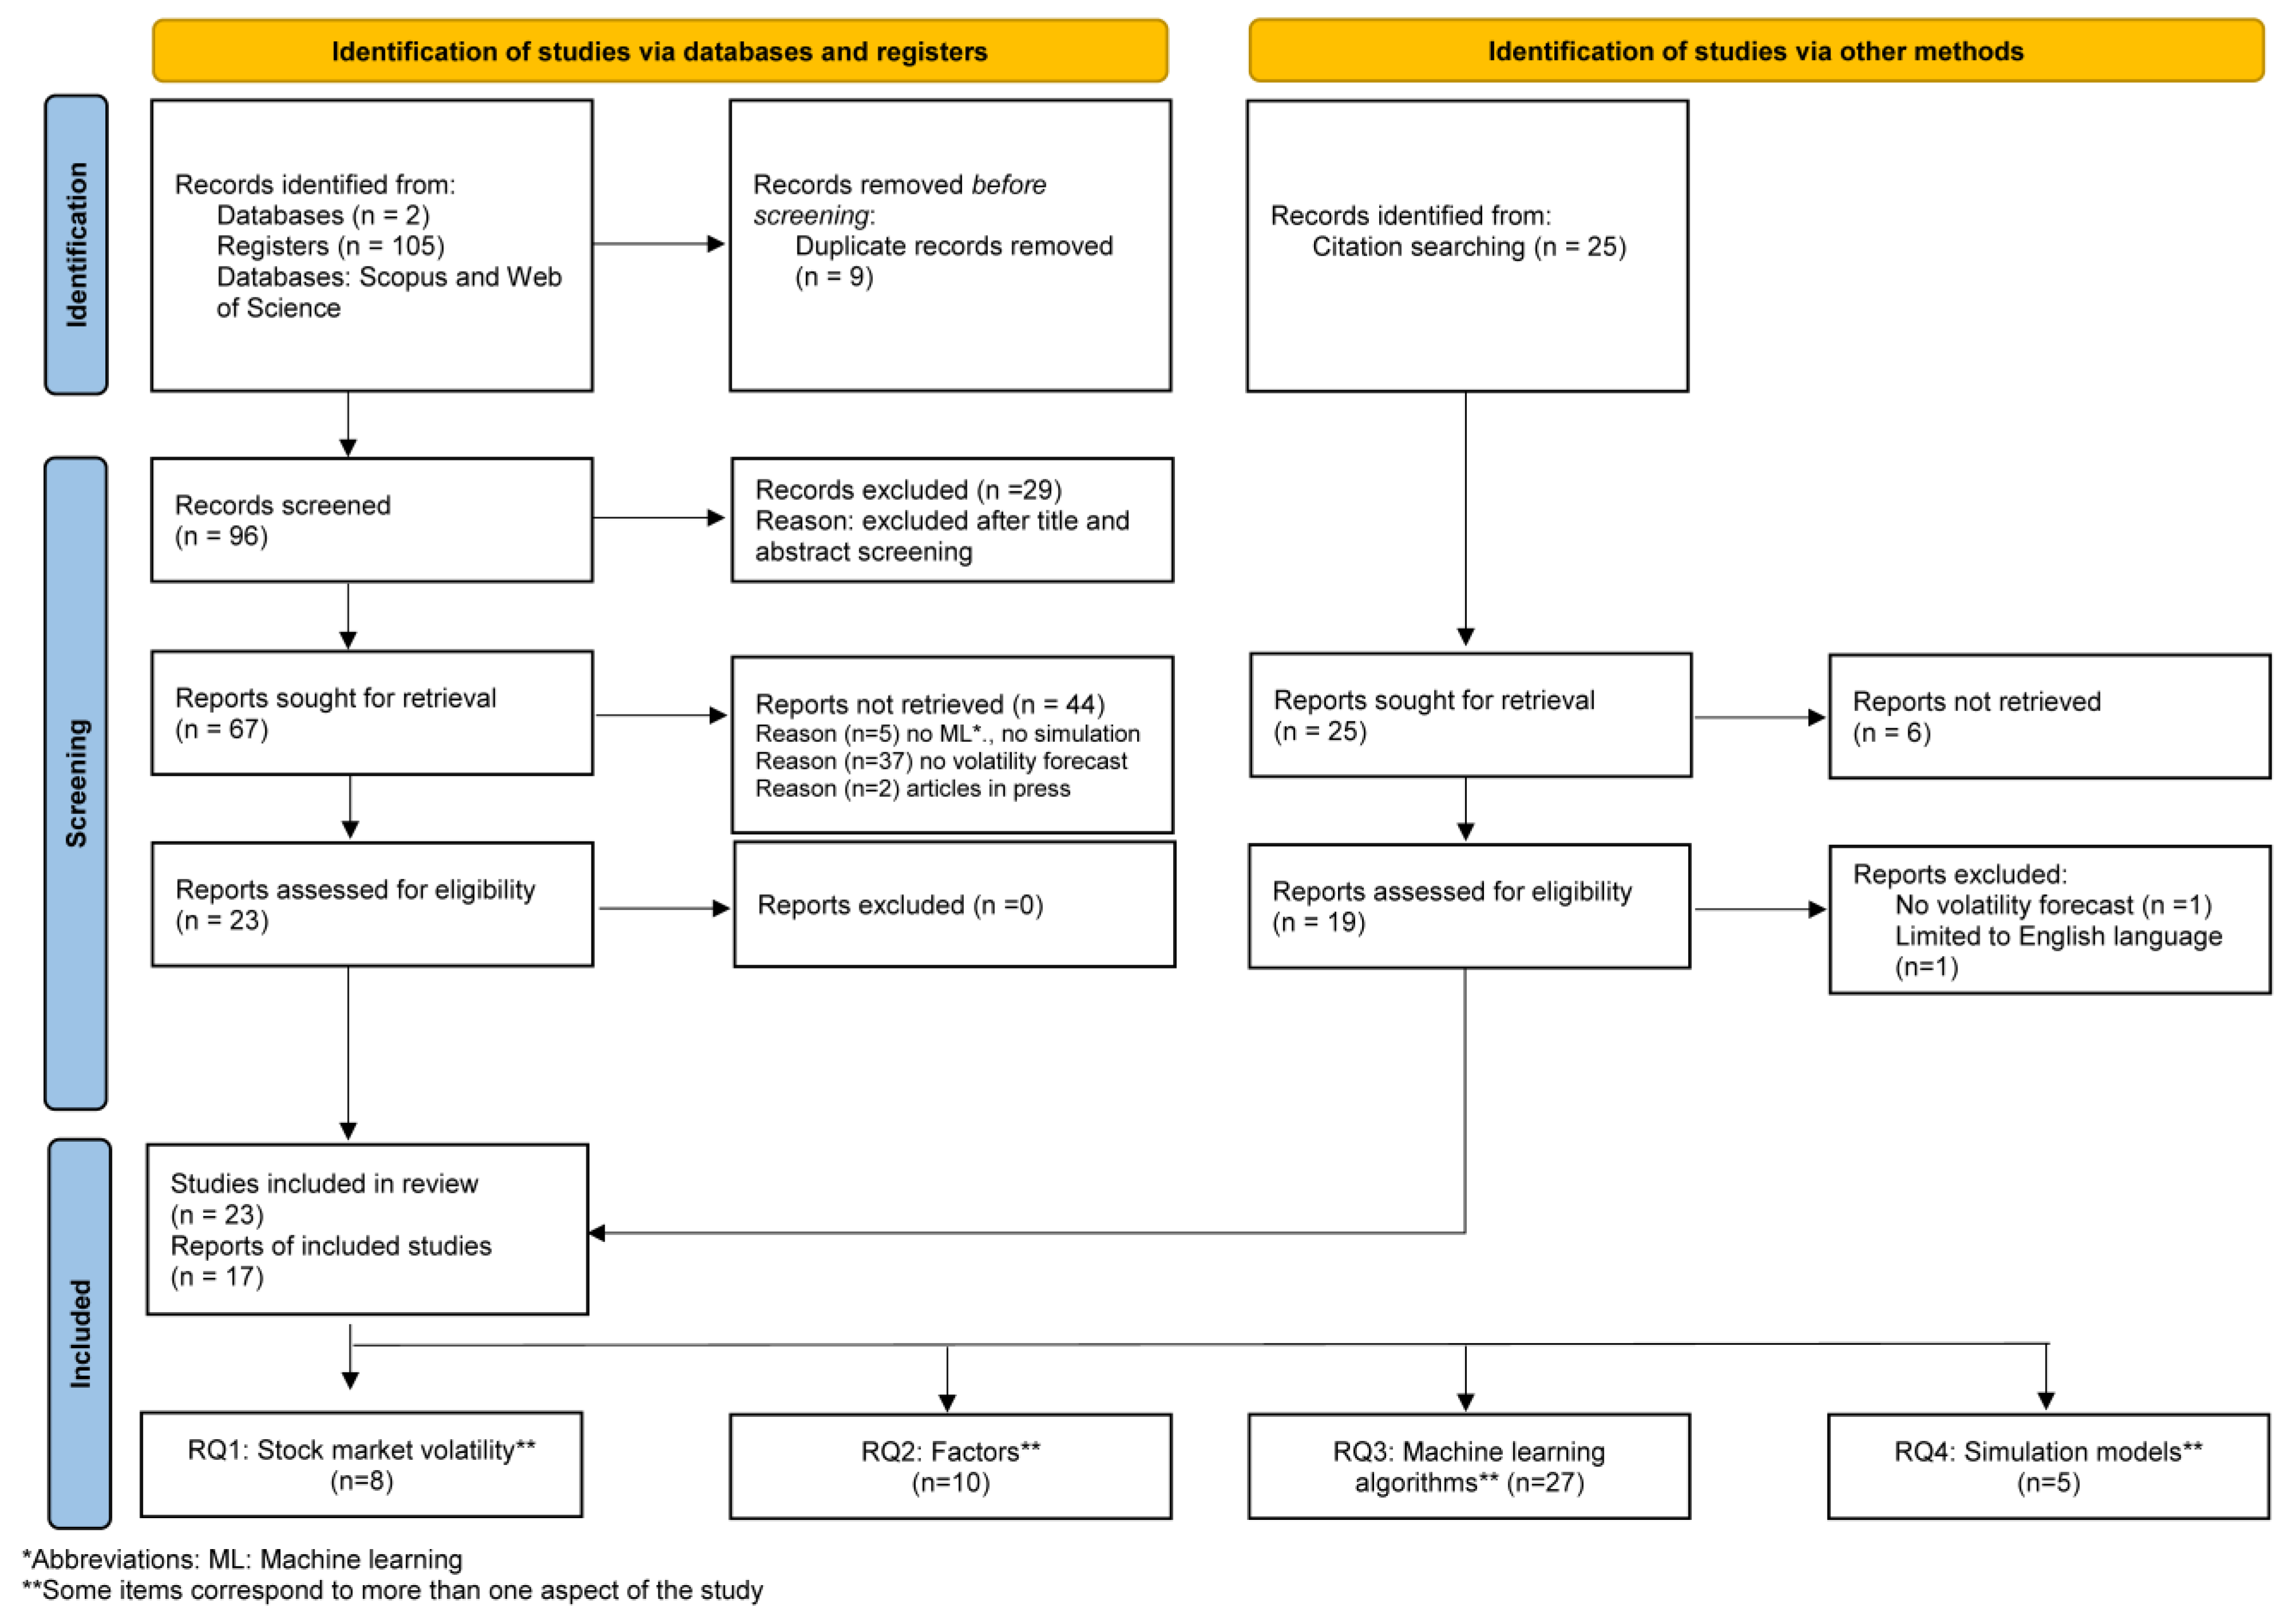
3.2. Search Strategy
3.3. Study Extraction and Synthesis
4. Results
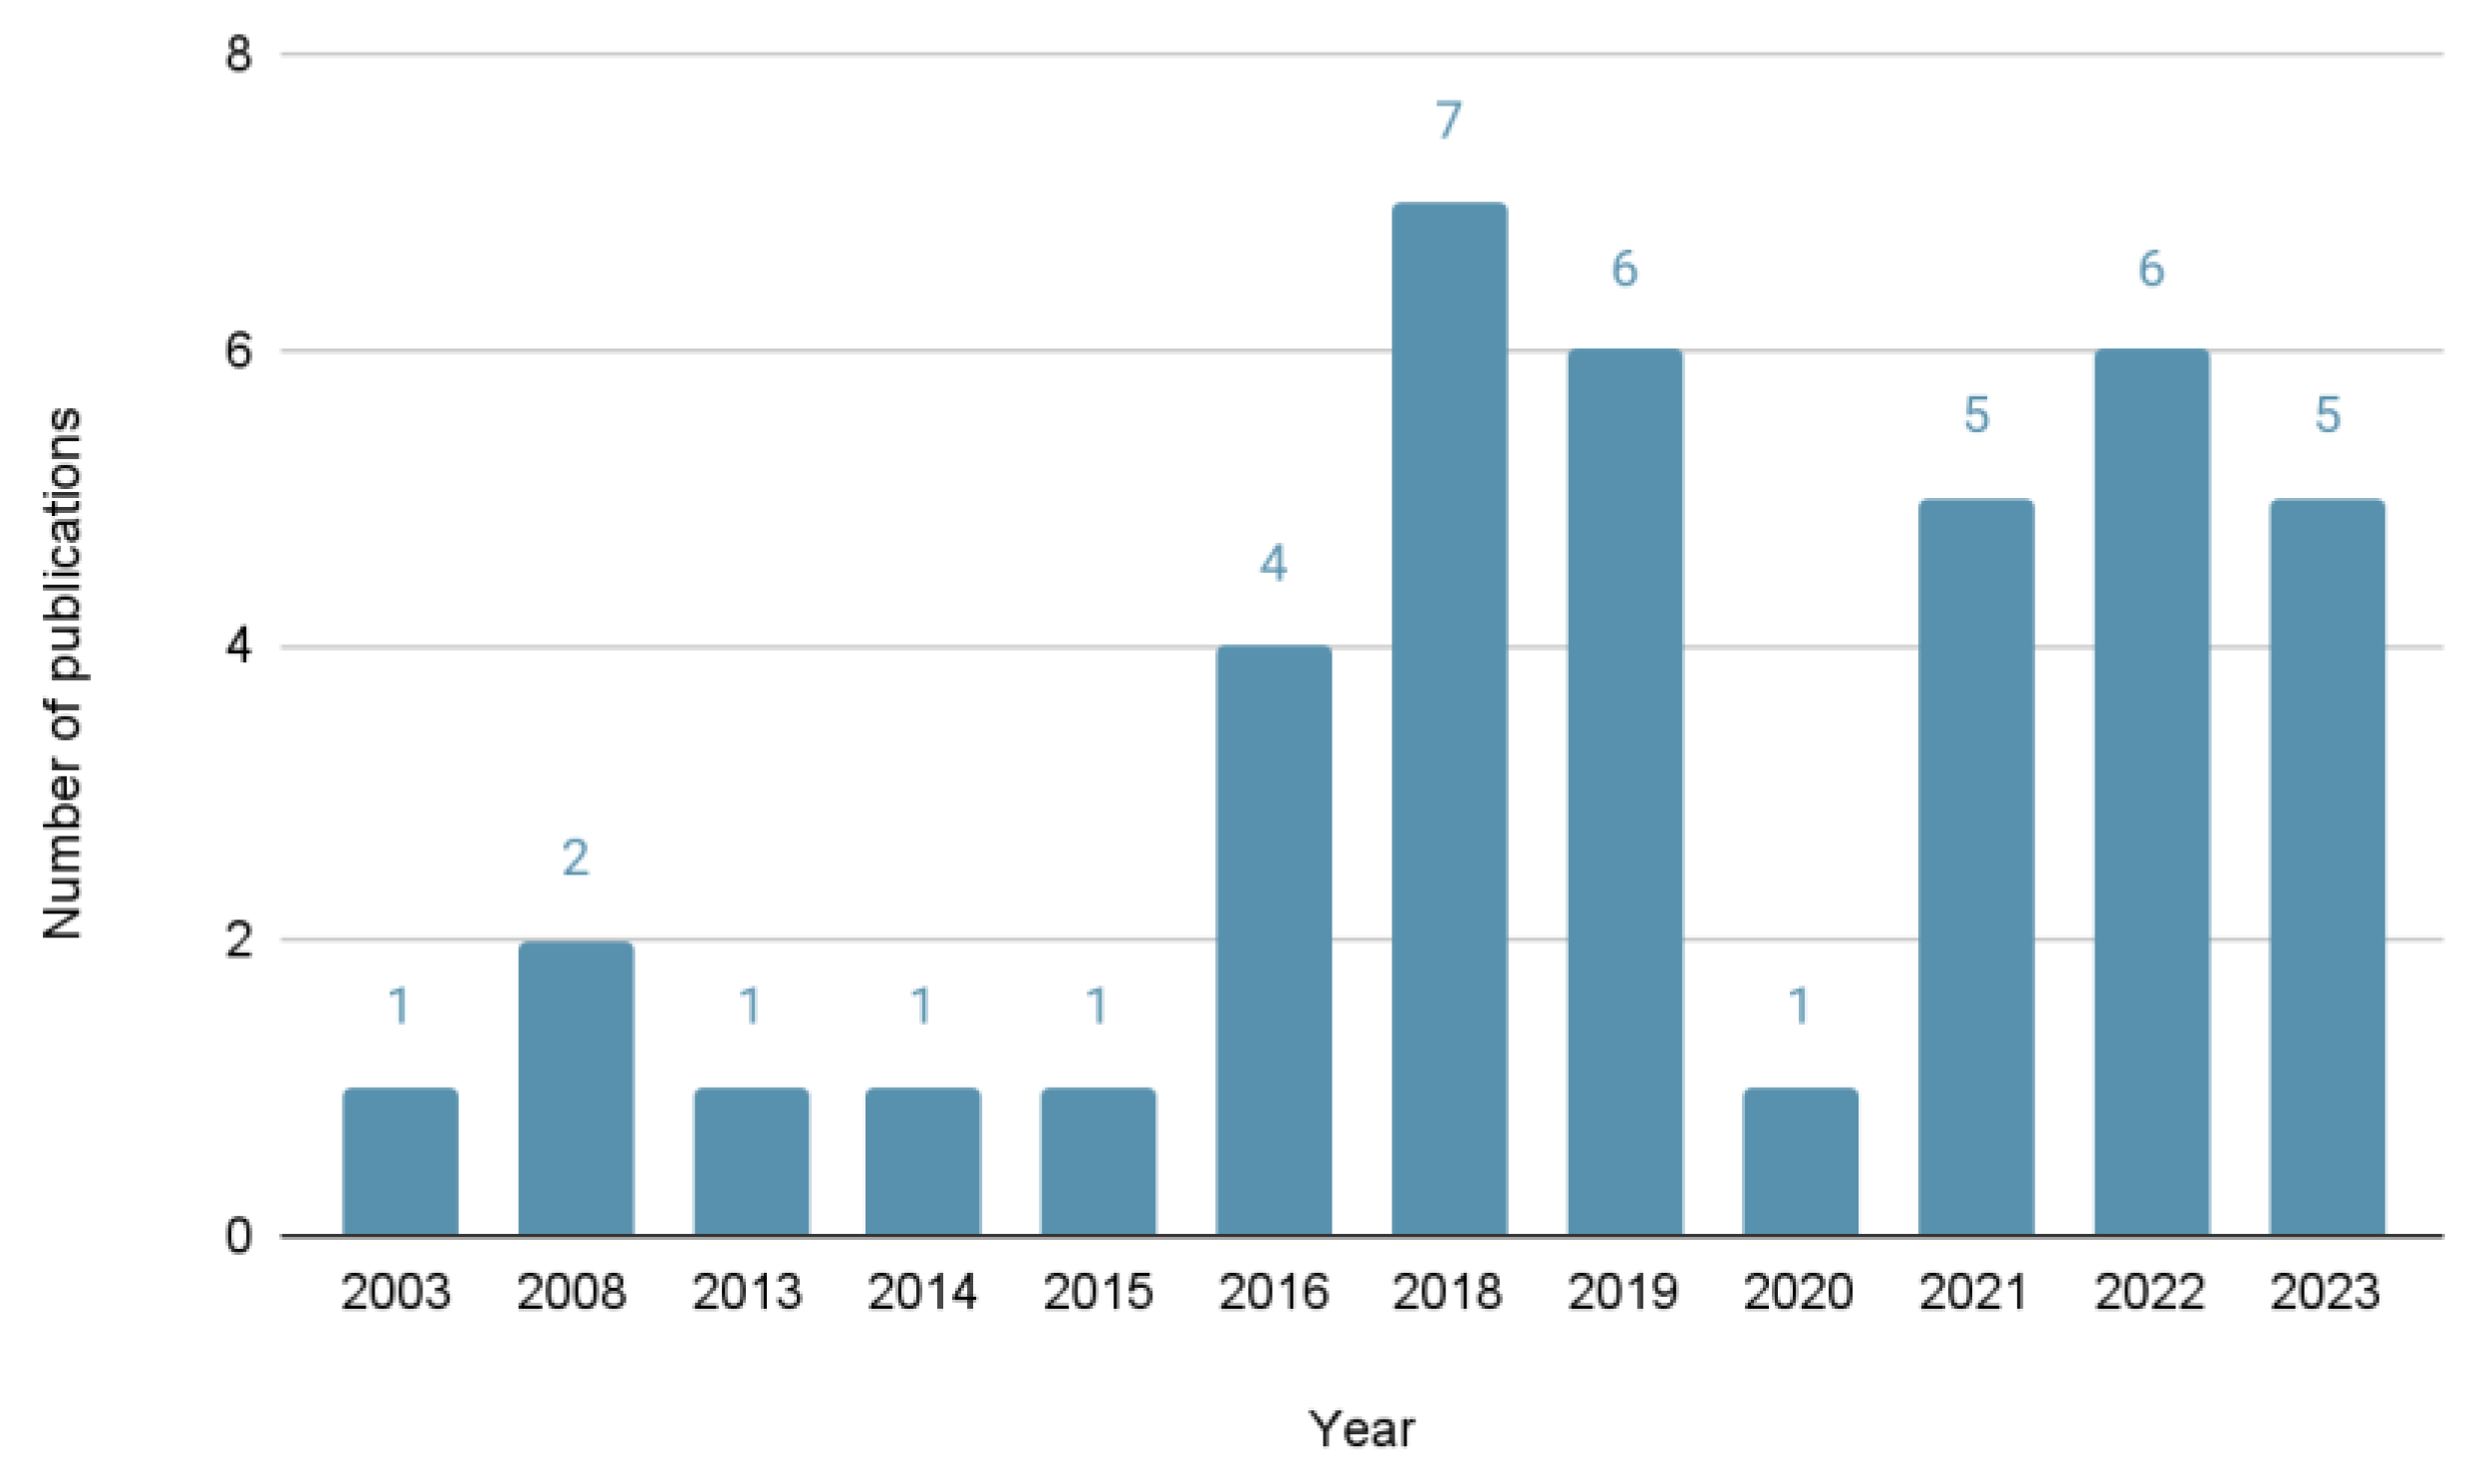
4.1. Trends in Publications
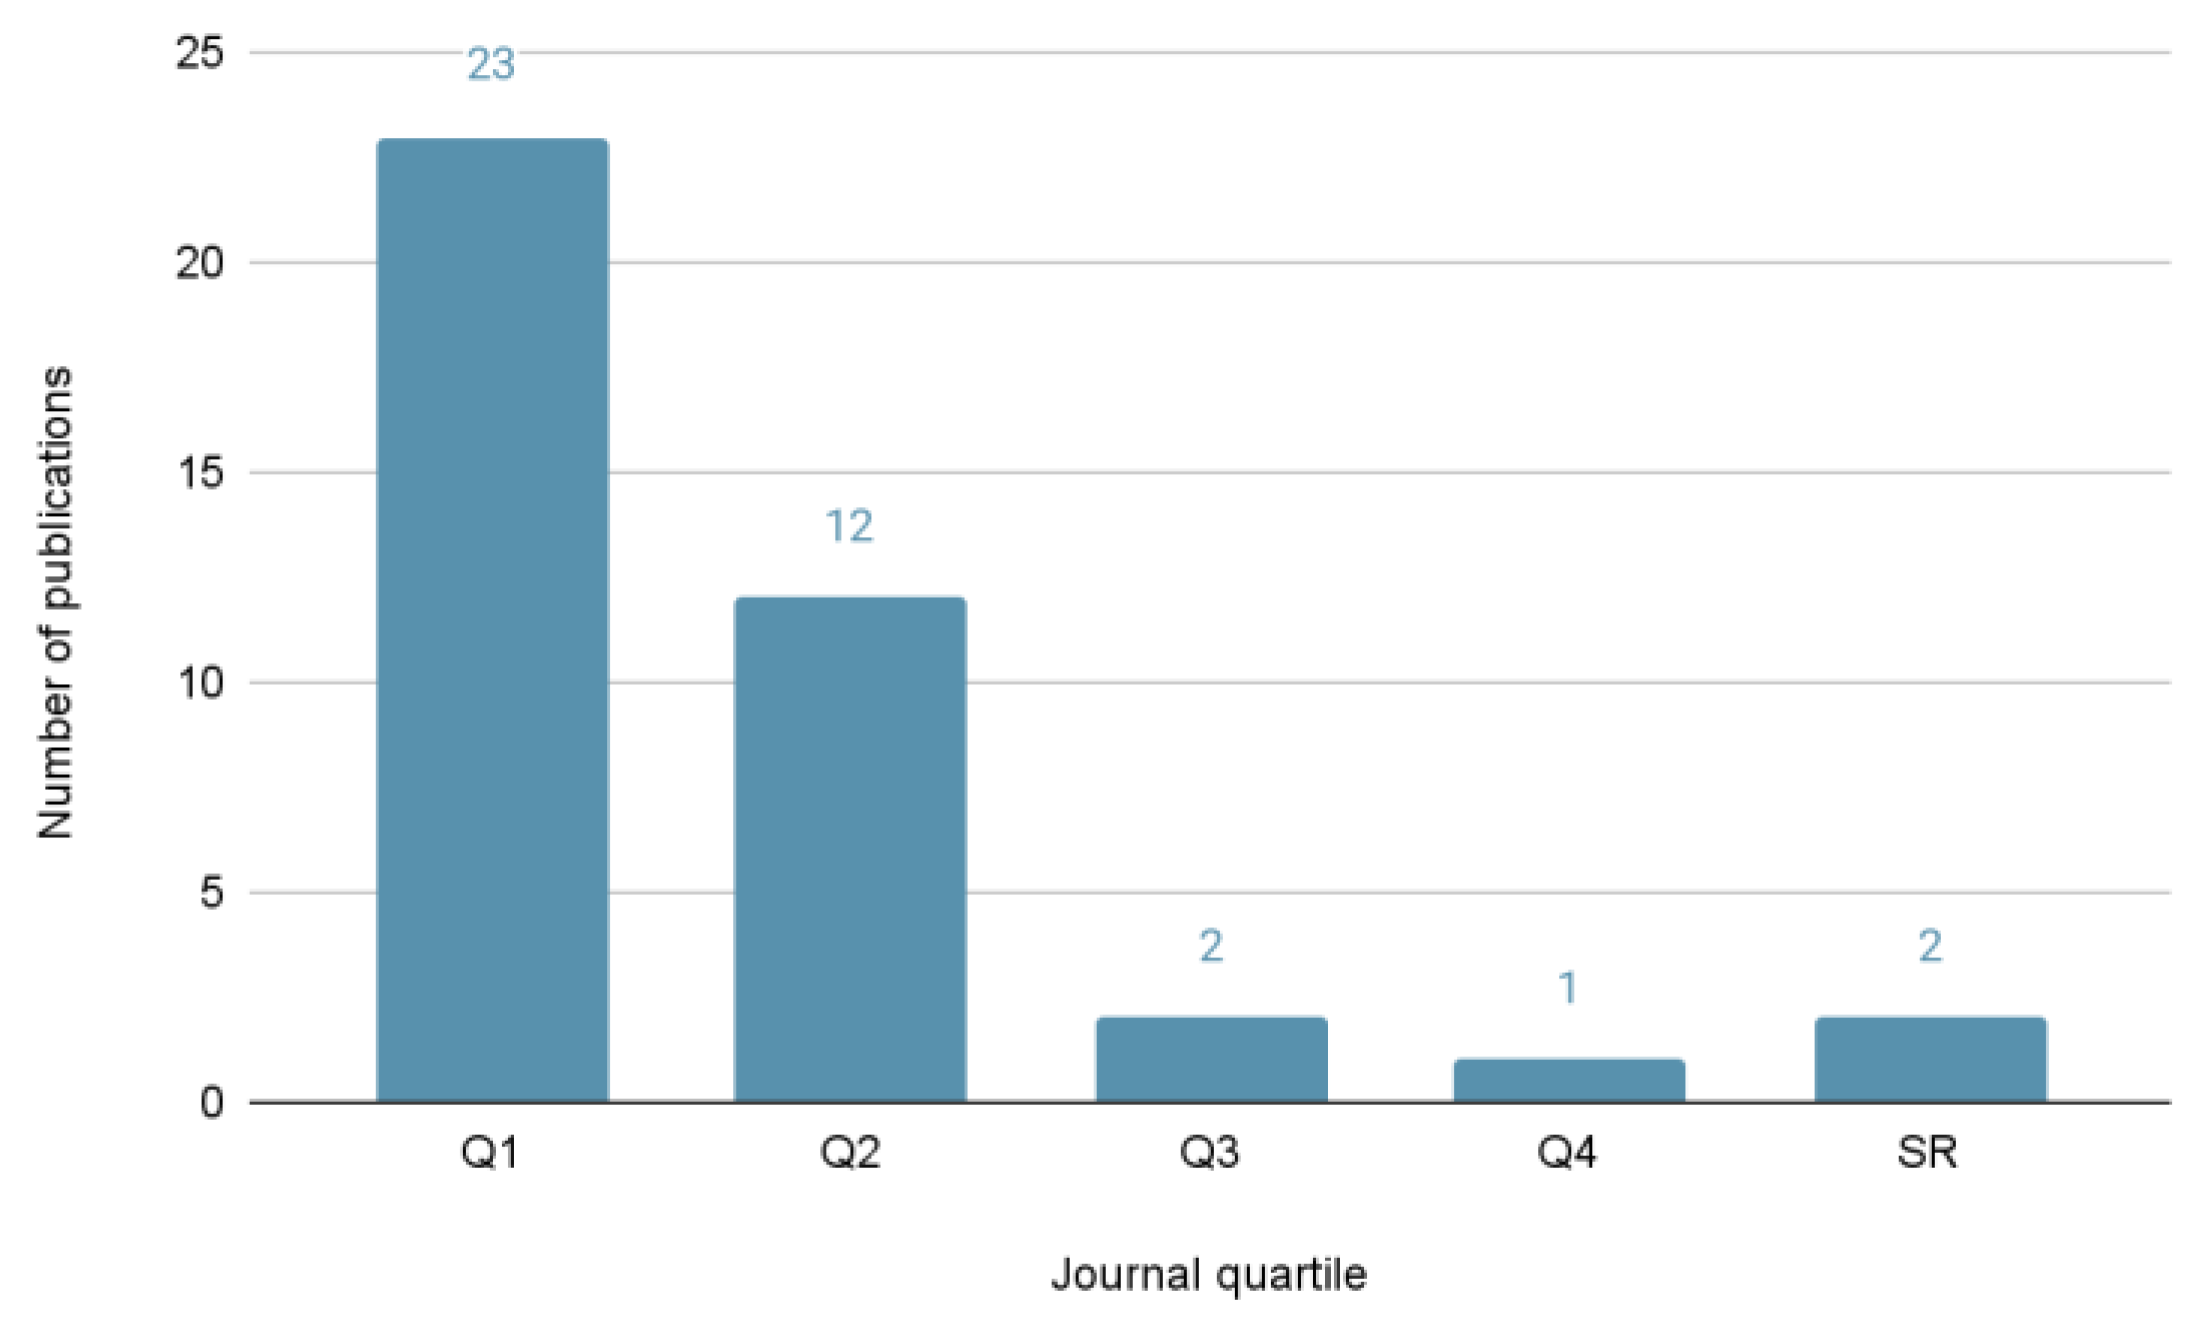
4.2. Quality of Publications
4.3. Publications by Continent
4.4. Publications by Author Impact
5. Discussion
5.1. Volatility Analysis
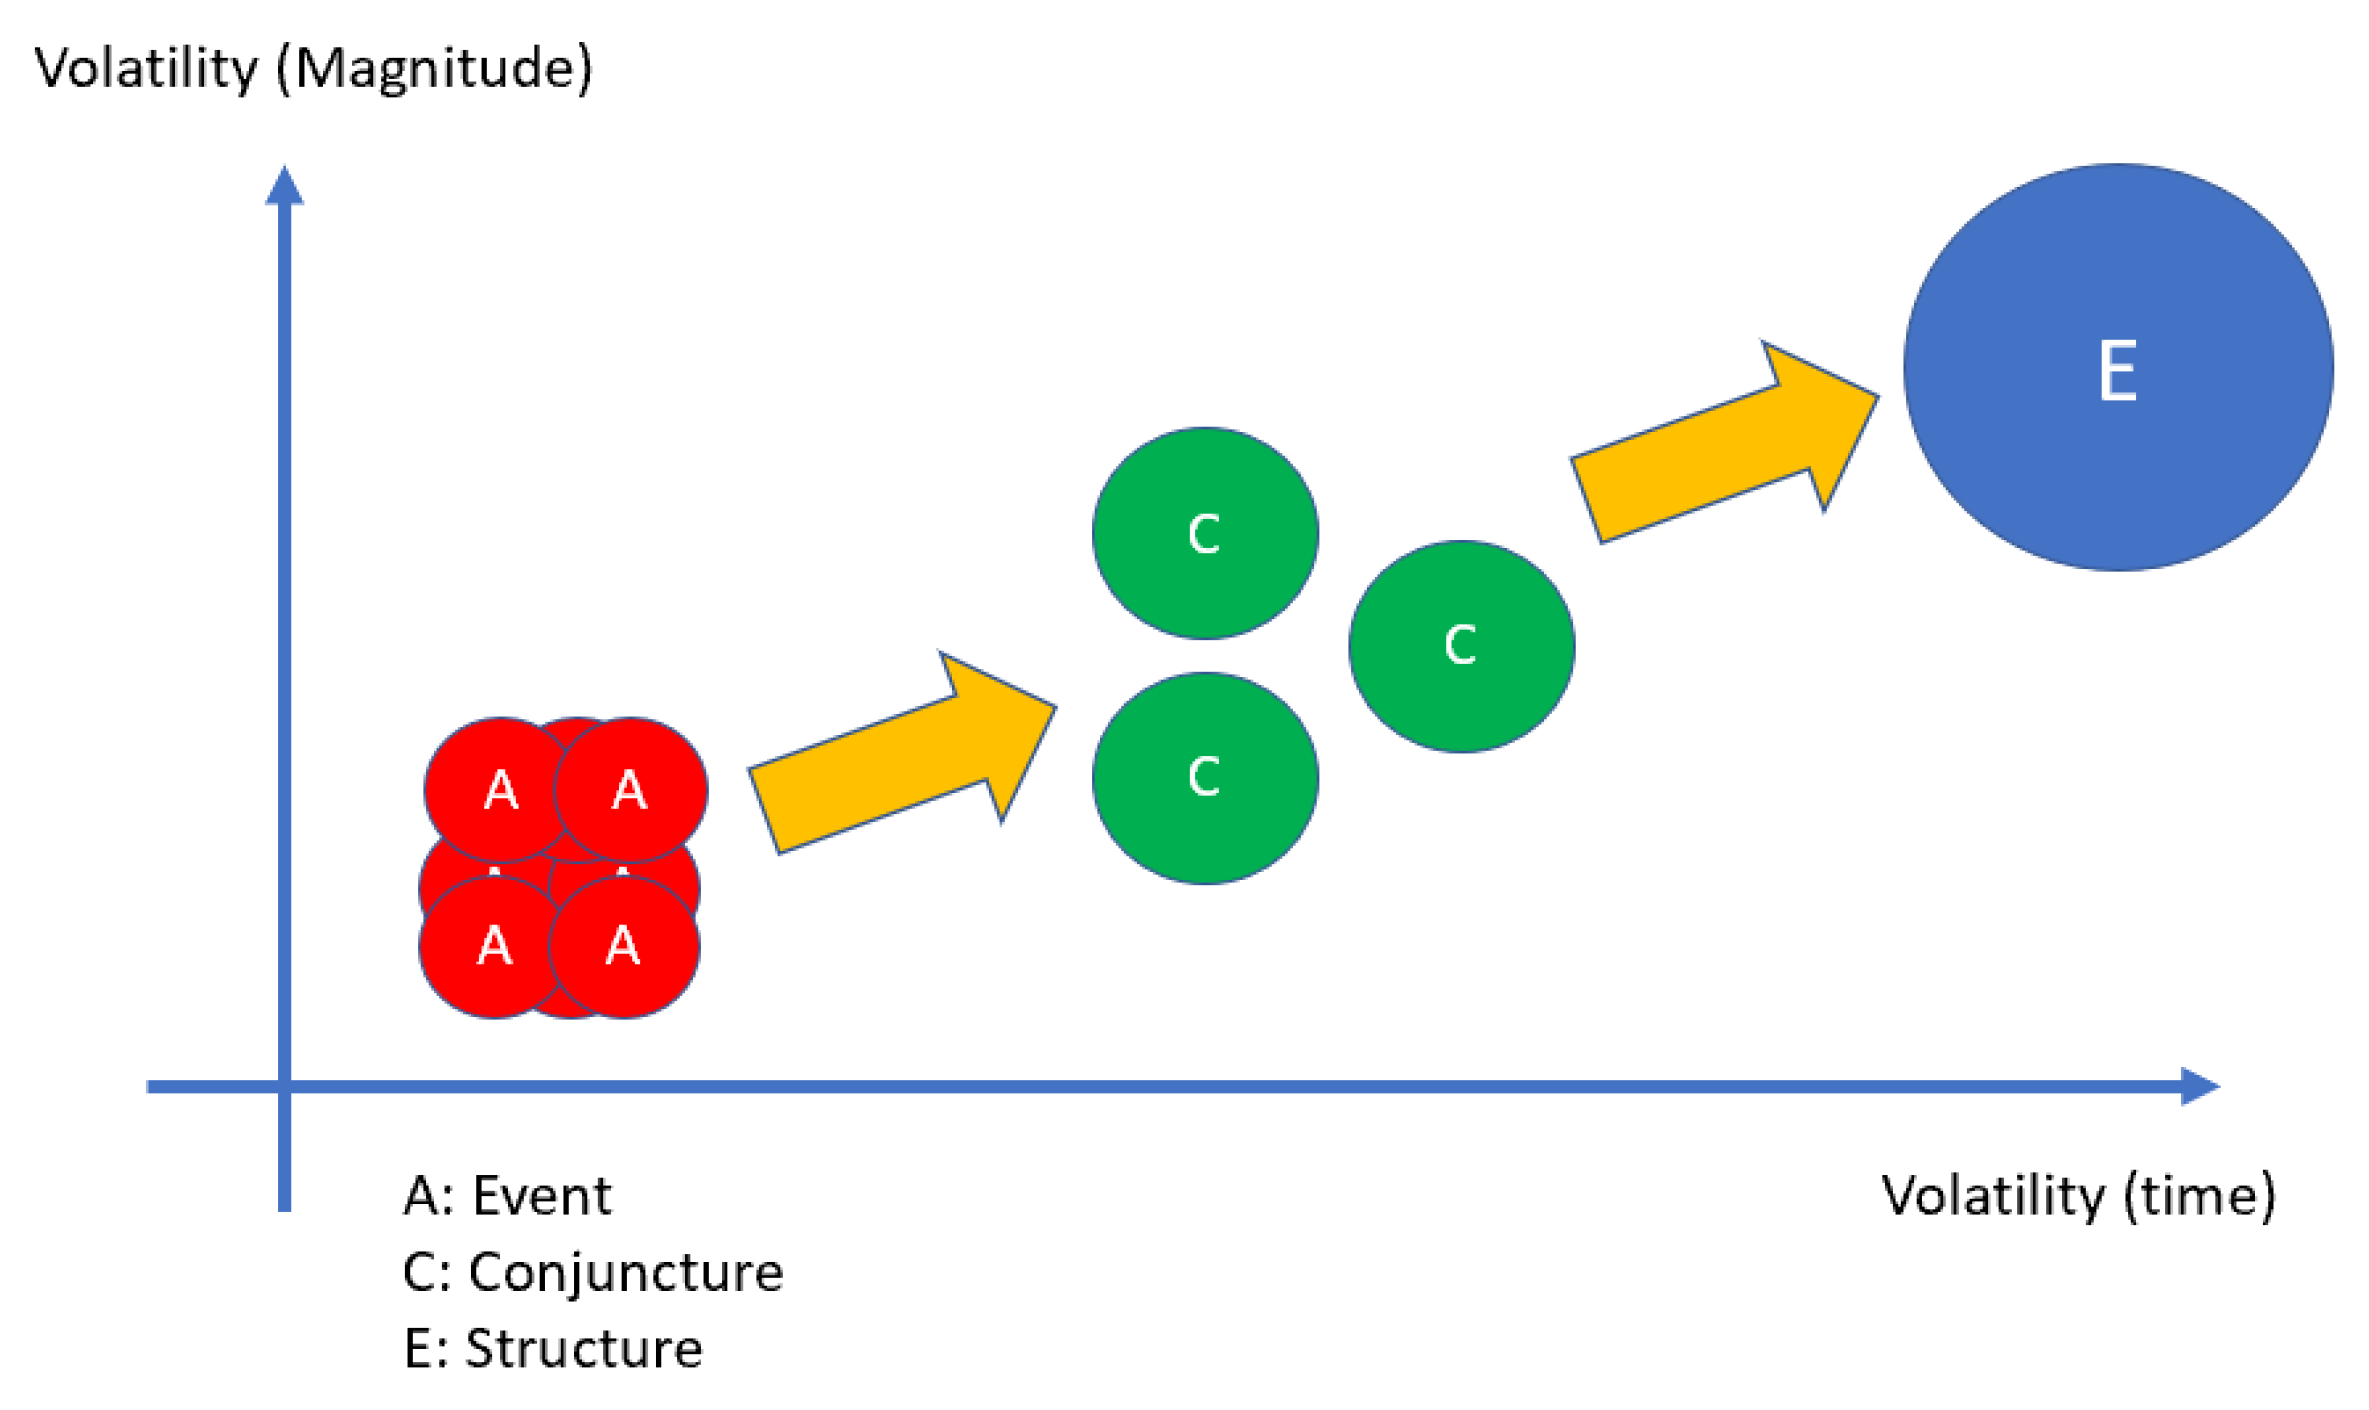
5.1.1. Stock Market Volatility
- The return on an asset or portfolio is the percentage change in its initial value after a period of time and is also referred to as the return (on investment) (McMillan, 2002). It is referred to as the expected return when this period is in the future (Ross, 2018).
- Uncertainty is the lack of knowledge about an event that reduces confidence in the conclusions derived from the data (Mulcahy, 2022).
- The indicator is data or information on volatility that serve to determine its presence or absence and measure its current condition as well as its financial forecast or economic trend (https://www.investopedia.com/terms/i/indicator.asp accessed on 25 November 2024).
- A period is the time during which an action is performed or an event takes place.
- Volatility is an indicator.
- Some definitions are confusing, such as D02, in which no distinction is made between risk and uncertainty.
- Four definitions (D02, D03, D05, and D07) indicate that volatility is an indicator of risk.
- Three definitions (D02, D04, and D06) state that it is an indicator directly associated with profitability, whereas three others (D03, D05, and D07) state that it is indirectly associated with profitability. In addition, volatility formulas measure variations in profitability [A32]. Therefore, we conclude that this is an indicator of profitability.
- Definitions (D01, D02, and D04) state that volatility is an indicator of uncertainty, which is incorrect because uncertainty can exist without generating volatility.
5.1.2. Factors That Determine Stock Market Volatility
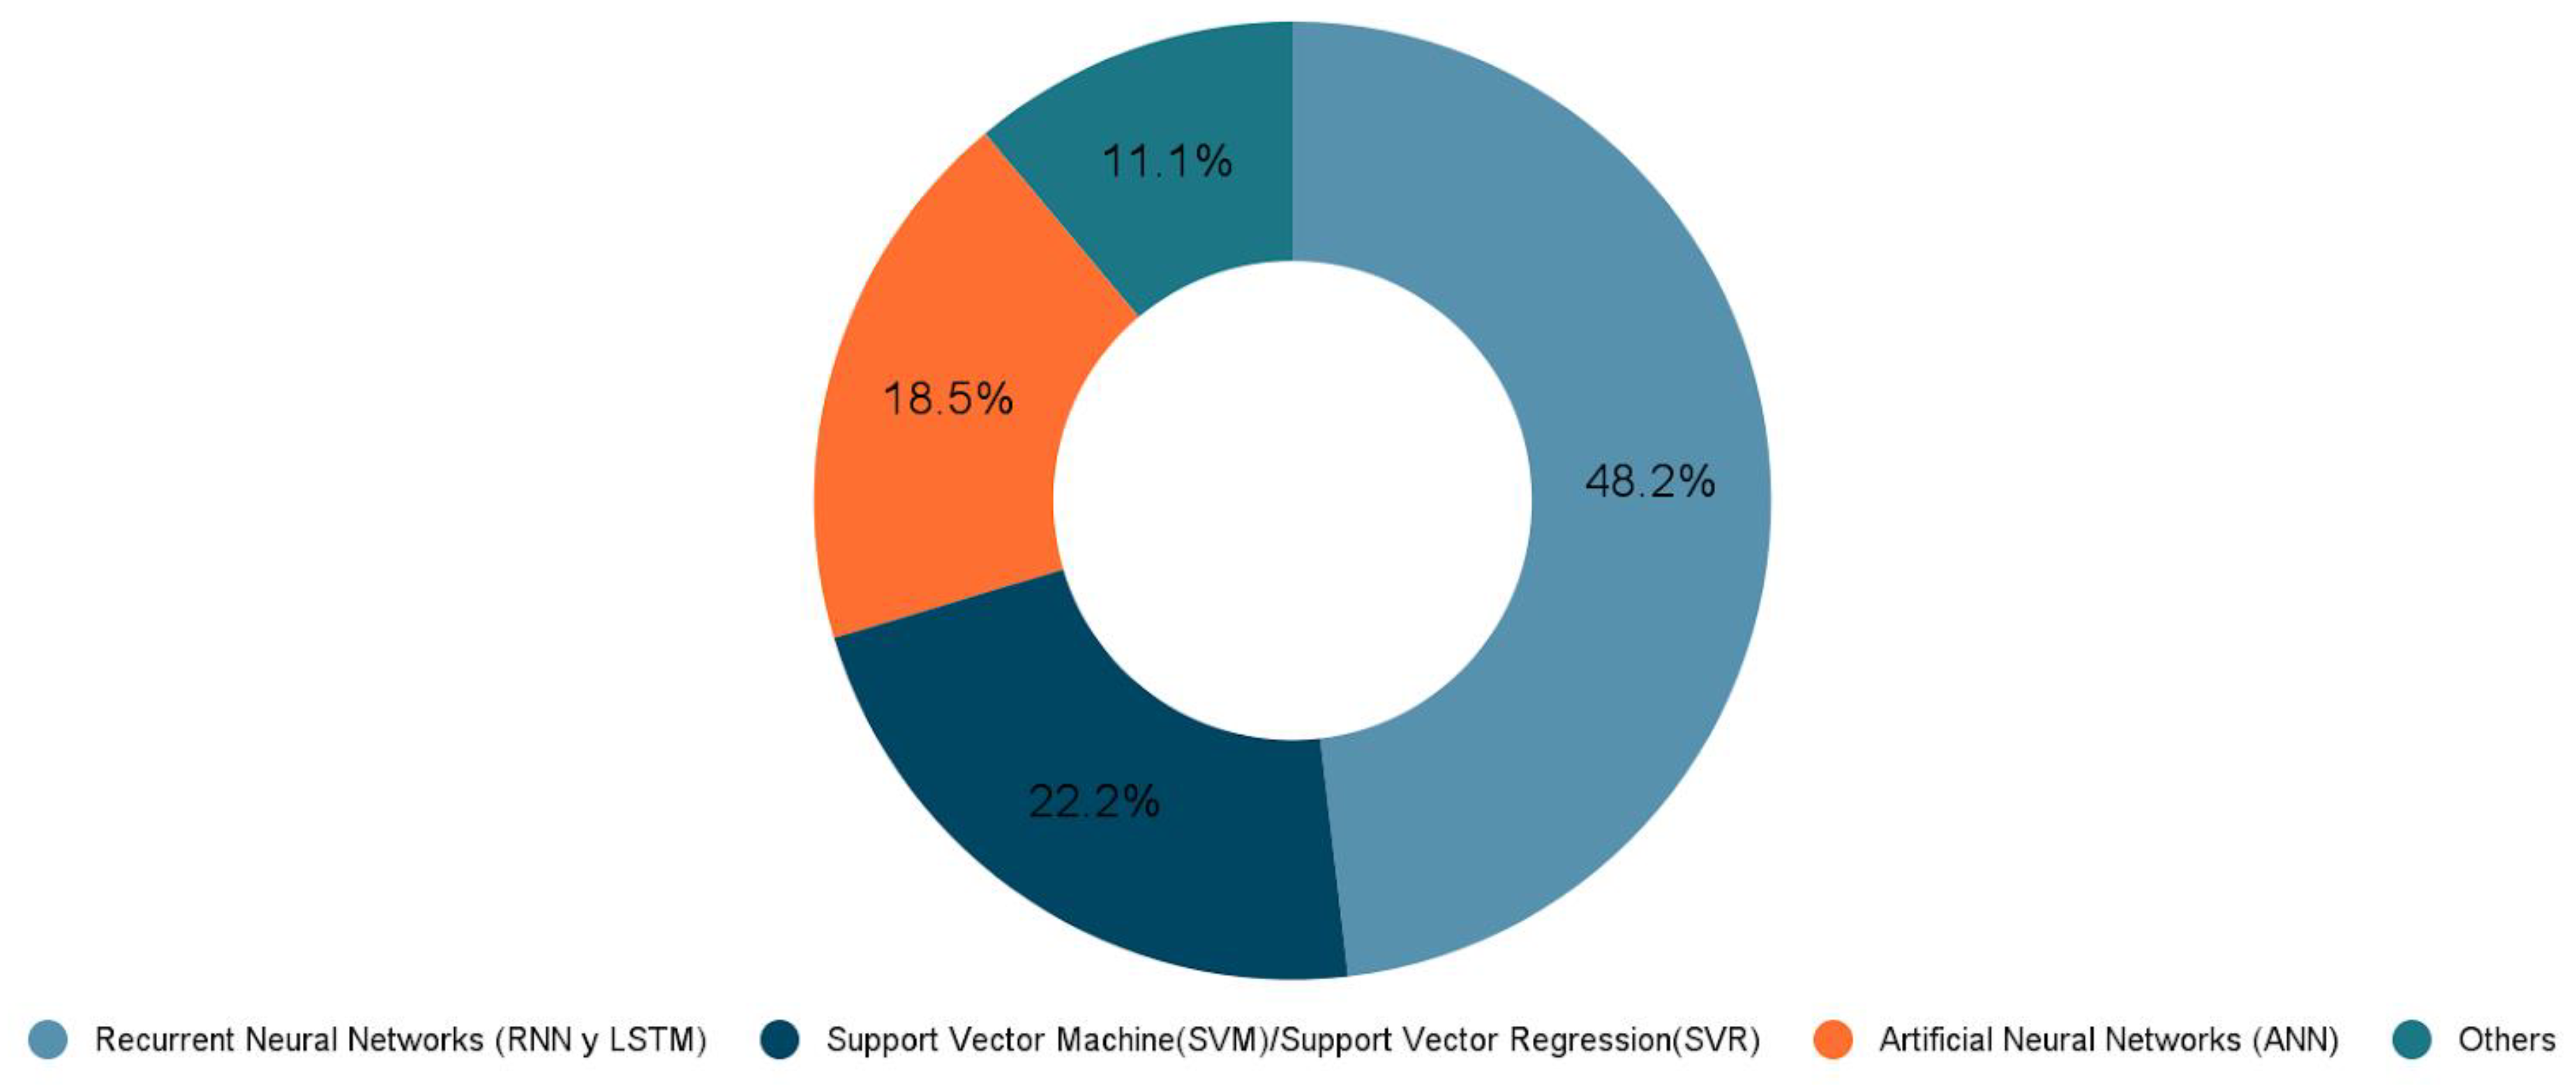
5.1.3. ML Algorithms Applied to Forecast Stock Market Volatility
5.1.4. Simulation Models for Volatility in the Stock Market
5.2. Thematic Analysis
5.2.1. Volatility
5.2.2. Factors
5.2.3. ML Algorithms
5.2.4. Simulation Models for Stock Market Volatility
5.2.5. Future Work
6. Conclusions
7. Limitations
Author Contributions
Funding
Data Availability Statement
Conflicts of Interest
Abbreviations
| AHE | Asymmetric Hurst exponents |
| AI | Artificial intelligence |
| ANN | Artificial neural network |
| ANOVA | Analysis of variance |
| ARCH | Autoregressive conditional heteroscedasticity |
| CAC40 | France Market Index |
| CAVIAR | Conditional autoregressive value at risk |
| CBOE | Chicago Board Options Exchange |
| CEEMDAN | Complete ensemble empirical mode decomposition with adaptive noise |
| CGA | Chaotic genetic algorithm |
| COVID | Coronavirus disease |
| CSM | Combination score model |
| DAX30 | German Stock Index |
| DCC-GARCH-MANN | Dynamic conditional correlation GARCH multivariate ANN |
| DJIA | Dow Jones Industrial Average Index |
| ESN | Echo state network |
| EWMA | Exponentially weighted moving average |
| FIAPARCH-NNBP | Fractionally integrated asymmetric power autoregressive conditional heteroscedasticity with neural network back propagation |
| FM | Factorization machine |
| FSVM | Fuzzy support vector machine |
| FSVR | Fuzzy vector machine for regression |
| FTSE | Financial Times Stock Exchange |
| GA | Genetic algorithm |
| GARCH | Generalized autoregressive conditional heteroscedasticity |
| GARCH-EVT | Generalized autoregressive conditional heteroscedastic autoregressive model with external value theory |
| GASVR | Genetic algorithm support vector regressor |
| GEW | GARCH, Exponential GARCH, and EWMA models |
| GMWK | Gaussian and Morlet wavelet kernels |
| GVMD-Q-DBN-LSTM-GRU | Grey wolf optimizer variational mode decomposition-Q-learning-deep belief network–LSTM-gated recurrent unit |
| HAR | Heterogeneous autoregressive |
| HARQ-J | Heterogeneous autoregressive quarticity jump model |
| HARQ-F-J | Full heterogeneous autoregressive quarticity jump model |
| HISVOL | Historical volatility |
| HMAE | MAE-adjusted heteroscedastic |
| HMSE | MSE-adjusted heteroscedastic |
| HSI | Hang Seng Index |
| HS150 | Hong Kong Stock Index |
| HS300 | Chinese Shanghai and Shenzhen 300 Composite Index |
| IPC Mexico | Mexico Price and Quotations Index |
| ISD | Implied standard deviation |
| KOSPI | South Korean Stock Index |
| LIBSVM | Library for Support Vector Machines |
| LSTM | Long short-term memory |
| LS-SVM-IPSO | Least square SVM-improved PSO |
| L-HAR-X | Log volatility HAR with exogenous variables |
| L-NN | Log volatility neural network |
| MAE | Mean absolute error |
| MAPE | Mean absolute prediction error |
| MAFE | Mean absolute forecast error |
| ML | Machine learning |
| MLP | Multilayer perceptron |
| MPFE | Mean percentage forecast error |
| MSE | Mean square error |
| MSFE | Mean-squared forecast error |
| MSPE | Mean-squared prediction error |
| MSM | Markov switching multifractal |
| N225 | Nikkei Index of the Tokyo Stock Exchange |
| NARX | Non-linear autoregressive network with exogenous inputs |
| NMSE | Normalized mean square error |
| PSO | Particle swarm optimization |
| PRISMA | Preferred Reporting Items for Systematic Review and Meta-Analysis |
| QARNN | Quantile autoregressive neural network |
| QLIKE | Quasi-likelihood |
| QRNN | Quantile regression neural network model |
| RMDN | Recurrent mixture density network |
| RMSE | Root mean square error |
| RNN | Recurrent neural network |
| SABR | Stochastic alfa beta rho model |
| SJR | SCImago Journal Rank |
| SLR | Systematic literature review |
| SMAPE | Symmetric mean absolute percentage error |
| SR-SV | Statistical recurrent stochastic volatility |
| SSE | Shanghai Stock Exchange |
| SSEC | Index of securities traded on the Shanghai Stock Exchange |
| SSM | Single score model |
| SVA | Surface and variational encoders |
| SV | Stochastic volatility |
| SVM | Support vector machine |
| SVR | Support vector regression |
| SZSC | Shenzhen Stock Exchange Composite Index |
| SZSE | Shenzhen Securities Composite Index |
| TSWE | Taiwan Stock Exchange Weighted Stock Index |
| TSX250 | Toronto Stock Exchange Index |
| TSWE | Taiwan Stock Exchange Weighted Stock Index |
| VAR | Value at risk |
| VECHAR | Vector error correction heterogeneous autoregressive |
| VIX | Implied volatility index |
| VIX3M | CBOE S&P 500 3-month volatility |
| VIXY-IV | Proshares VIX short-term future |
| WoS | Web of Science |
Appendix A

| ID | Reference | ID | Reference |
|---|---|---|---|
| A1 | Alostad and Davulcu (2019) | A21 | Xu et al. (2016) |
| A2 | Hu et al. (2018) | A22 | Hung (2016) |
| A3 | Ayala et al. (2021) | A23 | Chkili and Hamdi (2021) |
| A4 | W. Wang et al. (2021) | A24 | Khan et al. (2022) |
| A5 | C. Lin et al. (2018) | A25 | S. Zhang and Fang (2021) |
| A6 | Gong et al. (2019) | A26 | H. Kim et al. (2021) |
| A7 | Shen et al. (2018) | A27 | Hung (2015) |
| A8 | Ramos-Pérez et al. (2019) | A28 | T. Gao and Chai (2018) |
| A9 | Trierweiler Ribeiro et al. (2020) | A29 | Allen and Hooper (2018) |
| A10 | H. Y. Kim and Won (2018) | A30 | Khashanah and Alsulaiman (2016) |
| A11 | Sheu et al. (2016) | A31 | Petrozziello et al. (2022) |
| A12 | De Gaetano (2019) | A32 | Y. Lin et al. (2022) |
| A13 | B. Wang et al. (2013) | A33 | Bekiros and Georgoutsos (2008a) |
| A14 | Petneházi and Gáll (2019) | A34 | W. Zhang et al. (2023) |
| A15 | Moon and Kim (2019) | A35 | Bekiros and Georgoutsos (2008b) |
| A16 | Ou and Wang (2014) | A36 | Cho and Lee (2022) |
| A17 | Poon and Granger (2003) | A37 | Kaczmarek et al. (2022) |
| A18 | Nguyen et al. (2023) | A38 | Christensen et al. (2023) |
| A19 | Y. Gao et al. (2023) | A39 | Fatima and Uddin (2022) |
| A20 | Bezerra and Albuquerque (2019) | A40 | Yu et al. (2023) |
Appendix B
| Category | ID | Factor | Description | Source |
|---|---|---|---|---|
| News | F1 | Company-related events | News about decisions made by the CEOs of companies listed on stock markets. | [A1] |
| F2 | Announcements | Announcements of new investments or developments of innovative services or products that are promoted or postponed. | [A1] | |
| F3 | Market news | Sectoral news of the impact of performance on the economy. Among them, microblog news [A24], bad news, and good news [A33]. | [A2], [A24], [A33] | |
| F4 | Viral posts | Posts about rumors or about the spread of news on social networks such as X, e.g., high-volume posts [A1]. | [A1] | |
| F5 | Technical analysis reports | Valuation reports of companies listed on stock markets by risk rating agencies or valuation companies. | [A1] | |
| F6 | Privileged information | Advance proprietary information leaking into the marketplace. | [A3] | |
| Health | F7 | COVID-19 pandemic | An example of this is the health crisis caused by the COVID-19 virus, which caused a high degree of uncertainty and volatility in stock markets [A25]. | [A25] |
| Irrationality | F8 | Greed | Behavior that induces investors to buy more shares without considering the fundamentals and is characteristic of the last stages of bull markets because of the effect of investors’ irrationality [A25]. | [A3], [A5], [A25] |
| F9 | Fear | Behavior that induces the selling of shares due to concerns about unfavorable events or economic crises resulting from reversal events and volatility [A25]. | [A3], [A5], [A25] | |
| Economics | F10 | Financial crises | A structural crisis involving the banking system and the monetary system that manifests itself in bank failures, credit crunches, increased public deficits, and sovereign debt. Examples are the 2008 subprime crisis [A8], the European sovereign debt crisis, the Greek crisis due to external debt default, and the 2015 Chinese market financial turbulence [A12]. | [A8], [A12] |
| F11 | Overvaluation of shares | An example is the dot-com crash caused by the overvaluation of technology companies in 2000. | [A8] | |
| F12 | Falling commodity prices | The fall in oil prices between 2014 and 2015 of nearly 70% in the face of oversupply and the weak reaction of economic activity in emerging countries. | [A12] | |
| Politics | F13 | 2016 Brexit referendum | Withdrawal of the United Kingdom from the European Union by referendum. | [A12] |
| F14 | New regulations | Regulations imposed on a sector. An example is the decision to stop producing combustion cars in the European Union as of 2035. | [A8] | |
| War | F15 | Terrorist attacks | Terrorist attack of 11 September 2001, which impacted financial markets in the affected countries. | [A17] |
| Reference | Dataset b | Period | Forecast | Window (W)/Horizon (H) Days | Algorithm/Method a | Performance c |
|---|---|---|---|---|---|---|
| [A4] | S&P 500 DJIA SSE SZSE | 2000–2011 | Realized volatility | H = one day ahead | Elman + RNN + FM | MAPE (2.0552), MAE (228.2216), RMSE (298.6005) MAPE (2.3703), MAE (227.0823), RMSE (290.28) MAPE (1.6545), MAE (47.0132), RMSE (68.2408) MAPE (1.6545), MAE (47.0132), RMSE (293.7208) |
| [A6] | S&P500 HS300 | 2010–2017 | Returns | - | LS + SVM + IPSO | MAE (0.00083), MSE (0.0000029), RSME (0.00328) MAE (0.00051), MSE (0.0000017), RSME (0.00311) |
| [A7] | S&P500 | 2006–2010 | Price volatility | H = 1 | FSVM | NMSE (0.7425), MAE (0.0081) |
| [A8] | S&P500 | 2000–2007 2001–2008 2002–2009 2009–2016 2010–2017 | True realized volatility | W = 10 | ANN | RSME (0.00274) |
| [A9] | Nasdaq companies: CAT, EBAY, and MSFT | 2745 days | Realized volatility | H = 1, 5 days, 21 days | HAR + PSO + ESN | R2 (0.297), MSE (1.11 × 10⁻⁷) |
| [A10] | KOSPI 200 Stock index | 2001–2011 | Realized volatility | W = 7, 15, and 22 days/ H = 1, 14, and 21 days | GEW + LSTM | MAE (0.01069), MSE (0.00149), HMAE (0.42911), HMSE (0.23492) |
| [A11] | S&P500 Dow Jones Nasdaq | 2019–2020 | Historical volatility | W = 39 for S&P500 and Dow Jones/35 days for Nasdaq | LSTM + likelihood-based loss function | MSE (no comparable values) |
| [A13] | SSEC SZSC | 1991–2010 | Volatility | H = 50–100 | SVM + MSM | MSE (3.669 × 10⁻⁷), R2 (0.512) MSE (1.40 × 10⁻⁷), R2 (0.76) |
| [A14] | DJIA | 2008–2017 | Volatility estimators | W = 21 H = 1 day | LSTM | RSME (0.0131), SMAPE (5.01) |
| [A15] | S&P500 Nasdaq DAX KOSPI IPC Mexico | 2010–2016 | Volatility | H = one day ahead | LSTM | MSE (0.000022), MAPE (0.138758) MSE (0.000030), MAPE (0.139860) MSE (0.000044), MAPE (0.133250) MSE (0.000024), MAPE (0.214972) MSE (0.000021), MAPE (0.136609) |
| [A16] | Nasdaq | 2001–2010 | Actual volatility Stochastic volatility | - | SVR + CGA | RMSE (3.8076), NMSE (0.6304) QLIKE (1.2517) |
| [A18] | DAX30 HS150 CAC40 S&P500 TSX250 | 2004–2016 2003–2015 2004–2016 2004–2016 2004–2016 | Stochastic volatility | - | SR + SV+ RNN | MSE (0.098), MAE (0.023), QLIKE (0.851), R2LOG (0.40) MSE (0.060), MAE (0.150), QLIKE (0.361), R2LOG (0.291) MSE (0.090), MAE (0.209), QLIKE (0.896), R2LOG (0.34) MSE (0.108), MAE (0.224), QLIKE (0.316), R2LOG (0.692) MSE (0.081), MAE (0.195), QLIKE (0.119), R2LOG (0.597) |
| A19] | SSE of 50 stocks | 2015–2020 | Realized volatility | W = 1037 5 min block H = 5 min ahead | HARQ + J + LSTM HARQ + FJ + LSTM | MSE (1 × 10⁻⁶), HMSE (1), MAE (0.1056), HMAE (0.0614), R2LOG (0.0194), QLIKE (1) MSE (1 × 10⁻⁶), HMSE (1), MAE (1 × 10⁻²), HMAE (1), R2LOG (1) QLIKE (1) |
| [A20] | S&P500 Bovespa | 2008–2016 2007–2016 | Volatility | H = 1 period | SVR + GMWK | MSE (2.541976 × 10⁻⁸) MSE (1.620612 × 10⁻⁷) |
| [A22] | TSWE NASDAQ HSI SSE | 2010–2013 | Realized volatility | W = 22 H = one step ahead | FSVR | MAFE (0.1278), MPFE (0.2506), MSFE (0.0476) MAFE (0.1409), MPFE (0.2973), MSFE (0.0551) MAFE (0.2957), MPFE (0.3459), MSFE (0.2114) MAFE (0.5695), MPFE (0.3781), MSFE (1.5807) |
| [A23] | Dow Jones Islamic | 1999–2016 | Returns | H = one step ahead | FIAPARCH + NNBP | MSE (0.506785126), RMSE (0.711888423), NMSE (0.466885252) |
| [A26] | S&P500 KOSPI200 | 2016–2019 | Implied volatility surface | W = 128 | SABR | Relative error (not comparable data) |
| [A29] | S&P 500 VIX | 2000–2017 | Realized volatility (VIX index forecast) | W = 5 min H = one step ahead | ANN | - |
| [A31] | Dow Jones (28 assets) S&P500 (92 assets) NASDAQ (100 assets) | 2012–2017 | Realized volatility | W = 20 H = one step ahead | LSTM | MSE (0.17), QLIKE (0.1620), Pearson (0.72) |
| [A32] | CSI300 S&P500 STOXX50 | 2005–2020 | Realized volatility | W = 5, 21, and 252 H = one step ahead | LSTM + CEEMDAN | MSE (1.54 × 10⁻⁹), MAE (2.39 × 10⁻⁵), HMSE (0.1346), HMAE (0.2572) MSE (3.85 × 10⁻¹⁰), MAE (9.44 × 10⁻⁶), HMSE (0.5556), HMAE (0.4972) MSE (6.37 × 10⁻¹⁰), MAE (1.47 × 10⁻⁵), HMSE (6.41 × 10²), HMAE (1.4923) |
| [A34] | Options of S&P500 | 2009–2020 | Implied volatility | H = one step ahead | SVA + DNN+ LSTM | RMSE (0.0205) MAPE (7.60%) |
| [A35] | S&P500 | 1998–2002 | CBOE-implied volatility index (VIX) | W = 20 H = following day | RNN | MSPE (0.033) |
| [A36] | S&P500 | 2000–2020 | Realized volatility | W = 90 s H = following day | AHE | MFE (0.000449), MSE (0.000046) MAPE (4.853296), RAE (0.578949) |
| [A37] | S&P500 | 2000–2020 | Realized volatility | H = one day ahead | RNN | MSE (0.0031), MAPE (0.2618) |
| [A38] | Dow Jones | 2001–2017 | Realized volatility | H = one day ahead | L-HAR-X L-NN | MSE (0.880) |
| [A39] | S&P 500 FTSE-100 KSE-100 KLSE BSESN | 2013–2020 | Realized volatility | H = one day ahead | DCC-GARCH-MANN | RMSE (7.123), MAE (1.467), RMAE (0.336) |
| [A40] | SSEC S&P500 FTSE | 2000–2022 | Realized volatility | H = 5/22 min ahead | GVMD-Q-DBN-LSTM-GRU | MAE (3.5036 × 10⁻⁵), MSE (8.6934 × 10⁻⁹), HMAE (0.5650), HMSE (1.0084) |
| Art | Simulation Model | Dataset a | Period | Measurement | Method b | Performance Criteria c |
|---|---|---|---|---|---|---|
| [A18] | Statistical Recurrent Stochastic Volatility Model | DAX30 HSI50 CAC40 S&P500 TSX250 | 2004–2016 2003–2015 2004–2016 2004–2016 2004–2016 | Stochastic Volatility | SR-SV using Density Tempered Sequential Monte Carlo | PPS (1.720), QLIKE (0.588), R2LOG (0.399), MSE (0.733), MAE (0.548) PPS (1.127), QLIKE (0.355), R2LOG (0.294), MSE (0.060), MAE (0.152) PPS (1.381), QLIKE (0.856), R2LOG (0.354), MSE (0.095), MAE (0.210) PPS (1.381), QLIKE (0.856), R2LOG (0.354), MSE (0.095), MAE (0.210) PPS (1.113), QLIKE (0.330), R2LOG (0.527), MSE (0.091), MAE (0.209) |
| [A21] | Quantile Autoregression Neural Network Model | HSI, S&P500 FTSE100 | 2008–2013 | Value at Risk | Riskmetric GARCH + EVT CAViaR QRNN APARCH PCC QARNN-1 QARNN-2 (Monte Carlo) | Risk (9.00), RSME (5.17), MAE (3.90) Risk (0.35), RSME (3.65), MAE (2.89) Risk (0.42), RSME (4.15), MAE (1.65) Risk (1.80), RSME (1.45), MAE (0.41) Risk (11.57), RSME (4.63), MAE (2.56) Risk (16.68), RSME (4.86), MAE (1.89) Risk (0.08), RSME (1.18), MAE (1.72) Risk (0.19), RSME (0.69), MAE (0.19) |
| [A26] | Candidate Point Selection Using a Self-Attention Mechanism | S&P500 KOSPI200 | 2016–2019 | Volatility Surface | SABR Model | Relative error (mean and standard deviation) SSM + CSM (transformer): 1.2741, 1.0532 SSM only (transformer): 1.4739, 1.2784 SSM + CSM(MLP): 1.5850, 1.1235 SSM only (MLP): 1.7403, 1.1373 SSM + CSM(CNN): 1.6732, 1.2315 SSM only (CNN): 1.8518, 1.2682 SSM + CSM(SVR): 1.7702, 1.1239 SSM only (SVR): 2.2789, 1.0545 SSM + CSM (transformer): 1.3130, 0.7186 SSM only (transformer): 1.4989, 0.8686 SSM + CSM(MLP): 2.1013, 1.6081 SSM only (MLP): 2.6868, 1.9327 SSM + CSM(CNN): 1.2863, 0.7259 SSM only (CNN): 1.5581, 0.8248 SSM + CSM(SVR): 1.9798, 1.4533 SSM only (SVR): 2.7641, 1.9963 |
| [A27] | Robust Kalman Filter Based on a Fuzzy GARCH Model Using Particle Swarm Optimization | TWSE HSI N225 | 1992–2012 | Volatility | Fuzzy + GARCH Model + PSO | MAFE (0.0715), MPFE (0.0564), MSFE (0.0127) MAFE (0.0684), MPFE (0.0473), MSFE (0.0113) MAFE (0.0760), MPFE (0.0334), MSFE (0.1469) |
| [A30] | Meta-Model | S&P500 | 2010–2014 | Volatility Market Capitalization | Quantitative Simulative Empirical Model Monte Carlo | ANOVA |
References
- Allen, D., & Hooper, V. (2018). Generalized correlation measures of causality and forecasts of the VIX using non-linear models. Sustainability, 10, 2695. [Google Scholar] [CrossRef]
- Alostad, H., & Davulcu, H. (2019). Directional prediction of stock prices using breaking news on Twitter. Web Intelligence, 15, 1–17. [Google Scholar] [CrossRef]
- Ayala, J., García-Torres, M., Noguera, J., Vázquez, J., Gómez-Vela, F., & Divina, F. (2021). Technical analysis strategy optimization using a machine learning approach in stock market indices. Knowledge-Based Systems, 225, 107119. [Google Scholar] [CrossRef]
- Bekiros, S., & Georgoutsos, D. (2008a). Direction-of-change forecasting using a volatility-based recurrent neural network. Journal of Forecasting, 27, 407–417. [Google Scholar] [CrossRef]
- Bekiros, S., & Georgoutsos, D. (2008b). Non-linear dynamics in financial asset returns: The predictive power of the CBOE volatility index. The European Journal of Finance, 14, 397–408. [Google Scholar] [CrossRef]
- Berger, D., Chaboud, A. P., & Hjalmarsson, E. (2009). What drives volatility persistence in the foreign exchange market? Journal of Financial Economics, 94, 192–213. [Google Scholar] [CrossRef]
- Bezerra, P., & Albuquerque, P. (2019). Volatility forecasting: The support vector regression can beat the random walk. Economic Computation and Economic Cybernetics Studies and Research, 53, 115–126. [Google Scholar] [CrossRef]
- Campbell, H., & Viceira, J. (2002). Strategic asset allocation. Oxford University Press. [Google Scholar] [CrossRef]
- CBOE Volatility Index (^VIX). (2022). Available online: https://finance.yahoo.com/chart/%5EVIX? (accessed on 20 October 2022).
- Chkili, W., & Hamdi, M. (2021). An artificial neural network augmented GARCH model for Islamic stock market volatility: Do asymmetry and long memory matter? International Journal of Islamic and Middle Eastern Finance and Management, 14, 853–873. [Google Scholar] [CrossRef]
- Cho, P., & Lee, M. (2022). Forecasting the volatility of the stock index with deep learning using asymmetric hurst exponents. Fractal and Fractional, 6, 394. [Google Scholar] [CrossRef]
- Christensen, K., Siggaard, M., & Veliyev, B. (2023). A machine learning approach to volatility forecasting. Journal of Financial Econometrics, 21, 1680–1727. [Google Scholar] [CrossRef]
- De Gaetano, D. (2019). Forecasting volatility using combination across estimation windows: An application to S&P500 stock market index. Mathematical Biosciences and Engineering, 16, 7125–7216. [Google Scholar] [CrossRef]
- Dow Jones–DJIA–100 Year Historical Chart. (2023). Available online: https://www.macrotrends.net/1319/dow-jones-100-year-historical-chart (accessed on 20 October 2023).
- Fatima, S., & Uddin, M. (2022). On the forecasting of multivariate financial time series using hybridization of DCC-GARCH model and multivariate ANNs. Neural Computing and Applications, 34, 21911–21925. [Google Scholar] [CrossRef]
- Gao, T., & Chai, Y. (2018). Improving stock closing price prediction using recurrent neural network and technical indicators. Neural Computation, 30, 2833–2854. [Google Scholar] [CrossRef]
- Gao, Y., He, D., Mu, Y., & Zhao, H. (2023). Realised volatility prediction of high-frequency data with jumps based on machine learning. Connection Science, 35, 2210625. [Google Scholar] [CrossRef]
- Gong, X., Liu, X., Xiong, X., & Zhuang, X. (2019). Forecasting stock volatility process using improved least square support vector machine approach. Soft Computing, 23, 11867–11881. [Google Scholar] [CrossRef]
- Greenspan, A. (2008). The age of turbulence: Adventures in a new world. Penguin Books. [Google Scholar]
- Hayes, A. (2022). Tulipmania: About the Dutch tulip bulb market bubble. Available online: https://www.investopedia.com/terms/d/dutch_tulip_bulb_market_bubble.asp (accessed on 25 March 2024).
- Hoffmann, F., Allers, K., Rombey, T., Helbach, J., Hoffmann, A., Mathes, T., & Pieper, D. (2021). Nearly 80 systematic reviews were published each day: Observational study on trends in epidemiology and reporting over the years 2000–2019. Journal of Clinical Epidemiology, 138, 1–11. [Google Scholar] [CrossRef]
- Hördahl, P., & Packer, F. (2007). Understanding asset prices: An overview. Bank for International Settlements. Available online: https://www.bis.org/publ/bppdf/bispap34.htm (accessed on 14 July 2023).
- Hu, H., Tang, L., Zhang, S., & Wang, H. (2018). Predicting the direction of stock markets using optimized neural networks with Google Trends. Neurocomputing, 285, 188–195. [Google Scholar] [CrossRef]
- Hung, J. (2015). Robust Kalman filter based on a fuzzy GARCH model to forecast volatility using particle swarm optimization. Soft Computing, 19, 2861–2869. [Google Scholar] [CrossRef]
- Hung, J. (2016). Fuzzy support vector regression model for forecasting stock market volatility. Journal of Intelligent & Fuzzy Systems, 31, 1987–2000. [Google Scholar] [CrossRef]
- International Organization for Standardization. (2018). Second edition: Risk management—Guidelines: 8.2 (ISO Standard 31000:2018). International Organization for Standardization.
- Kaczmarek, T., Będowska-Sójka, B., Grobelny, P., & Perez, K. (2022). False safe haven assets: Evidence from the target volatility strategy based on recurrent neural network. Research in International Business and Finance, 60, 101610. [Google Scholar] [CrossRef]
- Khan, W., Ghazanfar, M. A., Azam, M. A., Karami, A., Alyoubi, K. H., & Alfakeeh, A. S. (2022). Stock market prediction using machine learning classifiers and social media, news. Journal of Ambient Intelligence and Humanized Computing, 13, 3433–3456. [Google Scholar] [CrossRef]
- Khashanah, K., & Alsulaiman, T. (2016). Network theory and behavioral finance in a heterogeneous market environment. Complexity, 21, 530–554. [Google Scholar] [CrossRef]
- Kim, H., Park, K., Jeon, J., Song, C., Bae, J., Kim, Y., & Kang, M. (2021). Candidate point selection using a self-attention mechanism for generating a smooth volatility surface under the SABR model. Expert Systems with Applications, 173, 11640. [Google Scholar] [CrossRef]
- Kim, H. Y., & Won, C. H. (2018). Forecasting the volatility of stock price index: A hybrid model integrating LSTM with multiple GARCH-type models. Expert Systems with Applications, 103, 25–37. [Google Scholar] [CrossRef]
- Lahmiri, S. (2015). Intraday stock price forecasting based on variational mode decomposition. Journal of Computational Science, 12, 23–27. [Google Scholar] [CrossRef]
- Lame, G. (2019). Systematic literature reviews: An introduction. Proceedings of the Design Society: International Conference on Engineering Design, 1(1), 1633–1642. [Google Scholar] [CrossRef]
- Lin, C., Chen, C. S., & Chen, A. (2018). Using intelligent computing and data stream mining for behavioral finance associated with market profile and financial physics. Applied Soft Computing, 68, 756–764. [Google Scholar] [CrossRef]
- Lin, Y., Lin, Z., Liao, Y., Li, Y., Xu, J., & Yan, Y. (2022). Forecasting the realized volatility of stock price index: A hybrid model integrating CEEMDAN and LSTM. Expert Systems with Applications, 206, 117736. [Google Scholar] [CrossRef]
- Litimi, H., BenSaïda, A., Belkacem, L., & Abdallah, O. (2018). Chaotic behavior in financial market volatility. Journal of Risk, 21, 27–53. [Google Scholar] [CrossRef]
- Liu, F., & Wang, J. (2012). Fluctuation prediction of stock market index by Legendre neural network with random time strength function. Neurocomputing, 83, 12–21. [Google Scholar] [CrossRef]
- McMillan, L. (2002). Options as a strategic investment (5th ed.). Penguin. [Google Scholar]
- Mongeon, P., & Paul-Hus, A. (2016). The journal coverage of Web of Science and Scopus: A comparative analysis. Scientometrics, 106, 213–228. [Google Scholar] [CrossRef]
- Moon, K., & Kim, H. (2019). Performance of deep learning in prediction of stock market volatility. Economic Computation and Economic Cybernetics Studies and Research, 53, 77–92. [Google Scholar] [CrossRef]
- Mulcahy, R. (2022). PMP exam prep, what you really need to know to pass the exam (10th ed.). RMC Publications. [Google Scholar]
- Naidu, S. (2018). Managing fiscal volatility in the Pacific. MPFD Policy Briefs No. 75. United Nations ESCAP. Available online: https://econpapers.repec.org/scripts/redir.pf?u=http%3A%2F%2Fwww.unescap.org%2Fsites%2Fdefault%2Ffiles%2FMPFD%2520Policy%2520Brief%252075_Managing%2520fiscal%2520volatility%2520in%2520the%2520Pacific.pdf;h=repec:unt:pbmpdd:pb75 (accessed on 28 February 2023).
- Nguyen, T., Tran, M., Gunawan, D., & Kohn, R. (2023). A statistical recurrent stochastic volatility model for stock markets. Journal of Business and Economic Statistics, 41, 414–428. [Google Scholar] [CrossRef]
- Ou, P., & Wang, H. (2014). Volatility modelling and prediction by hybrid support vector regression with chaotic genetic algorithms. The International Arab Journal of Information Technology, 11, 287–292. Available online: https://iajit.org/PDF/vol.11,no.3/4788.pdf (accessed on 28 February 2023).
- Page, M., Moher, D., Bossuyt, P., Boutron, I., Hoffmann, T., Mulrow, C., Shamseer, L., Tetzlaff, J. M., Akl, E. A., Brennan, S., Chou, R., Glanville, J., Grimshaw, J. M., Hróbjartsson, A., Lalu, M. M., Li, T., Loder, E. W., Mayo-Wilson, E., McDonald, S., … McKenzie, J. E. PRISMA 2020 explanation and elaboration: Updated guidance and exemplars for reporting systematic reviews. BMJ, 372, n160. [CrossRef] [PubMed]
- Petneházi, G., & Gáll, J. (2019). Exploring the predictability of range-based volatility estimators using recurrent neural networks. Intelligent Systems in Accounting, Finance and Management, 4, 774–785. [Google Scholar] [CrossRef]
- Petrozziello, A., Troiano, L., Serra, A., Jordanov, I., Storti, G., Tagliaferri, R., & La Rocca, M. (2022). Deep learning for volatility forecasting in asset management. Soft Computing, 26, 8553–8574. [Google Scholar] [CrossRef]
- Poon, S., & Granger, C. (2003). Forecasting volatility in financial markets: A review. Journal of Economic Literature, 41, 478–539. [Google Scholar] [CrossRef]
- Ramos-Pérez, E., Alonso-González, P., & Núñez-Velázquez, J. (2019). Forecasting volatility with a stacked model based on a hybridized artificial neural network. Expert Systems with Applications, 129, 1–9. [Google Scholar] [CrossRef]
- Rhoads, R. (2011). Trading VIX derivatives: Trading and hedging strategies using VIX futures, options, and exchange-traded notes. John Wiley & Sons, Inc. [Google Scholar] [CrossRef]
- Ross, S. (2018). Finanzas corporativas (13th ed.). McGraw-Hill. [Google Scholar]
- Seo, M., Lee, S., & Kim, G. (2019). Forecasting the volatility of stock market index using the hybrid models with Google domestic trends. Fluctuation Noise Letters, 18, 1950006. [Google Scholar] [CrossRef]
- Sezer, O. B., Gudelek, M. U., & Ozbayoglu, A. M. (2020). Financial time series forecasting with deep learning: A systematic literature review: 2005–2019. Applied Soft Computing, 90, 106181. [Google Scholar] [CrossRef]
- Shen, C., Feng, L., & Li, Y. (2018). A hybrid information capturing methodology for price volatility and its application to financial markets. Journal of Intelligent & Fuzzy Systems, 35, 405–414. [Google Scholar] [CrossRef]
- Sheu, S., Lin, C., Lu, S., Tsai, H., & Chen, Y. (2016). Forecasting the volatility of a combined multi-country stock index using GWMA algorithms. Expert Systems, 35, e12248. [Google Scholar] [CrossRef]
- Shiguihara, P., De Andrade Lopes, A., & Mauricio, D. (2021). Dynamic Bayesian network modeling, learning, and inference: A survey. IEEE Access, 9, 117639–117648. [Google Scholar] [CrossRef]
- Stapf, J., & Werner, T. (2003). How wacky is the DAX? The changing structure of German stock market volatility. (Bundesbank Series 1 Discussion Paper No. 2003, 18p). SSRN. [Google Scholar] [CrossRef]
- Stoner, J., & Freeman, R. (1992). Management. Prentice Hall. [Google Scholar]
- Tello, N. (1998). Periodismo actual: Guía para la acción. Ediciones Colihue SRL. [Google Scholar]
- Trierweiler Ribeiro, G., Portela Santos, A., Cocco Mariani, V., & dos Santos Coelho, L. (2020). Novel hybrid model based on echo state neural network applied to the prediction of stock price return volatility. Expert Systems with Applications, 184, 115490. [Google Scholar] [CrossRef]
- Villegas-Ortega, J., Bellido-Boza, L., & Mauricio, D. (2021). Fourteen years of manifestations and factors of health insurance fraud, 2006–2020: A scoping review. Health and Justice, 9, 26. [Google Scholar] [CrossRef] [PubMed]
- Wallace, M., & Webber, L. (2011). The disaster recovery handbook (2nd ed.). Amacom. [Google Scholar]
- Wang, B., Huang, H., & Wang, X. (2013). A support vector machine based MSM model for financial short-term volatility forecasting. Neural Computing and Applications, 22, 21–28. [Google Scholar] [CrossRef]
- Wang, W., Tang, S., & Li, M. (2021). Advantages of combining factorization machine with elman neural network for volatility forecasting of stock marke. Complexity, 2021, 6641298. [Google Scholar] [CrossRef]
- Wang, W., & Yang, F. (2018). The shale revolution, geopolitical risk, and oil price volatility. Social Science Research Network. [Google Scholar] [CrossRef]
- Withington, J. (2013). Historia mundial de los desastres. Turner. [Google Scholar]
- Xu, Q., Liu, X., Jiang, C., & Yu, K. (2016). Quantile autoregression neural network model with applications to evaluating value at risk. Applied Soft Computing, 49, 1–12. [Google Scholar] [CrossRef]
- Yu, Y., Lin, Y., Hou, X., & Zhang, X. (2023). Novel optimization approach for realized volatility forecast of stock price index based on deep reinforcement learning model. Expert Systems with Applications, 233, 120880. [Google Scholar] [CrossRef]
- Zhang, S., & Fang, W. (2021). Multifractal behaviors of stock indices and their ability to improve forecasting in a volatility clustering period. Entropy, 23, 1018. [Google Scholar] [CrossRef] [PubMed]
- Zhang, W., Li, L., & Zhang, G. (2023). A two-step framework for arbitrage-free prediction of the implied volatility surface. Quantitative Finance, 23, 21–34. [Google Scholar] [CrossRef]

| Inclusion Criteria | Exclusion Criteria |
|---|---|
| Responds to at least one research question. Type of article: Journals indexed in Scopus and WoS. Language: English. Period: January 2003–December 2023. | Areas other than computer science, finance, and economics. Other objects of study, such as cryptocurrency volatility, exchange rates, and commodities. Other aspects of study such as econometric methods. Conference papers are not considered |
| Ranking | |||||||
|---|---|---|---|---|---|---|---|
| Rank | Author | h-Index | Citation(s) in Scopus | Rank | Author | h-Index | Citation(s) in Scopus |
| 1 | Bekiros S.D. | 42 | 37 | 11 | Hung, Jui-Chung | 10 | 10 |
| 2 | Xu, Qifa | 26 | 41 | 12 | Petrozziello, Alessio | 10 | 12 |
| 3 | Allen, David E. | 21 | 13 | 13 | Kim, Ha Young | 7 | 522 |
| 4 | Hu, Hongping | 18 | 151 | 14 | Gao, Tingwei | 7 | 70 |
| 5 | Poon, S.-H. | 17 | 1139 | 15 | Khashanah, Khaldoun | 7 | 18 |
| 6 | Gong, Xiao-Li | 12 | 26 | 16 | Wang, Baohua | 6 | 24 |
| 7 | Christensen, Kim | 12 | 46 | 17 | Wang, Fang | 6 | 3 |
| 8 | Moon, Kyoung-Sook | 12 | 39 | 18 | Cho, Poongjin | 5 | 11 |
| 9 | Lin, Yu | 11 | 64 | 19 | Ou, Phichlang | 5 | 2 |
| 10 | Chkili, Walid | 11 | 8 | 20 | Khan, Wasiat | 3 | 120 |
| Id | Concept | Source | Keywords | |||
|---|---|---|---|---|---|---|
| Return | Risk | Indicator | Period | |||
| D01 | Indicator of uncertainty associated with the profitability of an asset, which tends to play an important role in risk models. | [A8] | X | X | X | - |
| D02 | Degree to which the price of an asset fluctuates and measures the level of uncertainty or risk. | [A10], [A11] | - | X | X | - |
| D03 | Measure of hazard, quantifying dispersion that is not directly observable. | [A14] | - | - | X | - |
| D04 | Variance of returns, serving as a measure of the uncertainty of the returns. | [A18] | X | X | X | - |
| D05 | Measurement of risk in financial markets. | [A22] | - | - | X | - |
| D06 | Speed with which the price or value of a stock, future, or index changes over a period. | [A17] | - | - | X | X |
| D07 | Standard measure of risk in the financial market. | [A34] | - | - | X | - |
| Factor Category | Description |
|---|---|
| News | The narration of events that interest the largest number of readers with or without a connection to those events (Tello, 1998). |
| Politics | A set of activities related to group decision-making and power relations among individuals, including resource allocation or status distribution. Political variables refer to factors that can impact an organization’s operations because of the political environment (Stoner & Freeman, 1992). |
| Irrationality | Irrational exuberance in the face of a warning of a possible overvaluation of stock markets (Greenspan, 2008). |
| Health | The collection of entities that exist in the world, whether naturally occurring or modified without human intervention, and pertains to the significant loss of materials and human lives resulting from natural events or phenomena, such as earthquakes, floods, tsunamis, and landslides (Withington, 2013). |
| Economics | General conditions and trends that can be factors in an organization’s operations (Stoner & Freeman, 1992). |
| War | The impact of geopolitical uncertainty generates volatility in the price of resources (oil, food, raw materials), which impacts real economic activities (W. Wang & Yang, 2018). |
Disclaimer/Publisher’s Note: The statements, opinions and data contained in all publications are solely those of the individual author(s) and contributor(s) and not of MDPI and/or the editor(s). MDPI and/or the editor(s) disclaim responsibility for any injury to people or property resulting from any ideas, methods, instructions or products referred to in the content. |
© 2025 by the authors. Licensee MDPI, Basel, Switzerland. This article is an open access article distributed under the terms and conditions of the Creative Commons Attribution (CC BY) license (https://creativecommons.org/licenses/by/4.0/).
Share and Cite
Mansilla-Lopez, J.; Mauricio, D.; Narváez, A. Factors, Forecasts, and Simulations of Volatility in the Stock Market Using Machine Learning. J. Risk Financial Manag. 2025, 18, 227. https://doi.org/10.3390/jrfm18050227
Mansilla-Lopez J, Mauricio D, Narváez A. Factors, Forecasts, and Simulations of Volatility in the Stock Market Using Machine Learning. Journal of Risk and Financial Management. 2025; 18(5):227. https://doi.org/10.3390/jrfm18050227
Chicago/Turabian StyleMansilla-Lopez, Juan, David Mauricio, and Alejandro Narváez. 2025. "Factors, Forecasts, and Simulations of Volatility in the Stock Market Using Machine Learning" Journal of Risk and Financial Management 18, no. 5: 227. https://doi.org/10.3390/jrfm18050227
APA StyleMansilla-Lopez, J., Mauricio, D., & Narváez, A. (2025). Factors, Forecasts, and Simulations of Volatility in the Stock Market Using Machine Learning. Journal of Risk and Financial Management, 18(5), 227. https://doi.org/10.3390/jrfm18050227