Abstract
This paper examines the impact of different oil price shocks (supply, demand, and risk) on the sectoral indices of Jordan from 4 January 2000 until 24 September 2024 using the TVP connectedness approach of. The results point to the existence of a time dynamic component that governs the relationship between oil shocks and Jordanian sectors’ return and volatility. Within this, periods like the COVID-19 pandemic endured intense spillovers. Moreover, heterogeneity is observed in different oil shocks and sectors in terms of their role in the information transmission mechanism, with particular importance of oil demand shocks. Spillovers from oil shocks to Jordanian sectors’ volatility is stronger than Jordanian sectors’ returns. This paper carries important implications for policy holders, investors, and academics alike.
1. Introduction
The interplay between oil and financial markets has been a rigorous subject of research since the seminal work of Hamilton (1983). However, since then, the literature has evolved into multiple yet parallel strands. Within this, rationalized by the fact that the general index hides important information in terms of the true interactions between oil and specific sectors of the economy, a sectoral approach was adopted (see Mensi, 2019; Li et al., 2012; Tiwari et al., 2018; Caporale et al., 2022; Salisu et al., 2019; Reboredo & Rivera-Castro, 2014; Mensi et al., 2024; Nandha & Brooks, 2009). Another important aspect is that an increase in oil prices can be attributed to different factors, and hence its impact can be contingent on these underlying factors. In this regard, Kilian (2009) proposes that an oil price increase resulting from higher demand can have a stimulus impact on the economy, whereas an increase in oil price triggered by supply constraints has an adverse effect on the economy and financial markets. Examples in this strand of literature include the works of Demirer et al. (2020), Broadstock and Filis (2014), Wang et al. (2013), Maghyereh and Abdoh (2022), Ziadat and Maghyereh (2024), Ziadat and McMillan (2022), and Bastianin et al. (2016). In this paper, we merge these two strands of research to examine the impact of different oil price shocks on the sectoral indices of Jordan using the TVP connectedness approach of Antonakakis et al. (2020).
Despite advancement in renewable energy, oil remains the primary source of energy, meeting a significant portion of global energy needs through its versatile forms, like gasoline, diesel, and jet fuel, which power transportation, electricity generation, and heating. It is also a vital raw material for industries, underpinning the production of plastics, synthetic fibers, and fertilizers, and driving economic growth, particularly in oil-rich countries that rely on it for revenue to fund development projects. Its roles in global trade and the geopolitical power of nations further underscore its economic and political importance, with oil prices influencing trade balances, currency markets, and economic stability. Additionally, its strategic significance in energy security leads countries to prioritize stable oil supplies, maintain strategic reserves, and shape foreign and defense policies to safeguard access to this essential resource.
The Middle East (where Jordan is situated) is, despite floating on oil, plagued by constant conflicts and devastating wars. In the last two years alone, the Syrian regime was toppled, Israel and Iran traded long-term missiles, while Jordan sits in the middle, and war is still raging in Gaza and partially in Lebanon. Thankfully, the country of Jordan remains stable, and while an oil importer, remittances from Jordanian workers in the oil-rich GCC countries constitute an important source of wealth. Moreover, the nation’s currency is pegged to the US dollar and is one of three countries globally that enjoys a free trade agreement with the US (the other two are Canada and Mexico). These distinctive and complex circumstances motivate a dynamic and thorough examination of the links between oil and the Jordanian economy. Furthermore, the Amman Stock Exchange (ASE) has been implementing reforms over the years, but a significant push for reforms has been ongoing since 2023. These reforms are part of the broader economic modernization vision and the strategic plan aimed at enhancing market competitiveness and attracting investments. Recent changes to the Jordanian oil derivatives pricing policy may alter the interaction between the local stock market and the oil market. Specifically, the Jordanian government has been subsidizing energy for decades. However, pushed by the large deficit caused by these subsidies and the inefficiencies associated with them, efforts have been directed toward reforming the oil products pricing mechanism. Interestingly, from 2008 onward, the government took gradual steps to eliminate fuel subsidies and implement a pricing adjustment mechanism that would transfer global price fluctuations directly to domestic consumers.
The relationship between oil prices and financial markets is multifaceted, influencing economic growth, sectoral performance, inflation, monetary policy, exchange rates, investment flows, and geopolitical risk dynamics. As a critical input to production, oil price increases raise costs, reduce corporate profitability, and dampen consumer spending, often leading to slower economic growth and weaker stock market performance, particularly in energy-intensive industries. However, energy companies tend to benefit, creating sectoral winners and losers and prompting portfolio rotations. Higher oil prices can drive inflation, prompting central banks to tighten monetary policy, which can negatively impact both equity markets. Additionally, oil-exporting countries often see currency appreciation, while importers face depreciation, influencing global trade dynamics. Investment flows into commodities rise with oil price changes, while volatility may reduce risk appetite, shifting investor preferences toward safe-haven assets like gold or Treasury bonds. Geopolitical events affecting oil supply amplify market uncertainty, while long-term trends like the global energy transition reshape corporate strategies and valuations. Together, these factors demonstrate the extensive and intricate connections between oil prices and financial markets.
Oil price was traditionally argued to have a negative impact on equity returns (Chen, 2009; Driesprong et al., 2008; Filis, 2010; Park & Ratti, 2008). Yet, Kilian (2009) argued that this view is simplistic, and a proper decomposition of oil prices into distinctive shocks is more appropriate to grasp the full picture of the dynamics. Ready (2018) further refined the distilling of oil shocks using high-frequency market data instead of economic data, as adopted by Kilian (2009). According to Ready (2018), oil producers would profit from price hikes brought on by increased demand for oil but would not be affected by supply disruptions. For example, hydrocarbon producers will sell less products at higher prices when oil extraction issues occur. According to Ready (2018), supply shocks are defined as shifts in the price of oil that are orthogonal to both demand shocks and changes in the VIX, while demand shocks are defined as returns to an index of companies that produce oil and are orthogonal to innovations in the VIX index.
Since its introduction, the Diebold and Yilmaz (2009) spillover index, or connectedness approach, has gained significant popularity due to its numerous advantages. It quantifies spillovers by breaking them down into “own” (within-variable) and “cross” (across-variable) components, enabling a clear understanding of systemic risk sources. The method’s dynamic nature allows for the tracking of interconnectedness over time, particularly during periods of economic or financial turbulence. Its broad applicability makes it valuable across various fields, including financial markets, macroeconomics, and sectoral analysis. The results, often presented as spillover tables or indices, are intuitive and provide insights into directional spillovers, differentiating between shock transmitters and receivers. By incorporating forecast error variance decomposition (FEVD) from vector autoregressive (VAR) models, the approach offers a robust, forward-looking perspective on shock propagation. Furthermore, the framework’s flexibility supports extensions to account for nonlinearities, time-varying parameters, and higher-frequency data, enhancing its utility for policymakers, researchers, and risk managers. Notwithstanding this, the initial methodology had limitations, as the original static and dynamic connectedness approach relied on rolling-window VAR models, where the FEVD depended on variable ordering. This issue was addressed by Diebold and Yilmaz (2012) by integrating the generalized FEVD (GFEVD) into the connectedness framework, making results independent of variable ordering and introducing net pairwise directional connectedness computation. More recently, Antonakakis et al. (2020) proposed a time-varying parameter VAR (TVP-VAR) connectedness model that addresses key drawbacks of the original approach. This advancement eliminates the need for arbitrarily chosen window sizes, avoids data loss, reduces sensitivity to outliers, and adapts better to parameter changes.
The literature in the Jordanian context is remarkably thin; however, a few exceptions include the works of Mensi et al. (2021b), Khalfaoui et al. (2019), Ajmi et al. (2014), Bouri (2015b), and Bouri et al. (2016), who studied the mutual dynamics of oil return and volatility, and MENA nations as a group, with Jordan being one of them. In a more specific endeavor, using a causality in variance approach, Bouri (2015a) examined the risk spillover effects between oil prices and the Jordanian stock market. He found an absence of risk transmission for the pre-subprime crisis period, whereas significant risk spillovers ran from the oil to Jordanian equities in the post-crisis period. Expanding on this, Bouri et al. (2016) found that oil return shocks influence the financial and the services sectors, while their impact is trivial on the industrial sector. Moreover, the researchers reported that there are significant risk spillovers from oil to the industrial sector.
This paper presents multiple contributions to the literature as, to the best of our knowledge, it is the first to merge the TVP connectedness approach with the Ready (2018) oil price decomposition in the Jordanian sectoral context to capture the distinctive dynamics surrounding the interplay between oil shocks and Jordanian sectoral indices. A second contribution stems from the fact that we examine the Jordanian sectors’ (financial, services, and industrial) returns and volatility to have a wider idea of the dynamics. A third of our sample incorporates several periods of market unrest and geopolitical tensions, which enriches our understanding of the dynamics during stable and turbulent periods. In essence, the outcome of the paper carries significant implications for both investors and policymakers. For investors, understanding sectoral sensitivities to oil price fluctuations enables better portfolio diversification, risk management, and sector-specific investment strategies. It also aids in market timing and speculation, allowing investors to capitalize on short-term inefficiencies, and facilitates volatility-aware decision-making by helping allocate capital between high-risk and low-risk sectors based on individual risk tolerance. For policymakers, such an analysis is crucial for ensuring economic stability by designing measures to mitigate adverse impacts on key sectors through subsidies and tax adjustments. Insights into sector-specific effects can guide tailored policies, such as providing support to heavily affected sectors, like the industrial sector, during periods of high oil prices. Policymakers can also use this understanding to manage inflation and adjust monetary policies to balance growth and price stability. Additionally, findings may encourage investment in renewable energy and reduce dependence on oil imports, improving energy security and economic resilience. The results can inform strategies to manage trade imbalances caused by oil price volatility and promote exports in less oil-dependent sectors. Moreover, stabilizing sectors prone to oil price volatility can attract foreign investment and foster growth. Broadly, such analyses help uncover spillover effects across sectors, providing a comprehensive understanding of economic interlinkages, and enable both investors and policymakers to build resilience and strategic planning capabilities to prepare for future oil price shocks.
The results point to the existence of a time dynamic component that governs the relationship between oil shocks and Jordanian sectors’ return and volatility. Within this, periods like the COVID-19 pandemic endured intense spillovers. Moreover, heterogeneity is observed in different oil shocks and sectors in terms of their role in the information transmission mechanism, with particular importance of oil demand shocks. Spillovers from oil shocks to Jordanian sectors’ volatility is stronger than Jordanian sectors’ returns.
2. Methodology
2.1. Oil Price Decomposition
Our methodology, which follows Ready’s (2018) pioneering idea, dissected changes in oil prices into three distinct types: supply, demand, and risk shocks. We used the VIX index, the World Integrated Oil and Gas Producer Index, and the returns on one-month crude oil futures contracts at the New York Mercantile Exchange as proxies for the stock returns of oil-producing companies, as outlined by Ready (2018).
Recognizing that the interaction between risk shocks and oil demand influences oil producers’ returns, we employed a systematic approach to separate these elements. Risk shocks were determined by the residuals of an ARMA (1,1) model applied to the VIX index. Demand shocks are calculated by isolating the percentage of current returns attributable to oil-producing companies that are independent of risk shocks. Lastly, supply shocks are quantified by the portion of the present oil return that remains independent of both demand and risk shocks. By normalizing and constraining these three distinct oil shocks to sum up to the overall change in oil prices, we gained a comprehensive understanding of the complex dynamics at play.
2.2. The TVP-VAR Connectedness Approach
To explore the time-varying linkages of oil price shocks and Jordanian sectors, we estimated a TVP-VAR model with heteroscedastic variance–covariances. Based upon the Bayesian information criterion (BIC), a TVP-VAR(1) model is selected, which can be mathematically formulated as:
y_t = B_t y_{t − 1} + ε_t, ε_t ~ N(0, Σ_t)
vec(B_t) = vec(B_{t − 1}) + v_t, v_t ~ N(0, S_t)
Here, y_t, y_{t − 1}, and ε_t are K × 1-dimensional vectors, while B_t and Σ_t are K × K-dimensional matrices, vec(B_t) and v_t are K2 × 1-dimensional vectors, and S_t is a K2 × K2-dimensional matrix.
As the dynamic connectedness approach of Diebold and Yilmaz (2012, 2014) relies on the generalized forecast error variance decomposition (GFEVD), it is required to transform the TVP-VAR to its TVP-VMA representation using the Wold representation theorem:
y_t = ∑_{h = 0}^{∞} A_{h,t} ε_{t − h}, A_0 = I_K
The H-step-ahead GFEVD models the impact of a shock in series j on series i. It can be formulated as:
φ_{ij,t}^{gen}(H) = [∑_{h = 0}^{H − 1} (e_i′ A_{h,t} Σ_t e_j)^2]/[∑_{h = 0}^{H − 1} (e_i′ A_{h,t} Σ_t A_{h,t}′ e_i)]
gSOT_{ij,t} = φ_{ij,t}^{gen}(H)/∑_{k = 1}^K φ_{ik,t}^{gen}(H)
The scaled GFEVD facilitates the computation of total directional connectedness to (from) all series from (to) series i:
S_{i→·, t}^{gen,to} = ∑_{j = 1, j ≠ i}^K gSOT_{ji,t}
S_{i←·, t}^{gen,from} = ∑_{j = 1, j ≠ i}^K gSOT_{ij,t}
The difference between the to and from total directional connectedness results in the net total directional connectedness of series i:
S_{i,t}^{gen,net} = S_{i→·,t}^{gen,to} − S_{i←·,t}^{gen,from}
2.3. Data and Descriptive Statistics
This study utilized weekly price data for three primary sectoral indices: financials, services, and industries. The data for these indices were sourced from the official Amman Stock Exchange website, while the VIX index, the World Integrated Oil and Gas Producer Index, and the returns on one-month crude oil futures contracts from the DataStream database. The compounded weekly returns were computed as the logarithmic difference between consecutive prices and spanned from 4 January 2000 until 24 September 2024.
Figure 1 presents the return series of the variables used in this study. As an open economy situated in a geopolitically complex region, Jordan has encountered numerous challenges, including the Iraq invasion in 2003, the global financial crisis in 2008, the Arab Spring in 2010, the Syrian civil war beginning in 2011, the COVID-19 outbreak in 2020, and the Russian–Ukrainian conflict in 2022. As depicted in Figure 1, the Jordanian sectoral indices exhibited significant declines and heightened volatility during crises. Notably, the 2008 financial crisis, the COVID-19 pandemic, and the 2022 Russian–Ukrainian conflict have adversely affected the Jordanian economy and stock market, triggering substantial fluctuations. These crises have also led to similar movements in the oil market. The economic slowdown associated with the global financial crisis and pandemic-related restrictions resulted in a sharp decline in crude oil demand. As shown in Figure 1, negative demand shocks have caused substantial drops in oil prices, confirming empirical and theoretical evidence that financial market contagion intensifies during crises (Forbes & Rigobon, 2002; Guo et al., 2011; Akhtaruzzaman et al., 2021; Zhang et al., 2021).
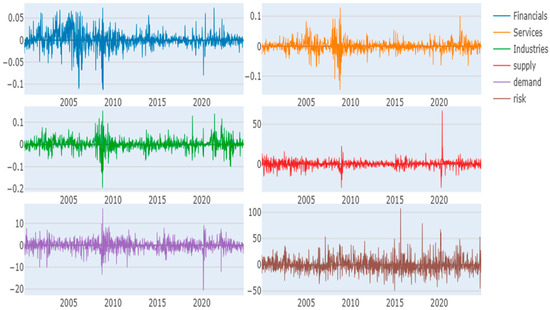
Figure 1.
Dynamic of price returns.
Table 1 presents basic statistics for the return series and various oil shocks. The results indicated that all stock sectors generated positive average returns over the analysis period, with the industrial sector achieving the highest annualized return of 6.4%. In terms of volatility, the industrial sector also exhibited the highest annualized standard deviation of 20%. All three sectoral indices displayed negative skewness, indicating that negative returns were more frequent and severe. Additionally, kurtosis coefficients exceeding three suggested fatter tails than a normal distribution, consistent with findings in prior literature (Choi & Nam, 2008). Among the oil shocks, the risk component exhibited the highest average value and volatility. The significant skewness and excess kurtosis were corroborated by the Jarque–Bera (JB) test, which confirmed that all series deviated from a normal distribution. The ERS unit root test indicated that all series were stationary, while the Ljung–Box test (Q(10) and Q2(10)) suggested the presence of autocorrelation.

Table 1.
The average connectedness table.
3. Empirical Results
This section discusses the time-varying spillover index between Jordanian stock sectors and oil price shocks. Table 2 presents the average spillover index results. The diagonal values in Panel A indicate that each stock sector contributed the most to its own market. For instance, the industrial sector contributed 59.15% to its own market. The results show that the services sector was the primary transmitter of shocks (44.3%), followed by the industrial and financial sectors. Moreover, the financial sector acted as a net receiver of shocks (−0.5%), whereas the industrial sector was a net transmitter (2.49%). Among oil shocks, the demand-side component was the largest transmitter (0.5%). On average, Panel A of Table 2 revealed a total connectedness index of 27.81%.
Table 2.
Dynamic connectedness results.
Panel B reports the average dynamic total volatility connectedness. The total connectedness in this panel was 25.6%, lower than the corresponding total return connectedness. Regarding volatility, all stock sectors were net receivers of shocks, while oil shocks acted as net transmitters. When considering sector volatility instead of returns, the information received by oil shocks was smaller, whereas the shocks transmitted from oil shocks were larger. Among oil shocks, the demand-side component was the primary net transmitter.
Figure 2 depicts the time-evolving total return connectedness index. In general, the figure highlights the existence of a time-varying component in the return connectedness. Notably, total connectedness increased during times of stress. Within this, the figure demonstrates two distinct spikes in the total connectedness index, specifically during the global financial crisis and the COVID-19 pandemic. During the analysis period, the global financial crisis appeared to be associated with the highest level of connectedness among the variables in the system—the connectedness index reached almost 60%. Afterward, the total connectedness started a decreasing trend with some relatively smaller spikes; one of them emerges around 2015, coinciding with the oil price plunge between 2014 and 2016. The economic hardships triggered by the COVID-19 pandemic led to another significant increase in the connectedness index, which reached nearly 45%. Figure 3 shows that regarding the return volatility, the connectedness with oil shocks demonstrated similar time-varying behavior to the dynamic total return connectedness shown in Figure 2.
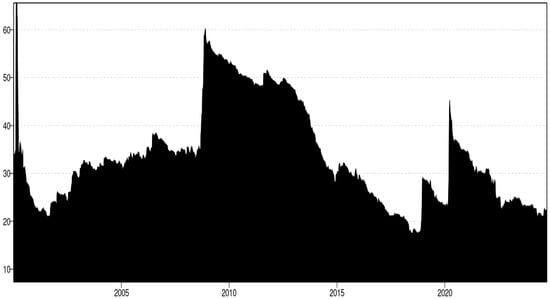
Figure 2.
Dynamic total return connectedness.
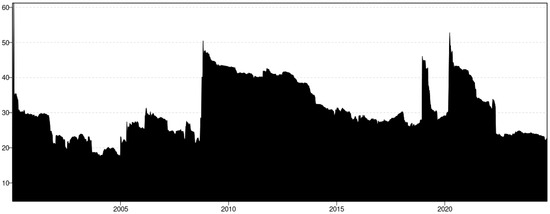
Figure 3.
Dynamic total volatility connectedness.
Figure 4 displays dynamic net directional spillovers among the study variables (return). The observable trend demonstrated that net spillovers changed signs over time. The role of the stock sectors was heterogeneous. Consistent with Table 2, the financial sector was the receiver of shocks for most parts of the analysis period; however, during COVID-19 and post-COVID-19, these sectors acted as net transmitters of shocks. Contrastingly, while the industrial sector was a net transmitter of shocks on average, during the respective period, the sector acted as a net receiver of shocks. Again, in line with Table 2, the supply side of oil shocks was a net receiver most of the time, and this role was intensified during the crisis time. Specifically, during the financial crisis of 2008 and COVID-19, the supply side was the net receiver of shocks. A similar observation applied to the risk side, although to a lesser extent. Interestingly, the demand side was a net transmitter of shock during the COVID-19 pandemic.
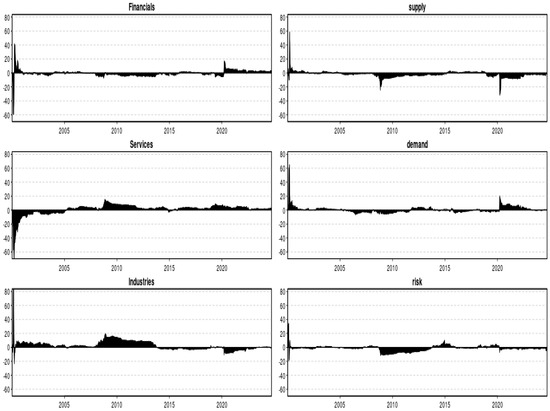
Figure 4.
Net directional spillovers (return).
Figure 5 represents dynamic net connectedness considering the sectors’ volatility. Confirming the results in Panel B of Table 2, Figure 4 reports the net receiver position of the stocks sectors in the Amman Stock Exchange. Obviously, in terms of volatility, the stock market in Jordan is net recipient of shocks, whereas, the oil shocks, especially the demand side during the COVID-19 crisis, were net transmitters of shock.
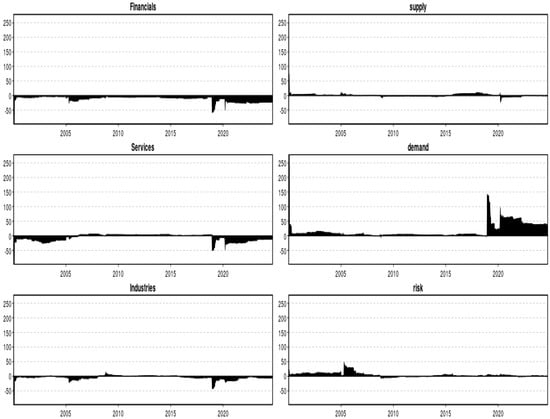
Figure 5.
Net directional spillovers (volatility).
Figure 6 illustrates the pairwise net directional network among the variables. The results indicated that the industrial and services sectors, along with oil demand shocks, were net transmitters. In contrast, the financial sector, oil supply shocks, and oil risk shocks were net receivers. Overall, the stock market predominantly transmitted shocks, while the oil market, particularly the demand component, contributed shocks to both the supply and risk components. This aligns with recent findings emphasizing the stock market’s role in generating shocks (see Maghyereh & Ziadat, 2024).
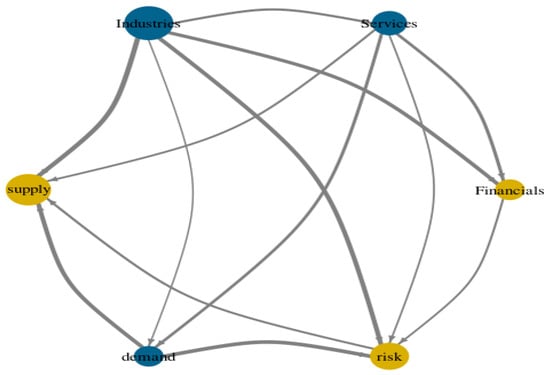
Figure 6.
Pairwise net directional return connectedness network. Notes: Yellow (blue) nodes reveal the net recipients (transmitters) of shocks, respectively. Arrows indicate the direction of net connectedness. The size of the nodes represents the strength of net connectedness.
Figure 7 represents the volatility connectedness network. Consistent with Panel A of Table 2, the stock returns and volatility demonstrated different transmission patterns. Unlike stock returns, volatility shocks flowed from the oil shocks in Jordanian sectors, with the oil demand component serving as the primary contributor to stock market uncertainty.
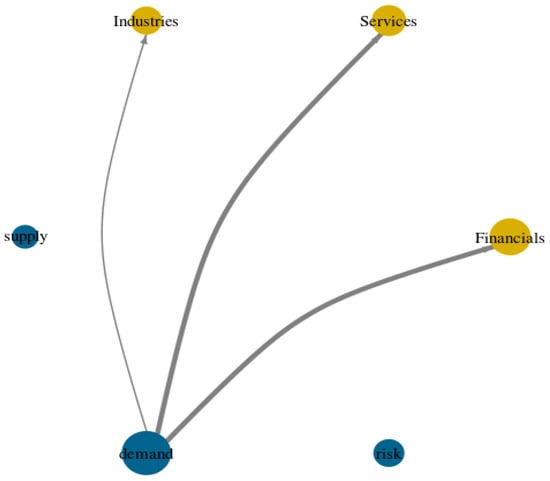
Figure 7.
Pairwise net directional volatility connectedness network.
4. Discussion
In accordance with the Arbitrage Pricing Theory, which relates stock returns with their exposure to multiple risk factors, the analysis of the connectedness among the main sectoral indexes of the Amman Stock Exchange and the oil shocks revealed many important insights. The connectedness was time varying, which is consistent with the previous academic papers (Antonakakis et al., 2017; Umar et al., 2021; Adekoya et al., 2022; Sevillano et al., 2024). This can be explained by the time-varying behavior of the consumers and companies (Kang et al., 2015). Furthermore, the empirical results in this study demonstrated a notable shift in the connectedness level among the variables during periods of crisis and market instability. This was inferred from the significant increase in the total connectedness index during and after the market stress times, such as the global financial crisis of 2008 and the COVID-19 pandemic. Such time-varying movement in the spillover effects confirmed the empirical and theoretical evidence that the contagion among the assets in the financial economy was stronger during the crisis (see Forbes & Rigobon, 2002; Guo et al., 2011; Akhtaruzzaman et al., 2021; Zhang et al., 2021). Similar findings were reported on the rises of connectedness between the oil and the stock markets in times of instability (Sadorsky, 2014; Antonakakis et al., 2017; Tiwari et al., 2018; Mensi et al., 2021a; Maghyereh & Abdoh, 2021; Umar et al., 2021; Ziadat et al., 2024; Sevillano et al., 2024). Another significant change coincided with geopolitical tensions (i.e., the US–China tension in 2018). Ziadat et al. (2024) highlighted the intervention of the geopolitical tensions in shaping the spillover effect between the oil market and the stock market. With an increase in economic uncertainty and risk aversion, investors become more aware of the overall financial market’s vulnerability to shocks in common economic fundamentals, thereby increasing interconnection across markets (Sevillano et al., 2024). Such finding is in conformity with the behavioral finance and investor sentiment theory, where panic or euphoria can lead to synchronized asset price movements, even without fundamental linkages.
Regarding the effect of oil shocks, the reported results revealed heterogeneity in the spillover from various sources of oil shocks on the stock market in Jordan. Among the three sources of shocks, the demand side appeared to be the most contributory, whereas the effect of the supply side on the stock market was negligible. These results are in line with the previous evidence that emphasized the importance of demand-side shocks, as opposed to supply-side shocks (see, for example, Hamilton, 2009; Baumeister & Peersman, 2013; Antonakakis et al., 2017). Similar to the behavior of the total connectedness, the connection between oil demand shocks and the stock market intensified during turbulent economic periods. Consistent with the findings reported by Antonakakis et al. (2017), the demand side was a net sender of shocks to the stock market. However, the oil market was a net receiver of shocks from the stock market. Thus, consistent with Gomez-Gonzalez et al. (2020), our results suggested that demand and supply oil shocks are influenced more by stock markets than by external variables. Moreover, the results were consistent with previous evidence from the Jordanian stock sectors. Bouri (2015a) demonstrated the effect of the global financial crisis on the connectedness between the oil prices and the Jordanian stock market returns. He found that the stock market in Jordan was independent of movements in the oil market during the pre-crisis period. However, in the post-crisis period, the stock market became influenced by the shocks generated in the oil market. He also suggested that the oil market and the Jordanian stock market are more correlated on the left tail than the right tail of the distribution. Bouri (2015b) found bidirectional causality between the oil market and the Jordanian stock market after the global financial crisis.
Replacing the stock return with the stock return volatility showed a change to the information flow structure. The Jordanian stock sectors were net receivers of shocks from the oil market, particularly the demand side. This result confirmed higher connectedness between the Jordanian sectors and the oil shocks in the extreme movement. The oil markets were more likely to transmit shocks to the stock market on the extremes. Moreover, this result confirmed the empirical evidence of asymmetric volatility transmissions between oil and stocks in Jordan (see Bouri, 2015a, 2015b).
All the above suggest the importance of understanding the interlink between the Jordanian stocks and the oil market. Firstly, ignoring the heterogeneity may lead to inefficient diversification and risk management strategies for Jordanian firms and the investors in the Amman Stock Exchange. Considering heterogeneity is important for designing optimal portfolio diversification strategies and risk management purposes. Time varying of the connectedness among the examined variables suggests that static analysis will lead to ineffective diversification of risk and failure of hedging. In the calm market state, the Jordanian stocks offer diversification benefits against the fluctuations in the oil market. However, in times of financial stress, this diversification potential diminishes. Therefore, the time-varying nature of interrelationships between the Jordanian stocks and the oil market induces a preference toward the use of time-varying hedging strategies. In Jordan, a heavily oil-importing economy, policymakers have been concerned with designing stabilizing regulations and actions to effectively cushion the impact of oil risk shocks on the local stock market. Empirical evidence in this work offers useful insights in this regard. On this matter, Bouri (2015a, 2015b) suggested that a robust surveillance system should be established to monitor market conditions, along with a circuit breaker that can swiftly respond to oil volatility shocks, particularly during periods of crisis. Furthermore, the results confirmed the ongoing efforts to reduce the dependency of the Jordanian economy on oil imports through the adoption of more sustainable and cost-effective systems.
5. Conclusions
Movements in the oil market are of significant importance to the investors in the financial market. For an oil-importing and financially struggling economy like Jordan, shocks in the oil prices are a source of concern to the policymakers and investors. Policymakers continuously strive to develop procedures aimed at reducing the impact of oil market uncertainty on economic aspects. Investors are also concerned with these movements, which represent a challenge to the performance of their investment strategy. Therefore, understanding the interrelationship between the stock market and oil market is informative to the policymakers and investors in Jordan. This work aimed to investigate the connectedness between the Jordanian stock market sectors and the oil shocks.
Merging the TVP-VAR connectedness approach proposed by Antonakakis et al. (2020) with Ready’s (2018) oil price composition yielded insightful findings. Within this, the connectedness between the Jordanian sectors and oil market was time varying and depended on the source of the shock. Specifically, the connectedness intensified during times of crisis, with the demand side emerging as the most significant source of oil market shocks from the perspective of investors in the Amman Stock Exchange.
Overall, the results outlined in this work suggest several important implications. Firstly, the observed heterogeneity and dynamicity of spillover between the oil shocks and the Jordanian stock sectors offer some informative suggestions to the investors and portfolio managers to construct their portfolios. The time-varying nature of connectedness suggests that investment strategies need to be flexible, requiring continuous monitoring and adjustment to changing market conditions. Moreover, creating an effective hedging strategy, the investors should be considered with demand shocks more than other sources of movement in the oil market. The time-varying connectedness between the stock market and the oil market implies that static hedging against oil risk would lead to an insufficient position. Special attention should be given to the time of the crisis. High connectedness between the stock market and the oil market implies the need for other assets as a hedging instrument. Policymakers need to pay special attention to the dynamic relationships between markets in this study in order to design measures that foster market stability and reduce risks during crises. In this regard, adopting policies to stabilize crude oil prices and ensuring the stability of key sectors is essential. In light of this evidence, the adoption of innovative energy-efficient technologies could reduce the dependency of the Jordanian economy on the oil market (Bouri, 2015a).
Author Contributions
Conceptualization, methodology, validation, formal analysis, and writing, S.A.Z. and M.K. All authors have read and agreed to the published version of the manuscript.
Funding
This research received no external funding.
Institutional Review Board Statement
Not applicable.
Informed Consent Statement
Not applicable.
Data Availability Statement
No new data were created or analyzed in this study. Data sharing is not applicable to this article.
Conflicts of Interest
The author has no relevant financial or non-financial interests to disclose.
References
- Adekoya, O. B., Akinseye, A. B., Antonakakis, N., Chatziantoniou, I., Gabauer, D., & Oliyide, J. (2022). Crude oil and Islamic sectoral stocks: Asymmetric TVP-VAR connectedness and investment strategies. Resources Policy, 78, 102877. [Google Scholar]
- Ajmi, A. N., El-Montasser, G., Hammoudeh, S., & Nguyen, D. K. (2014). Oil prices and MENA stock markets: New evidence from nonlinear and asymmetric causalities during and after the crisis period. Applied Economics, 46(18), 2167–2177. [Google Scholar]
- Akhtaruzzaman, M., Boubaker, S., & Sensoy, A. (2021). Financial contagion during COVID-19 crisis. Finance Research Letters, 38, 101604. [Google Scholar] [CrossRef]
- Antonakakis, N., Chatziantoniou, I., & Filis, G. (2017). Oil shocks and stock markets: Dynamic connectedness under the prism of recent geopolitical and economic unrest. International Review of Financial Analysis, 50, 1–26. [Google Scholar]
- Antonakakis, N., Chatziantoniou, I., & Gabauer, D. (2020). Refined measures of dynamic connectedness based on time-varying parameter vector autoregressions. Journal of Risk and Financial Management, 13(4), 84. [Google Scholar]
- Bastianin, A., Conti, F., & Manera, M. (2016). The impacts of oil price shocks on stock market volatility: Evidence from the G7 countries. Energy Policy, 98, 160–169. [Google Scholar]
- Baumeister, C., & Peersman, G. (2013). Time-varying effects of oil supply shocks on the US economy. American Economic Journal: Macroeconomics, 5(4), 1–28. [Google Scholar] [CrossRef]
- Bouri, E. (2015a). A broadened causality in variance approach to assess the risk dynamics between crude oil prices and the Jordanian stock market. Energy Policy, 85, 271–279. [Google Scholar]
- Bouri, E. (2015b). Oil volatility shocks and the stock markets of oil-importing MENA economies: A tale from the financial crisis. Energy Economics, 51, 590–598. [Google Scholar]
- Bouri, E., Awartani, B., & Maghyereh, A. (2016). Crude oil prices and sectoral stock returns in Jordan around the Arab uprisings of 2010. Energy Economics, 56, 205–214. [Google Scholar]
- Broadstock, D. C., & Filis, G. (2014). Oil price shocks and stock market returns: New evidence from the United States and China. Journal of International Financial Markets, Institutions and Money, 33, 417–433. [Google Scholar]
- Caporale, G. M., Çatık, A. N., Kısla, G. S. H., Helmi, M. H., & Akdeniz, C. (2022). Oil prices and sectoral stock returns in the BRICS-T countries: A time-varying approach. Resources Policy, 79, 103044. [Google Scholar]
- Chen, S. S. (2009). Revisiting the inflationary effects of oil prices. The Energy Journal, 30(4), 141–154. [Google Scholar]
- Choi, P., & Nam, K. (2008). Asymmetric and leptokurtic distribution for heteroscedastic asset returns: The SU-normal distribution. Journal of Empirical Finance, 15(1), 41–63. [Google Scholar] [CrossRef]
- Demirer, R., Ferrer, R., & Shahzad, S. J. H. (2020). Oil price shocks, global financial markets and their connectedness. Energy Economics, 88, 104771. [Google Scholar]
- Diebold, F. X., & Yilmaz, K. (2009). Measuring financial asset return and volatility spillovers, with application to global equity markets. The Economic Journal, 119(534), 158–171. [Google Scholar]
- Diebold, F. X., & Yilmaz, K. (2012). Better to give than to receive: Predictive directional measurement of volatility spillovers. International Journal of Forecasting, 28(1), 57–66. [Google Scholar]
- Diebold, F. X., & Yılmaz, K. (2014). On the network topology of variance decompositions: Measuring the connectedness of financial firms. Journal of Econometrics, 182(1), 119–134. [Google Scholar]
- Driesprong, G., Jacobsen, B., & Maat, B. (2008). Striking oil: Another puzzle? Journal of Financial Economics, 89(2), 307–327. [Google Scholar]
- Filis, G. (2010). Macro economy, stock market and oil prices: Do meaningful relationships exist among their cyclical fluctuations? Energy Economics, 32(4), 877–886. [Google Scholar]
- Forbes, K. J., & Rigobon, R. (2002). No contagion, only interdependence: Measuring stock market comovements. The Journal of Finance, 57(5), 2223–2261. [Google Scholar] [CrossRef]
- Gomez-Gonzalez, J. E., Hirs Garzon, J., & Uribe, J. M. (2020). Giving and receiving: Exploring the predictive causality between oil prices and exchange rates. International Finance, 23(1), 175–194. [Google Scholar]
- Guo, F., Chen, C. R., & Huang, Y. S. (2011). Markets contagion during financial crisis: A regime-switching approach. International Review of Economics & Finance, 20(1), 95–109. [Google Scholar]
- Hamilton, J. D. (1983). Oil and the macroeconomy since World War II. Journal of Political Economy, 91(2), 228–248. [Google Scholar] [CrossRef]
- Hamilton, J. D. (2009). Causes and consequences of the oil shock of 2007-08 (No. w15002). National Bureau of Economic Research. [Google Scholar]
- Kang, W., Ratti, R. A., & Yoon, K. H. (2015). Time-varying effect of oil market shocks on the stock market. Journal of Banking & Finance, 61, S150–S163. [Google Scholar]
- Khalfaoui, R., Sarwar, S., & Tiwari, A. K. (2019). Analysing volatility spillover between the oil market and the stock market in oil-importing and oil-exporting countries: Implications on portfolio management. Resources Policy, 62, 22–32. [Google Scholar] [CrossRef]
- Kilian, L. (2009). Not all oil price shocks are alike: Disentangling demand and supply shocks in the crude oil market. American Economic Review, 99(3), 1053–1069. [Google Scholar] [CrossRef]
- Li, S. F., Zhu, H. M., & Yu, K. (2012). Oil prices and stock market in China: A sector analysis using panel cointegration with multiple breaks. Energy Economics, 34(6), 1951–1958. [Google Scholar] [CrossRef]
- Maghyereh, A., & Abdoh, H. (2021). The impact of extreme structural oil-price shocks on clean energy and oil stocks. Energy, 225, 120209. [Google Scholar] [CrossRef]
- Maghyereh, A., & Abdoh, H. (2022). Extreme dependence between structural oil shocks and stock markets. Resources Policy, 76, 102626. [Google Scholar] [CrossRef]
- Maghyereh, A., & Ziadat, S. A. (2024). Oil price shocks and financial stress: Who is the influencer? International Journal of Finance & Economics, 29(4), 4443–4461. [Google Scholar]
- Mensi, W. (2019). Global financial crisis and co-movements between oil prices and sector stock markets in Saudi Arabia: A VaR based wavelet. Borsa Istanbul Review, 19(1), 24–38. [Google Scholar] [CrossRef]
- Mensi, W., Al Rababa’a, A. R., Vo, X. V., & Kang, S. H. (2021a). Asymmetric spillover and network connectedness between crude oil, gold, and Chinese sector stock markets. Energy Economics, 98, 105262. [Google Scholar] [CrossRef]
- Mensi, W., Al-Yahyaee, K. H., Vo, X. V., & Kang, S. H. (2021b). Modeling the frequency dynamics of spillovers and connectedness between crude oil and MENA stock markets with portfolio implications. Economic Analysis and Policy, 71, 397–419. [Google Scholar] [CrossRef]
- Mensi, W., Ziadat, S. A., Vo, X. V., & Kang, S. H. (2024). Extreme quantile connectedness and spillovers between oil and Vietnamese stock markets: A sectoral analysis. International Journal of Emerging Markets, 19(6), 1586–1625. [Google Scholar] [CrossRef]
- Nandha, M., & Brooks, R. (2009). Oil prices and transport sector returns: An international analysis. Review of Quantitative Finance and Accounting, 33, 393–409. [Google Scholar] [CrossRef]
- Park, J., & Ratti, R. A. (2008). Oil price shocks and stock markets in the US and 13 European countries. Energy Economics, 30(5), 2587–2608. [Google Scholar] [CrossRef]
- Ready, R. C. (2018). Oil prices and the stock market. Review of Finance, 22(1), 155–176. [Google Scholar] [CrossRef]
- Reboredo, J. C., & Rivera-Castro, M. A. (2014). Wavelet-based evidence of the impact of oil prices on stock returns. International Review of Economics & Finance, 29, 145–176. [Google Scholar]
- Sadorsky, P. (2014). Modeling volatility and correlations between emerging market stock prices and the prices of copper, oil and wheat. Energy Economics, 43, 72–81. [Google Scholar] [CrossRef]
- Salisu, A. A., Raheem, I. D., & Ndako, U. B. (2019). A sectoral analysis of asymmetric nexus between oil price and stock returns. International Review of Economics & Finance, 61, 241–259. [Google Scholar]
- Sevillano, M. C., Jareño, F., López, R., & Esparcia, C. (2024). Connectedness between oil price shocks and US sector returns: Evidence from TVP-VAR and wavelet decomposition. Energy Economics, 131, 107398. [Google Scholar]
- Tiwari, A. K., Jena, S. K., Mitra, A., & Yoon, S. M. (2018). Impact of oil price risk on sectoral equity markets: Implications on portfolio management. Energy Economics, 72, 120–134. [Google Scholar]
- Umar, Z., Jareño, F., & Escribano, A. (2021). Static and dynamic connectedness between oil price shocks and Spanish equities: A sector analysis. The European Journal of Finance, 27(9), 880–896. [Google Scholar]
- Wang, Y., Wu, C., & Yang, L. (2013). Oil price shocks and stock market activities: Evidence from oil-importing and oil-exporting countries. Journal of Comparative Economics, 41(4), 1220–1239. [Google Scholar] [CrossRef]
- Zhang, H., Chen, J., & Shao, L. (2021). Dynamic spillovers between energy and stock markets and their implications in the context of COVID-19. International Review of Financial Analysis, 77, 101828. [Google Scholar]
- Ziadat, S. A., & Maghyereh, A. (2024). Energy profile and oil shocks: A dynamic analysis of their impact on stock markets. Eurasian Economic Review, 14(3), 757–780. [Google Scholar]
- Ziadat, S. A., & McMillan, D. G. (2022). Oil-stock nexus: The role of oil shocks for GCC markets. Studies in Economics and Finance, 39(5), 801–818. [Google Scholar]
- Ziadat, S. A., Mensi, W., & Kang, S. H. (2024). Frequency spillovers between oil shocks and stock markets of top oil-producing and-consuming economies. Energy, 291, 130239. [Google Scholar]
Disclaimer/Publisher’s Note: The statements, opinions and data contained in all publications are solely those of the individual author(s) and contributor(s) and not of MDPI and/or the editor(s). MDPI and/or the editor(s) disclaim responsibility for any injury to people or property resulting from any ideas, methods, instructions or products referred to in the content. |
© 2025 by the authors. Licensee MDPI, Basel, Switzerland. This article is an open access article distributed under the terms and conditions of the Creative Commons Attribution (CC BY) license (https://creativecommons.org/licenses/by/4.0/).