1. Introduction
Economic uncertainty and stock market volatility are at levels rarely seen in the history of modern economies. High and increasing levels of inflation, increasing interest rates, a strong U.S. dollar, high cost of inputs, supply chain issues, and capital market anomalies are contributing factors. The daily flux of macro and micro financial news on these changes and their impact on asset prices and returns render the task of building reliable financial econometric models of prediction very complex and high-dimensional. For instance, the simple capital asset pricing model (CAPM) of
Sharpe (
1964) has a penurious record in predicting asset returns (e.g.,
Fama and French 2004), and efforts to improve CAPM’s predictive accuracy have generated a voluminous literature on econometrics models of financial markets (e.g.,
Campbell et al. 1997). Sharpe’s ingenious idea was to formulate a simple and intuitive model of the relationship between expected returns and risk. By construction, this model implied several assumptions that, when relaxed, led to the emergence of the above models. Today, with the availability of large data sets, often called big data, researchers have focused on identifying patterns in such data that can be used in combination with CAPM models to improve predictability. Even for seasoned researchers, it is tasking to keep track of and condense such vast information and what it means for investment decisions. Machine learning (ML) methods are designed to handle large datasets and have shown to have high predictive accuracy, particularly in fields such as biology and computer sciences. Ongoing research in finance investigates whether ML models in those fields can be adapted to improve the predictive performance of traditional asset pricing models in finance.
Israel et al. (
2020) proposed that return prediction is the main task underlying portfolio construction in the investment industry; they also addressed the unique challenges in applying ML to return a prediction and called for establishing realistic expectations for how and where ML is and how it will be impactful in asset management. Israel et al. used a working definition of ML, based on the work of (
Gu et al. 2018), which is “… inchoate and often content specific…to describe (i) a diverse collection of high-dimensional models for statistical prediction, combined with (ii) so called ‘regularization’ methods for model selection and mitigation of overfit, and (iii) efficient algorithms for searching among a vast number of potential model specifications.”
1 Israel et al. further discussed that the application of ML algorithms to finance is different and pointed out the salient characteristics: (a) return prediction is a small data problem, it is not a question that big-data exists (the number of regressors in an econometric model), but the main issue is the number of observations on the dependent variable that can be used to learn from; (b) the signal-to-noise ratio in returns is weak; (c) market agents and technological innovation produce evolving markets; (d) new data sources in the finance industry are unstructured, most have a short history and do not follow the standard row-column format of classical econometric models; and (e) the finance industry requires interpretable models, whereas some successful ML models are mostly black boxes and are considered opaque.
Given the increasing availability of financial data, empirical research with asset pricing models has recently focused on using ML methods and new computational algorithms in search of an improved predictability of returns, volatility, bankruptcy, etc. The new literature on this subject is rapidly evolving, and as illustrated later, the number of published articles on “machine learning in asset pricing” has accelerated; in fact, the number of articles published during the first eight months of 2022 exceeded the total number of articles published in 2021. This article used a recent bibliometric methodology to identify contributions to the theory and practice of ML econometrics in asset pricing over the past decade. The main emphasis of this paper was to review and introduce very recent frontier developments in computational methods. A few of the articles reviewed also identify current and future challenges with the application of ML to asset pricing (referred to ML-CAPM hereafter), and some of these challenges are highlighted throughout this review. This review highlights findings that improve our understanding of ML applicability to asset pricing. The cited literature has very minimal overlap with books and review articles recently published; for example, Nagel’s book and this review have only three references in common: (
Gu et al. 2020,
2021;
and Hamilton 1994). As discussed in the ‘future research’ section of this review, the most recent applications of machine learning to asset pricing converge to a common knowledge view that improved ML computational algorithms with flexible nonlinear specifications can improve return prediction (e.g.,
Gu et al. 2020;
Israel et al. 2020). This finding is consistent with
Klavans and Boyack’s (
2017) results showing that direct citations of seminal works can lead to research fronts in the field of interest. Furthermore, this review article complements previous work on the subject, highlights the above view and similar findings in related areas of finance, and should serve to guide future research in asset pricing.
The paper is structured as follows. The second section provides a compact background to the history of asset pricing models.
Section 3 introduces the bibliometric approach and survey data.
Section 4 presents the bibliometric results, and the top 10 cited papers and computational methods are highlighted in
Section 5, emphasizing properties of various algorithms. The last section complements the existing literature on the future of asset pricing models. It is important to highlight that this review focused on recent contributions on the subject and has very minimal overlap with books and review articles recently published; for example, Nagel’s book and this review article have the following references in common: (
Gu et al. 2020,
2021;
and Hamilton 1994).
2. Background
The capital asset pricing model (CAPM) of
Sharpe (
1964) and
Lintner (
1965) establishes a predictive relationship between expected returns and risk. However, the empirical record of CAPM in predicting asset returns is poor, and, in the search for improved prediction models, given the vast amount of digital data available today, ML methods have found wide applicability. Recent work points out that ML methods are not directly translatable to prediction problems in finance and that judgment must be exercised in adapting machine learning to asset pricing (
Mullainathan and Spiess 2017;
Nagel 2021;
Israel et al. 2020). In retrospect, however, many of the regression-based ML techniques such as ridge-regression, Bayesian models, and models for nonstationary financial time series can be found in most standard econometric textbooks (e.g.,
Box and Jenkins 1970;
Zellner 1971;
Judge et al. 1985;
Hamilton 1994). Books and review articles on CAPM have been the subject of extensive work, and a few examples include
Campbell et al. (
1997),
Dimson and Mussavian (
1999),
Fama and French (
2004),
Perold (
2004), and
Koumou (
2020).
Machine learning CAPM models focus on the prediction of expected returns and offer an alternative for specifying more flexible models. A challenge in ML research is the development of economic theory-data consistent models that improve out-of-sample predictions but also help to identify the factors that contribute to it (e.g.,
Israel et al. 2020;
Nagel 2021)
2. While the history of asset pricing research is rich, the perspectives for continued research look promising (
Brunnermeier et al. 2021), and recent modeling and advances in computational methods contribute to an enhanced understanding of their applicability and interpretation in asset pricing. New neural networks and deep learning algorithms are efficient, flexible, and more accurate in modeling nonlinearities, parsimony, and out-of-sample forecasting. Given the complexity of the methods and the velocity of contributions, we believe students and researchers of asset pricing using ML will benefit from having one up-to-date source on frontier developments that may improve the theory and practice of ML econometrics for capital asset pricing.
While review papers on this theme have frequently appeared in the literature, new models have been introduced over the past two years.
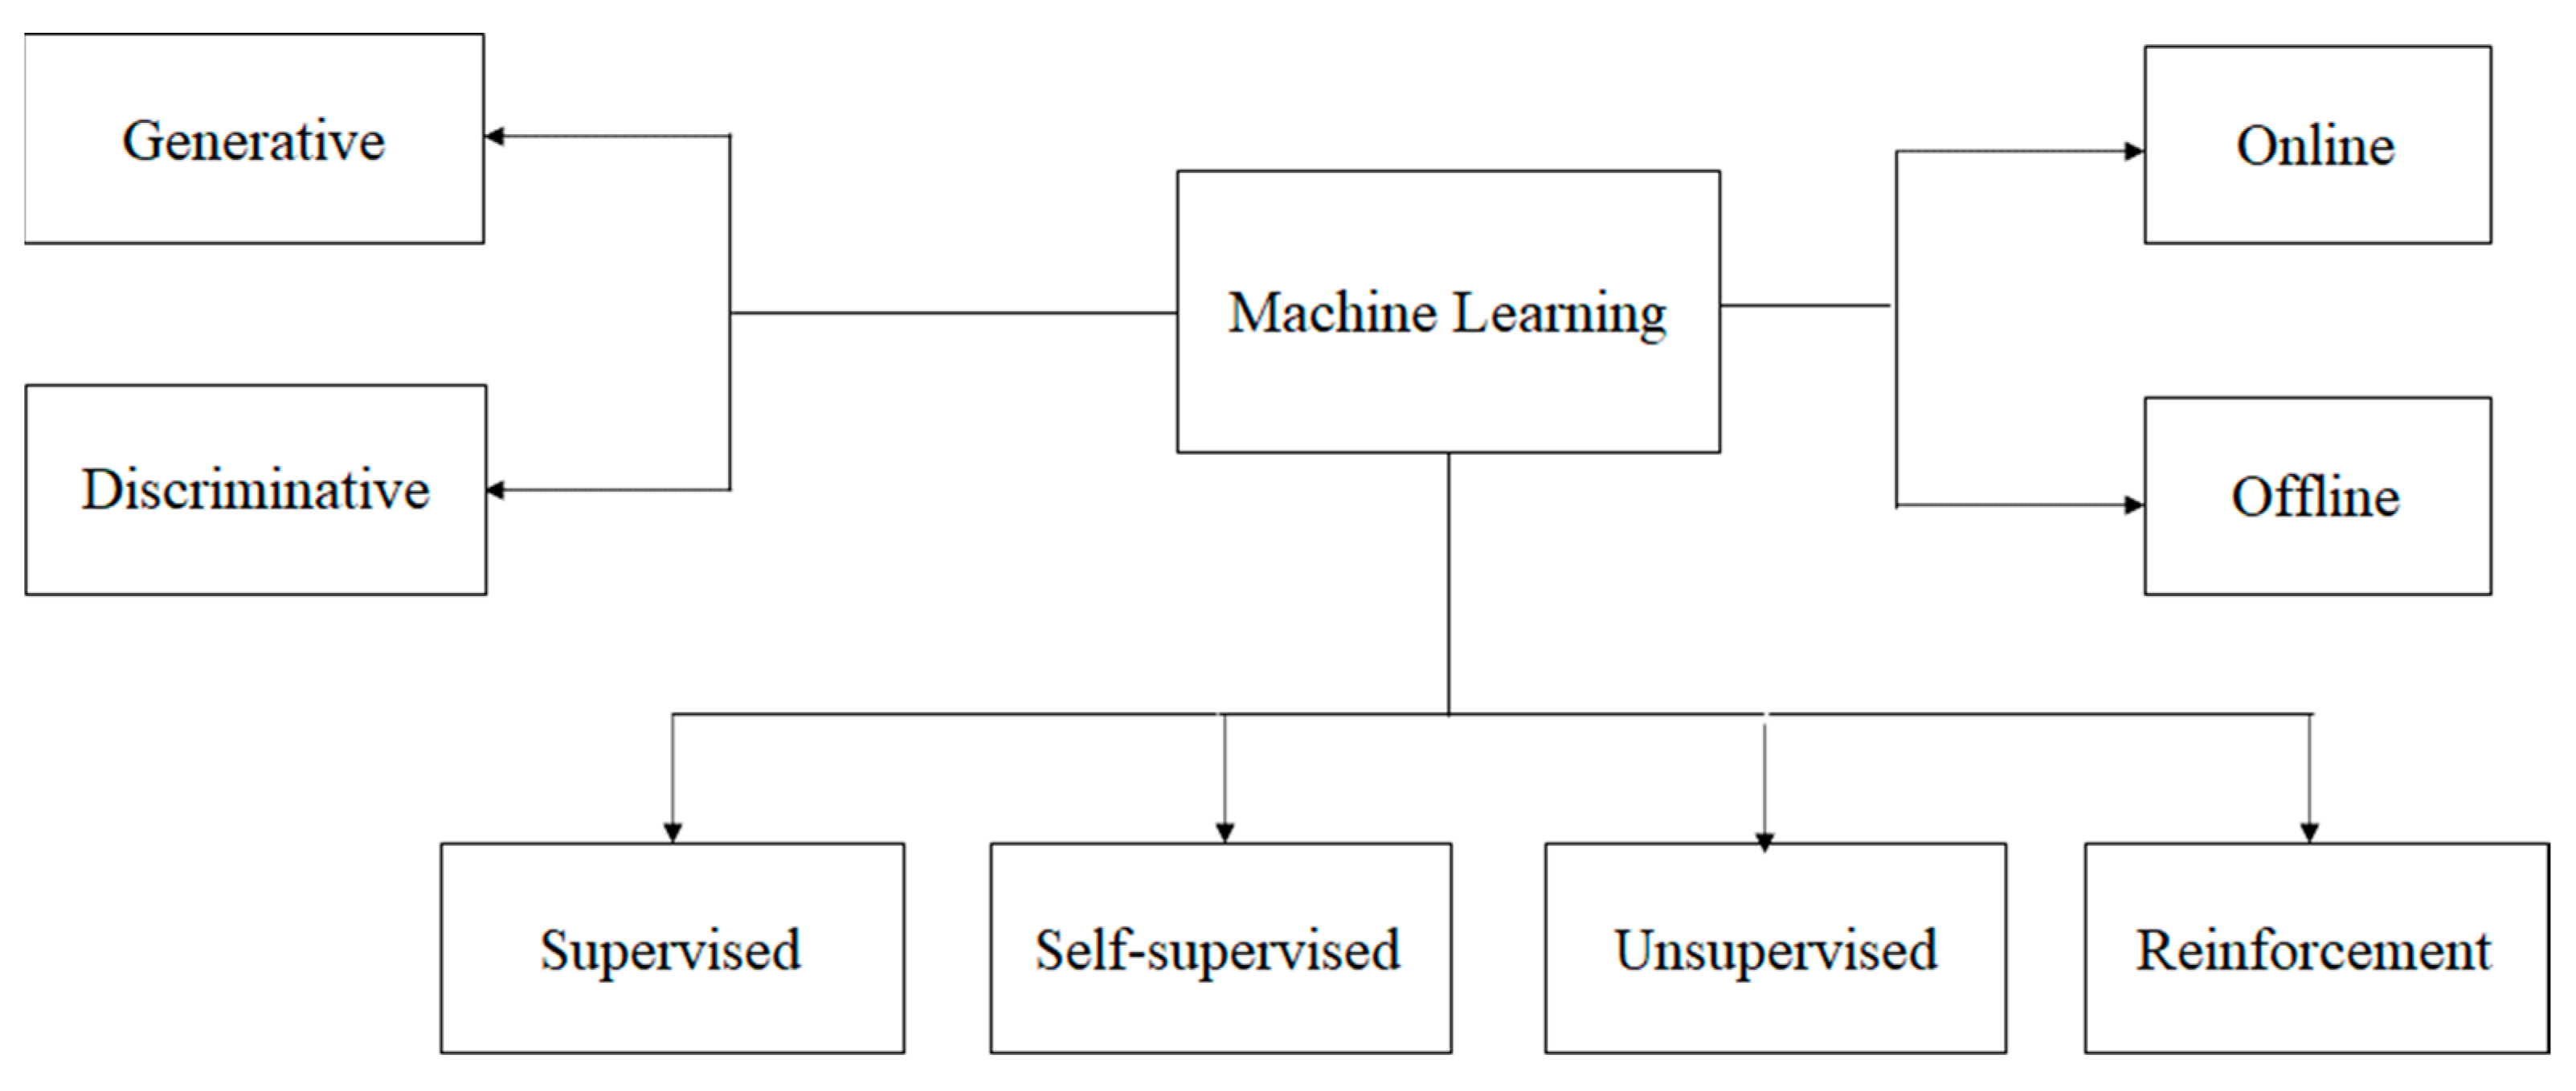
Figure 1 shows the various paradigms of ML, some of which have been advanced in the literature recently; these paradigms were developed in response to different problems in ML and were applied in the review papers we highlight later. Supervised learning techniques (
Bishop 2006) acquire knowledge representations from labeled training data, i.e., they require the availability of the ground truth at training time. Most deep neural network techniques that are trained using back propagation algorithms, support vector machines, etc. (
Bishop 2006), fall in this category. In many areas, such as finance, acquiring large volumes of training data with ground truths is prohibitively expensive or even impossible, since the ground truth labels can only be provided by trained experts who may not always be available at training time. To address this issue, the machine learning community has, in recent times, focused on
low-shot (
Wang et al. 2018) or unsupervised learning techniques. Low-shot techniques attempt to learn knowledge representations from a small amount of labeled training data. Unsupervised learning techniques (e.g., clustering algorithms) (
Bishop 2006) attempt to exploit copious amounts of available unlabeled data to acquire the ability to uncover patterns in data sets. The challenge for unsupervised techniques is to achieve the same level of performance as provided by supervised ones. Recently, there has been excitement in the machine learning community regarding self-supervised learning (
Misra and Maaten 2020), in which the labels for the data are derived from the data itself. Thus, self-supervised learning techniques promise to achieve the performance of supervised ones while retaining the advantages of unsupervised ones. Reinforcement learning techniques (
Sutton and Barto 2018) learn behaviors based on rewards or punishments that they receive from the environment. Discriminative learning techniques (
Bishop 2006) attempt to learn the decision boundaries that separate different classes in a dataset, whereas generative techniques (
Goodfellow et al. 2020) learn the probability distribution underlying a data set. In many applications, learning is conducted offline, and in domains where the environment changes dynamically, online learning algorithms (
Bishop 2006) are used.
This paper departs from previous reviews by using a transparent, objective, and quantitative bibliometric analysis of the literature over the past decade using Web of Science data. This review should serve as a complement to recent works in a few aspects. First, it adds the most recent, methodologically rich articles on machine learning methods applied to asset pricing, with minimal overlap with the existing literature. Second, it focuses on computational and forecast evaluation methods that should prove useful for future research. Third, it identifies the dominant papers over the study period using bibliometrics. Fourth, it provides a global perspective on the origin, by country and institution, of the authors of the published articles and citations, which may strengthen collaboration networks. Additionally, the bibliometric analysis emphasizes two points of view on the applicability of ML to asset pricing; namely, ML applies to linear and nonlinear models in which large data sets exist for the numerous indicator variables predicting the dependent variable (expected returns), and second, ML in asset pricing is a “small-data science” problem in an environment of low signal-to-noise ratio.
4. Bibliometric Results
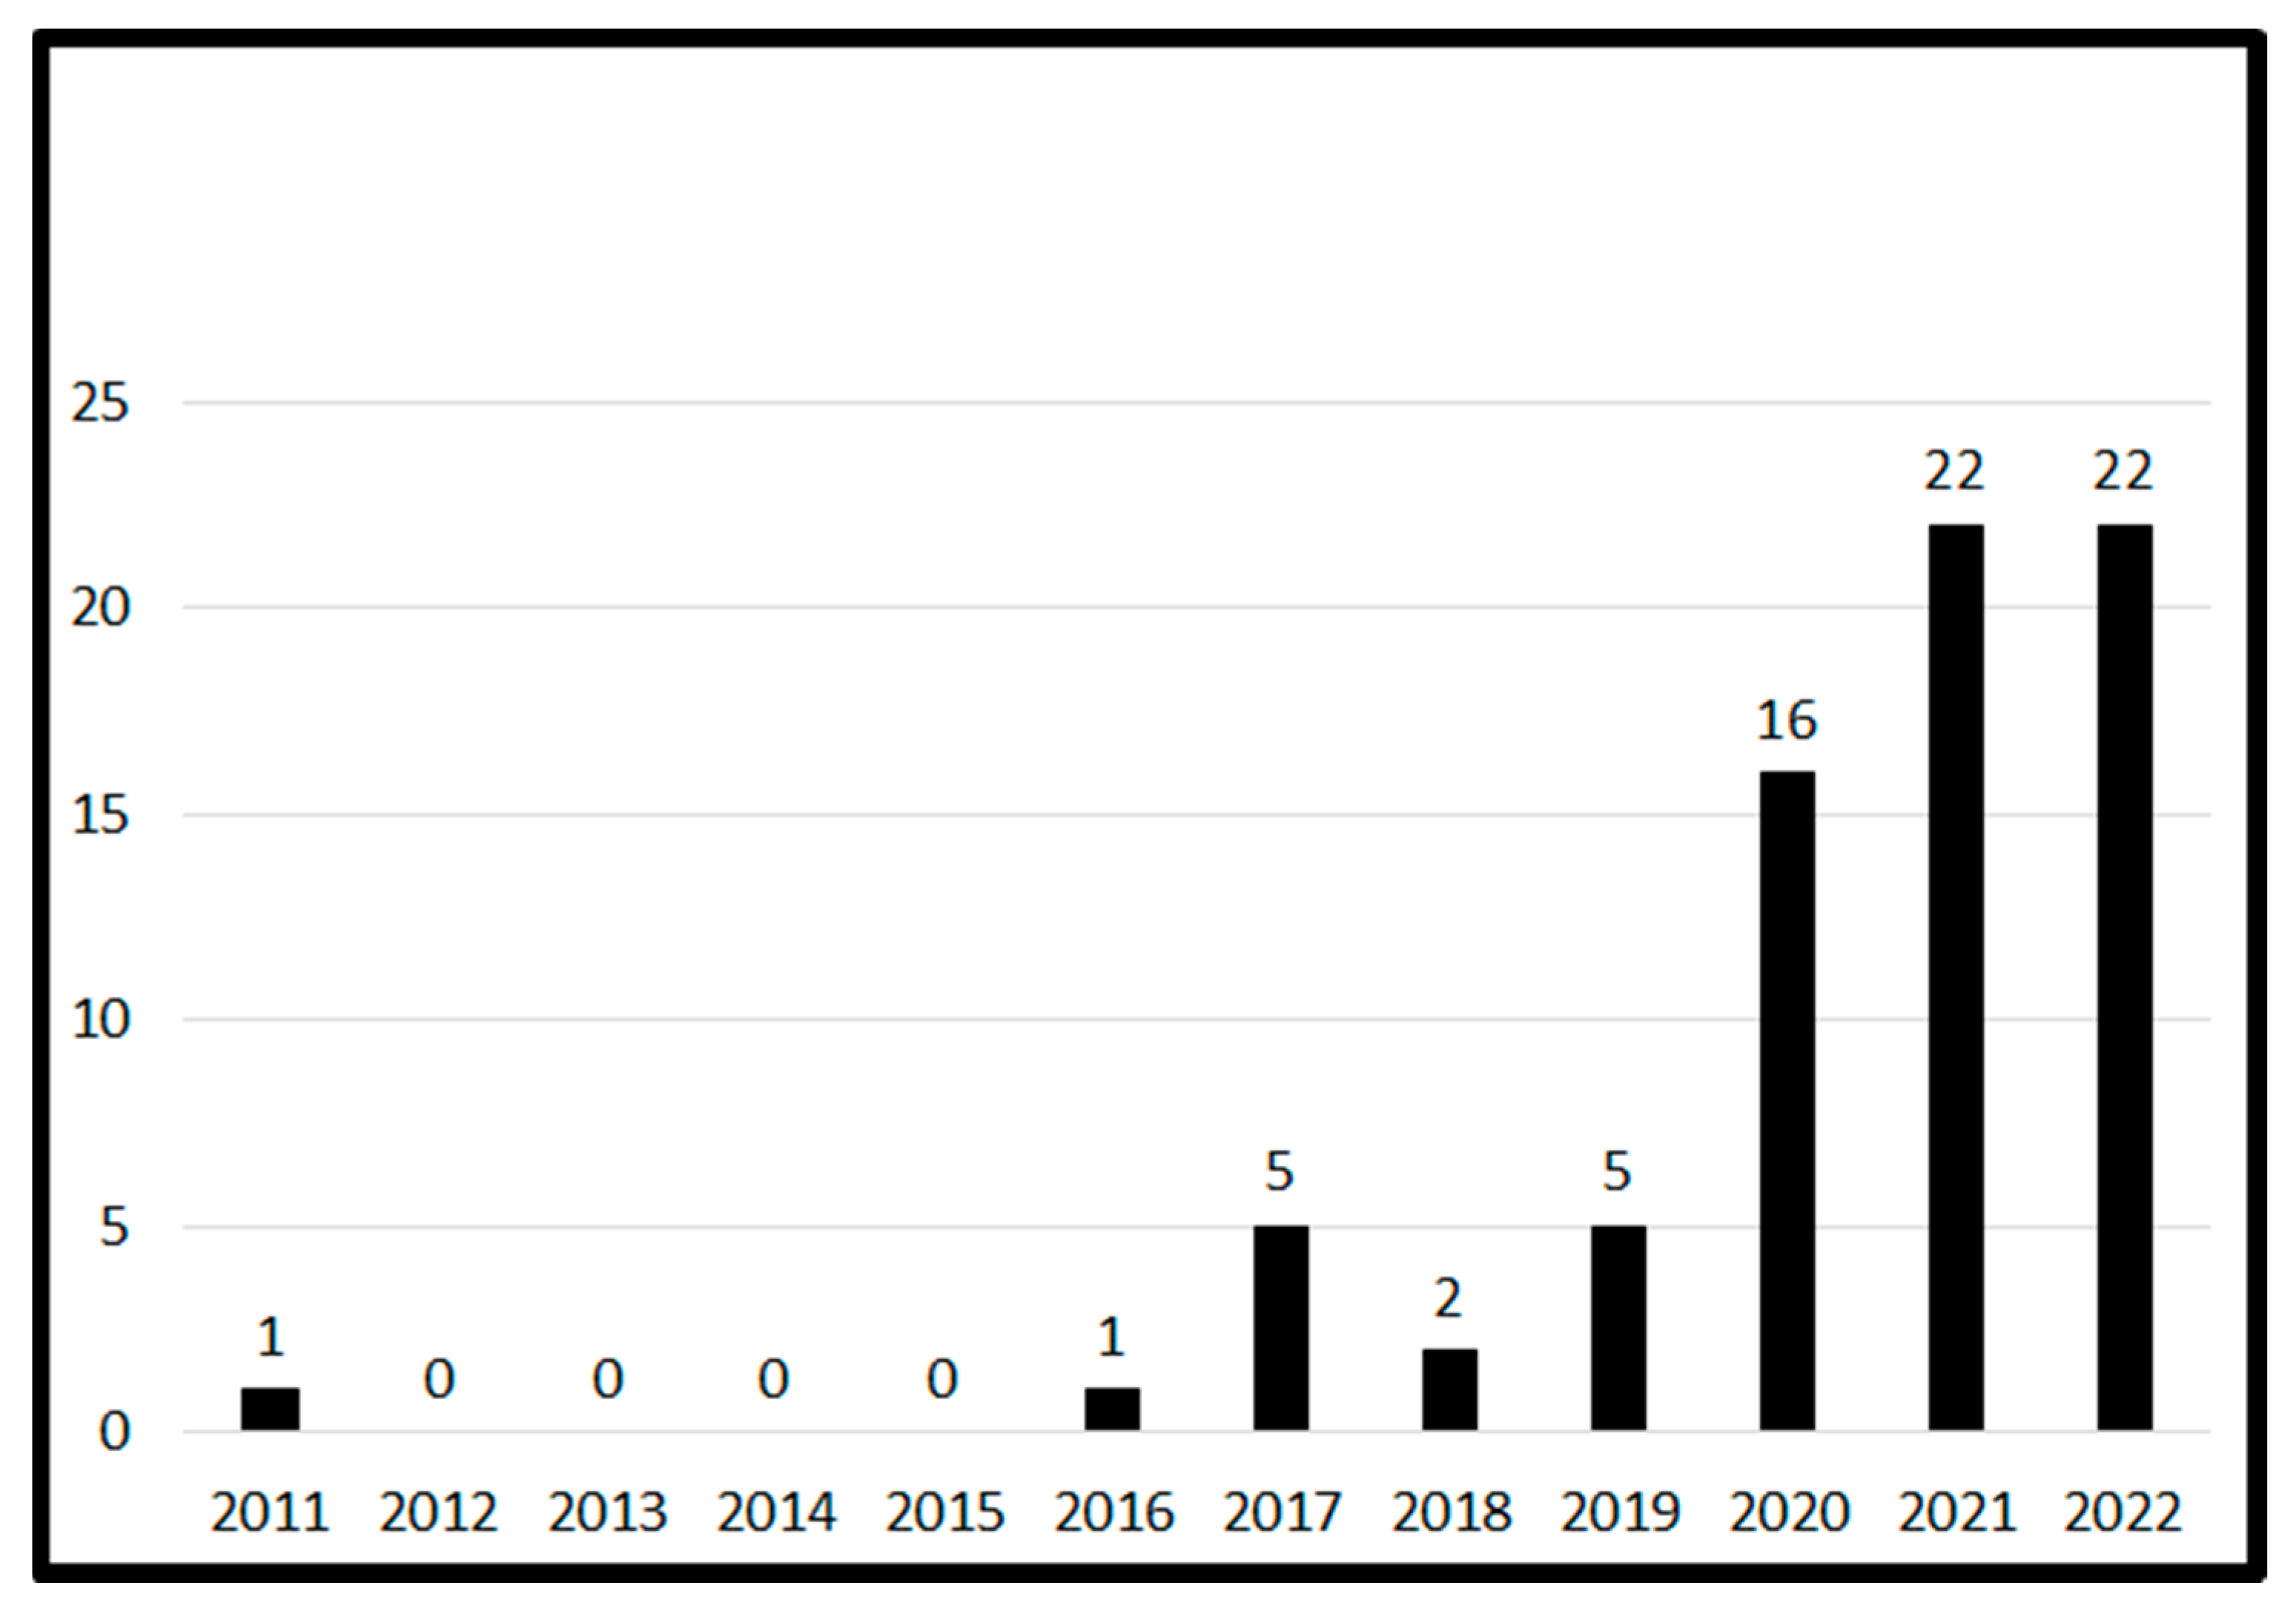
The annual trend in publications of machine learning in capital asset pricing is presented in
Figure 2 and highlights the growth of articles published on ML in asset pricing over the past decade. Over half of the documents were published in the past two years. Note that the number of publications in the first eight months of 2022 already equaled the total published articles in 2021. All documents, except for one in review, were published articles. Over the survey period, the dominant authors were Kelly (3), Xiu (3), and others with two or one articles. Most authors of articles found in this survey were affiliated with the National Bureau of Economic Research, University of Chicago, Yale University, Cornell University, Indian Institute of Management IIM System, Tianjin University, University of London, and the Chinese Academy of Science.
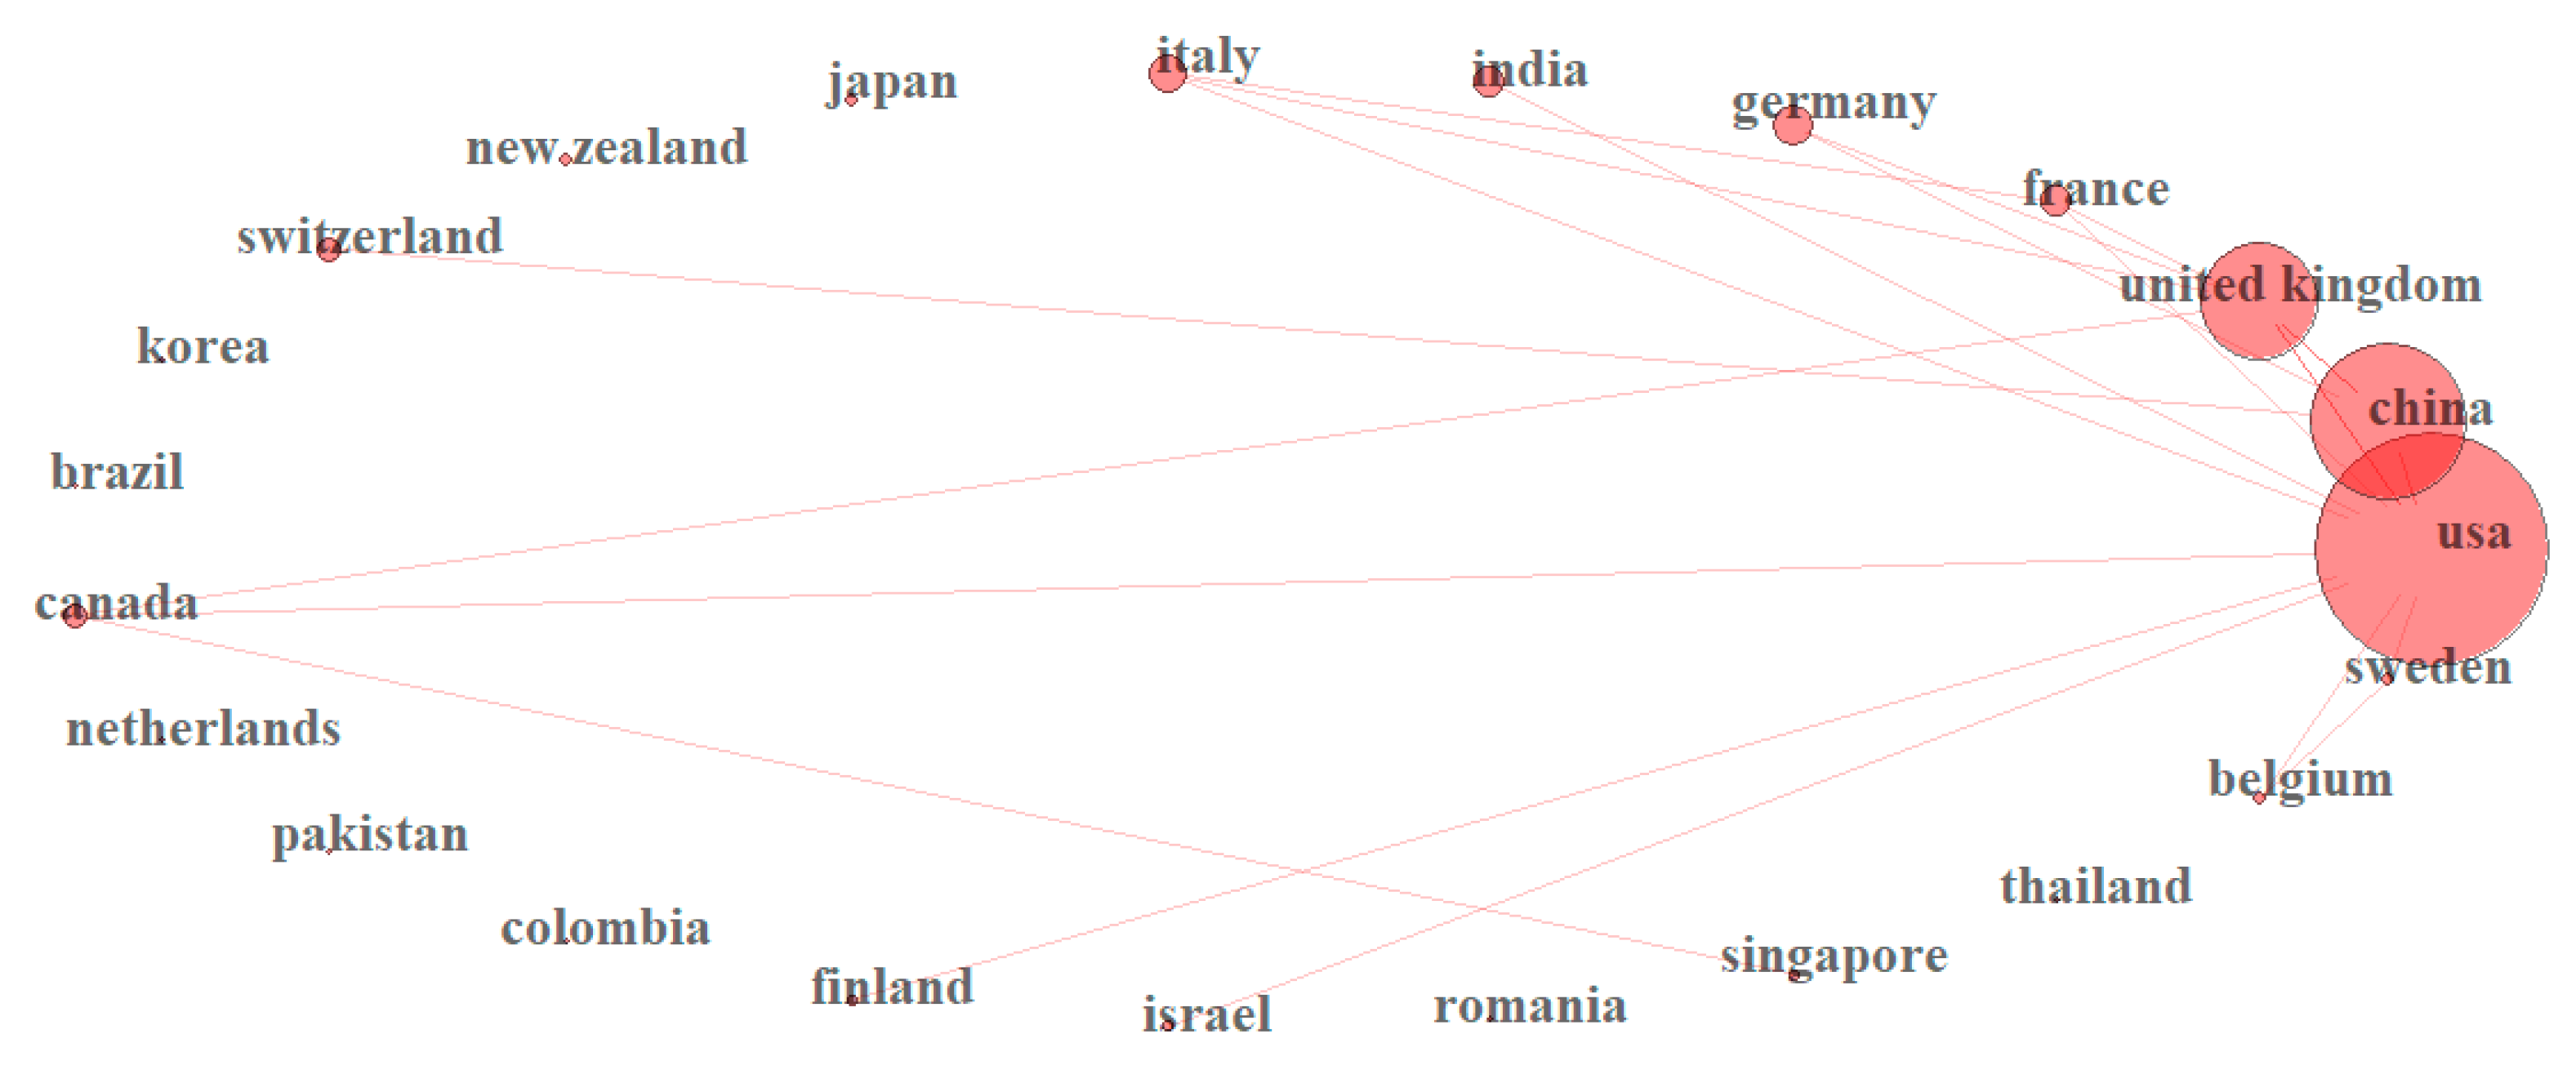
Table 1 shows the distribution of the top 10 countries/regions and journals for articles published. By geographic distribution, the United States dominates the ML-CAPM literature with 27 articles, followed by the People’s Republic of China (19), England (12), Germany (5), India (4), Italy (4), France (3), Switzerland (3), and other countries with two or one articles. Note that the country ranking by articles changes when ranking is performed by total citations (except for the U.S.). For example, China is ranked second by total articles, but France is second by total citations. Note that the Netherlands (23 TC and 23 AAC) and Romania (6 TC and 6 AAC) replace Germany and Japan by total citations.
The journals with the highest number of articles (
Table 2) are Expert Systems with Applications (10), IEEE access (3), International Journal of Financial Engineering (3), Quantitative Finance (3), Review of Financial Studies (3), and many others with two and one articles published.
Table 3 provides the frequency of keywords in the bibliometric survey. Machine learning, asset pricing anomalies, AI, and big data were the most frequent words used by authors, and the words risk, cross-section, returns, equilibrium prediction, and stock were dominant in WoS, all of which confirm that the articles found in the search were related to machine learning and asset pricing.
Figure 3 illustrates the collaboration linkages for the 23 countries identified in the WoS search. The United States, China, and the U.K dominate the concentration of collaboration, but the density of such a collaboration is just starting with a density of 0.079 and a transitivity
3 of 0.31. Authors’ collaboration networks were developed (not shown) but resulted in similar statistics, with a smaller density (0.012) but a transitivity of 0.89, making it very probable that scholars in other countries, not directly shown in the network, are connected to scholars in the U.S. The same implication applies to China and other countries.
5. Discussion: Top 10 Most Cited Articles
The top 10 most cited articles are listed by journal, total citations (TC), and TC per year (TCPY) and are shown in
Table 4. The Review of Financial Studies (JFS) ranked first with 193 total citations and 64.33 TC per year, followed by Applied Stochastic Models, Journal of Banking and Finance, Journal of Economics Dynamics and Control, and Quantitative Finance. Of course, this ranking may change in a few years if the literature continues to expand at the current growth rate of 29.38% per year. In fact, when this article was first started, a few of the recent articles cited in this review had not yet appeared in the literature.
A comparative analysis of machine learning techniques for measuring asset risk premiums, for the aggregate market and individual stocks, and testing predictive accuracy is the subject of the top cited article by
Gu et al. (
2020). The feasibility of ML in the measurement of risk premiums is based on three aspects; namely, risk premiums are a conditional expectation, the conditioning variables are high-dimensional, and the functional form is mostly an empirical issue and typically nonlinear. Various methods are used to address these issues, including linear regression, generalized linear models (GLM) with penalization, principal components regression (PCR), partial least squares (PLS), regression trees (RT), and neural networks (NN). Gu et al. implemented these methods using data on nearly 30,000 individual stocks, 94 characteristics for each stock, and 74 industry sector dummy variables from 1957 to 2016. ML computational methods used by Gu et al. addressed two twin problems: overfitting and the out-of-sample evaluation of predictive performance; the methods include: (a) the Hubert robust objective function, a hybrid of squared loss for handling very small deviations and absolute loss for considerably large ones to accommodate the effect of heavy-tail observations in the simple linear prediction model; (b) the accelerated proximal gradient algorithm to accommodate both least squares and the objective function in (a) above to adaptively optimize the tuning parameters in penalized regression; (c) a SMPL algorithm to find K linear combinations of the predictor set (Z) that are strongly correlated with the anticipated goal in both PCR and PLS; (d) group lasso penalization function in GLM to select spline terms in a least squares objective function, both without and with (a) above, using the same accelerated proximal gradient descent for both; (e) a gradient boosted regression tree (GBRT), that makes the flexible nonparametric GLM approach feasible, to regularize overfitting in regression trees under nonlinearities; (f) similar to boosting, random forest bootstrap aggregation (bagging) is used to average forecasts to reduce variation and stabilize predictive performance; (g) stochastic gradient descent algorithm, a powerful technique to search for a local minimum, to reduce the computational intensity of NN and train the network using a small random subset of the data; and (h) simultaneous use of algorithms such as learning rate shrinkage, early stopping, batch normalization, and ensembles to address the high degree of nonlinearity, nonconvexity, and heavy-parameterization in NN.
Unlike the argument that ML may not be successful in predicting individual stock returns,
Gu et al. (
2020) demonstrated large economic gains to investors using ML forecasts, in some cases doubling the out-of-sample forecasting performance of leading regression-based approaches. The findings identified trees and NN as the best performing methods and attributed the improved performance to the flexibility of the methods in allowing nonlinear predictor interaction. Additionally, they found that the peak performance of NN occurred with three hidden layers, in an evaluation of up to five hidden layers. They also found that tree and random forest algorithms have a tendency to to select trees with fewer leaves and that this may be due to an artifact of the relatively small amount of data and the very low signal-to-noise ratio. A Monte Carlo simulation lent support to the above empirical findings.
The theory that a deep learner in finance can uncover the relationship for a return, no matter how complex or nonlinear, is the research question studied in the second top-cited paper in this survey (
Heaton et al. 2016). They modeled a high-dimensional mapping by concatenating univariate semi-affine functions to produce a response Y
4. By splitting the data into three subsets, namely, training (input–output pairs to select weights for the network), validation (model selection), and testing (to confirm the actual predictive power of the learner), the authors first applied a form of stochastic gradient descent (called back-propagation in deep learning) to find an optimum solution to a loss function with a regularization penalty (controlled either through cross-validation or Stein’s unbiased estimator of risk). Note that, in addition to the activation functions, the size and depth of the learning routine must also be chosen. Dropout regularization was used to avoid over-fitting (model selection) and to choose the number of hidden units in a layer. The level of regularization that optimizes out-of-sample predictive loss was measured via mean-squared error. This model generates what the authors call “deep portfolios”, which are of investment interest.
Text analysis and the application of supervised machine learning classification (MLC) to construct a lexicon of words used by investors when sharing ideas about their stock market sentiment (bullish or bearish) is the subject in
Renault (
2017). The article describes text data collected from StockTwits.com used in text classification. The data split for MLC is very similar to that performed in numerical data and is divided into learning, measuring, and predicting. Naive Bayes, support vector machine, and maximum entropy methods are used to classify the text at the learning stage; algorithmic fine-tuning occurs at the measurement stage, and subsequently, the algorithm predicts the outcome. The lexicon in this paper was developed from messages published in StockTwits between 1 January 2012 and 31 December 2016. The article found that, in quantifying text from the Internet, to measure sentiment in this case, researchers should implement both “field specific dictionary-based” approaches and MLC to enhance the replicability and comparability of findings. Renault does not necessarily endorse the use of text classification in this application and warns that ML methods should be considered only when substantive value is added relative to other methods such as “bag of words”.
The empirical approximation of agent-based models (ABM) for asset pricing is a challenge suited for machine learning methods.
Lamperti et al. (
2018) combined supervised ML and intelligent sampling to calibrate and explore the large-scale parameter space typical of ABM, which is faster, more accurate, and more efficient than alternatives such as kriging. The surrogate modeling procedure relies on the XGBoost algorithm, which sequentially learns an ensemble of classification and regression trees and is nicely illustrated in Lamperti et al. Given the analytical complexity in ABMs, aspects of parameter dimensionality, calibration, model evaluation, and out-of-sample predictions in relatively small sample settings, the merits of the approach seem promising in empirical settings.
The prediction of financial time series using a support vector regression (SVR) to allow high dimensionality and regularization to reduce over-fitting and to capture nonlinear relationships was found in the fourth top cited paper by
Law and Shawe-Taylor (
2017). They implemented a Bayesian approach to SVR and enhanced it by adding a new kernel scaling parameter that allows the evidence function to be more flexible in handling data from different ranges and to adjust the level of variance in error-band estimation to match the range of the SVR prediction. They also developed an alternative optimization algorithm, a sequential multi-arm bandit Bayesian optimization, to fully automate the parameter selection process. The framework was applied to daily data on financial time series of various asset classes to test the method and used cross-validation, grid search, and Bayesian optimization to select model parameters; the mean absolute percentage error was used to assess prediction performance. A calibration process demonstrated the role of uncertainty estimates in improving predictions as well as changes in market conditions.
While
Gu et al. (
2020) focused on supervised ML prediction models,
Gu et al. (
2021) used unsupervised and semi-supervised learning methods to model risk-return trade-offs and link the literature on autoencoders with the literature on factor pricing models. The linkage between linear latent factor models and characteristic-based anomaly modeling is extended with general nonlinear specifications of the return structure, and the traditional autoencoder embeds the neural network in the specification of conditional betas
5. Similar to PCA, it reduces the dimension of the input. The standard autoencoder, when it has one hidden layer and a linear activation function, produces the static simple linear factor model of returns r
t = beta*f
t + u
t as a special case. Standard autoencoders, such as PCA, do not make use of conditional variables to identify the factor structure, but use returns instead. Conditional autoencoders allow for a more flexible nonlinear compression of the asset-specific covariates, making the autoencoding more flexible. An intuitive illustration of the standard autoencoder and the conditional autoencoder models is found in (
Gu et al. 2021, pp. 431–32). Note the similarity between the specification of the recursive formulation for the nonlinear beta function of the conditional autoencoder and the standard econometric specification of time-varying parameter models in state-space form. Based on
Gu et al. (
2020), this research used a second machine learning regularization tool called “early stopping”, which controls overfitting and lowers computational cost; it also applies stochastic gradient descent (SGD) to train the NN with an adaptation for (a) the learning rate (adaptive moment estimation algorithm) and (b) to control the variability of predictors across different regions of the network and across different datasets (this process is known as “batch normalization”).
Gu et al. (
2021) also used a similar data set as
Gu et al. (
2020), except that the data started in March 1957 and ended in 2016. It also added various stock-level predictive characteristics based on a cross-section of stocks drawn from the existing literature. A Monte Carlo simulation was used to demonstrate the finite sample performance of the autoencoder learning method. The empirical results show, in modeling monthly U.S. stock returns, that the preferred autoencoder produced annualized value-weighted Sharpe ratios superior to those of competing asset pricing models in out-of-sample.
Gan et al. (
2020) proposed a new method of pricing options. Options are a financial contract whose returns are derived from the returns of an underlying financial instrument and are widely used for managing financial risk. One type of options is the arithmetic Asian options for which there are no effective closed-form solutions, and typical procedures use numerical solutions to partial differential equations (PDE) or Monte Carlo simulation. The uniqueness of the method proposed by Gan et al. lies in its model-free and data-driven structure; it also uses deep learning to price both arithmetic and geometric options. The Adam optimization algorithm was used to update model parameters in their NN and to improve updating accuracy. They used Monte Carlo simulation to support the robustness of the method and its computational efficiency. In consistency with other applications previously discussed, Gan et al. nicely illustrated the NN deep learning algorithm of back propagation from the input data, data processing, training, parameter updating, and error minimization. A salient finding in both simulated and empirical data was that the proposed method can predict the Asian option prices with high accuracy using R
2 and MSE measures.
Financial asset model calibration refers to the process of recovering the model parameters of a stochastic differential equation from observed financial data using algorithms that have high accuracy, speed, and robustness. However, parameter calibration can also give rise to multiple local minima, which makes the use of global optimizers ideal in NN.
Liu et al. (
2019) proposed a data-driven approach called Calibration NN (CaNN) to establish a connection between ML and model calibration using an artificial NN (ANN). A forward pass algorithm for training and prediction was used to learn the solution from multiple numerical methods to map the output of interest, and a stochastic gradient descent method was used in the NN. The linkage between training the ANN and calibrating the financial model is conducted in three stages: training, prediction, and calibration, in a process known as a backward pass. At the training stage, input–output pairs and a user-defined loss function are used to calibrate the hidden layers and generate the appropriate weights and biases, with the consequence that a trained ANN approximates the optimal solutions of the financial model. By fixing the previously optimized hidden layers of the trained ANN (prediction phase), new input parameters enter the ANN to produce an output layer of interest; model testing occurs at this stage. In the last phase, with calibration (or backward pass), using differential evolution (DE) optimization to secure a minimum from multiple local minima, the original input layer of the ANN is converted into a learnable layer, while all hidden layers are frozen. This process generates the input values that match the output. Note that, during this stage, all market samples can be computed simultaneously. A parallel version of DE is developed to accelerate the calibration (CaNN), and it was reported that this version was at least 10 times faster than the conventional CaNN and that such performance may be enhanced with a larger population size. An illustration of this method is provided in
Gu et al. (
2018, Figure 2). Two asset pricing models, Heston CaNN and Bates CaNN, were used in the analysis. The calibration problem consists of determining correct values of the partial differential equation (PDE) coefficients to ensure that the model reproduces the observed option/implied volatility data. Liu et al. provided an assessment of the effects of varying individual parameters, while keeping other parameters fixed, on the implied volatility. The effect of varying two or more parameters on the objective function, and how this can give rise to multiple local minima, is also illustrated, thus adding credence to the usefulness of the DE optimization. The application also claims the need for higher computing power when the number of neurons in the network or using a deeper structure can improve the approximation.
Kusuma and Budiartha (
2022) investigated the use of sequence models such as recurrent neural networks (RNN) (
Sutskever 2013) and long-short-term memory (LSTM) (
Graves 2012) to optimize the CAPM model for improved estimates of stock returns. In this work, the authors used an LSTM to predict stock prices and subsequently compared the performance of the AI-enhanced CAPM model with that of the traditional one. The authors concluded that the AI-enhanced version of CAPM provided better estimates of the return than the traditional one.
Chen et al. (
2011) proposed that nonlinear techniques are suited to predict bankruptcy from financial data and the use of support vector machines (SVM) to predict the default risk of German firms. The standard techniques used to tackle this problem were based on discriminant analysis and logit models using firm-specific and/or market information. Chen et al. provided a detailed review of various nonlinear numerical methods used to solve the linear non-separable problem in default risk modeling. SVM has nice properties such as flexibility in modeling interactions among predictors of bankruptcy and their accuracy in finding a local minimum when several minima are present, a problem that often occurs in calibration as in (
Liu et al. 2019). The SVM algorithm is a min-max optimization problem that minimizes the empirical risk while maximizing the separation between the positive and negative examples to obtain a trade-off between the two targets, which results in improved classification. The algorithm also uses a Gaussian kernel coefficient to represent the complexity of the classification function. The article provides a detailed discussion of the SVM, the prediction framework, and empirical and simulation results on the performance of SVM. The results support the use of SVM in credit risk analyses, given that it significantly outperformed alternative classification models in German data of 20,000 solvent and 1000 insolvent firms.
The last paper in the series of top-cited papers by WoS during the study period is
Srivastava (
2021), who builds predictive machine learning models (SVM, random forest, gradient boosting, and deep neural networks-DNN) to predict the next-day trend from technical indicators and other historical data in the Indian stock market. The stock price daily data were collected from the NSE NIFTY 50 for the period extending from 1 January 2013 to 30 June 2020. Technical indicators were computed and normalized, and a discrete trading signal was calculated and fed into the ML algorithms to predict the next day’s stock price movement, followed by a predictive performance evaluation; multiple linear regression was used to validate feature importance. It was found that the DNN technique outperformed random forecast and gradient boosting, and implications for management, traders, and investors were derived.
Analyzing time series data is important for many financial applications, including stock trading, portfolio analysis, etc. In Adhikari and Agrawal 2014, the authors decomposed a time series into its linear and nonlinear constituents. The linear component was handled using random walks while the nonlinear one was modeled using an ensemble artificial neural network model. While combining linear and nonlinear models for understanding time series data has been a dominant theme in the literature, many of these works include assumptions about the relationship between the linear and nonlinear components of a time series. Such assumptions do not hold in many applications, limiting their applicability. In (
Khashei and Bijari 2014), the authors proposed a model without such assumptions by combining ARIMA, artificial neural networks, and fuzzy set-theoretic models. The authors reported improved performance, even in situations where the data were incomplete. In (
Guresen et al. 2011)
6, the authors analyzed the performance of different neural network architectures in modeling time series data arising from stock forecasting applications acquired from NASDAQ. Their results were surprising, showing that the simple multilayered perceptron (MLP) architecture (
Bishop 2006) outperformed more complex ones.
6. Future Research
Recent developments in machine learning offer a wide cross-section of methods to address issues that typically plague model specification, estimation, and forecasting in econometrics; additionally, problems of dimensionality, nonlinearities, distributional assumptions (iid. vs non-iid time series), efficient use of data, out-of-sample predictive performance evaluation, computational efficiency, and approximations to theoretical models will continue to guide future research. Advances and applications discussed in this review article provide a guide to future research, and, given the suggestions in the top papers reviewed, ingenious model specification approaches that are supported by economic theory and improved computational methods offer promising opportunities for future research on both the theory and practice of machine learning econometrics. Gu et al., for example, suggested that future work may focus on the use of economic theories of equilibrium to better understand the causes of improved prediction with ML econometric models, an emphasis which is discussed with Bayesian perspectives in
Nagel (
2021) and illustrated via future research perspectives in
Brunnermeier et al. (
2021).
Economic and financial datasets are typically high-dimensional; furthermore, nonlinearities in both macro and micro data abound. While linear regression has had a strong presence in the econometrics literature, numerous contemporaneous ML methods have been previously applied (
Chalup and Mitschele 2008). Nonlinear statistical models (e.g.,
Gallant 1987) have been used for decades, but in an environment of high dimensional nonlinear data, the use of the “kernel method” (
Herbrich 2001;
Schölkopf and Smola 2002) may improve the practice of nonlinear modeling. Additionally, the practice of finding “best fit” nonlinear models in asset pricing may benefit from the application of deep learning to unconstrained and constrained regression models using model selection criteria (AIC, BIC, MSE, CP, KIC) on the whole sample of data to balance the bias-variance trade-off and improve parsimony in ML methods (e.g.,
Kim and Cavanaugh (
2005);
Wilson and Sahinidis (
2017)). Monte Carlo simulation methods are well suited to investigate the small sample properties in identifying nonlinearities in ML methods (see empirical and simulation analysis in
Gu et al. (
2018)).
Decision-making under uncertainty formed the foundation of portfolio theory and its application to asset pricing (
Markowitz 1952). The return-generating distributions, which can fall into a wide class of distributions in the Pearson family (
Markowitz 2010), have been the subject of much empirical research. The rule that investors follow over time (i.e., short versus long investment horizons) is driven by the distribution of returns corresponding to various horizons (
Levy and Duchin 2004). A recent development in ML called out-of-distribution (OOD) data points advances that, in situations where the inputs fed to an NN are different from those used to train it,
7 the NN can misclassify (
Berglind et al. 2022). The fundamental assumption in ML is that the data used during the training phase and during the inference phase arise from the same probability distribution. When presented with OOD data at inference time (i.e., data that do not follow the training distribution), ML algorithms silently fail, providing incorrect predictions without giving any warning to the user. ML algorithms that receive OOD data at inference time due, for example, to changing market conditions, can render them sub-optimal unless they are enhanced by OOD detection methods. OOD detection is currently an active area of research in ML and is closely related to text classification (
Renault 2017) and anomaly identification, since anomalies are rare events that may be absent in training data. The CAPM model, for example, is sensitive to low-risk/volatility anomalies (
Falkenstein 1994).
Bachelard et al. (
2022) proposed Markov Chain Monte-Carlo (MCMC) algorithms for uncovering low-risk/volatility anomalies. The basic idea is to sample long-run portfolios from the set of feasible portfolios with a given risk level and then compare their empirical performance with those drawn from sets with different risk levels. The extensive literature on anomalies in asset pricing may benefit from using OOD methods.
One problem in using ML models for finance and econometrics is the fact that most ML models are opaque, in the sense that they do not provide any insight into explaining the output. The idea that “correlation does not imply causation” was key in the development of Granger Causality in economics (
Granger 1969), which led to seminal contributions in time series econometrics
8. Financial models such as those used in asset pricing assume the rationality of decision-makers and are developed under theories of equilibrium. New research on explainable AI techniques (
Hoffman et al. 2018) promises to develop methods for explaining the rationale behind an ML engine’s decision and contribute to developing causal inference ML models in financial econometrics. This is a subject of interest in various fields of social sciences (e.g.,
Hair and Sarstedt 2021).
Human risk perceptions are shaped by reinforcements from the market.
Cong et al. (
2020) developed a reinforcement learning (RL)-based framework called AlphaPortfolio. This framework was shown to be robust and accurate in modeling US public equities. The architecture of AlphaPortfolio uses sequence models to capture state features of assets based on historical data. These state features are fed to a cross-asset attention (CAA) model that explores correlations between different assets. Finally, the portfolio generator uses the scalar winner score produced by the CAA to synthesize optimal portfolios. The AlphaPortfolio framework is trained using RL by maximizing a reward such as the OOS Sharpe ratio. Future investigations may focus on studying the use of Proximal Policy Optimization (PPO) algorithms (
Schulman et al. 2017) in asset pricing.
One of the bottlenecks in using ML models in economics and finance is the lack of large volumes of labeled data required for techniques such as deep learning. Unlike in image classification, where datasets can be labeled through crowdsourcing, labeling economic and financial data requires deep expertise. The trend in the ML community is to develop self-supervised (
Misra and Maaten 2020) and unsupervised approaches. In self-supervised learning, rather than being provided with a priori labeled data, the labels are derived from unlabeled data itself. For ML to succeed in the econometrics and financial world, it is essential that high-performance self-supervised and unsupervised learning methods be developed in these domains. In addition, generative adversarial networks (
Goodfellow et al. 2020) can be used for data augmentation as well as for simulating econometric models.
Today’s machine learning approaches produce what are called weak AI models. These models can only perform one task well and fail even if they are asked to perform a related, but different, task. Many researchers consider today’s machine learning approaches to be “glorified curve-fitting” (
Pearl and Mackenzie 2018). To be effective in financial econometric analyses, new approaches with causality-based methods (
Pearl 2009) need to be developed that can enhance the understanding of market dynamics. Similarly, techniques such as transfer learning (
Pan and Yang 2009) and domain adaptation (
Daumé 2009) should be used so that ML models trained in one market are able to operate in a related but different one without significant retraining. For example,
Zhang et al. (
2018) used transfer learning to develop a personalized recommendation engine catered to the equity funds market. The basic idea is to develop a theoretical profile of equity funds and investors using portfolio theory. The profile of stock market investors is later added to the objective profile through transfer learning. Heaton et al. applied a deep learning algorithm via the auto-encoder to find a selection of investments for which good out-of-sample tracking properties are found to achieve a given investment goal, a portfolio selection that the authors call “deep portfolios.” It is argued that, in the context of data-driven portfolio optimization and inefficiency detection, future work also may benefit from using this approach.
Option contracts have become an important investment instrument in derivative markets and can be used effectively in financial risk management. The finding of Gan et al. is novel in the sense that option prices can be predicted using model-free methods. This is empirically appealing for investment practice and the application of deep NN, as performed in (
Gan et al. 2020). As of the writing of this article, the business news media provide daily coverage of the high levels of uncertainty and market volatility. News-based measures of implied volatility and disaster concerned studies (e.g.,
Manela and Moreira 2017) may benefit from the examination of text classification methods included in this review (e.g.,
Heaton et al. 2016 and the application of NN deep learning algorithms in
Gan et al. 2020).
The bankruptcy classification analysis by Chen et al. shows how NN algorithms can improve classification and bankruptcy prediction. Given the improved differential evolution algorithm in Liu et al. to find a true local minimum, future research on improving bankruptcy analyses may focus on improving the SVM model through the DE algorithm; this approach may enhance classification and prediction accuracy in this and other contexts.
Given advances in computational power, such as quantum computing, a generalization of the methods discussed here may ensue, particularly when calibration leads to multiple minima or when the number of neurons/hidden layers is increased, to improve computational efficiency. The use of jump models in (
Liu et al. 2019) may fit a deeper investigation on structural change with NN, considering that in just over the past decade, financial markets have experienced large shocks (e.g., the financial crises of 2008–2009, COVID-19, and rising interest rates in response to high inflation). Another area of potential contribution is in MSE evaluations; while the application of MSE testing is beginning to appear in some articles, testing the statistical significance in the out-of-sample performance of alternative methods will lead to improved model selection in prediction problems and economic value analyses.
Just as in any other field, the use of machine learning in financial econometrics is closely associated with ethics, fairness, and safety. Using these models without care can cause negative spillover effects, causing irreparable harm to society. Similarly, adversarial attacks on machine learning systems operating in the financial and econometric fields can wreak havoc on the economy. It is therefore crucial that machine learning systems in financial economics be built and deployed with the utmost care to ensure safety and fairness. Much research needs to be devoted to the ethical use of ML.
In closing, the recent literature on the application of ML methods to asset pricing has accelerated over the past two years, surpassing the number of articles published in the previous nine years. This paper provides a comprehensive, transparent, and objective bibliometric assessment of the recent literature and identifies trends in computational algorithms using Web of Science survey data for the period 2011–2022. The paper also links this review to the previous literature with minimal overlap, thus complementing other published review articles. Given the fast evolution and diffusion of ML methods in other disciplines, and the documented success in prediction problems, one salient challenge that remains for future research in financial econometrics is an improved integration of economic theory and big data that leads to a better understanding of the results generated by machines. The top and other papers cited in this review provide a conic view of the methods and practices that will contribute to moving researchers in that direction.


