1. Introduction
The complexity of financial decisions in a changing world has made those who must take such decisions consider multiple variables that require advanced mathematical models for their analysis. Some of the most promising tools employed in this task belong to the fields of multivariate data analysis and machine learning. More specifically, the use of artificial intelligence and machine learning methodologies for stock market forecasting is widespread. According to the World Bank [
1], the total market capitalization of all publicly-traded companies in 2020 was 93,686 billion US dollars. Every day, billions of dollars are traded in stock exchanges all over the world. Those investors that play the markets, whether they are long or short-term investors, are in search of profit over their investment horizon. In order to achieve such an aim, they make use of very different methodologies based on scientific foundations of varying solidity. Among these methodologies, machine learning and artificial intelligence techniques are present and gaining in importance year by year.
The weak form of the efficient-market hypothesis (EMH) [
2,
3] states that asset prices reflect all the available information on past prices and rule out predictions based on price data alone. This means that under such a hypothesis, anybody playing the stock market should be able to obtain the same return and, therefore, nobody would beat the market using technical analysis. In such circumstances, it would not seem worthwhile to develop machine learning or any other kind of model to predict the evolution of stock prices. Please note that such a hypothesis does not take into account the fact that investors with private information would obtain a higher return.
In spite of the above-mentioned hypothesis, in present times many authors do not consider that markets are totally efficient [
3,
4], taking into account phenomena like their overreaction in the short term [
5,
6]. Also, some of the major assumptions made for the EMH have commonly been debunked [
7]. The existence of market anomalies [
8,
9,
10] is what mainly impels market participants to develop and use models that can give forecasts about stock prices.
From a stock market perspective, the methodologies employed can be classified as fundamental analysis [
11] and technical analysis [
12]. Fundamental analysis focuses on the analysis of basic company data. As an example, fundamental information may include revenues, earnings, return on equity or profit margins [
13]. Technical analysis focuses on the time series of stock prices and trading volumes [
14,
15]. In other words, it can be stated that the basic distinction between technical and fundamental analysis is determined by the type of variables used for the study, and not by the methodologies employed. Both types of analysis can be used for stock market forecasting.
One of the characteristics of this field of research is that due to the background of the researchers in Economy and stock market forecasting, most of the studies performed in this area make use of statistical time-series methodologies based on historical data to predict the evolution of stock prices. It also seems of interest to remark that a lot of research that makes use of machine learning methodologies combines them with time-series methodologies.
In the last few decades, many new methodologies based on artificial intelligence and machine learning have been developed. Due to their performing well in other fields, these techniques have attracted a lot of interest and have also been largely employed in stock market prediction studies [
16]. Some of the most promising methodologies developed over the last few decades are different kinds of artificial neural networks, random forest, support vector machines, decision trees, gradient boosted trees and k-nearest neighbors [
17]. As a result, these methodologies represent novel and advantageous alternatives, making them appealing to scholars interested in financial market forecasting. However, the performance of machine learning models is also linked to the quality of the input data employed for building the model. The goodness of fit of the different models, when applied to a particular problem, can be measured by making use of different performance indicators, some of which are suitable for classification problems like specificity, sensitivity, precision or the Matthews correlation coefficient [
18] or others which are applicable to regression problems. Examples include mean square error (MSE), root mean square error (RMSE), mean absolute error (MAE), mean absolute percentage error (MAPE) and symmetric mean absolute percentage error (SMAPE) [
19]. Studies relating to price forecasting for stock and raw materials are performed by independent researchers under different circumstances and conditions and with different aims. As a consequence, there is a certain heterogeneity in the databases employed for this kind of study. As far as the authors know, there has been relatively little research on the variables used in the model building process for the market prediction of stocks and raw materials. Stock market data frequently includes time series data in a variety of formats, such as stock index prices, returns, volatility, and interest rates [
20]. Something similar could be said about raw material price forecasting, also including the historic prices of both the raw materials under study and others.
Global concern about climate change and the legislative limitations imposed on pollution in developed countries have been major limitations for the development of the business of oil and gas companies in recent years. Currently, the oil and gas industries are in a process of transition to clean energy [
21,
22]. Such a process will inevitably be long and slow, given its high complexity. The efforts made all around the world to limit the rise in global temperatures that impacts the climate affects the profitability and future of most of the industrial fields. In other words, the whole economy will be affected by the transition to clean energy, and all sectors of the industry need to consider how to respond.
The shift of oil and gas companies to green energies is key to reaching a good level of development of some renewable energy options such as offshore wind, and for the research in others such as carbon capture. Meanwhile, the use of hydrogen still requires time to reach maturity [
23]. Remarkable proof of the shift of these companies to green energies is that in recent years some oil and gas companies have diversified their energy operations to include renewables and other low-carbon technologies.
Given the need to survive in a changing and highly-competitive energy market, it can be stated that the risk assumed by private companies for this green transition is larger than the one assumed by the state-owned ones [
24]. Most money is put into solar and wind technology, but some oil and gas firms have also diversified by buying up already-existing non-core businesses such as energy distribution, electric car charging, and batteries. It must additionally be taken into account that changes in global energy trends have led many major resource holders to reaffirm their commitment to reform and economic diversification [
25,
26] In addition, fundamental changes to development models are seemingly inevitable in many other major resource holders. According to this concept, if large national oil firms perform successfully and remain vigilant to both risks and possibilities, they can contribute significantly to economic stability during this process.
Trends in the mining industry were affected by the commodity boom in the years between 2004 and 2012 [
27], which also sparked some significant long-term changes in the sector. These adjustments included a sizeable shift in the industry’s clientele towards emerging economies, particularly those in Asia. There was also a move away from contract pricing toward spot pricing, which increased the volatility of mineral prices. A growing role appeared for emerging economy mining companies in the global mining sector, while operating and capital cost pressures increased due to the depletion and tightening of environmental standards and ongoing pressures on the resource sector. These challenges, taken together, create a difficult backdrop for developing sector regulatory frameworks that meet the interests of investors while also providing fair and long-term benefits to mineral-hosting governments. According to estimates, more than 3.7 million people will be employed globally in the mining industry in 2022, with 1.5 million of them working in industrialized nations and 2.2 million in underdeveloped nations [
28].
Finally, the electric power sector is one of the core fields in the economy, as almost all industrial activities require electricity. The importance of this sector to the economy is expected to grow in the long term as wind, solar, geothermal, and hydropower sources substitute other forms of electrical production while increasing the generation costs involved [
29,
30].
In this context, the objective of this study was to perform a systematic review of existing literature on the methodologies applied to the forecasting of stock prices of companies in the energy, mining, electricity, oil and gas sectors, and also to the forecasting of the prices of those raw materials. The period considered was from 2017 to 2021.
5. Results
The search strategy was fixed in order to maximize the number of documents identified. The number of documents found making use of the queries referred to in the previous section are listed in
Table 1. The results obtained were carefully examined in search of results that would be of interest. A total of 1683 documents were found with the help of those queries.
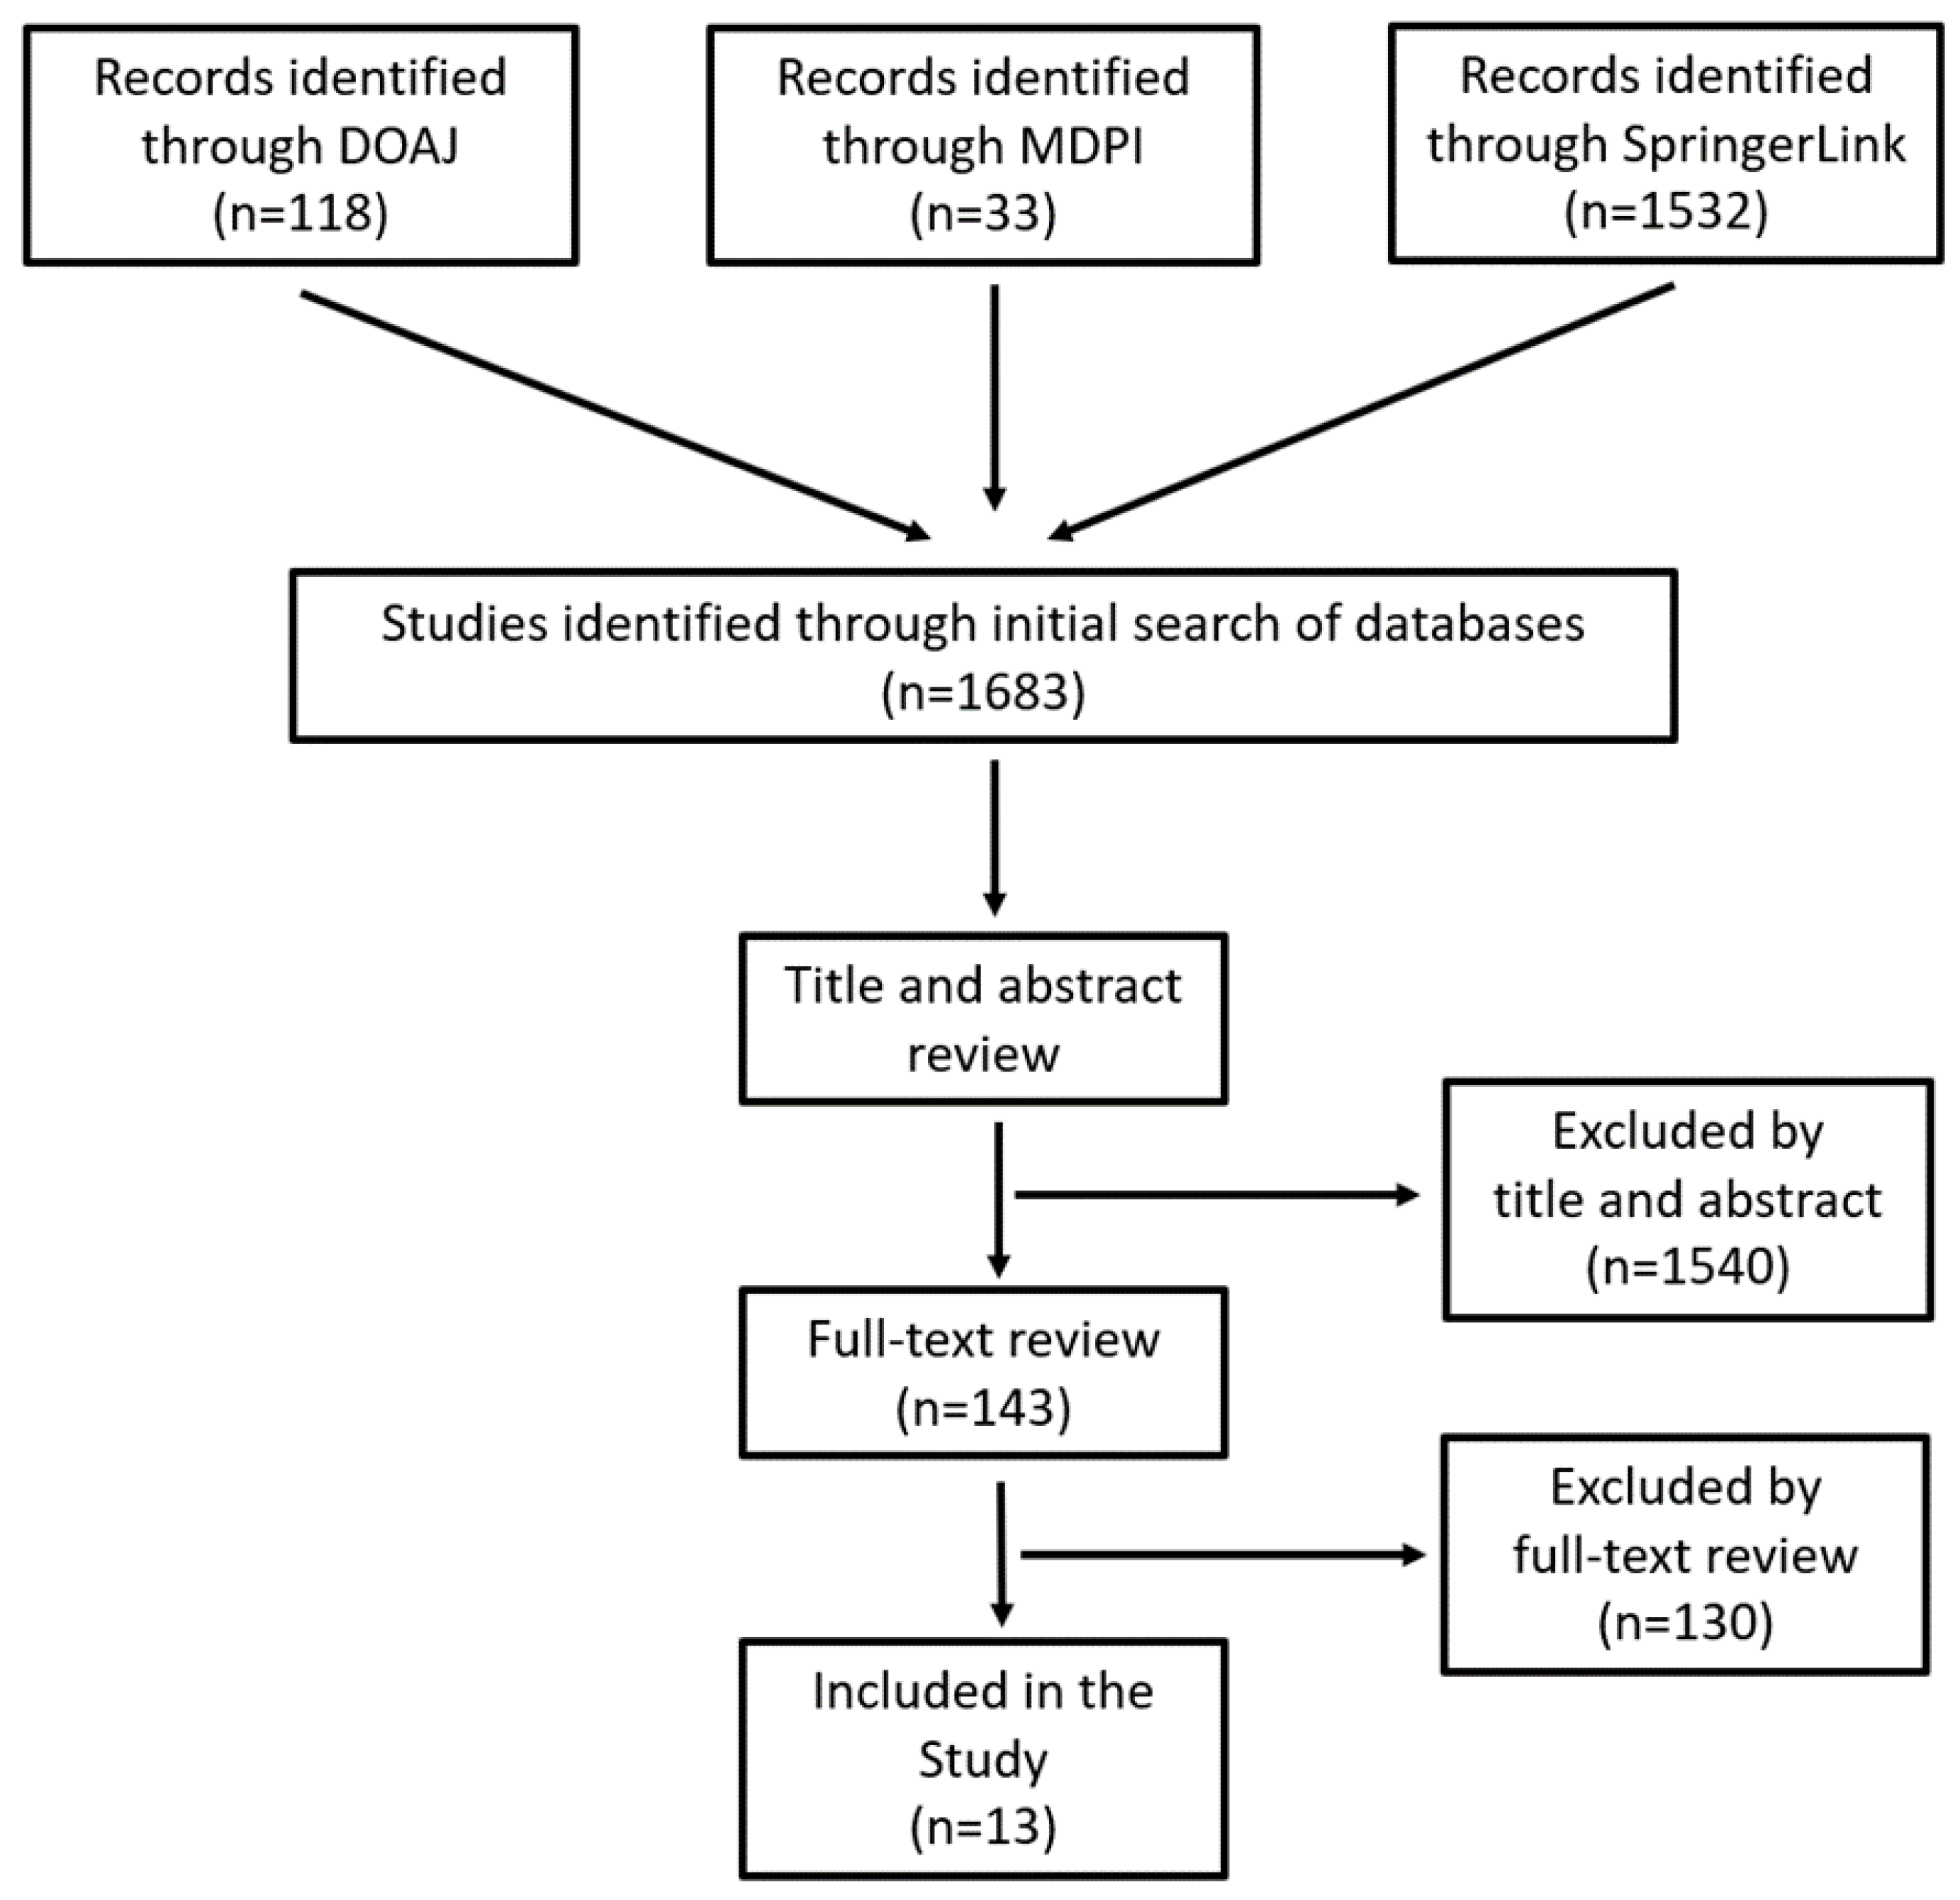
In the case of the DOAJ database, 118 manuscripts were screened by title and abstract. After this screening, 84 documents were excluded, as it was considered that their content was not related to the topic under analysis and, therefore, the other 34 were included for a full-text review. Of these manuscripts, after the full-text review, 32 were discarded and the other two were included in the final analysis and review performed in the present manuscript. For the MDPI database, 33 different manuscripts were screened by title and abstract. After this screening, 29 documents were excluded and, therefore, only four were included for the full-text review. Of these manuscripts, three were discarded and one was included in the final analysis presented in this paper. Finally, for the case of the SpringerLink database, 1532 manuscripts were screened by title and abstract. After this screening, 1427 documents were excluded due to the lack of a relationship with the topic under study and, therefore, 105 were included for the full-text review. Of these manuscripts, 95 were discarded and 10 were included in the final analysis. The content of the 13 manuscripts that were considered relevant in the three databases under study is described in this section. Please note that due to the small number of results with a significant content on machine learning and artificial intelligence methodologies applied to the fields under study, other kinds of forecasting were included in the analysis performed in this paper, and these will be detailed later. The articles found cover the fields of energy, electricity, oil, and gas. Unfortunately, no articles were found about stock price forecasting in mining companies or mineral price forecasting.
Figure 1 summarizes the results obtained with the article search detailed previously. As can be observed in this figure, a total of 1683 were identified in the three databases under analysis. A total of 279 of these articles were published in 2017, 286 in 2018, 314 in 2019, 351 in 2020 and 453 in 2021. Please also note that 1540 of those articles were discarded after reading the title and abstract. A full-text review of the other 143 articles was then performed, which led to the exclusion of 130 papers and the inclusion of only 13 in the present research.
Table 2 shows the distribution of articles by field. The field with the largest amount of research dedicated to it was electricity, with a total of seven papers, followed by oil with five papers. In the case of gas and energy, only one paper was found for each. Please note that the research found relating to gas [
31] also deals with oil. It is also worth noting that eight of the 13 papers under analysis were published in 2021, the last year in the period considered, which shows that there is a growing interest in this topic.
In the case of research focused on the field of electricity, most of it deals with electricity prices. More specifically, one [
32] forecast the hourly electricity prices from the Irish Integrated Single Electricity Market, while another [
37] did the same with the prices of the electricity market in Germany for year 2018 one day ahead, making use of hourly values. Two research papers [
34,
35] make use of hourly prices of energy in the Nord Pool Scandinavian power market. Another research work [
36] made use of electricity price data in the United States, whereas yet another [
38] does not detail where its data comes from. Finally, another research paper [
33] forecast the stock prices of several companies, including Eve Energy Co. Ltd. ( Huizhou, China), a firm specialized in battery manufacture.
In this research, four [
39,
40,
41,
42] of the five papers included that deal with a topic linked to the field of oil are devoted to the forecast of the evolution of crude oil prices. The fifth paper [
31] forecasted the daily closing stock prices of the 13 largest oil and gas sector companies of the Nigerian Stock Exchange (NSE). For this reason, this research has been included in both fields. Finally, regarding the field of energy, only one paper has been found [
43]. This research is focused on the forecasting of the price evolution of the most important clean energy exchange traded funds.
Table 3 shows the families of methodologies employed in the articles under analysis. As can be observed, most of them make use of machine learning methodologies. The number of methodologies employed is considerable and includes different kinds of artificial neural networks like the adaptive neuro fuzzy inference system (ANFIS) [
44], back propagation neural networks [
45], extreme learning machines [
46], feed forward neural networks [
47], generalized regression neural networks [
48], the long short-term memory network [
49], radial basis function neural networks [
50], random vector functional link (RVFL) networks [
51], recurrent neural networks [
52] and wavelet neural networks [
53]. Other kinds of machine learning methodologies employed in the research under study are tree-based algorithms [
54]. More specifically, the research considered made use of decision tree bagging [
55], extreme gradient boosting [
56], gradient boosting [
57] and random forest [
58]. In addition, other machine learning methodologies like support vector machines [
59] and clustering [
54] were employed by researchers. Please also note that in this paper, methodologies like generalized linear models, least absolute shrinkage and selection operator (LASSO) [
60] and logistic regression [
61] have been included in the section related to machine learning methodologies.
Other non-machine learning methodologies of interest employed in the papers under analysis and that are classified in the category were Bayesian models [
62], stochastic differential equations [
63], geometric Brownian motion [
64], and wavelet transform [
65]. In the case of the geometric Brownian motion, this is due to its relationship with the Black-Scholes equation [
66]. Also, an econometric methodology called the target capacity utilization rule [
67] was found to be of interest by researchers.
Some of the papers under study also made use of time series methodologies. The methodologies employed were as follows: the autoregressive moving average model (ARMA) [
68], the autoregressive integrated moving average models (ARIMA) [
69], seasonal nonlinear autoregressive models [
70], and the seasonal autoregressive integrated moving average (SARIMA) [
71].
It is also worth stating that in five of the 13 manuscripts under analysis, different kinds of artificial neural networks were employed, this being the most common methodology of all those considered by the authors. The next most popular methodologies were different kinds of time series forecasting, applied either with any machine learning methodologies or alone. Also, in four papers Brownian movement is applied, in some cases through the Black Scholes equation. With three papers the next most common model was regression in its different forms and, finally, only support vector machines were applied in more than one paper, more specifically in two.
Table 4 presents a list of all those research papers that made use of any kind neural networks topology among all those machine learning methodologies that employ them.
Table 5 lists those papers that make use of any machine learning methodology that is not neural networks. The papers listed in
Table 5 are classified into three main groups according to the methodologies applied: Tree-based algorithms, regression, and others. In the following paragraphs there is a brief description of all the research listed in
Table 4 and
Table 5. Please note that some of the papers feature in both tables.
In the study by Fu et al. [
36], the authors suggest a hybrid system for forecasting power prices. This consists of modules for data analysis, sub-model selection strategy, optimized forecasting processing, and model evaluation. The aforementioned hybrid system takes advantage of the strengths of a single model, enhancing the combined model’s forecasting capabilities. The experimental findings demonstrated that the suggested method selects appropriate sub-models successfully and predicts future trend changes in the price of electricity. As a result, the system may be a useful tool in the design and construction of smart grids. The proposed hybrid forecasting model made use of the following neural networks methodologies: ANFIS, back propagation neural networks (BPNN), extreme learning machines (ELM), generalized regression neural networks (GRNN), long short-term memory network (LSTM), radial basis function neural networks (RBF) and Elman’s recurrent neural networks (RNN). A wavelet neural networks (WNN) article is also listed in
Table 5, as it also made use of support vector machines (SVM) as a benchmark methodology.
The research of Lu et al. [
39] proposed the study and forecasting of the evolution of crude oil prices by making use of an innovative model based on LSTM able to select those variables of importance for said price forecasting. The research made also use of the elastic-net regularized generalized linear Model (GLMNET), spike-slab lasso method, and Bayesian model average (BMA) to select the core influence factors. Secondly, the LSTM was employed, and afterwards, six different forecasting techniques, such as random walk (RW), ARMA, RNN, WNN, GRNN and LASSO were used to forecast the price. According to the results shown by the authors, the variable selection-LSTM method outperforms the benchmark methods in both level and directional forecasting accuracy.
The work of Oyewola et al. [
31] made use of different machine learning methodologies and proposed a nature-inspired algorithm based on differential equations known as auditory algorithms (AA) by the authors. This program mimics the auditory system of the human ear. Some machine learning methods and continuous-time stochastic processes are used to compare the performance of AA. In addition to continuous-time models like stochastic differential equations (SDE) and geometric Brownian motion (GBM), machine learning methods including logistic regression (LR), SVM, feed forward neural networks (FFN) and RNN were also used. The results obtained by the AA outperformed the benchmark methodologies when applied to the prediction of the daily closing stock prices of the 13 largest companies in the oil and gas sectors of the Nigerian Stock Exchange (NSE).
In order to forecast electricity spot prices, Saâdaoui and Rabbouch’s research [
35] introduced a novel approach that made use of wavelet-based hybridization that utilized nonlinear smooth functions, the autoregressive fractionally integrated moving average (ARFIMA) model, and feedforward artificial neural networks. These patterns of power time series, including the nonlinear trend and various seasonal influences, may be precisely extrapolated over the time scale thanks to the application of the wavelet decomposition in this model. The authors were also able to precisely infer key patterns of power time series. Examples of this are the nonlinear trend and numerous seasonal effects in this study thanks to the use of wavelet decomposition. In order to test the model performance, hourly power prices from the Nord Pool Exchange were employed. Please note that in this research, hourly information from the years 2012 to 2017 was employed, which means a total of more than 50,000 records were accessed. As expressed by the authors in this manuscript, the model outcome confirmed that the proposed method was capable of outperforming the benchmark methodologies employed in this paper, namely the regression SARIMA model and the seasonal nonlinear autoregressive model.
The work presented by Saâdaoui [
34] defined a new machine learning model based on an artificial neural network called seasonal autoregressive neural network (SAR-NN). This artificial neural network is a dynamic feedforward and was primarily designed to predict electricity costs. SAR-NN is an autoregressive model based on artificial neural networks that only take into account autoregressors that are lagged by a multiple of the period
p of the dominant seasonality. This neural network advances step by step, enabling the generation of accurate projections for numerous steps in the future. This model was tested making use of hourly prices of energy in the Nord Pool Scandinavian power market, which is one of the most mature energy markets worldwide. The results were then compared with those achieved by other methodologies like feed-forward neural networks, SARIMA, and seasonal nonlinear autoregressive. It is worth noting that the neural network architecture proposed by the authors was conceived by considering the model to be a system of hour-by-hour daily-indexed time series. Technically, this might be done by creating an autoregressive artificial neural network model that only takes into account variables that are lagged by multiples of 24, which is the dominant period. The result is a multi-steps-ahead forecast when hourly forecasts are moved in the artificial neural network. With the use of an empirical study that used the Nord Pool spot prices data as its foundation, the model’s performance was evaluated, and the new approach was contrasted with three benchmark models. The authors were able to claim that the new artificial neural network model they had presented could provide very accurate extrapolations and required minimal effort to execute because the results of the new methodology were encouraging.
The research presented by Yu et al. [
41] insisted on the drawback of those models that made use of a single machine methodology for price forecasting. The main reason given by those authors is that they cannot capture the complex hidden factors of price variations, which in the case of this research refers to crude oil prices. In order to achieve a satisfactory performance, the authors recommended using RVFL networks as the foundational models for the ensemble learning framework and studied diversity tactics in the proposed RVFL network ensemble forecasting model. According to the experimental findings, choosing diversity techniques properly would boost the accuracy of ensemble learning models.
Table 5 cites, among others, the work of Krome et al. [
37]. This research employed a method for determining clusters of time series. In the case of this research, what the authors propose helps to simplify time series analysis. The methodology was applied by making use of one-day-ahead hourly prices of the electricity market in Germany for 2018. Please note that although this research would not be considered as a work of price forecasting, it was included in this study as the results obtained can be useful for building a forecasting model.
Eight technical indicators acceptable for the forecasting of hourly electricity prices from the Irish Integrated Single Electricity Market were reported in the work by McHugh et al. [
32]. The three primary categories of price indicators—trend, oscillator, and momentum—are taken into account by the suggested indicators. Building technical indicators from the raw price data for energy helps in the understanding of market behaviour and in uncovering data to forecast future lucrative pricing. Data on electricity prices was gathered for the suggested indicators between February 2019 and March 2020. On the basis of the suggested technical indicators, three machine learning regression algorithms were trained. Those models were Extreme Gradient Boosting, Gradient Boosting, and Random Forest. The results obtained by the authors affirm that forecasting is more accurate when models are trained making use of certain technical indicators described in the paper than when models make use of raw prices.
Finally, the last paper that made use of a machine learning methodology was the one written by Sadorsky [
43]. In this research the author employed tree bagging and random forest in the framework of traded funds. More specifically, the author forecasted five traded funds included in the clean energy exchange. Those funds are: Invesco Wilder Hill Clean Energy ETF, the iShares Global Clean Energy ETF, the First Trust NASDAQ Clean Edge Green Energy Index Fund, the Invesco Solar ETF and the First Trust Global Wind Energy ETF. The results obtained with this methodology were compared with those achieved by a classic model: the logistic regression model. The fact that some well-known technical indicators from this research were used as input variables for the models employed in this study was also intriguing. Examples of these models were the relative strength indicator (RSI), stochastic oscillator (slow, fast), advance-decline line (ADX), moving average cross-over divergence (MACD), price rate of change (ROC) on balance volume, and the 200-day moving average. These indicators were calculated from daily data rather than directly from daily fund prices. The outcomes demonstrated that predictions of stock price direction made using decision tree bagging and random forests more precise than those made using logistic regression models. Tree bagging and random forests approaches in this study generate accuracy rates of between 85% and 90% over a 20-day forecast horizon, while the logistic regression models employed as a benchmark produce accuracy rates of between 55% and 60%.
As was presented in
Table 6, some of the papers considered in this research did not make use of machine learning methodologies, which goes to show that they are not the only kind of forecasting methodologies employed in this field. Those articles are now described in order to give a complete overview of those methodologies that have been employed in the last years.
In the study of Bollapragada et al. [
40], the researchers used an econometric approach to create a forecasting model that could forecast oil prices. This aided management in lowering operational costs, boosting profits, and strengthening competitive advantage. The model was tested using historical data from 1987 to 2017 and using the Target Capacity Utilization Rule recursive simulation model [
67] to forecast crude oil prices for the years 1991 to 2017. The study modified a few model parameters to find the best monthly adjustment, and the results obtained were found to be of interest.
A Brownian motion-based optimal stopping model was put forward by Boubaker et al. [
42] in their study to determine the best moment to sell oil crude futures contracts. This model relies on the border and drop in crude oil futures prices to determine when a downturn will start. The authors’ findings, which were supported by numerical simulation and empirical investigations, demonstrated the efficiency of the suggested model for the ideal stopping time.
The work of Pawłowski and Nowak [
38] dealt with a model of electricity spot prices that made use of the Black and Scholes model based on Brownian motion [
66] with fuzzy parameters. In order to show the model performance, the research presented several numerical examples.
The research of Yang et al. [
70] made use of wavelet transform to forecast the evolution of several companies’ stock prices. One of the companies analysed in this research was Eve Energy Co. Ltd. (Huizhou, China), a battery manufacturer. Although strictly speaking this company does not belong to the core business of the fields under analysis, this is one example of the type of company employed by gas and oil firms with the aim of making them diversify and become greener. By comparing the trend of the stock prices and the data of the individual stocks, the usage of the plate in the leading stock data and individual stock data was compared and analysed. Comprehensive data analysis is used to evaluate the stability of the individual stocks, allowing investors to understand the volatility of the stock market in a clear and simple way. However, more research on individual stock data and the trend of leading stocks is still required for a correct analysis of volatility.
It is also worth pointing out that six of the thirteen articles analysed in this research proposed new algorithms. They are all listed in
Table 6, which provides a short description of the proposed algorithms. All of them employed machine-learning-based methodologies, except for the work of Saâdaoui and Rabbouch [
35], which made use of wavelets, and the work of Oyewola et al. [
31], which was based on differential equations. The works of Fu et al. [
36], Lu et al. [
39] and Saâdaoui [
34] made use of different kinds of neural networks, while the proposal in the research of Krome et al. [
37] was clustering methodologies.
6. Discussion
The articles selected and presented in this paper show that research on forecast methodologies applied to the fields of energy, electricity, oil and gas can be classified into four broad groups. These are machine learning, time series, econometrics, and a fourth category of others in which other interesting methodologies like wavelets are included. It is also remarkable that most research papers written in the last 5 years made use of machine learning methodologies and that some of those papers combined them with other non-machine learning techniques.
Although we searched in three of the most relevant databases and retrieved more than 1600 documents, the present research presents some limitations. The first of these is that only articles in the English language were selected, which could result in a selection bias. In addition, the results obtained are also conditioned by the keywords employed for the queries. Finally, it is also noteworthy that no work has been found in which predictions are made regarding either mining companies or raw materials obtained in mining. In spite of this, the authors are aware that these kinds of studies [
72] can be found in other databases.
A surprising fact is that despite the great interest that deep learning has aroused in many branches of science and technology in recent years, no article has been found that made use of any of the methodologies included in this family. Finally, it should also be noted that through the searches that have been proposed, a large number of results were obtained that were not relevant at all or related in any way to the search carried out.
As the reader will be aware, this is not the first paper about literature reviews that includes articles about forecasting methodologies in the fields of the energy, gas and oil industries. Although it is relatively easy to find papers that review the state of the art of forecasting methodologies applied to the demand of oil, electricity or gas or to the forecasting of stock markets, it is, however, not so common to find research focused on the fields under study in the present paper. From the authors’ point of view, the most relevant works published in the last decade are those that are briefly summarized and compared with the present work in the following paragraphs.
Among the most outstanding research is that published in 2018 by Tamba et al. [
73], which presents a state-of-the-art survey of those papers that forecast natural gas production, consumption, demand, etc. This paper made an exhaustive revision of all of the works published from 1949 to 2015 that include machine learning methodologies. Despite this, none of the papers included in this work forecasted the stock prices of gas companies.
Another article that may be considered to be of interest is the one published by Lago et al. in 2021 [
74], in which they review the state of the art of algorithms devoted to forecasting of one-day-ahead electricity prices. Please note that this paper is only focused on this particular topic and suffers from not considering the forecasting of stock prices of electrical companies in any case. In a similar vein is the research published in 2014 by Weron [
75] and the one of Singh and Mohanty of 2015 [
76], while as far as the authors know, none of the revisions of the state of the art of electrical companies focus on their company’s stock price. Finally, and in a similar way to that of the previous research into the state of the art of forecasting of electricity prices, the research published by Acaroglu and García Márquez in 2021 [
77] is also worth mentioning here.
Another work of literature review is the one by Kumbure et al. (2022) [
78]. This deals with stock market forecasting without considering any specific field and does not even mention those under analysis in our work. Another paper of interest is the one published by Thakkar and Chaudhari in 2021 [
79], which analyses the different kinds of deep neural networks that have been employed for stock market forecasting, but none of these considered the forecasting of companies in the fields under analysis in this research. Therefore, and as a summary of the articles that make a review of the state of the art, it can be said that none of them performs an analysis that includes all the markets contained in our work.
We would like to say that, in our opinion, the main interest of the present research is that it provides the reader with a complete list of updated papers that employ different forecasting methodologies in the industries of electricity, energy, gas and oil. The reader has access to a classification of articles by industries and methodologies (machine learning, time series, econometrics, etc.). The articles listed in this paper would be a good starting point for anybody interested in this topic and would help to accelerate their learning process in this field of research. Please also note that the flowchart presented in
Figure 1 would be of interest for all those involved in a literature review.
The main limitations of this research are two-fold. On the one hand, only papers from the last five years have been considered. On the other, there are other interesting databases whose articles have not been included in this work. The reason for this is the large number of articles that would have had to be managed by authors.


