1. Introduction
According to the power type, autonomous underwater vehicles (AUVs) can be divided into thermal power and electric power. The electric-powered underwater vehicle has excellent advantages over thermal-powered underwater vehicles in structure and performance, so it has developed rapidly in recent years [
1]. Compared with the thermal-powered underwater vehicle, the electric-powered underwater vehicle has low noise, almost no track, and the navigation depth hardly affects its performance. It also has more advantages in structure, cost, and maintenance. Therefore, more and more countries adopt the electric power mode. The power system is the heart of the underwater vehicle, and the power battery is the most important part of the power system. Therefore, the research of power batteries is significant for the development and application of underwater vehicles. Lithium-ion batteries have a high energy density, high working voltage, low self-discharging rate, and convenient use and maintenance compared with other secondary batteries. In recent years, lithium-ion batteries have been widely used in the fields of electronic products, vehicles, aerospace and so on [
2,
3,
4]. So far, most underwater vehicles have used lithium-ion batteries as their power system. In order to ensure the safety and reliability of the battery system, the basic state of the battery, SOC (state of charge) [
5,
6], the SOP (state of power) [
7], and the SOH (state of health) [
8,
9], should be continuously monitored. The health status and available capacity of lithium-ion batteries will be significantly affected by temperature. Considering the special working environment of the AUV’s power battery pack, which includes the confined space caused by deep water and high pressure, there is great difficulty in heat dissipation. That will lead to the battery working under high temperatures [
10]. Therefore, it is urgent to carry out research about the impact of different temperatures on the performance of lithium-ion batteries.
In order to study the influence of discharge heat generation on the lithium-ion battery pack, it is necessary to establish the system temperature field in the discharging process.
Then, we need to analyze how the discharge performance is affected by temperature. Many researchers are committed to studying the thermal model to determine the temperature distribution of the battery. Bernardi et al. first established the general thermal model [
11] of the battery system based on energy balance. They believe that the battery temperature results from the interaction between Joule heat, mixing heat, phase change heat, and electrochemical reaction heat. Assuming that the temperature distribution is uniform and changes with time, the heating rate can be calculated. Rao and Newman proposed a simplified thermal model to determine the heating rate of the battery system. In their research, the effects of mixing heat and phase change heat were ignored [
11]. Using the thermal model proposed by Bernardi et al., Dong and Baek of Seoul National University, Korea, studied the heating mechanism of the battery [
12]. The results show that under the condition of high-rate discharge, irreversible Joule heat is dominant. In contrast, under the condition of low-rate discharge, the reversible entropy heat generated by the electrochemical reaction is the primary heat generation. Forgez et al. of the Technical University of Compigne, France, established the lumped parameter thermal model of the cylindrical lithium-ion battery [
13]. The model considered the resistive heat dissipation and reversible entropy heat generation of the battery, and calculated the battery’s internal and external resistance by the steady-state method. Noboru Sato, of the Honda research center in Japan, considered three different kinds of heat: electrochemical reaction heat; polarization heat; and Joule heat [
14]. They also studied the irreversible and reversible heat production difference with the depth of discharge DOD [
15].
Compared with mature battery heat production and temperature field analysis, the research of how the electrical performance of battery cells is affected by temperature is relatively weak. In many applications it is essential to predict the SOC of the battery. All engineers build according to the SOC prediction method based on Peukert’s equation. However, the equation has significant limitations. Unless the battery is discharged at a constant current and constant temperature, Peukert’s equation cannot be used to accurately predict the residual capacity [
16]. In practical cases, the battery will be discharged at different currents and experience various temperatures. In many occasions, Peukert’s equation is used for power monitoring and supply systems [
17]; however, the drastic change of discharging environment poses a challenge to this method. Because the average discharge current cannot accurately characterize the process of discharging, it is impossible to ensure that the battery’s temperature remains constant during discharging. The error caused by the average current model may be quite large; therefore, it is necessary to introduce an equivalent power loss based on the real-time state to evaluate the battery state of charge.
Ryan O’Malley used an improved Peukert capacity model to study the available capacity of the battery [
18]:
where
represents the measured electric discharged during a period of time. the
represent the deduction of equivalent electricity during the time,
. and
represent the reference temperature value and reference current value. From the Equation (1), we can see with the increase of current and the decrease of temperature, the capacity deviation increases. The author believes that the effects of these factors are multiplicative rather than superposition, and the impact of temperature on chemical reaction rate is exponential [
19]. Equation (1) shows that when the current of discharging increases, the reduction rate of effective capacitance increases. This is consistent with the commonly used Peukert equation. However, this model shows that with the decrease of battery temperature, the reduced effective capacity during discharge will also increase. Doerffel [
20] illustrated this phenomenon in his article. This is because when the lithium-ion battery works at high temperatures, the diffusion of lithium-ion will accelerate, which will also accelerate the internal side reactions of the lithium-ion battery, the capacity will increase slightly and the internal resistance will decrease slightly. In the process of charging and discharging at low temperatures, active lithium will deposit on the electrode surface. As the migration ability of lithium ion in the active electrode material and the conductivity of electrolyte decline, the capacity of lithium-ion battery will decrease rapidly and the internal resistance will increase sharply [
21,
22,
23,
24]. Therefore, the capacity and internal resistance of lithium batteries vary greatly at different temperatures.
If the battery size is large, Peukert’s law may be distorted, because when the battery size is large the internal and external temperature difference will increase significantly, and the overall temperature of the battery will also be significantly affected by the discharging rate. In this case, only controlling the ambient temperature and investigating the influence of C-rate on the capacity of battery will lose precision.
2. Methods
Improved discharge capacity model: In order to improve Peukert’s equation, a transformed method is proposed to define the available capacity of battery. In this paper, the available capacity of the battery is defined as the electricity discharged by the battery at a certain rate from the full state. When the output voltage of the battery reaches the cut-off voltage, it is regarded as the end of the discharging and the amount of electricity discharged in this process is defined as the available capacity of the battery. This assumption involves the absolute maximum residual capacity, which reaches zero when the discharge depth of the battery reaches 100% and can never be lower than this value. Considering the influence of various discharging conditions, the relational formula of how the discharging procedure affect the residual capacity can be listed as follows:
where
is the effective capacity of the battery at time
t,
indicating the effective capacity of the battery at time
t + 1. As mentioned earlier, the loss of effective capacity of battery in each time will be affected by the discharging current (I) and battery temperature (T):
The coefficient k is to combine the reduced effective capacity with the measured electricity by multiplying the actual current by time. The value of k is related to the battery temperature and discharging current.
From the discharging data of experimental battery in this article, we can get the capacity-temperature relationship for the lithium-ion battery. At high temperature, the temperature variation has little effect on the battery capacity, but when the temperature reaches a lower range, the battery capacity will be more sensitive to the temperature variation. Therefore, conditions similar to Peukert’s law should control this index. In this paper, an Arrhenius Equation about temperature
T is introduced to characterize the equivalent capacity consumed by the battery at a certain time:
The parameters () depend on the chemical and physical properties of the battery. These parameters determine the influence of temperature on the discharge capacity. However, the precise parameters of this model still need to be verified by experiments.
Battery available energy calculation model: When the battery capacity is known, the available energy of the battery needs to be calculated through the circuit model in combination with the open circuit voltage and discharge current of the battery. The typical battery model is shown in
Figure 1.
Uo and
Uocv are terminal voltage and open circuit voltage respectively:
where U
r and U
p are ohmic voltage and polarization voltage, respectively. It is assumed that the internal resistance is equal to the sum of ohmic resistance and polarization resistance. There is a threshold called cut-off voltage to ensure safe in the discharging process.
Uo will drop to the cut-off voltage before
Uocv. The actual capacity of the battery is typically smaller than the maximum capacity, because of the voltage drop on the internal resistance. Since capacity, internal resistance, and discharge current have no effect on the open circuit voltage, the
Uocv of the battery is a function only about SOC [
25,
26].
Uocv and SOC are assumed to obey the following formula:
When the discharge process of the battery pack is cut off, the open circuit voltage of the battery cell is:
where
Ucut-off(dis) is the cut-off voltage of discharging and
I is the discharging current of the battery pack. Among them
represent the lower limit of open circuit voltage in the discharging process. The lower SOC limit during discharging is:
Therefore, during separate use, the SOC range of the battery cell during discharging is:
Q represents the actual available capacity [
27] of each battery under the discharging current
I,
C represent the theoretical capacity of battery cell regardless of the internal resistance:
Therefore, during battery discharging, the integral range is
SOC(
)~100% Therefore, the available energy of the battery pack is:
When
, and when
, the discharging ends. If the variable of integration is converted from t to
SOC, Equation (11) can be expressed as:
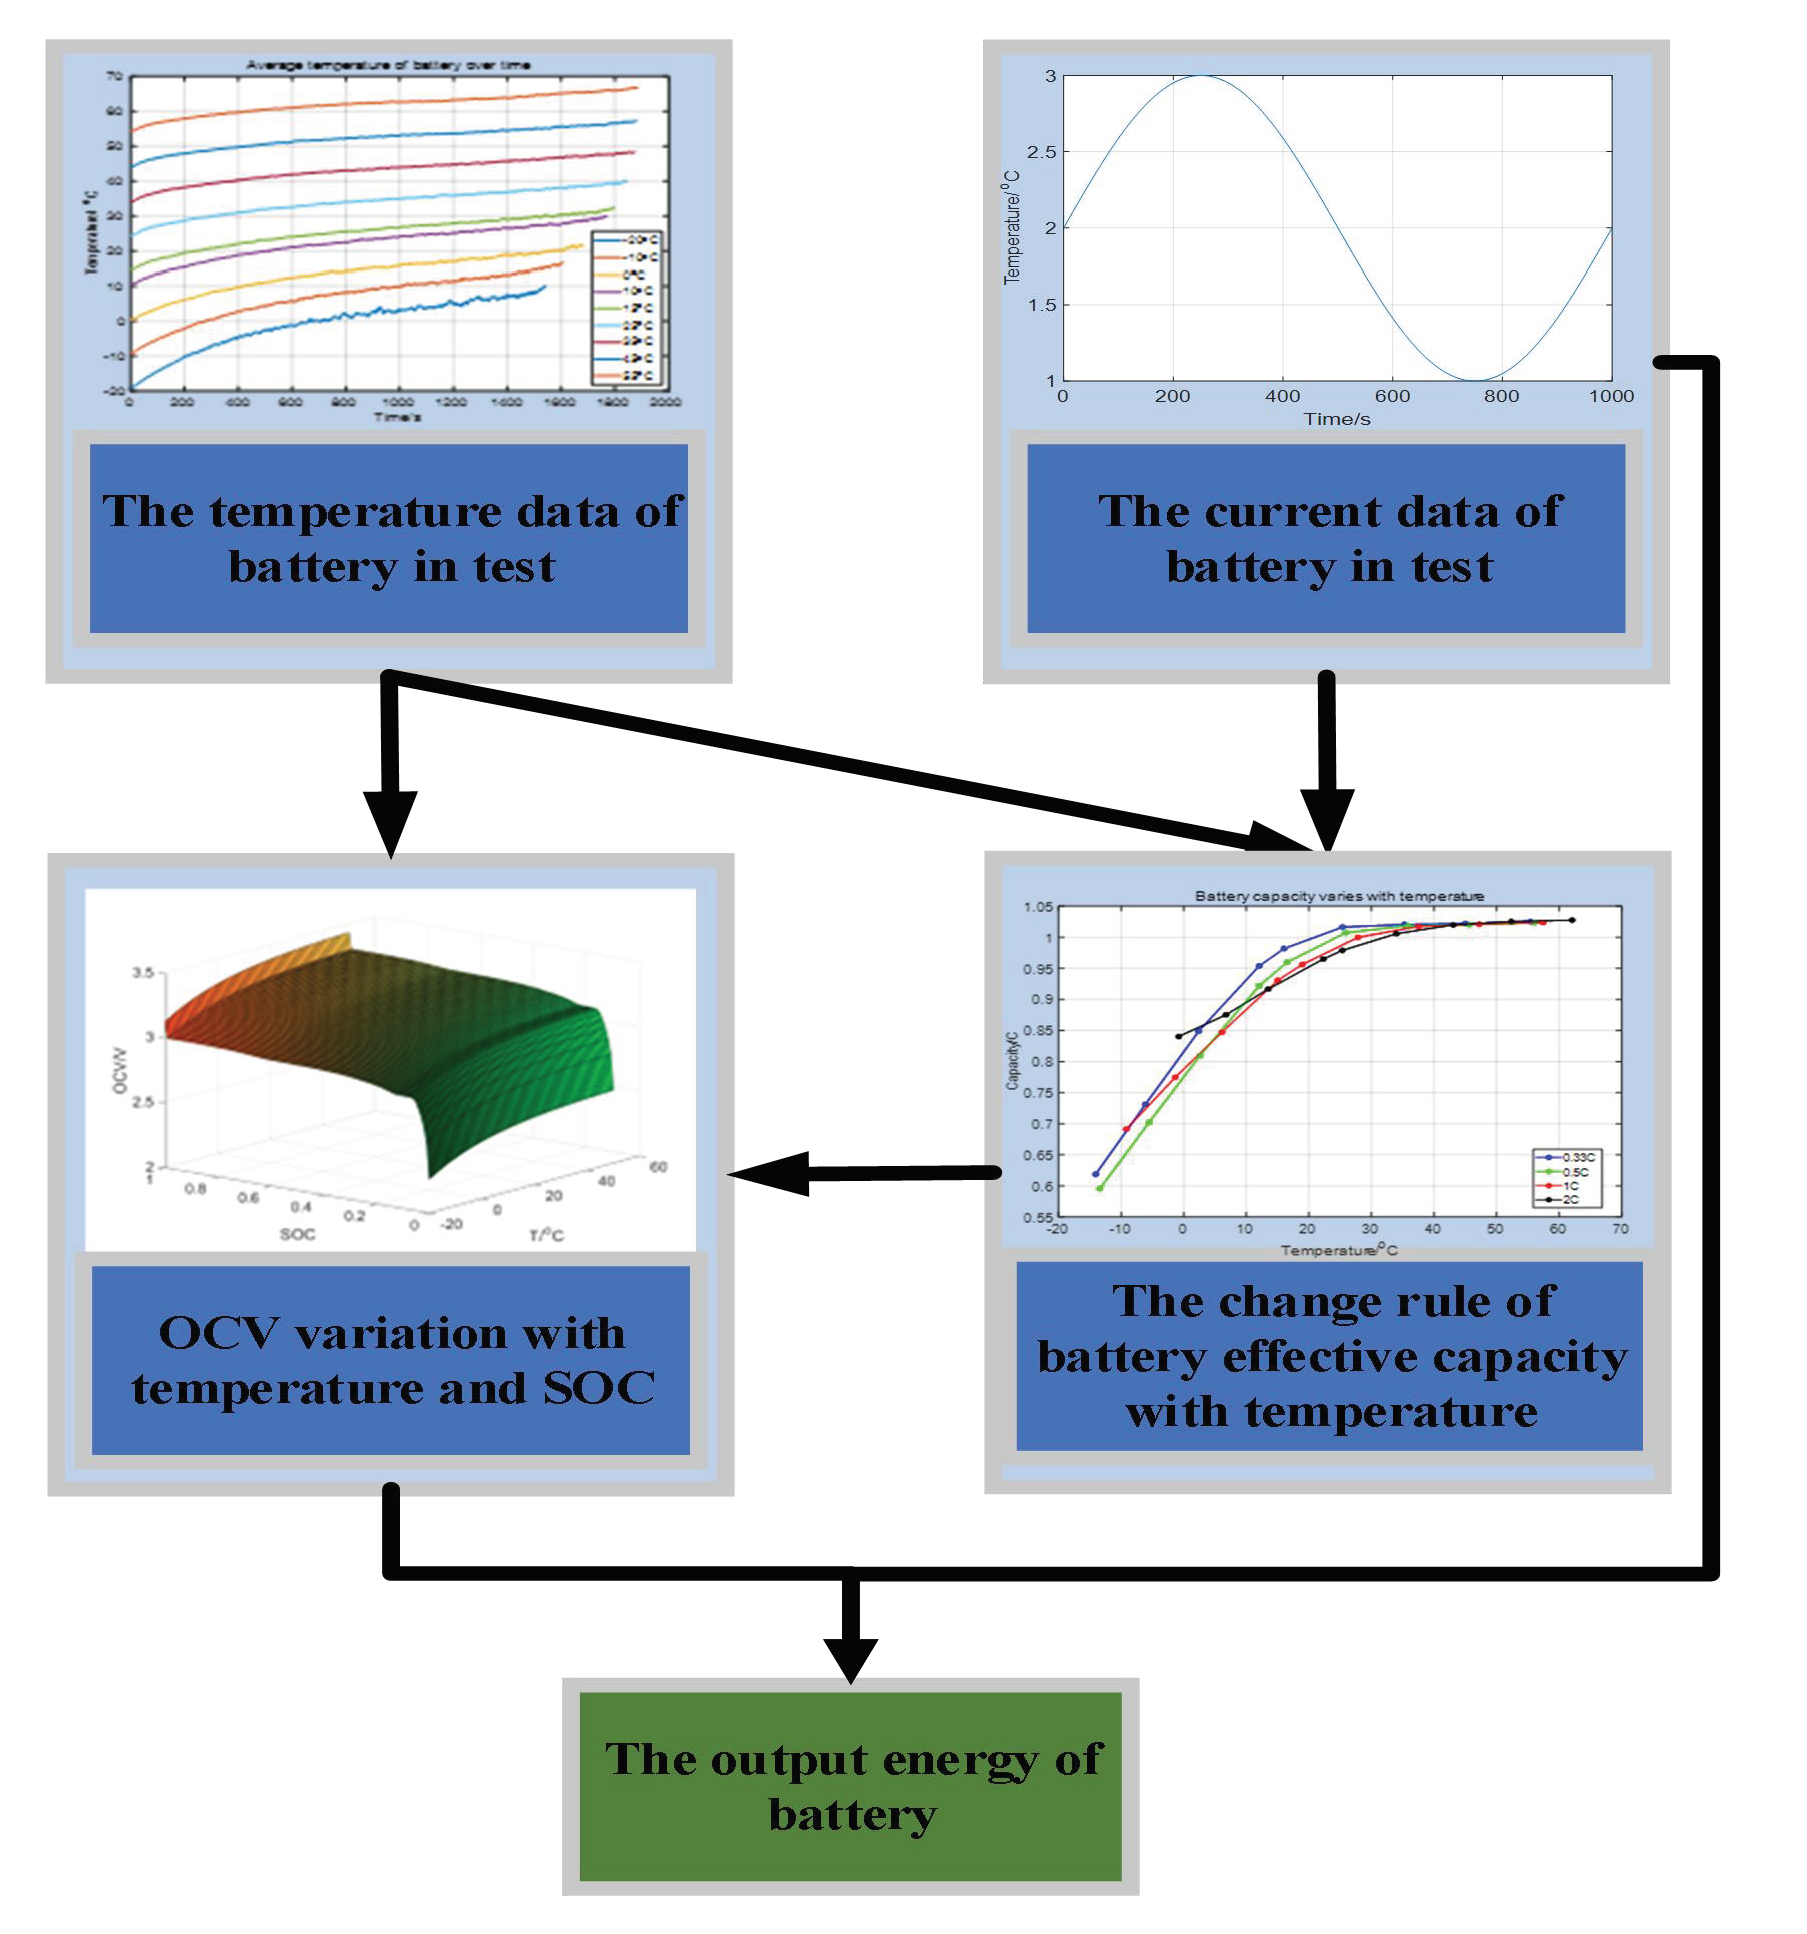
When the OCV curve, capacity and internal resistance of the battery are determined, the available output energy of the battery can be calculated quantitatively (
Figure 2).
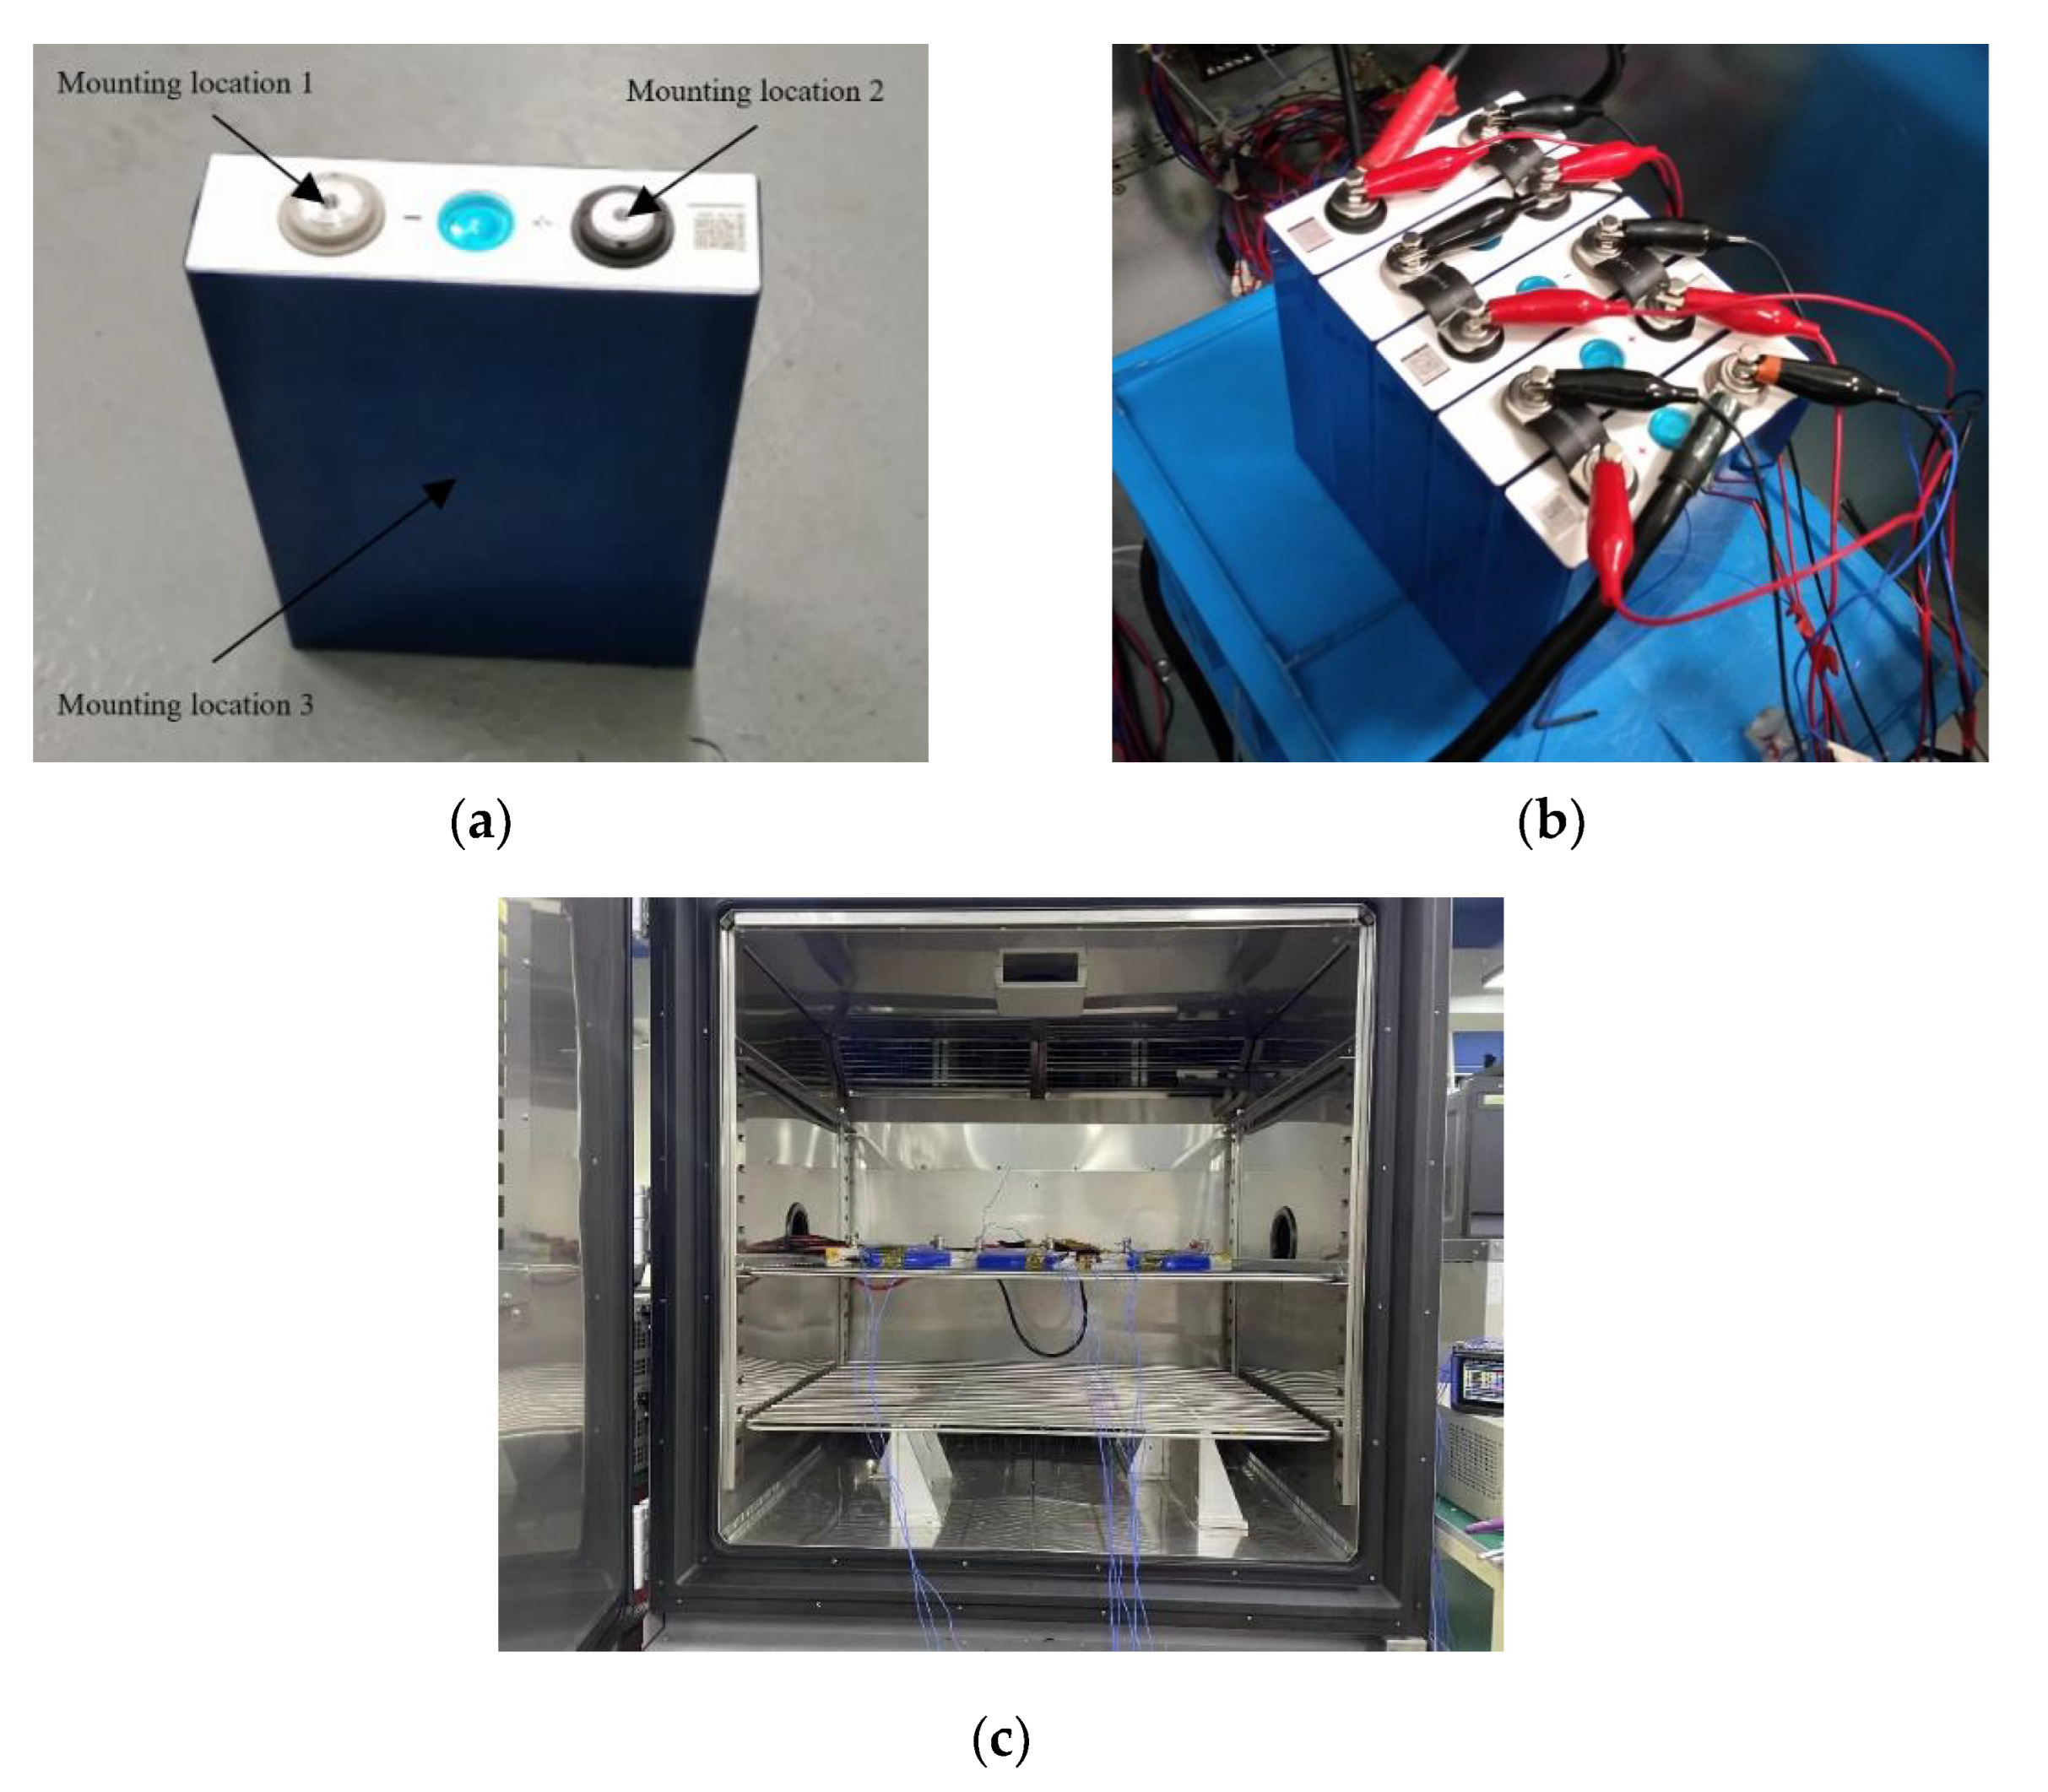
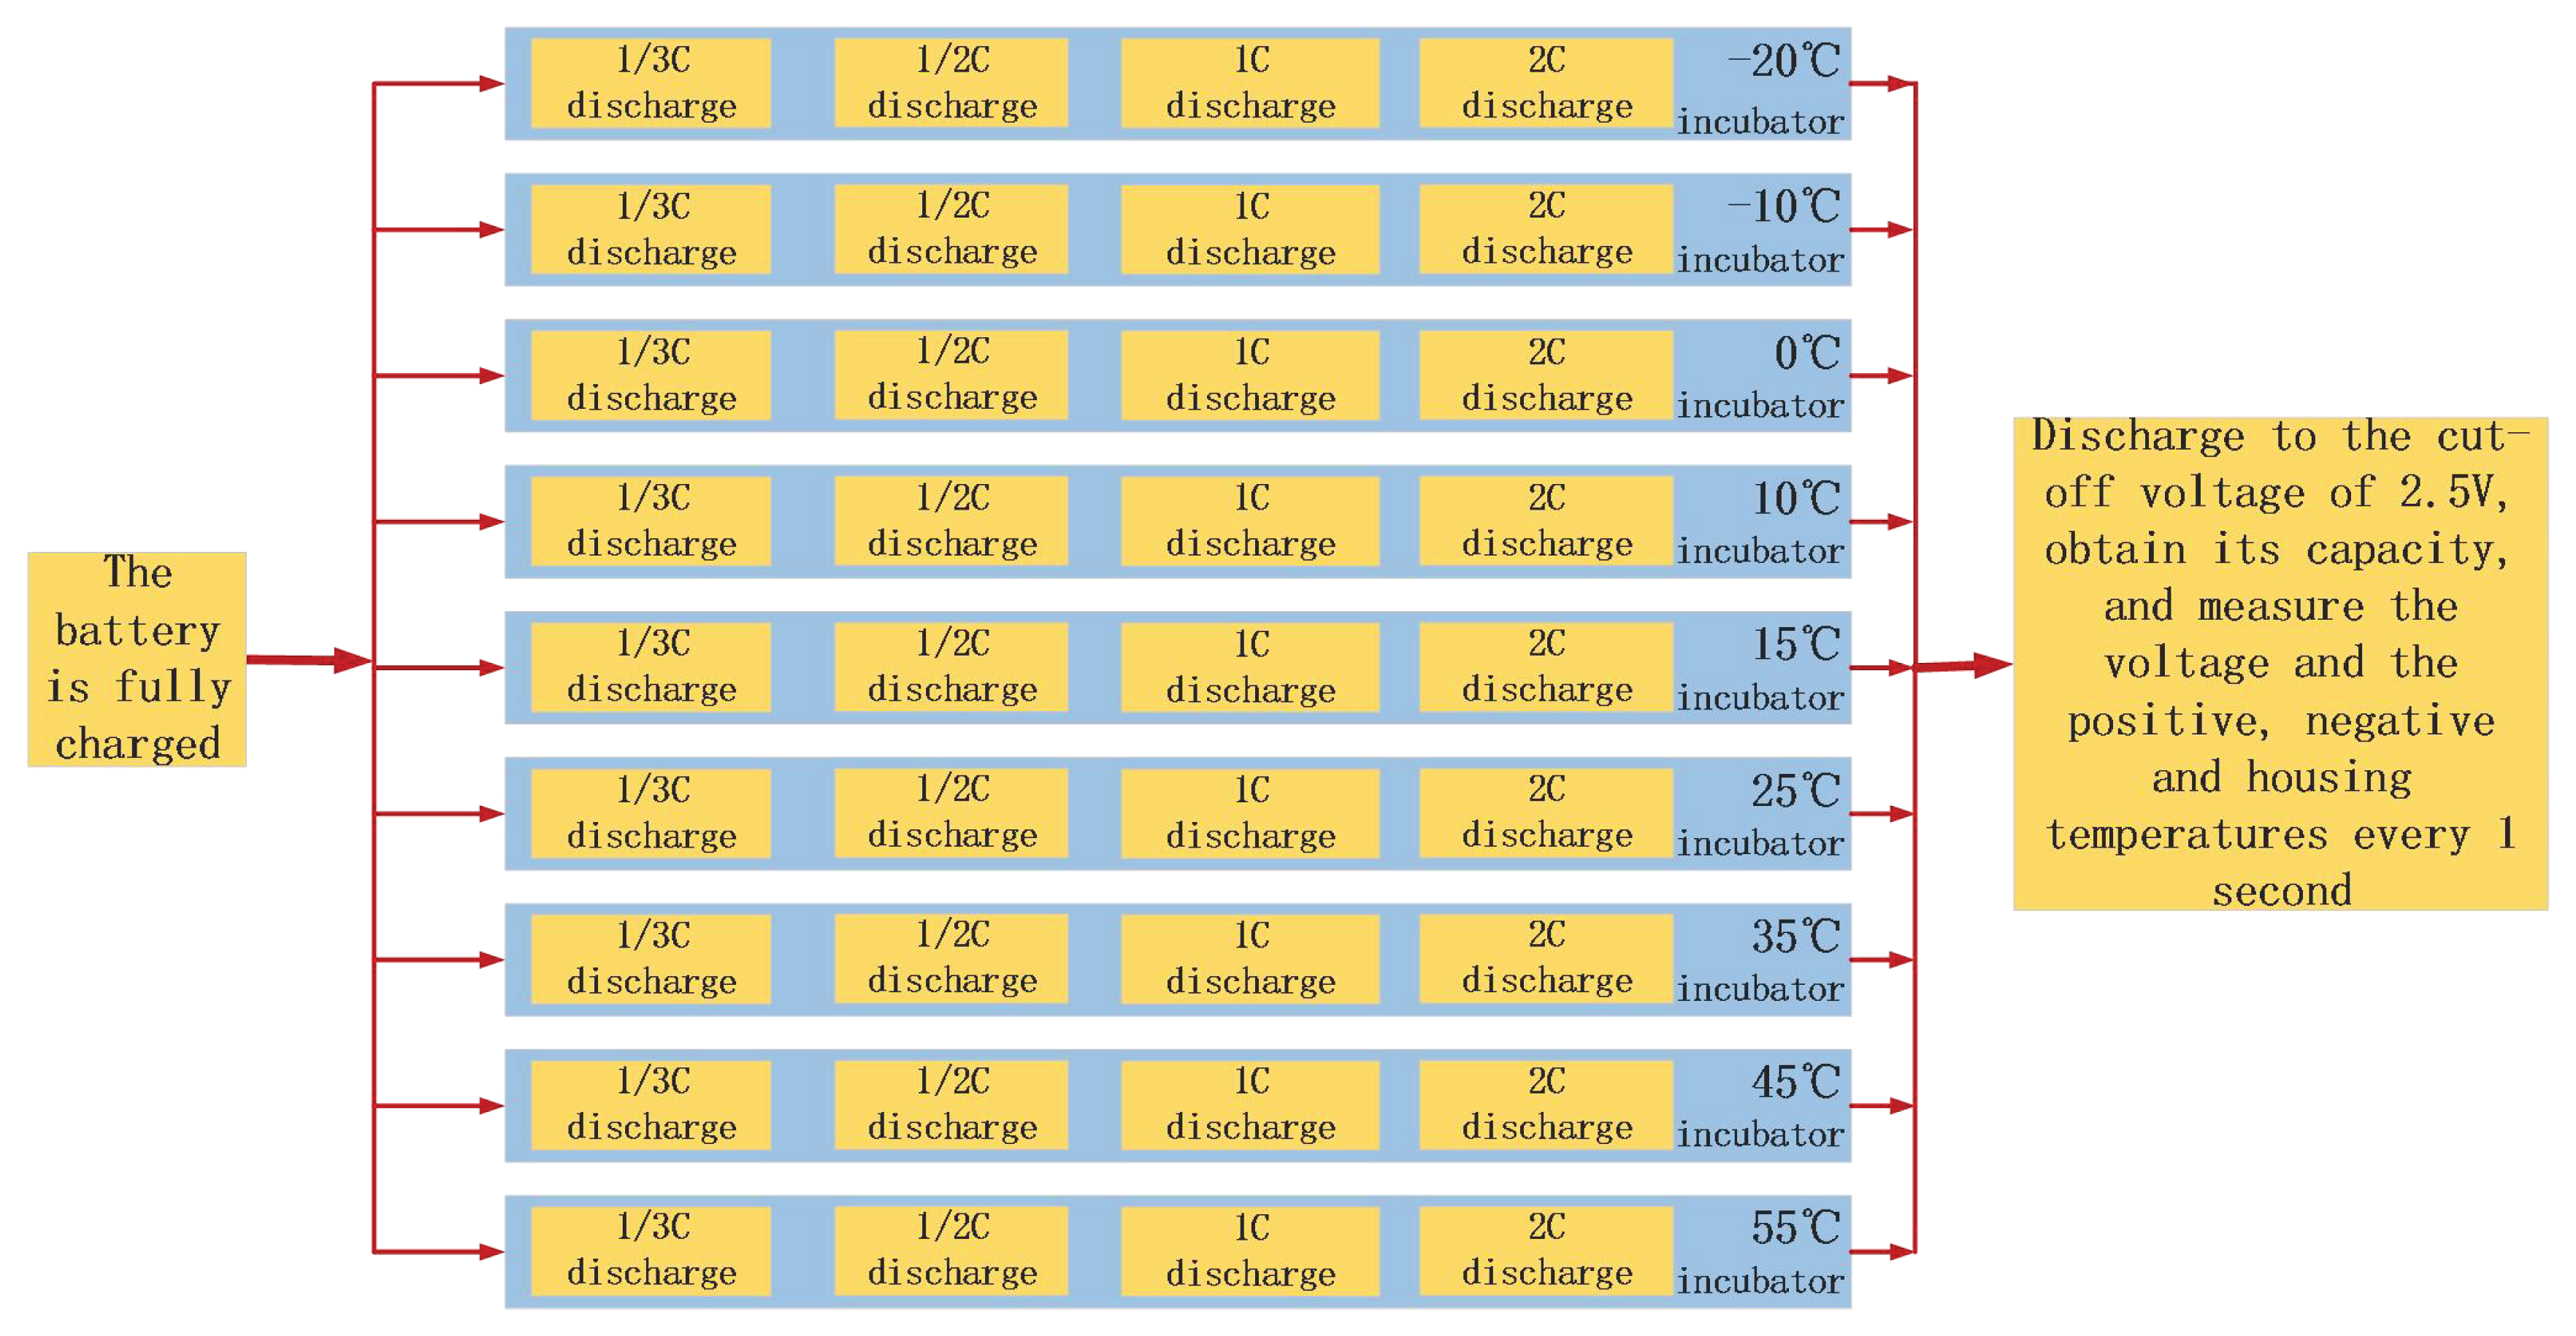
Experiment and data acquisition: In order to analysis the influence of temperature and discharge rate on the capacity and energy of the battery, we chose the LF105 battery as our experimental subject (
Table 1). It is planned to conduct discharge experiments on the battery at nine different temperatures (−20 °C, −10 °C, 0 °C, 10 °C, 15 °C, 25 °C, 35 °C, 45 °C, and 55 °C) and four different rates (1/3C, 1/2C, 1C, and 2C). We used four batteries of the same type in the thermostat charged with four rates at the same time and each battery was performed nine cycles in the test. During the process, we used the thermostat shown in
Figure 3 to ensure the temperature outside the battery, At the same time we measure the voltage and current of the batteries.
We used thermocouples to record the temperatures of the positive, negative, and shell of the battery, respectively, every second. The places of the thermocouple mounting are shown in the
Figure 3.
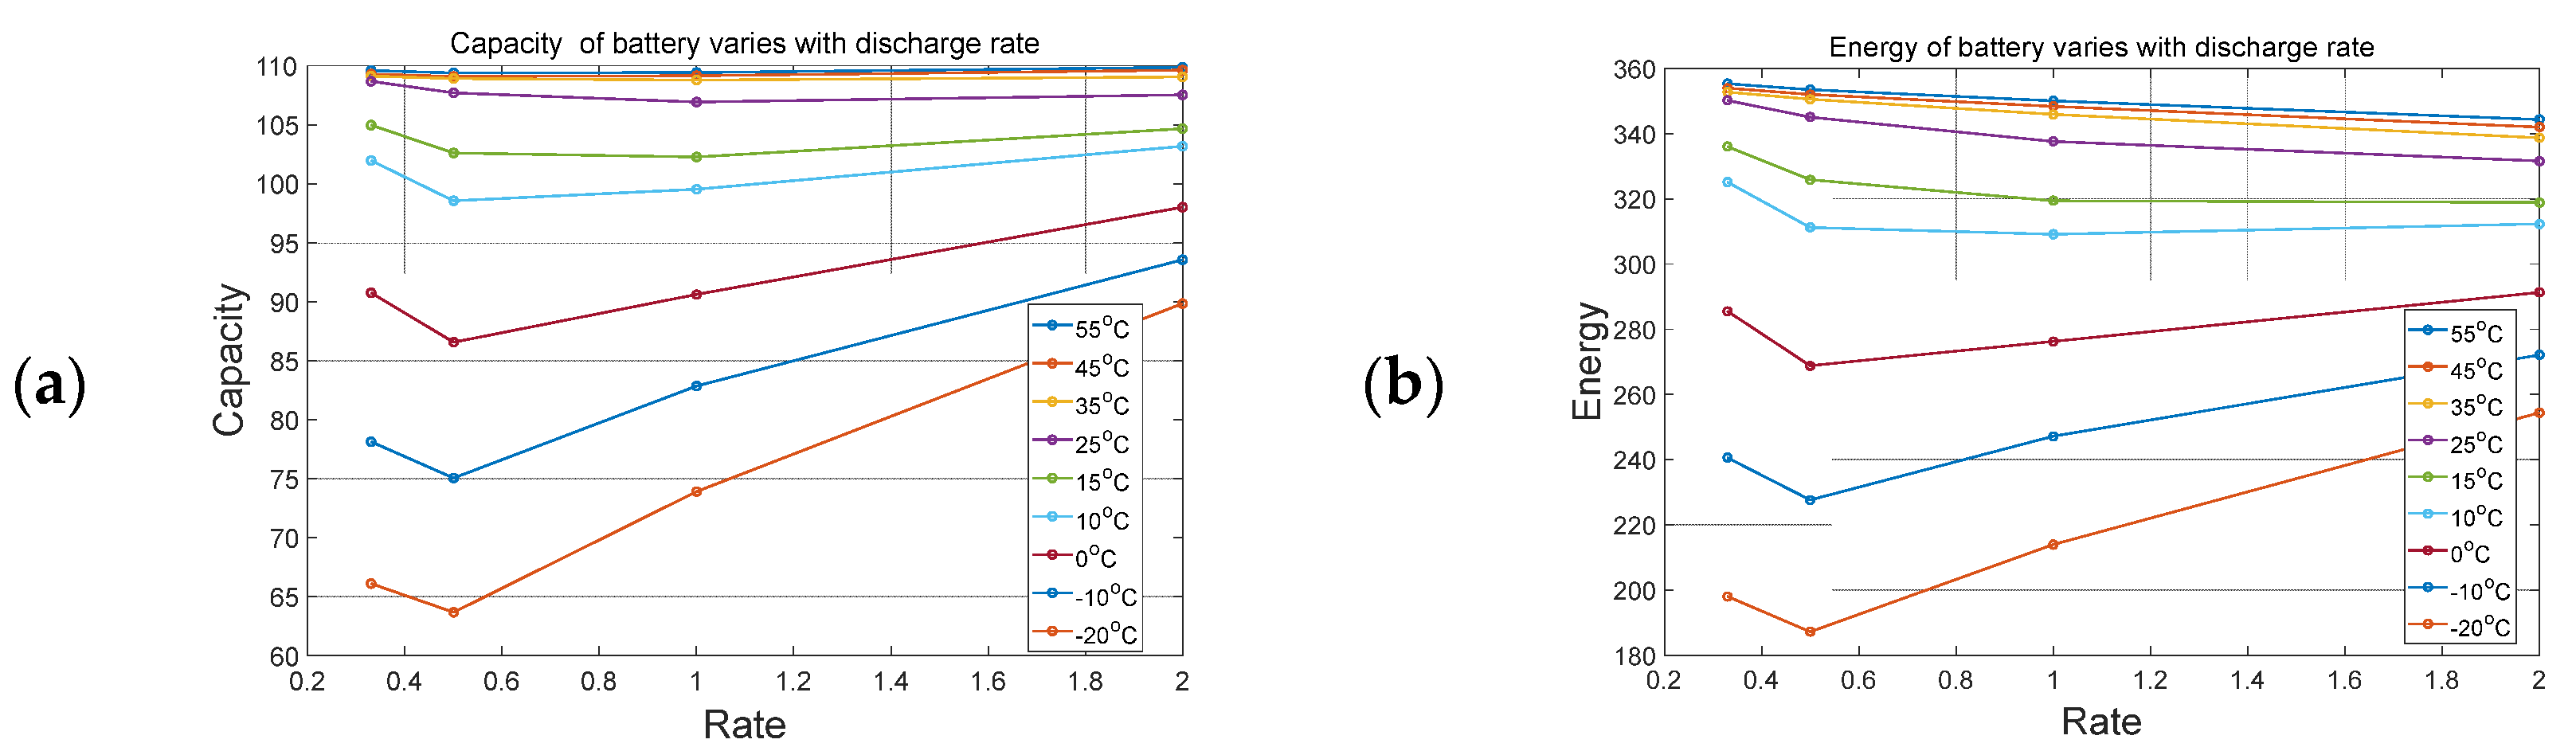
Firstly, according to the experimental data, four groups of curves can be obtained, such as the variation of capacity and energy of battery with ambient temperature and charging rate, which is shown in
Figure 4. It can be seen from
Figure 5a that when the ambient temperature is higher than 25 °C, the impact of the battery discharging rate on the battery capacity is very small and can be almost ignored. When the ambient temperature is lower than 25 °C, the battery capacity is greatly affected by temperature variation and the capacity shows a trend of first decreasing and then increasing with the increase of the discharging rate. We conclude that the average temperature of the battery has a significant impact on its capacity, because when the charging rate is large, the internal and external temperature difference will increase significantly. In the high-temperature stage, the capacity is less sensitive to the temperature variation between ambient temperature and battery temperature, while in the low-temperature stage, the capacity will be significantly affected by the temperature error. Because the effective capacity will be affected by the average temperature of battery, we define compensation coefficient k as shown in Equation (3). As shown in Equation (3), the author suggested a hypothesis that the loss of effective capacity of battery in each time will be affected by the discharging current (I) and battery temperature (T). But through the experiment obtained, we can conclude that the current has little effect on the loss of effective capacity, even the little relation between them. This can also be explained as the current difference caused the temperature difference, and the temperature further affects the effective capacity.
Generally speaking, under the discharging rate of an electric vehicle, the capacity change is closely related to the self-generated heat [
28]. There will still be a temperature differential between the center temperature and the surface temperature, even when a very high convective cooling rate is used to maintain the temperature of the battery [
12]. Therefore, the ambient temperature cannot characterize the temperature of the battery precisely. Based of the above limitations, in order to keep the measured temperature close to the internal temperature of the battery as much as possible, this paper takes the average temperature on the positive pole, negative pole, and shell of the battery, at each time as the approximate temperature of the whole battery. We used the battery capacity at 25 °C and 1C discharging as the benchmark to obtain the capacity efficiency of the battery. The curve of capacity efficiency-battery temperature is shown in
Figure 6.
Data processing and calculation: in order to characterize the influence of temperature on battery capacity, the Arrhenius Equation (4) is used to fit the curve. Then, in order to obtain the corresponding parameters, the least square method is used to deal with the multiple linear regression problem.
It is assumed that there is the following linear relationship between variable y and variable
:
In Equation (13), the parameters
are unknown, and
. Equation (13) is called multiple linear regression
are called regression variable and
are regression coefficient are regression coefficient. Setting
as n observations of
, then they meet the relationship:
Assuming are independent with each other and satisfied .
Since the assumptions that
are independent of each other, it can be seen from Equation (13) that
are also independent of each other. Therefore, the mathematical expectation of Equation (13) can be expressed as follows:
We call the equation:
as a linear regression equation of Y about.
.
In order to facilitate analysis about Equation (16), vector and matrix notation are introduced, then Equation (13) can be expressed in matrix form, we make
:
Then Equation (13) can be expressed as:
For Equation (18), the least square method is usually used to obtain ,the estimator of which meets the following conditions:
In general, the solution of (19) can be obtained by differential method as follows:
Expressed as a matrix, the system of Equation (20) can be written as:
Since the rank of
X is assumed to be
m+1,
XTX is positive definite, so there is an inverse matrix
, we can conclude from the above formula [
29]:
By substituting the solution of
into the linear regression equation, we can get:
The above formula is the linear regression equation, through which Y can be predicted.
3. Model Fitting and Analysis
In order to use multiple linear regression for analysis, it is necessary to linearize the model expression (4). We take logarithms on both sides of the Equation (4) at the same time to obtain:
Compare with formula (16) we can get:
After solving the matrix, you can get
= [−21.4855,5417]. Substituting the obtained
into the formula, we can get
,
,
in Formula (4).
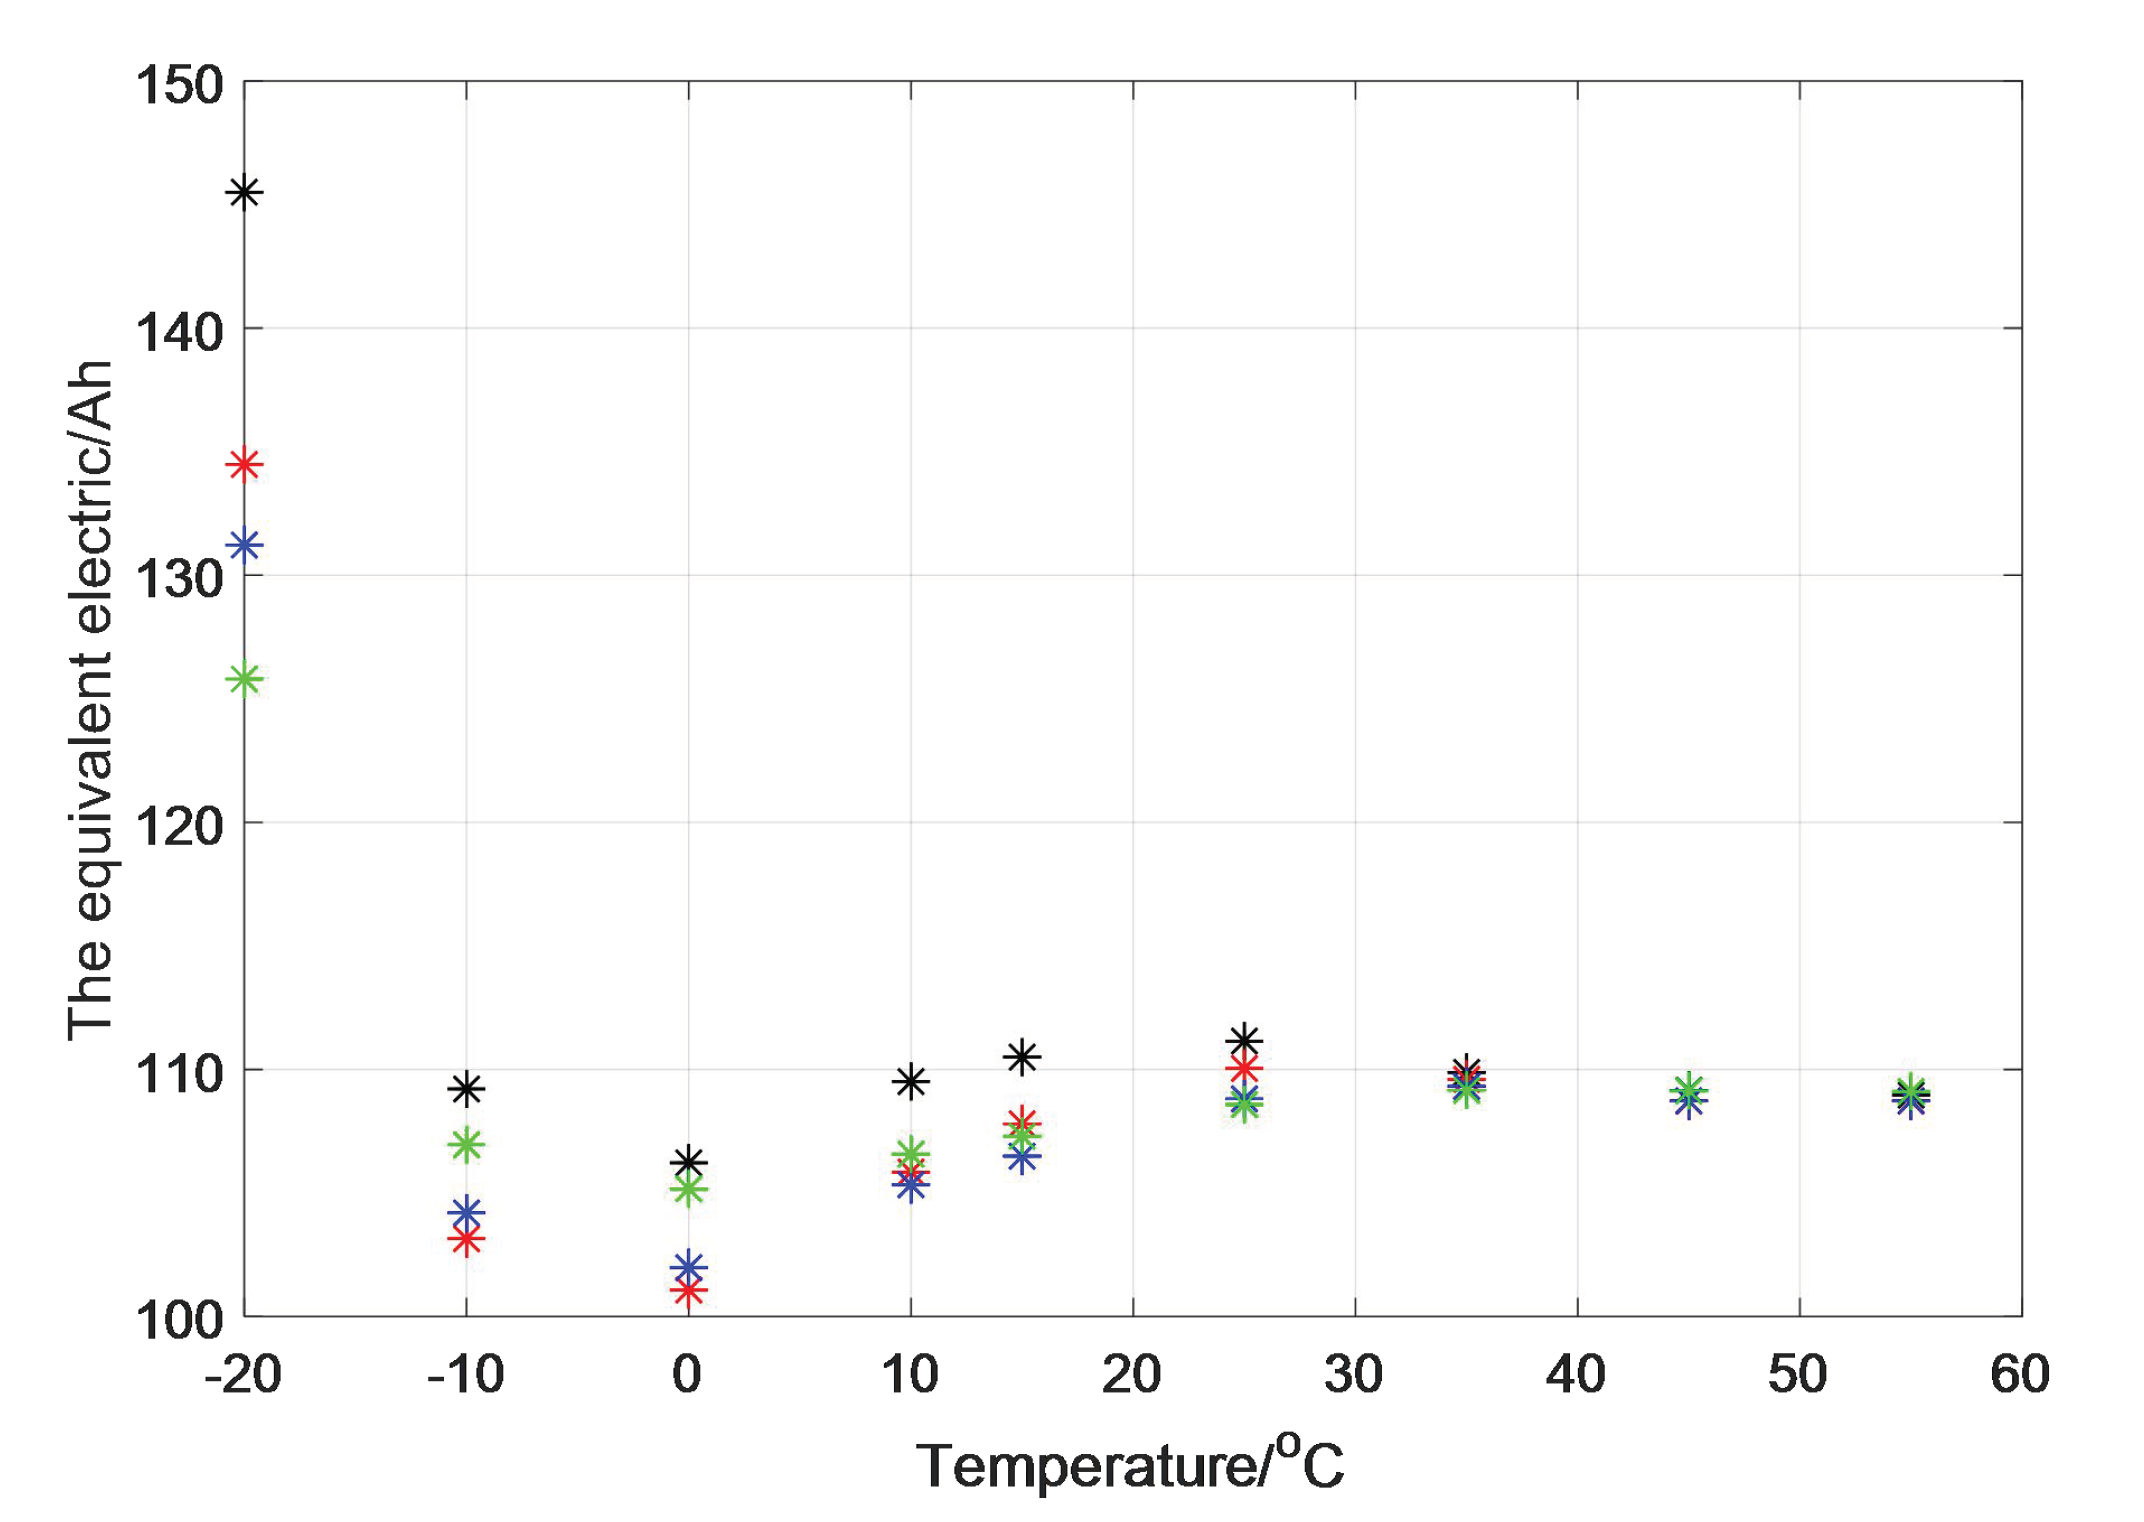
In order to verify the accuracy of the model, the equivalent electric quantity of the discharge process in various cases can be obtained (
Figure 7).
It can be seen from the table that if the quantity of electricity during discharging at different temperatures is calculated according to the equivalent algorithm, we can find that the equivalent capacity of the battery under every working condition almost maintains a constant value, except in the case at −20 °C. This shows that our equivalent capacity method is feasible in predicting the actual discharge capacity of the battery.
The comparison diagrams of the temperature trend of batteries at eight different ambient temperatures under the rates of 1/3C, 1/2C, 1C, and 2C, are also obtained, as shown in
Figure 8. The capacity of the lithium-ion battery mainly depends on the temperature, and the temperature is affected by the discharge rate. The temperature of the battery may increase significantly, thereby increasing the available capacity under high current discharging rates. For the tests at high temperatures, the capacity of all tests remains almost unchanged regardless of the discharging rate. This can be explained that during continuous high-speed discharging, the battery temperature exceeds 30 °C, which can enhance the performance of the lithium-ion battery. However, according to Arrhenius Equation (4), in the high temperature stage, the capacity of the battery is less affected by the temperature difference. In contrast, the battery temperature will not rise significantly under low-speed discharge, so the battery capacity will be greatly affected by the ambient temperature. Obviously, the rise of battery temperature is a function of environmental conditions, discharging rate, and battery design. Temperature is an important factor and should be considered when estimating the residual capacity of large-scale high-energy lithium-ion batteries.
As for the study of energy, the reduction of available energy caused by the increase of discharge current can be divided into two parts. The first part of energy reduction is caused by reaching the cut-off voltage in advance due to the increase of current, and the second part is caused by the rise of heat loss on the internal resistance of the battery due to the increase of current.
Therefore, when the open circuit voltage curve and internal resistance of the battery are determined, the available output energy of the battery can be calculated quantitatively.
It can be seen from the formula that at the same temperature, if the discharge ratio of the battery is high, the available energy will be reduced. The higher the discharging rate is, the lower of available energy is. Combined with the experimental data, it can be seen that the output energy efficiency of the battery changes with the average temperature, as shown in
Figure 9.
The reaction activity of chemical substances inside the lithium-ion battery decreases at low temperature. The lower the temperature, the slower the chemical reaction, which is shown by the lower the battery voltage, The working voltage platform of the whole battery discharge will be reduced as a whole. In order to determine the
Uocv of the battery at other temperatures, the
Uocv of the battery at 55 °C is used as the reference voltage. It is known that the output voltages of the battery
U1, the open circuit voltage
Uocv and the discharge current
I0 conform to the following relationship:
where
I0 is equal to the discharge current corresponding to the battery discharging at 1C rate. Accordingly, when the current is 2C:
The open circuit voltage curve
Uocv (SOC) of the battery at a specific ambient temperature can be solved by combining the above two formulas. It can be seen that when the ambient temperature is 55 °C, the
OCV-SOC curve of the battery increases by 0.027 V compared with that when the ambient temperature is 25 °C, and the curve is similar to upward translation. The reason for this phenomenon may be that when the temperature is high, the chemical reaction inside the battery is more intense, resulting in higher open circuit voltage. In this paper, an approximate method is used to characterize the open circuit voltage of the battery at different temperatures. Firstly, the average operating voltage of the battery under 36 discharging conditions is obtained as listed in the
Table 2 and
Figure 10.
Then, the average open circuit voltage of the battery under various conditions is solved by fitting equations. Through MATLAB fitting, the expression of the average voltage of the battery with the ambient temperature can be given:
In order to characterize the
OCV-SOC curve of the battery under different SOC and different ambient temperatures, the
OCV-SOC curve consist of the
OCV at 55 °C and a compensation difference are used. Based on the theoretical curve of the
OCV-SOC curve under other operating conditions to estimate the output energy of the battery, which is shown in
Figure 11.
We used the temperature data and current obtained during the discharge of the battery at different temperatures and rates. This can be used to calculate the output energy of the battery under specific conditions, in combination with the battery effective capacity estimation method, the OCV estimation method, and the output energy estimation method, mentioned in this paper. The comparison between the predicted value and the actual value of the battery output energy is as
Figure 12. We can see that the predicted value of available energy is close to the real value.


