Abstract
Climate change has increased the frequency of extreme climate events, with different regions showing different sensitivities to these events. In this study, the full subset regression analysis, correlation analysis, and multiple linear regression analysis were used to analyze trends of extreme climate changes and their effects on vegetation on the Mongolian Plateau from both historical and future perspectives. The results showed significant increasing and decreasing trends in extreme warming and extreme cooling indices, respectively, over the past three decades. The extreme temperature indices and precipitation trends under three scenarios (SSP1-2.6, SSP2-4.5, and SSP5-8.5 scenarios) were consistent with historical trends, and the rates at which temperature and precipitation increased were positively correlated with increasing radiation intensity. In comparison with historical changes, there were gradual increases in areas of regions with increasing temperature and precipitation and decreases in areas with decreasing precipitation. There was an overall increasing trend in the normalized difference vegetation index (NDVI) of the Mongolian Plateau, and the indices that had the greatest influence on the NDVI during the analysis of climate extremes were: (1) the number of days of heavy rainfall (R20); (2) the number of summer days (SU25) and; (3) high extreme daily minimum temperature (TNx). There was an increasing trend in the NDVI from 2021 to 2080, and the rate of the NDVI increase decreased with increasing radiation intensity. The rates of change in the NDVI under all three scenarios were lower than that of the historical period.
1. Introduction
Changes to the climate have become more pronounced since the Industrial Revolution, posing challenges to both the ecosystem and human development []. The global average temperature between 2011 and 2020 was 0.76 (±0.05) °C warmer than that in 1961–1990 and 1.12 (±0.11) °C warmer than that in the late 19th century []. The effects of climate change include accelerated ice melt, sea level rise, and desertification [,]. Climate change will also lead to an increased frequency and intensity of extreme climate events, which, in turn, will harm the biosphere [,,]. According to the 2020 Global Climate Risk Index (https://germanwatch.org/en/cri, 7 August 2022) report, approximately 12,000 extreme weather events occurred at a global level between 1999–2018, causing ~3.54$ trillion in economic losses and ~495,000 human deaths. For example, daily maximum temperatures in Scandinavia, the Netherlands, and Belgium exceeded those in the historical record in the summer of 2018, triggering unprecedented forest fires [,]. Meteorological disasters in China have been responsible for 70% of total economic losses due to natural disasters, with extreme weather events accounting for 80% of the total []. The extreme drought in the upper Yellow River Basin in 2018 had direct detrimental effects on 1.4 million people []; in July–August 2018, the China Meteorological Administration issued a “high-temperature warning” for 33 consecutive days, with this extreme heat event leading to economic losses of RMB 6.87 billion in the aquaculture industry in Liaoning []. Disasters caused by extreme weather pose a considerable challenge to human society and ecosystems.
Vegetation acts as a bridge between natural environmental factors and ecosystems [,], and the study of vegetation growth using the normalized difference vegetation index (NDVI) allows for the identification of aspects of vegetation, such as vegetation cover and growth status [,]. Climate change directly affects the growth of terrestrial vegetation by influencing ecosystem cycles [,]. The results of studies on changes in vegetation under the influence of climate change at the global scale [], the national scale [], and the regional scale [] have all indicated that the effects of climate change on vegetation are significant. Past studies have confirmed that climate change will further trigger the occurrence of climate extremes [,], which, in turn, will result in further harm to ecosystems and human society [,,]. Studies of the effects of global climate extremes on ecosystems [], the correlation between the days of plant leaf initiation and climate extremes in some regions of the United States and Europe [], and the effects of climate extremes on wheat yields during different growing periods have all come to a similar conclusion: an increase in extreme climate events due to climate change will result in increased pressure on global terrestrial ecosystems []. A regional-scale study on the correlation between climate extremes and vegetation in the Xinjiang region identified a shift from a warm-dry to warm-wet climate in Xinjiang over the last 30 years, with implications for vegetation dynamics []. A study of the effect of climate extremes on vegetation on the Mongolian Plateau showed that extreme precipitation has contributed to the growth of vegetation [], indicating the significant impact of climate extremes on vegetation ecosystems on a regional scale. The Mongolian Plateau falls in the mid-latitude arid/semi-arid climate zone, which is the most responsive region to climate change globally. The effects of climate change have led to climate anomalies, which, in turn, have resulted in a series of extreme climate events [,]. The fragile ecological environments of arid/semi-arid regions are particularly sensitive to anthropogenic activities and climate change [,]. Therefore, there is a need to study the impacts of extreme climate events on vegetation on the Mongolian Plateau, within which the use of structured models for extreme climate prediction can play an important role.
Most previous, related studies focused on the impact of the current climate on vegetation, and there has been less focus on future climate change and its impact. The initiation of the CMIP program can help to fill this knowledge gap. The CMIP program has created a good basis for the preparation of IPCC reports [], and the latest CMIP6 dataset is backed up by sound scientific experiments, rich data content, and the use of many models []. However, different CMIP6 models differ in their ability to simulate temperature and precipitation and show regional applicability []. Therefore, there is a need to adopt a scientifically valid method to evaluate the temperature and precipitation simulations of models driven by CMIP data []. Lin et al. explored the ability of models driven by CMIP6 and CMIP5 data to simulate extreme precipitation in middle- and high-latitude Asia, and their results showed a higher performance of the average simulation of the multi-model ensemble compared to the individual model simulations [].
Therefore, the objectives of the present study were to: (1) analyze the historical spatiotemporal changes in extreme climates and their impact on vegetation on the Mongolian Plateau; (2) use the full subset regression and multiple linear regression analysis methods to choose and rank the importance of multiple extreme climate indices; (3) evaluate the ability of models driven by the CMIP6 dataset to produce extreme climate indices during the historical period; and (4) analyze the spatiotemporal variability in extreme climate events and the impact on vegetation across the Mongolian Plateau during the 21st century under different scenarios based on 13 CMIP6 model projections.
2. Materials and Methods
2.1. Study Area
The Mongolian Plateau is in east Asia and falls in an arid and semi-arid climate zone with an average and maximum elevation of 1580 m and ~3789 m, respectively (Figure 1a–c). Plateaus and mountains constitute the dominant geomorphological features of the Mongolian Plateau. The Mongolian Plateau is in Chinese Inner Mongolia and Mongolia, and falls within a temperate, continental monsoon climate zone. Inner Mongolia has an average annual temperature of 6.2 °C and average annual precipitation of 300–400 mm, whereas Mongolia has short summers and long winters with an average annual temperature of 3.8 °C and average annual precipitation of 120–250 mm. The Mongolian Plateau is rich in vegetation types and ecologically fragile. The main vegetation types include typical steppe and desert steppe vegetation and relatively small areas of coniferous forest, broadleaf forest, and scrub in the northern and northeastern parts. Crops and sandy land vegetation are distributed in the northeastern part of the Mongolian Plateau, with desert steppe mainly distributed in the west (Figure 1d).
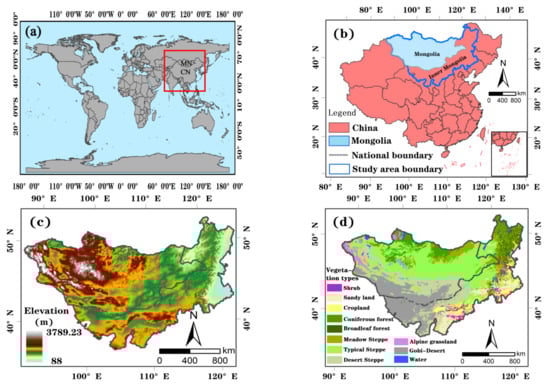
Figure 1.
Geographic characteristics of the Mongolian Plateau: (a,b) geographical location of study area, (c) elevation, (d) vegetation types.
2.2. Data Sources
The present study used meteorological data obtained from the Princeton University Global Daily Temperature and Precipitation Dataset (http://hydrology.princeton.edu/data/, 7 August 2022). R software was used to calculate the annual-scale extreme climate index (ECI) based on the daily maximum temperature, daily minimum temperature, and daily cumulative precipitation from 1982 to 2012. The ECI has a spatial resolution of 0.5° × 0.5°, with Table 1 defining the specific indices.

Table 1.
Definition of the extreme climate index.
NDVI is generated by several NOAA AVHRR sensors for a global 1/12th degree latitude/grid with temporal resolution of 15 days. The latest version GIMMS NDVI3g was used in this paper, which obtained from: https://ecocast.arc.nasa.gov/data/pub/gimms/3g.v1/, 7 August 2022. The annual data were cropped using ArcGIS, following which they were synthesized using Python for subsequent analysis.
Table 2 shows the CMIP6 simulation data (simulated climate data from thirteen models in the Phase VI International Coupled Model Intercomparison Program: http://esgf-node.llnl.gov/search/cmip6/, 7 August 2022), generated using historical data and three scenario models (SSP1-2.6, SSP2-4.5, and SSP5-8.5). The daily maximum temperature, daily minimum temperature, and accumulated precipitation data under the three future scenario models were used to calculate the future extreme climate indices.
Table 2.
CMIP6 model details.
2.3. Methodology
2.3.1. Sen’s Slope + Mann–Kendall
The present study performed an image-by-image analysis of spatial and temporal trends in climate extremes and the NDVI using Sen’s trend analysis:
where Slope is the trend of the variable to be sought, n is the number of years of cumulative monitoring, i is the year number (1 ≤ i ≤ n), and Ti is the extreme climate index or NDVI value in year i.
The Mann–Kendall mutation test was first proposed by Mann and Kendall [], following which the method was improved and refined to form the MK mutation test []. The test is characterized by an easy calculation and insensitivity to outliers, and can clearly illustrate the point in time of a mutation, that is, an abrupt change in a climatic factor. The steps for calculating the Mann–Kendall mutation test are shown below.
- (1)
- Construct the time series X1, X2, …, Xn, defining Sk.
- (2)
- Calculate the variance and mean of Sk:
- (3)
- Standardize Sk:
In Equation (6), UF obeys a standard normal distribution. Given a significance level α, the presence of a significant trend in this series will result in UFk > Uα. Therefore, UBk = −UFk, and the UF and UB curves can be plotted. The assessment of the mutation point is mainly based on the position of the intersection point. For an intersection point between UF and UB, its position will be between the two critical value lines, and the moment of the sub-intersection point represents the mutation moment.
2.3.2. Full Subset Regression Analysis
The full subset regression method was used to fit all possible combinations of predictor variables in this model in order, following which the optimal model under the existing variables was screened according to some goodness-of-fit criteria, also called the best subset selection. It should be noted that when there are more than two variables, the R2 criterion will increase with an increasing number of variables added, leading to possible overfitting. (The value range of R2 is [0, 1]: If the value is 0, the model fitting effect is poor. If the result is 1, the model is error-free. Generally speaking, the larger R2 is, the better the model fitting effect is.) Adjusting R2 can provide more realistic fitting results.
2.3.3. Correlation Analysis
Correlation analysis uses appropriate quantitative indicators to describe relationships between entities. The present study measured the correlation between climate extremes and the NDVI using correlation analysis [,]:
where R represents the correlation coefficient and M represents the extreme climate index (NDVI).
2.3.4. Multiple Linear Regression Analysis
Multiple linear regression analysis, also known as complex linear regression analysis, involves determining the statistical relationship between a single dependent variable and multiple independent variables. The present study established a linear regression equation between multiple extreme climate indices (independent variables) and the NDVI (dependent variable):
where b0 denotes the constant term, bj (j = 1, 2, …, n) is the regression coefficient for establishing the equation, and n denotes the number of variables in the equation. Because the units of extreme climate indices were different, the size of the regression coefficients could not be used in the assessment of the importance of each independent variable to the NDVI. Therefore, the standardized multiple linear regression equation was applied:
The standardized regression equation lacks a constant term, and the magnitude of the absolute value of the regression coefficient indicates the importance of each independent variable to the dependent variable. The standardized regression coefficients only indicate the ranking of the importance of the variables and cannot be used to construct a model.
3. Results
3.1. Spatiotemporal Variations in Extreme Climate Indices
3.1.1. Temporal Variations in Extreme Climate Indices
Figure 2 shows the results of an analysis of the temporal trends in extreme temperature indices from 1982 to 2012. UF represents the time series trend of extreme temperature indices and UB is the time inverse series of extreme temperature indices. The frequency indices TN10P (Figure 2a) and TX10P (Figure 2c) indicate decreases in extreme cold temperature at rates of 4 days/decade and 4.3 days/decade, respectively, with the daytime trend exceeding the nighttime trend. TN10P and TX10P underwent mutations in 1987 and 1986, respectively, where the mutation reinforced the decrease trend. The warming trends of temperature indices TN90P (Figure 2b), TX90P (Figure 2d), SU25 (Figure 2e), and TR20 (Figure 2f) increased at rates of 5.9 days/decade, 3.6 days/decade, 4 days/decade, and 2.5 days/decade, respectively, and the rate of increase at night exceeded that during the day. The rate of increase of the highest temperature exceeded that of the lowest temperature. The trends in TN90P and TX90P reinforced the increase trend after the mutation in 2000 and 2004, respectively. SU25 and TR20 showed an intersection point in 1997 and 1994, respectively, and were located within the two critical lines, representing mutation points. The extreme temperature intensity indices TNn (Figure 2g) and TNx (Figure 2h) both increased at rates of 0.2 °C/decade. There was an intersection point between TNn and TNx within two critical lines in 1986 and 1996, respectively, and the mutation reinforced its increase trend.
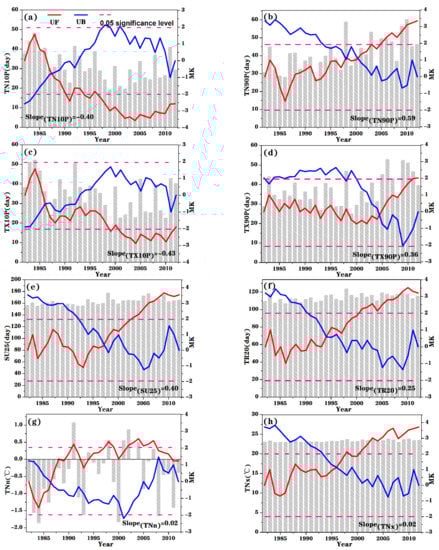
Figure 2.
Interannual trends in extreme temperature indices on the Mongolian Plateau over the last three decades.(Temporal trends of each extreme temperature index, (a) TN10P: Cold nights, (b) TN90P: Warm nights, (c) TX10P: Cold days, (d) TX90P: Warm days, (e) SU25: Hot summer days, (f) TR20: Nights stay hot, (g) TNn: An extremely low daily minimum temperature, (h) TNx: An extremely high daily minimum temperature.)
The trend in the extreme precipitation index indicated an increasing trend in the extreme precipitation frequency index R20 of 0.05 days/decade (Figure 3a). Several intersection points occurred from 1982 to 2012, among which two prominent intersection points occurred in 1983 and 1992. There were increasing trends in the extreme precipitation intensity indices R95P and SDII (Figure 3b,c) at rates of 90.7 mm/decade and 1.1 mm/day/decade, respectively, with R95P mutating in 2006 and SDII mutating in 2005 (Figure 3).
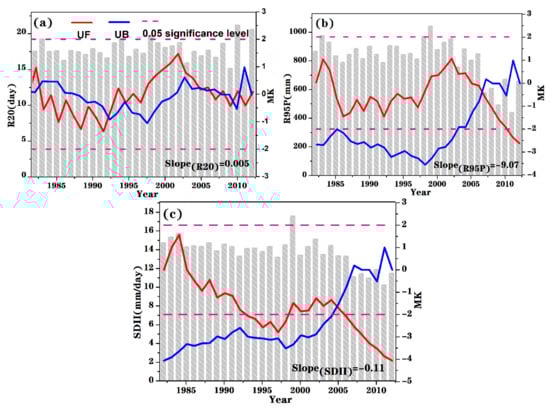
Figure 3.
Interannual trends in the extreme precipitation index on the Mongolian Plateau over the last three decades.(Temporal trends of each extreme precipitation index, (a) R20: Number of moderate precipitation days, (b) R95P: Very wet days, (c) SDII: Annual mean rainy day precipitation intensity.)
3.1.2. Spatial Variations in Extreme Climate Indices
There were decreasing trends in the spatial variations of TN10P (Figure 4a) and TX10P (Figure 4c) in most parts of the Mongolian Plateau, among which areas showing a significant decreasing trend were mainly located in the northeast, northwest, and southwest regions. In contrast, TN10P and TX10P showed increasing trends in the central region, although these trends were significant in few areas. TN90P (Figure 4b) and TX90P (Figure 4d) showed increasing trends in most areas of the Mongolian Plateau, with a decreasing trend only in the lower elevation central area. Areas showing significant increasing trends were mainly in the western and northwestern regions, with few areas in the northeastern part of the Mongolian Plateau. Areas showing a decreasing trend were mainly in the central and northwestern parts, and areas showing a significant decreasing trend were in the central part. There were increasing trends in SU25 (Figure 4e) and TR20 (Figure 4f) over most of the Mongolian Plateau, with decreasing trends only evident in the central part. Areas showing significant increasing trends were mainly in the northeastern, northwestern, and southeastern regions of the Mongolian Plateau. Areas showing decreasing trends were mainly in the central and southwest regions, with significant decreasing trends mainly in the central region. TNn (Figure 4g) showed an increasing trend in most areas of the Mongolian Plateau, although there was a decreasing trend in the southeast. Areas showing significant increasing trends were mainly in northeast China. Areas showing significant decreasing trends were in the southeast and southwest. TNx (Figure 4h) showed an increasing trend over most of the Mongolian Plateau and a decreasing trend in the central region. Areas showing significant increasing trends were distributed in the northwestern and southeastern regions of the Mongolian Plateau, whereas regions showing significant decreasing trends were distributed in the central region.
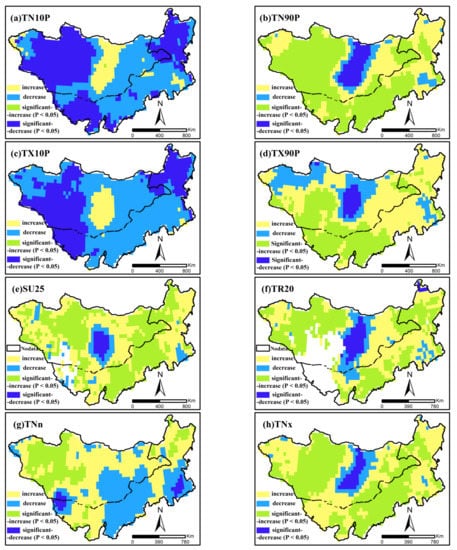
Figure 4.
Spatial variation in the extreme temperature index on the Mongolian Plateau over the last three decades.(Spatial trends of each extreme temperature index, (a) TN10P: Cold nights, (b) TN90P: Warm nights, (c) TX10P: Cold days, (d) TX90P: Warm days, (e) SU25: Hot summer days, (f) TR20: Nights stay hot, (g) TNn: An extremely low daily minimum temperature, (h) TNx: An extremely high daily minimum temperature).
The present study analyzed the spatial variation in the extreme precipitation index on the Mongolian Plateau (Figure 5). R20 (Figure 5a) showed an increasing trend in the northeastern and northwestern regions of the Mongolian Plateau, whereas most of the regions showing significant decreasing trends were in the southwestern and central regions. The R95P (Figure 5b) and SDII (Figure 5c) indices showed decreasing trends over most of the Mongolian Plateau, with areas showing an increasing trend mainly in the northeastern region. R95P and SDII showed significant increasing trends in the northeastern Mongolian Plateau, whereas areas showing significant decreasing trends were mostly in the northwestern, southwestern, and central parts.
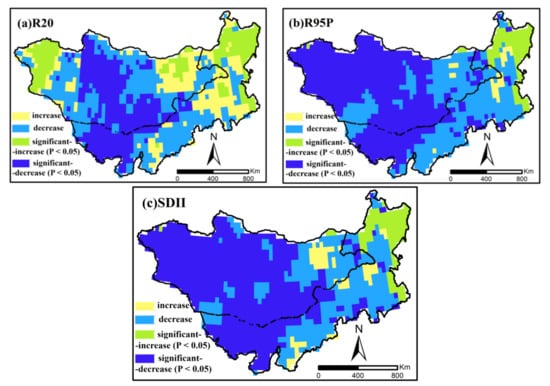
Figure 5.
Spatial variation in the extreme precipitation index on the Mongolian Plateau over the last three decades.(Spatial trends of each extreme precipitation index, (a) R20: Number of moderate precipitation days, (b) R95P: Very wet days, (c) SDII: Annual mean rainy day precipitation intensity.)
3.2. Spatiotemporal Variations in NDVI
There was an overall increasing trend in the annual mean vegetation NDVI of the Mongolian Plateau at a rate of 0.0009/decade (Figure 6a). There were increasing NDVI trends in Inner Mongolia and Mongolia at rates of 0.0004/decade and 0.001/decade, respectively. The multi-year mean NDVI of the Mongolian Plateau, Inner Mongolia, and Mongolia were 0.21, 0.24, and 0.19, respectively. The NDVI of the Mongolian Plateau gradually decreased from east to west and from north to south (Figure 6b).
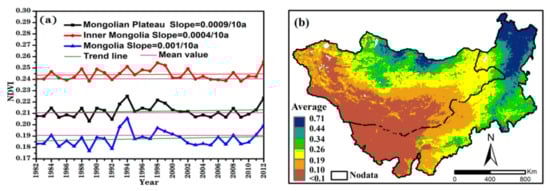
Figure 6.
Variation in vegetation on the Mongolian Plateau from 1982 to 2012; (a) the temporal change in the normalized difference vegetation index (NDVI) and (b) spatial distribution of multi-year mean variation in NDVI.
There was an increasing trend in the NDVI in 57.4% of the Mongolian Plateau (Figure 7a), among which most of the southern and northern areas showed significant increasing trends, accounting for 26.1% of the total study area. There was a decreasing trend in the NDVI in 42.6% of the Mongolian Plateau, amongst which 14.0% of the regions in the northwest and southeast showed significant decreasing trends (Figure 7b). There were no obvious changes in the NDVI in Mongolia at different spatial scales, whereas there were clear trends in Inner Mongolia (Figure 7b). There were increasing and decreasing trends in the NDVI in ~55.1% and 44.9% of the areas in Mongolia, respectively. Areas showing significant decreasing trends in the NDVI were distributed in the northern and southeastern regions, accounting for 20.5% of the total study area. Areas with significant decreasing trends were in the central and southwestern regions, accounting for 13.5% of the study area (Figure 7a). There were increasing and decreasing trends in the NDVI in 60.5% and 39.5% of Inner Mongolia, respectively. Areas showing significant increasing trends in the NDVI were distributed in the western region, accounting for 20.5% of the total study area. Areas with significant decreasing trends in the NDVI were in the northeastern part of the study area, accounting for 14.5% of the study area (Figure 7a).
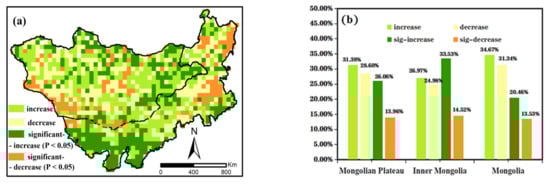
Figure 7.
Spatial trends in the normalized difference vegetation index (NDVI) on the Mongolian Plateau: (a) Spatial distribution of NDVI, (b) NDVI among the different regions expressed as a percentage of total change.
3.3. Effects of ECI on NDVI
The present study applied correlation analysis to examine the influence of climate extremes on the NDVI (Figure 8). The number of moderate precipitation days (R20) showed the strongest positive correlation with the NDVI, with a correlation coefficient of 0.52, followed by very wet days (R95P) with a correlation coefficient (CC) of 0.24 and nights that stay hot (TR20) with a CC of 0.23. The extreme precipitation indices generally showed stronger correlations to the NDVI than the extreme temperature indices. The present study avoided autocorrelation between each extreme climate index by using full subset regression.
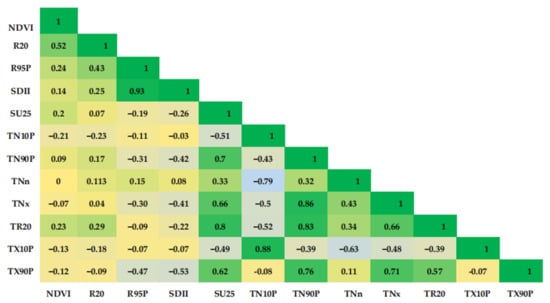
Figure 8.
Correlations between extreme weather events and the normalized difference vegetation index (NDVI) on the Mongolian Plateau. (From green to blue, the correlation goes from positive to negative).
The present study conducted a full subset regression between 11 extreme climate indices and the NDVI for 1982–2012 (Figure 9). Model results were referenced to the adjusted R2. The full subset regression of the extreme climate indices and the NDVI formed models with different subset sizes. The highest adjusted R2 was obtained when using the three extreme climate indices R20, SU25, and TNx as independent variables. This result indicated that model simulations using a linear combination of these three indices would show the optimal performance among all subsets. Decreasing or increasing any of the other extreme climate indices decreased the performance of the model simulation.
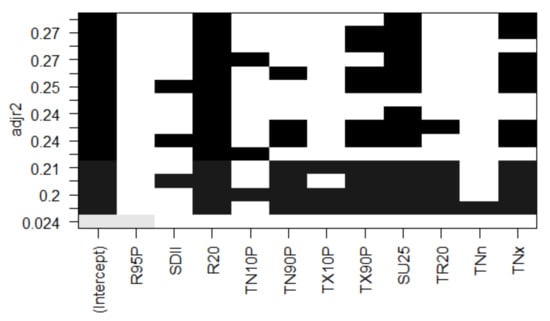
Figure 9.
Full subset regression diagram.
The optimal regression model was obtained by regressing the selected extreme climate indices with the NDVI using the full subset regression (Table 3). The rank of the standardized coefficients for the NDVI according to their influence was: R20 > SU25 > TNx. The absolute values of the most important and least important standardized coefficients for predicting the NDVI, namely, R20 and TNx, were 0.504 and 0.333, respectively. The optimal regression model included one extreme precipitation index and two extreme temperature indices, with the former more important for determining the NDVI. This result indicated that extreme precipitation had a greater influence on the NDVI of the Mongolian Plateau than extreme temperature.
Table 3.
Results of multiple linear regression between the extreme climate index and the normalized difference vegetation index (NDVI) for the Mongolian Plateau.
3.4. Projected Changes to and Impact of ECI on the Mongolian Plateau Based on CMIP6
3.4.1. Evaluation of the CMIP6 Models
The present study evaluated the regional performances of the 13 CMIP6 global circulation models (GCMs) using Taylor diagrams. The model evaluations were conducted by comparing model simulations to historical data from 1960 to 2012. The evaluation over a longer period avoided errors associated with short-term evaluations (Figure 10). GCMs driven by CMIP6 data showed poor performance in generating extreme precipitation indices, whereas their performance in generating extreme temperature indices was significantly greater. The simulations of extreme climate indices by the different models showed better performance when averaged. Therefore, the present study applied multi-model ensemble averaging to investigate the spatial and temporal changes in extreme climate from 2021 to 2080.
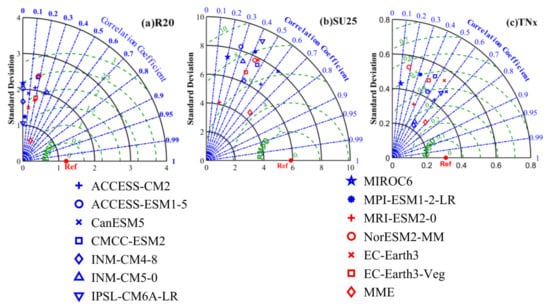
Figure 10.
Taylor diagram of extreme climate index model evaluation based on the optimal model (ref is extreme climate index calculated from historical data, (a). R20: Number of moderate precipitation days, (b). SU25: Hot summer days, (c). TNx: An extremely high daily minimum temperature).
3.4.2. Projected Changes in ECI
The present study conducted a comparison between future and historical extreme climate events by predicting the characteristics of extreme climate events from 2021 to 2080. There were increasing trends in R20 under all three scenarios, SSP1-2.6, SSP2-4.5, and SSP5-8.5 (Figure 11a), at rates of 0.3 days/decade, 0.4 days/decade, and 0.6 days/decade, respectively. There were increasing trends in SU25 under all three scenarios at rates of 2.9 days/decade, 5.0 days/decade, and 8.8 days/decade, respectively (Figure 11b). Under all three scenarios, the mean change in SU25 was smaller during the first 30-year period (161.98, 160.85, and 164.55 under SSP1-2.6, SSP2-4.5, and SSP5-8.5, respectively) than in the latter 30-year period (170.41, 176.37, and 190.87, respectively). There were increasing trends in TNx under all three scenarios (Figure 11c) at rates of 0.2 °C/decade, 0.3 °C/decade, and 0.5 °C/decade, respectively. Under all three scenarios, the mean changes in TNx were smaller in the first 30 years (24.58, 24.60, and 24.79 under SSP1-2.6, SSP2-4.5, and SSP5-8.5, respectively) than during the second 30 years (25.02, 25.48, and 26.39, respectively). A comparison of the results with historical data showed that the simulations of both R20 and SU25 under SSP2-4.5 were closer to historical conditions, whereas the simulated effects of TNx under the SSP1-2.6 scenario were closer to historical conditions.
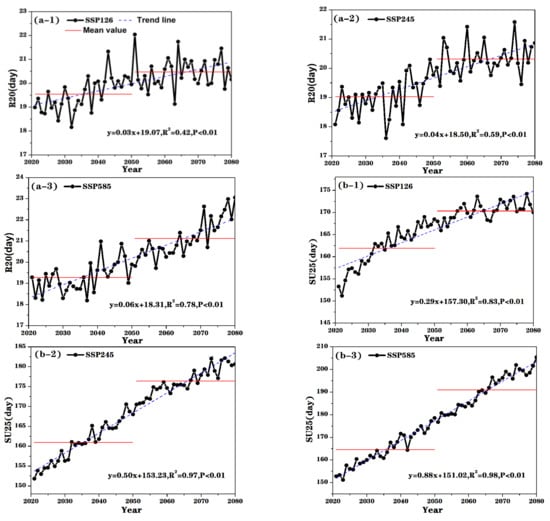
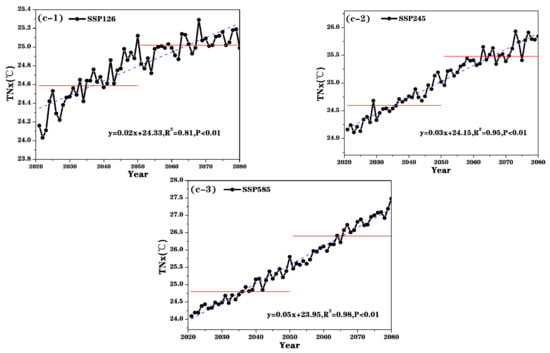
Figure 11.
Temporal trends of extreme climate indices during 2021–2080 on the Mongolian Plateau for different SSP scenarios.((a1–a3): Temporal trends of R20 (Number of moderate precipitation days) in the SSP126/SSP245/SSP585 scenario, (b1–b3): Temporal trends of SU25 (Hot summer days) in the SSP126/SSP245/SSP585 scenario, (c1–c3): Temporal trends of TNx (An extremely high daily minimum temperature) in the SSP126/SSP245/SSP585 scenario).
There was increasing spatial variation in anthropogenic radiative forcing. As shown in Figure 12a, there was an increasing trend in R20 in most regions under the three scenarios at maximum rates of 0.8 days/decade, 1.3 days/decade, and 2.3 days/decade, respectively. However, some areas in northeast China showed decreasing trends at rates of 0.08 days/decade, 0.16 days/decade, and 0.35 days/decade, respectively. As shown in Figure 12b, there were increasing trends in SU25 under all three scenarios at rates of 5.1 days/decade, 9.2 days/decade, and 15.6 days/decade, respectively. There were gradual increasing trends in the southwest at rates of 0.01 days/decade, 0.05 days/decade, and 0.1 days/decade, respectively. As shown in Figure 12c, there were increasing trends in TNx under all three scenarios at rates of 0.27 °C/decade, 0.42 °C/decade, and 0.69 °C/decade, respectively. There were gradual increasing trends in some areas at rates of 0.09 °C/decade, 0.2 °C/decade, and 0.39 °C/decade, respectively. There were significant differences in the spatial trends in R20 on the Mongolian Plateau among the three scenarios, and there were gradual decreases in areas experiencing significantly higher anthropogenic radiative forcing. The spatial trends in SU25 and TNx were consistent among the three scenarios, and the areas of significantly higher SU25 and TNx gradually increased with increasing anthropogenic radiative forcing.
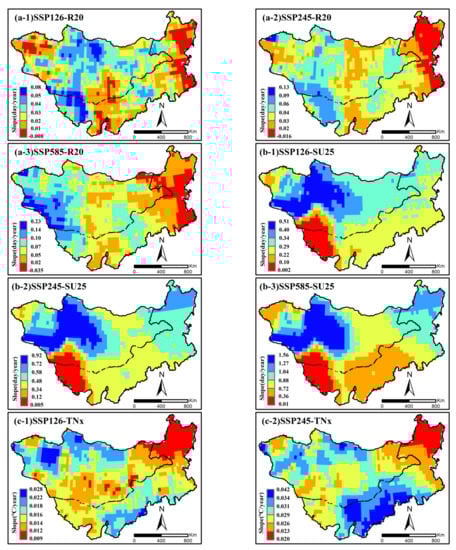
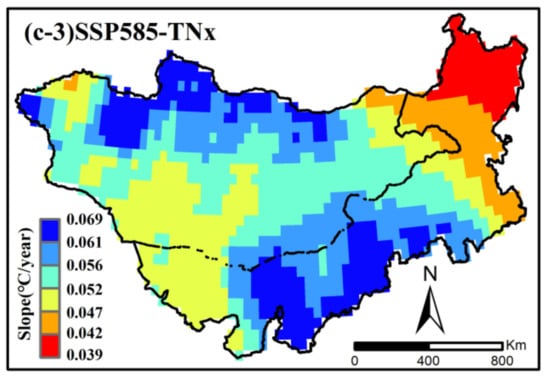
Figure 12.
Spatial trends of extreme climate indices for different SSP scenarios across the Mongolian Plateau during 2021–2080.((a1–a3): Spatial trends of R20 (Number of moderate precipitation days) in the SSP126/SSP245/SSP585 scenario, (b1–b3): Spatial trends of SU25 (Hot summer days) in the SSP126/SSP245/SSP585 scenario, (c1–c3): Spatial trends of TNx (An extremely high daily minimum temperature) in the SSP126/SSP245/SSP585 scenario).
3.4.3. Projection of NDVI under the Influence of Extreme Climate
As outlined in Section 3.3, the present study identified the extreme climate indices with the greatest influences on the NDVI using correlation analysis and full subset regression. This analysis was extended by applying multiple linear regression to explore the relationships between different extreme climate indices and the NDVI, and to extend these regressions to predict future NDVI. There were increasing trends in the NDVI under all three scenarios (Figure 13) at rates of 0.45 × 10⁻³/decade, 0.36 × 10⁻³/decade, and 0.31 × 10⁻³/decade. Under all three scenarios, the average future NDVI during the first 30 years was smaller than that over the last 30 years, and the average gradually decreased with increasing radiation intensity. There was an increasing trend in the NDVI on the Mongolian Plateau from 2021 to 2080, with a decreasing rate of increase compared with the historical rate of change. Although the median NDVI decreased with increasing anthropogenic radiative forcing, the trend was stable. The results showed that the future NDVI will be lower than the historical NDVI under all three scenarios.
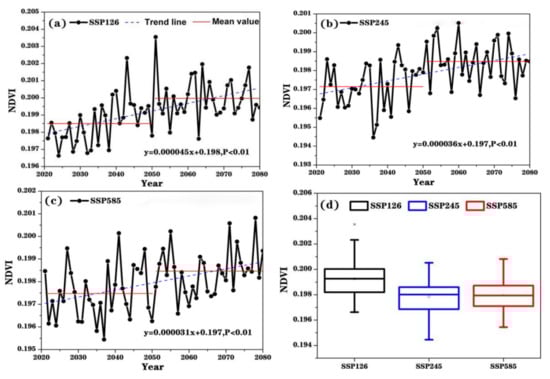
Figure 13.
Temporal trends in the normalized difference vegetation index (NDVI) on the Mongolian Plateau under different SSP scenarios.((a–c): Temporal trends of NDVI in SSP126/SSP248/SSP585 scenarios from 2012 to 2080, (d): Stability of NDVI changes in SSP126/SSP248/SSP585 scenarios).
As shown in Figure 14, there was an increasing spatial variation in the NDVI under the SSP1-2.6 scenario over most of the Mongolian Plateau, with significant increases mainly in the northwestern and southeastern parts. Areas showing significant decreasing trends were mostly in the southwestern and northeastern parts. As shown in Figure 14b, there were increasing trends in the NDVI in most of the Mongolian Plateau under the SSP2-4.5 scenario, with significant increases mainly in the northern and northeastern parts. Areas showing significant decreasing trends were mostly in the central parts. As shown in Figure 14c, there was a decreasing trend in the NDVI in most of the Mongolian Plateau under the SSP5-8.5 scenario. Areas showing significant decreasing trends were mostly found in the northeastern, northwestern, and southwestern regions. There were significant increasing trends in the NDVI in the northwestern and southeastern regions. Future trends in the NDVI in the northeastern and southwestern parts of the Mongolian Plateau were more consistent with historical trends compared to those in the central parts. There was a general decline in areas with an increasing NDVI and radiation intensity on the Mongolian Plateau over the next 60 years, whereas there was an increase in areas showing a decreasing trend.
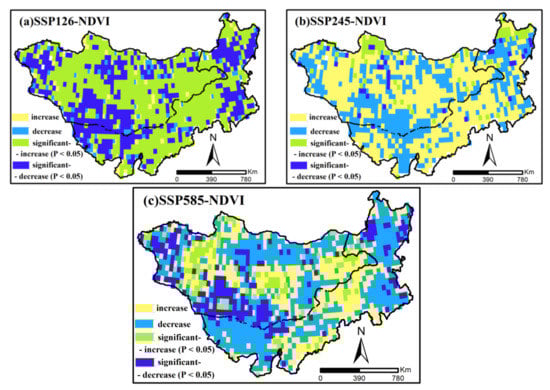
Figure 14.
Spatial variation in NDVI on the Mongolian Plateau from 2021 to 2080.((a–c): Spatial trends of NDVI in SSP126/SSP248/SSP585 scenarios from 2012 to 2080).
4. Discussion
The NDVI is an important indicator of vegetation growth status for studying environmental changes in Mongolian Plateau ecosystems since it responds to climate change and is an essential link in environmental change studies []. The exploration of the relationship between climate extremes and the NDVI showed that the highest correlations were obtained for hot summer days (SU25), extremely high daily minimum temperatures (TNx), and a number of moderate precipitation days (R20). This result indicated that increases in the maximum temperature and frequency of precipitation will have greater impacts on ecosystems. The sensitivity of Mongolian Plateau vegetation to changes in precipitation frequency and maximum temperature can be attributed to: (1) The position of the Mongolian Plateau between China and Mongolia and its geographically diverse vegetation. Climate extremes are also considered to be key drivers of biodiversity patterns that can trigger changes in ecosystems by altering species composition, diversity, and functional attributes [,]. (2) Climate, topography, and vegetation have a mutually regulating relationship, with vegetation dependent on precipitation and topography influencing the distribution of temperature and precipitation [,]. The Mongolian Plateau has large differences in elevation between the east and west. Regions of different altitudes and vegetation types show different sensitivities to the factors examined here, with lower elevations having decreases in the number of very warm nights (TN90P) and warm days (TX90P), whereas the remaining areas had increases in these factors. Meanwhile, since periods of vegetation growth and precipitation occur simultaneously, an increase in the frequency of precipitation directly leads to changes in vegetation biomass, and in turn, acting on the NDVI. (3) Although the NDVI of the Mongolian Plateau is strongly correlated with precipitation, the vegetation biomasses in areas with dense vegetation and high precipitation are a result of accumulation over many years and are less affected by seasonal climate [].
The study of future trends in the extreme climate index from 2021 to 2080 based on CMIP6 data showed general trends of increasing temperature and precipitation on the Mongolian Plateau. There were long-term gradual increases in the extreme climate index and its mean. A comparison of future trends in the extreme climate index with that of the past showed that means of the future periods will be larger. Moreover, there was a gradual increase in the extreme climate index with increasing anthropogenic radiative forcing. This result is consistent with the conclusion of the IPCC, which reports future increases in the global temperature [,]. Increases in the emissions of greenhouse gases, such as CO2 and N2, into the atmosphere, will result in changes to energy and material cycles in the biosphere, which, in turn, will lead to increasing global temperatures and frequent meteorological disasters, such as floods [,]. These assertions explain the observation in the present study of changes in extreme climate with increasing radiative forcing at different emission intensities and their gradual enhancement. In addition, a previous, systematic AR6 assessment of changes in extreme climate events showed that global extreme heat events and precipitation will continue the increases that have been especially evident since the 1950s. This study also concluded that anthropogenic factors were the main drivers of most changes in extreme climate events since the 1950s. The AR5 assessment also analyzed the drivers of extreme climate events at regional scales using multiple attribution methods, obtaining results consistent with the present study. The above results provide an additional explanation for the increase in the extreme climate index and extreme precipitation with an increasing temperature index and increasing radiation intensity [,]. Both the increase in emission intensity and anthropogenic disturbances have resulted in changes in the material and energy cycles of ecosystems, which further interfere with the growth and development of vegetation on the Mongolian Plateau through their effects on the ecosystem, climate, and environment. These assertions are consistent with the findings of the present study on the relationship between climate extremes and the NDVI, in which the increasing trend in the NDVI gradually slowed with increasing radiation intensity. This was spatially expressed as a gradual decrease in areas with increasing NDVI trends and a gradual increase in areas with decreasing NDVI trends.
The study of extreme climate change in different regions using the Extreme Climate Index, defined by the Expert Group on Climate Change Detection and Indicators (ETCCDI) of the World Meteorological Organization (WMO), has shown that different extreme climate indices have different adaptations to regional studies []. Therefore, the limitations of using extreme climate indices for different regions should be noted when using them. First, the selection of climate data and index definitions, different data sources, and definition methods may lead to uncertainties, for example, when using site data to calculate 27 extreme climate indices using RClimDex(1.0) software, it should be noted that the annual extreme climate of some of these indices then uses the annual average value, which is different from the calculation method of the raster data. Second, in the choice of percentile values, it is necessary to compare the effects of different percentile values according to the actual climate conditions of the Mongolian Plateau. Here, only the percentile values included in the extreme climate index calculated using the RClimDex software are compared, and the percentile values of other values are not considered. Third, climate change on the Mongolian Plateau is very complex, the current understanding of its related feedback processes and mechanisms is still greatly lacking, and climate models have difficulty describing its complex physical processes in detail []. Lin et al. [] concluded that for regional features, a higher horizontal resolution may affect the response to the internal variability of the climate system, and the impact varies across regions. A high resolution may perform better in exploring extreme indices at regional scales, and more attention should also be paid to the development of high-resolution regional climate models in the future.
5. Conclusions
The present study investigated the historical and possible future temporal and spatial changes in extreme climate events over the Mongolian Plateau under different climate scenarios (SSP1-2.6, SSP2-4.5, and SSP5-8.5) using the latest CMIP6 simulations. The influence of the ECI on vegetation on the plateau was discussed by adopting full subset regression analysis, correlation analysis, and multiple linear regression analysis. The main conclusions of the present study are listed below:
- (1)
- There were increasing trends in temperature and precipitation on the Mongolian Plateau from 1982 to 2012. There were increases in temperature in the western and northwestern parts and decreases in the central part of the plateau. There were increases in the extreme precipitation frequency index in the northeast and northwest and decreases in the central region, whereas there were increases in the extreme precipitation intensity index in the northeast and southwest, with the opposite in the northwest.
- (2)
- There were increasing trends in the NDVI in most parts of the Mongolian Plateau, although at slow rates of increase. The analysis of the relationship between climate extremes and the NDVI showed that extreme precipitation had a greater effect on the NDVI than extreme temperature. The analysis of the relationship between extreme climate indices and the NDVI by full subset regression showed that R20, SU25, and TNx had the greatest influences on the NDVI.
- (3)
- There were increasing trends in R20, SU25, and TNx from 2021 to 2080 under all three scenarios. There was a gradual increase in the rate of change with increasing radiation intensity. There were decreases in the areas showing decreasing trends with increasing radiation intensity under the three extreme climate indices compared with that under historical change, whereas there were increases in the areas showing increasing trends.
- (4)
- Although there were increasing trends in the NDVI under all three scenarios, the rates of increase of these trends decreased continuously with increasing radiation intensity. The future NDVI was lower than the historical NDVI under all three scenarios. There was a gradual decrease in the areas showing an increasing trend and a gradual increase in areas showing a decreasing trend as radiation intensity increased.
Author Contributions
Conceptualization, J.R.; methodology, J.R.; software, J.R. and H.Y.; validation, J.R. and S.T.; formal analysis, J.R.; investigation, J.R. and L.M.; resources, S.T.; data curation, J.R. and L.M.; writing—original draft preparation, J.R.; writing—review and editing, J.R. and S.T.; visualization, J.R.; supervision, S.T.; project administration, S.T.; funding acquisition, S.T. and Y.B. All authors have read and agreed to the published version of the manuscript.
Funding
This study was supported by the Fundamental Research Funds from Inner Mongolia Normal University (2022JBBJ013), the National Natural Science Foundation of China (No. 42061070 and No.61631011), the Science and Technology Fundamental Resources Survey Special Sub-project (No.2017FY101301-4), the High-level Introduction of Talent Research Start-Up Fund from Inner Mongolia Normal University (2019YJRC002), and the International (Regional) Cooperation and Exchange Programs (41961144019).
Data Availability Statement
Not applicable.
Acknowledgments
The authors would like to thank the Editors and the anonymous reviewers for their crucial comments, which improved the quality of this paper.
Conflicts of Interest
The authors declare no conflict of interest.
References
- Xia, J.; Liu, C.Z.; Ren, G.Y. Opportunity and Challenge of the Climate Change Impact on the Water Resource of China. Adv. Earth Sci. 2011, 26, 12. [Google Scholar]
- Stocker, T.F.; Qin, D.; Plattner, G.K.; Midgleyet, P.M.; IPCC. The physical science basis. Contribution of Working Group I to the Fifth Asseent Report of the Intergovernmental Panel on Climate Change. Comput. Geom. 2013, 10, 916–917. [Google Scholar]
- Walther, G.R.; Post, E.; Convey, P.; Menzel, A.; Parmesan, C.; Beebee, T.J.C.; Fromentin, J.M.; Hoegh-Guldberg, O.; Bairlein, F. Ecological responses to recent climate change. Nature 2002, 416, 389–395. [Google Scholar] [CrossRef] [PubMed]
- Parmesan, C.; Yohe, G. A globally coherent fingerprint of climate change impacts across natural systems. Nature 2003, 421, 37–42. [Google Scholar] [CrossRef] [PubMed]
- Li, C.L. Research on the Characteristics and Effects of Climate Extremes on Multi-Spatial-Temporal Scales in the Mongolian Plateau. Ph.D. Thesis, East China Normal University, Changchun, China, 2019. [Google Scholar]
- Cohen, J.M.; Fink, D.; Zuckerberg, B. Avian responses to extreme weather across functional traits and temporal scales. Glob. Chang. Biol. 2020, 26, 4240–4250. [Google Scholar] [CrossRef]
- Pamela, S.R.; Juan, C.A.; Wolfgang, J.H.M. Impact of extreme weather wvents on aboveground net primary prodvity and sheep production in the magellan region, Southernmost Chilean Patagonia. Geosciences 2020, 10, 318. [Google Scholar]
- Kornhuber, K.; Osprey, S.; Coumou, D.; Petri, S.; Petoukhov, V. Extreme weather events in early summer 2018 connected by a recurrent hemieric wave-7 pattern. Environ. Res. Lett. 2019, 14, 54002. [Google Scholar] [CrossRef]
- Toreti, A.; Belward, A.; Perez-Dominguez, I.; Naumann, G.; Luterbacher, J.; Cronie, O.; Seguini, L.; Manfron, G.; Lopez-Lozano, R.; Baruth, B.; et al. The exceptional 2018 European water seesaw calls for action on adaptation. Earth’s Future 2019, 7, 652–663. [Google Scholar] [CrossRef]
- Zhang, Y.W.; Shi, B.L.; Zhu, K.L. Trends of extreme climate events in Henan Province from 1960 to 2010. Yellow River 2016, 38, 5. [Google Scholar]
- Ji, P.; Yuan, X.; Jiao, Y.; Wang, C.; Han, S.; Shi, C. Anthropogenic Contributions to the 2018 Extreme Flooding over the Upper Yellow River Basin in China. Bull. Am. Meteorol. Soc. 2020, 101, S89–S94. [Google Scholar] [CrossRef]
- Ren, L.; Wang, D.; An, N.; Ding, S.; Yang, K.; Freychet, N.; Tett, S.F.B.; Dong, B.; Lott, F.C. Anthropogenic Influences on the Persistent Night-Time Heat Wave in Summer 2018 over Northeast China. Bull. Am. Meteorol. Soc. 2020, 101, S83–S88. [Google Scholar] [CrossRef]
- IPCC. The physical science basis. In Contribution of Working Group I to the Fourth Assessment Report of the Intergovernmental Panel on Climate Change; Cambridge University Press: Cambridge, UK; New York, NY, USA, 2007; Volume 996, pp. 113–119. [Google Scholar]
- Fang, J.Y.; Piao, S.L.; He, J.S.; Ma, W.H. Vegetation activity in China has increased in recent years. Sci. China Ser. C 2003, 33, 12. [Google Scholar]
- Wang, S.; Zhang, L.L.; Lin, W.B.; Huang, Q.S.; Song, Y.X.; Ye, M. Study on vegetation coverage and land-use change of Guangdong Province based on MODIS-NDVI. Acta Ecol. Sin. 2022, 42, 2149–2163. [Google Scholar]
- Yuan, Z.H.; Sa, C.L.; Yin, S. Research on vegetation phenological changes in the Otindag sandy land Based on MODIS NDVI and EVI. China Environ. Sci. 2021, 41, 5254–5263. [Google Scholar]
- Cornelissen, J.C.H.; Bodegom, P.M.V.; Aerts, R.; Callaghan, T.V.; Logtestijn, R.S.P.V.; Alatalo, J.; Chapin, F.S.; Gerdol, R.; Gudmundsson, J.; Gwynn-Jones, D. Global negative vegetation feedback to climate warming resps of leaf litter decomposition rates in cold biomes. Ecol. Lett. 2010, 10, 619–627. [Google Scholar] [CrossRef]
- Zeng, N.; Neelin, J.D.; Lau, K.M.; Tucker, C.J. Enhancement of interdecadal climate variability in the Sahel by vegetation interaction. Science 1999, 286, 1537–1540. [Google Scholar] [CrossRef]
- Craine, J.M.; Ocheltree, T.W.; Nippert, J.B.; Towne, E.G.; Skibbe, A.M.; Kembel, S.W.; Fargione, G.E. Global diversity of drought tolerance and grassland climahange resilience. Nat. Clim. Chang. 2013, 3, 63–67. [Google Scholar] [CrossRef]
- Ndayisaba, F.; Guo, H.; Isabwe, A.; Bao, A.; Nahayo, L.; Khan, G.; Kayiranga, A.; Karamage, F.; Muhire, E.N. Inter-Annual Vegetation Changes in Response to Climate Variability in Rwanda. J. Environ. Prot. 2017, 8, 464. [Google Scholar] [CrossRef]
- Steven, J.; Phillips, S.J.; Goetz, S.J.; Knight, P. Shifts in Arctic vegetation and associated feedbacks under climahange. Nat. Clim. Chang. 2013, 3, 673–677. [Google Scholar]
- Zhu, D.Y.; Xiong, K.N.; Xiao, H. Temporal and spatial variation characteristics of extreme temperature in Guizhou Province. Resour. Sci. 2018, 40, 1672–1683. [Google Scholar]
- Fernandez-Gimenez, M.E.; Batkhishig, B.; Batbuyan, B. Cross-boundary and cross-level dynamics increase vulnerability to severe winter disasters (dzud) in Mongolia. Glob. Environ. Chang. 2012, 22, 836–851. [Google Scholar] [CrossRef]
- Min, S.K.; Son, S.W.; Seo, K.H.; Kug, J.S.; An, S.I.; Choi, Y.S.; Jeong, J.H.; Kim, B.M.; Kim, J.W.; Kim, Y.H.; et al. Changes in weather and climate extremes over Korea and possible causes: A rev. Asia-Pac. J. Atmos. Sci. 2015, 51, 103–121. [Google Scholar] [CrossRef]
- Bai, H.Z.; Xiao, F.P.; Liu, J.F.; Wang, H.L.; Zhang, H.; Li, Z.Q. Extreme Climatic Events in North China during 1965-2014 Study on temporal and spatial pattern of agrometeorological disasters. Geogr. Geo-Inf. Sci. 2018, 34, 99–105. [Google Scholar]
- Wang, R.; Cherkauer, K.; Bowling, L. Corn response to climate stress detected with satellite-based NDVI time series. Remote Sens. 2016, 8, 269. [Google Scholar] [CrossRef]
- Yuan, M.; Zhu, Q.; Zhang, J.; Liu, J.; Zhao, P. Global response of terrestrial gross primary productivity to climate extre. Sci. Total Environ. 2020, 750, 142337. [Google Scholar] [CrossRef]
- Piao, S.L.; Tan, J.G.; Chen, A.P.; Fu, Y.S.H.; Ciais, P.; Liu, Q.; Janssens, I.A.; Vicca, S.; Zeng, Z.Z.; Jeong, S.J.; et al. Leaf onset in the northern hemisphere triggered by daytime temperature. Natuommunications 2015, 6, 6911. [Google Scholar] [CrossRef]
- Bai, H.Z.; Xiao, D.P.; Wang, B.; Liu, D.L.; Feng, P.Y.; Tang, J.Z. Multi-model ensemble of CMIP6 projections for future extreme climate stres wheat in the North China plain. Int. J. Climatol. 2020, 41, E171–E186. [Google Scholar]
- Yao, J.; Chen, Y.; Zhao, Y.; Mao, W.; Xu, X.; Liu, Y.; Yang, Q. Response of vegetation NDVI to climatic extremes in the arid region of Centsia: A case study in Xinjiang, China. Theor. Appl. Climatol. 2018, 131, 1503–1515. [Google Scholar] [CrossRef]
- Li, C.L.; Filho, W.L.; Wang, J.; Yin, J.; Fedoruk, M.; Bao, G.; Bao, Y.H.; Yin, S.; Yu, S.; Hu, R.C. An assessment of the impacts of climate extremes on the vegetation in Mongolian Plateau: Using a scenarios-based analysis to support regional adaptation and mitigation options. Ecol. Indic. 2018, 95, 805–814. [Google Scholar] [CrossRef]
- Chen, W.; Jiang, D.B.; Wang, X.X. Evaluation and Projection of CMIP6 Models for Climate over the QinghaiXizang (Tibetan) Plateau. Plateau Meteorol. 2021, 40, 1455–1469. [Google Scholar]
- Fan, Z.M. Simulation of land cover change in Beijing-Tianjin-Hebei region based on different scenarios of SSP-RCP. Acta Geogr. Sin. 2022, 77, 228–244. [Google Scholar]
- Cao, G.; Hou, P. Assessment of the ecological security based on the ecological carrying capacity. In Proceedings of the 2016 IEEE International Geoscience and Remote Sensing Symposium (IGARSS), Beijing, China, 10–15 July 2016; pp. 7285–7288. [Google Scholar]
- Wang, R.; Bowling, L.C.; Cherkauer, K.A.; Cibin, R.; Her, Y.; Chaubey, I. Biophysical and hydrological effects of future climate change including trends in CO2, in the St. Joseph River watershed, Eastern Corn Belt. Agric. Water Manag. 2016, 180, 280–296. [Google Scholar] [CrossRef]
- Zhao, Y.Q.; Xiao, D.P.; Bai, H.Z. CMIP5 Climate Model Prediction and Application to Future Climate Change in China. Meteorogical Sci. Technol. 2019, 47, 608–621. [Google Scholar]
- Zhang, L.X.; Chen, X.L.; Xin, X.G. Short commentary on CMIP6 Scenario Model Intercomparison Project (ScenarioMIP). Clim. Change Res. 2019, 15, 519–525. [Google Scholar]
- Hu, Q.; Jiang, D.B.; Fan, G.Z. Evaluation of CMIP5 models over the Qinghai–Tibetan Plateau. Chin. J. Atmos. Sci. 2014, 38, 924–938. (In Chinese) [Google Scholar]
- Hong, Y. Effects of Extreme Climate Changes on Vegetation Phenology of Inner Mongolia. Ph.D. Thesis, Northeast Normal University, Changchun, China, 2020. [Google Scholar]
- Lin, W.; Chen, H. Assessment of model performance of precipitation extremes over the mid-high latitude areas of Northern Hemisphere: From CMIP5 to CMIP6. Atmos. Ocean. Sci. Lett. 2020, 13, 598–603. [Google Scholar] [CrossRef]
- Kendall, M. Rank Correlation Methods; Charles Griffin: London, UK, 1975. [Google Scholar]
- Yue, S.; Pilon, P.; Cavadias, G. Power of the Mann–Kendall and Spearman’s rho tests for detecting monotonic trends in hydrological series. J. Hydrol. 2002, 259, 254–271. [Google Scholar] [CrossRef]
- Chen, Y.G. Mathematical Methods for Geography; Science Press: Beijing, China, 2011. [Google Scholar]
- Li, C.H.; Zhou, M.; Wang, Y.T.; Zhu, T.F.; Sun, H.; Yin, H.H.; Cao, H.J.; Han, H.Y. Inter-annual variation of vegetation net primary productivity and the contribution of spatial-temporal and climate factors in arid Northwest China: A case study of Hexi Corridor. Chin. J. Ecol. 2020, 39, 3265–3275. [Google Scholar]
- Bao, G.; Qin, Z.H.; Bao, Y.H.; Zhou, Y.; Li, W.J.; Sanjjav, A.J. NDVI-Based Long-Term Vegetation Dynamics and Its Response to Climatic Change in the Mongolian Plateau. Remote Sens. 2014, 6, 8337–8358. [Google Scholar] [CrossRef]
- Parmesan, C.; Root, T.L.; Willig, M.R. Impacts of Extreme Weather and Climate on Terrestrial Biota*. Bull. Am. Meteorol. Soc. 2000, 81, 443–450. [Google Scholar] [CrossRef]
- Wernberg, T.; Bennett, S.; Babcock, R.C.; de Bettignies, T.; Cure, K.; Depczynski, M.; Dufois, F.; Fromont, J.; Fulton, C.J.; Hovey, R.K.; et al. Climate-driven regime shift of a temperate marine ecosystem. Science 2016, 353, 169–172. [Google Scholar] [CrossRef] [PubMed]
- Jeffery, M.L.; Yanites, B.J.; Poulsen, C.J.; Ehlers, T.A. Vegetation-precipitation controls on Central Andean topography. J. Geophys. Res. Earth Surf. 2014, 119, 1354–1375. [Google Scholar] [CrossRef]
- Xu, J. Precipitation–vegetation coupling and its influence on erosion on the Loess Plateau, China. Catena 2005, 64, 103–116. [Google Scholar]
- Kahmen, A.; Perner, J.; Buchmann, N. Diversity-dependent productivity in semi-natural grasslands following climate perturbations. Funct. Ecol. 2005, 19, 594–601. [Google Scholar] [CrossRef]
- Solomon, S.; Qin, D.; Manning, M.; Chen, Z.; Marquis, M.; Avery, M.; Alley, R.; Berntsen, T.; Bindoff, N.; Chidthaisong, A. Climate Change 2001: The Physical Science Basis. Contribution of working group I to the Third Assessment Report of the Intergovernmental Panel on Climate Change. Intergov. Panel Clim. Change Clim. Chang. 2001, 996, 95–123. [Google Scholar]
- Rhein, M.; Rintoul, S.R.; Aoki, S.; Campos, E.; Chambers, D. Observations: Ocean in climate change 2013: The physical science basis. Fifth Assess. Rep. Intergov. Panel Clim. Change 2013, 255–316. [Google Scholar]
- Peng, D.D.; Zhou, T.J.; Zhang, L.X.; Zhang, W.X.; Chen, X.L. Observationally constrained projection of the reduced intensification of extreme climate events in Central Asia from 0.5 °C less global warming. Clim. Dyn. 2019, 54, 543–560. [Google Scholar] [CrossRef]
- Zhang, M.R.; Yang, X.L.; Ren, L.L.; Pan, M.; Jiang, S.H.; Liu, L.; Yuan, F.; Fang, X.Q. Simulation of extreme precipitation in four climate regions in China by general circulation models (GCMs): Performance and projections. Water 2021, 13, 1509. [Google Scholar] [CrossRef]
- Wu, S.H.; Luo, Y.; Wang, H.; Gao, H.B.; Li, C.Z. Climate Change Impacts and Adaptation in China: Trends and Prospects. Chin. Sci. Bull. 2016, 61, 1042–1054. [Google Scholar]
- IPCC. Managing the Risks of Extreme Events and Disasters to Advance Climate Change Adaptation; Cambridge University Press: Cambridge, UK, 2012. [Google Scholar]
- Du, H.B.; Wu, Z.F.; Zhang, N.; Zong, S.W.; Meng, X.J. Characteristics of extreme temperature and precipitation events in Dandong in recent 60 years. Sci. Geogr. Sin. 2013, 33, 473–480. [Google Scholar]
- Gleick, P.H.; Adams, R.M.; Amasino, R.M. Climate change and the integrity of science. Science 2010, 328, 689–690. [Google Scholar] [CrossRef] [PubMed]
- Lin, L.; Gettelman, A.; Xu, Y.Y.; Wu, C.L.; Wang, Z.L.; Rosenbloom, N.; Bates, S.C.; Dong, W.J. CAM6 simulation of mean and extreme precipitation over Asia: Sensitivity to upgraded physical parameterizations and higher horizontal resolution. Geosci. Model Dev. 2019, 12, 3773–3793. [Google Scholar] [CrossRef]
Publisher’s Note: MDPI stays neutral with regard to jurisdictional claims in published maps and institutional affiliations. |
© 2022 by the authors. Licensee MDPI, Basel, Switzerland. This article is an open access article distributed under the terms and conditions of the Creative Commons Attribution (CC BY) license (https://creativecommons.org/licenses/by/4.0/).