Abstract
The chemical substances responsible for the kokumi taste of green tea infusion are still unclear. Here, we isolated the kokumi compound-containing fractions from green tea infusion through ultrafiltration, and the major kokumi compounds were characterized as γ-Glu-Gln and γ-Glu-Cys-Gly (GSH) through ultra-high-performance liquid chromatography-tandem mass spectrometry (UHPLC-MS). The results indicated that peptides and amino acids were essential compounds in the kokumi-enriched fractions for conducting the sense of kokumi. L-theanine had an enhancing effect on the kokumi taste of green tea infusion, which was confirmed in the sensory reconstitution study. Thus, peptides, especially γ-Glu-Gln and GSH, are the major kokumi compounds in green tea infusion, which has the potential of improving the flavor of tea beverages.
1. Introduction
Certain foods have characteristics such as thickness, continuity, and mouthfulness, which is referred to as kokumi. Kokumi is a taste sensation quite different from the five basic taste attributes (sweet, salty, sour, bitter, and umami). Like other taste attributes, kokumi has its own receptor called the calcium-sensing receptor (CaSR) [1]. Although the aqueous solution of kokumi-tasting compounds barely has flavor, they substantially enhance the thickness, continuity, complexity, and mouthfulness of foods or beverages as added [2]. Besides, kokumi peptides may improve the sensory quality of reduced-fat products in terms of thick flavor, aftertaste, and oiliness [3]. They have the potential to improve the flavor of foods and beverages and have applications in diet foods [4].
Green tea is a widely consumed beverage, which has a delicate fragrance, rich and thick taste, and numerous health benefits [5]. Some green teas, without fermentation and maturing steps during processing, have strong intensity of kokumi taste. The compounds responsible for the kokumi taste in green tea infusion are still unclear.
A series of peptides have been reported to influence the kokumi taste of animal-derived, plant-based, and fermented food [4]. A group of γ-glutamyl peptides performed specific kokumi-promoting effects in parmesan cheese [6] and gouda cheese [7]. γ-Glu-Val-Gly is the key peptide contributing to kokumi and umami taste in fermented shrimp [8], scallops [9], and soy sauce [10]. For tea infusion, kokumi compounds may also be peptides, which need further verification.
A sensory-guided isolation technology can quickly locate the new taste activity compounds from an unknown mixture [11]. This method determines the intensity of the key flavor by taste dilution analysis (TDA) and taste dilution factor (TD-factor) for different substances. Substances with significant taste intensity are separated for further analysis. This strategy has been successfully applied to identify the critical taste compounds, such as the umami peptide of tempeh (Indonesian fermented soybean) [12], the bitter-tasting compounds of Zanthoxylum bungeanum Maxim. [13], the kokumi and bitter taste octadecadien-12-ynoic acids of chanterelles (Cantharellus cibarius Fr.) [14], and the kokumi-enhancing peptides of chicken protein hydrolysate [15].
The aim of this work is to characterize the major kokumi-enhancing compounds in green tea infusion. The kokumi-tasting fractions were separated based on sensory-guided separation and purification technologies. Taste dilution analysis (TDA) and taste dilution factor (TD-factor) were used to evaluate the kokumi intensity of each fraction. Ultra-high-performance liquid chromatography-tandem mass spectrometry (UHPLC-MS/MS) was used to identify the kokumi compounds. The impacts of other compounds commonly present in green tea infusion on kokumi taste were also investigated.
2. Results and Discussion
2.1. Separation of Peptides Fractions and Selection of Kokumi-Tasting Fractions
To separate the kokumi-peptides in green tea, a kokumi-flavored green tea sample (1:50 Huiming green tea) was fractioned by ultrafiltration with 3 kDa molecular weight cut-off and submitted to sensory evaluation. The sensory evaluation result showed that the ultrafiltration fractions with a molecular weight < 3 kDa were associated with umami, mellow, and thick taste, compared with the stronger astringent and bitter taste of the ultrafiltrated fractions with a molecular weight > 3 kDa. These results indicated that kokumi compounds remained in the fractions with a molecular weight < 3 kDa. To further evaluate the taste intensity of the ultrafiltration fractions, a taste dilution analysis (TDA) was conducted, and the taste dilution factor (TD-factor) of each fraction was calculated. The fraction with a higher TD-factor had a stronger kokumi intensity. The results showed that the fraction with a molecular weight < 3 kDa had a TD-factor of 9, while the fraction with a molecular weight > 3 kDa only had a TD-factor of 2 (Table 1). Hence, the fraction with a lower molecular weight (<3 kDa) contributed to the kokumi taste of green tea infusion, which was further separated by gel filtration chromatography.

Table 1.
Sensory evaluation of ultrafiltration and gel filtration fractions of kokumi-flavored green tea samples (1:50 Huiming green tea).
After gel filtration, 35 fractions (A1–A35) were collected and divided into three major fractions (F-I, F-II, and F-III) according to their elution sequence and absorbance at 220 nm [16] (Figure 1); specifically, F-I fraction consisted of A3–A10, F-II fraction consisted of A11–A16, and F-III fraction consisted of A17–A30. Fractions A1, A2, and A31–35 were not analyzed because of their extremely low absorbance values and they could not form a peak with the nearest fraction. Sensory evaluation results showed that the fraction F-I was characterized by astringent and slightly umami taste, and F-II was characterized by mellow and thick taste, while F-III was characterized by bitter and plain taste. To further evaluate the kokumi taste intensity of the gel filtration fractions, a taste dilution analysis (TDA) was conducted. The results showed that F-I had a TD-factor of 6, and F-II had a TD-factor of 8, while F-III only had a TD-factor of 2 (Table 1), indicating that F-I and F-II were closely associated with the kokumi taste of green tea infusion. Combining the results of sensory evaluation and TDA, it could be deduced that kokumi-tasting substances were mainly small molecular substances (<3 kDa) that were presented in F-I and F-II.
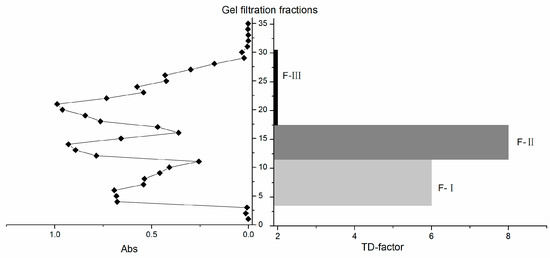
Figure 1.
Gel chromatography and taste dilution (TD)-factors of kokumi-flavored green tea samples (Huiming green tea).
The well-known tea taste compounds, such as theanine (umami) and catechins (astringency), are small molecular substances (<1 kDa), and small molecular substances (<1 kDa) in certain mushrooms, such as Agaricus bisporus and chanterelles, have been confirmed to enhance the kokumi tastes [17,18]. Hence, it can be deduced that tea-flavored kokumi-tasting substances might be small molecular substances.
2.2. Analysis of Kokumi Peptides by UHPLC-MS
To understand the kokumi peptides in kokumi-tasting fractions, UHPLC-MS was applied for analysis. According to Toelstede et al. [19], 11 kokumi peptides were selected and their MRM channels are shown in Table S1 from Supplementary Materials. Among these MRM results, we chose graphs that were clear and use MS library and standards to confirm the compounds which were γ-Glu-Cys-Gly (GSH) and γ-Glu-Gln. Figure 2 shows the UHPLC chromatogram and MS information of F-I, γ-Glu-Cys-Gly (GSH), F-II, and γ-Glu-Gln. The compound in F-I was identified as GSH according to the retention time and MS information (Figure 2A1,A2), which was consistent with the retention time and MS data of GSH standard (Figure 2B1,B2). Accordingly, F-II shown in Figure 2C1,C2 was identified as γ-Glu-Gln based on the standard information (Figure 2D1,D2). The calibration curve of GSH was y = 2721.4x − 97.0 (r2 = 0.9922) and that of γ-Glu-Gln was y = 2269.2x + 287.9 (r2 = 0.9985).
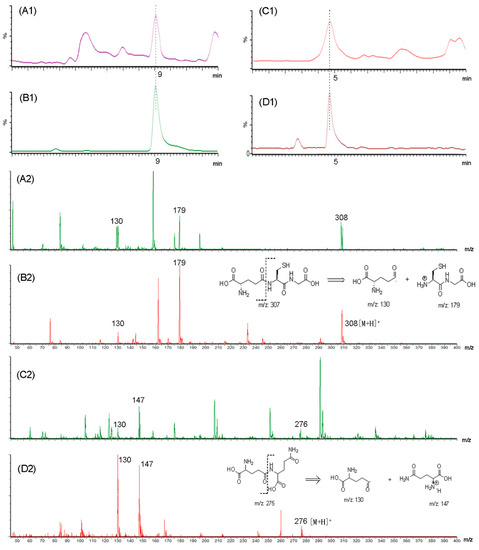
Figure 2.
Ultra-high-performance liquid chromatography-tandem mass spectrometry (UHPLC) chromatography of (A1) F-I; (B1) GSH; (C1) F-II; (D1) γ-Glu-Gln; MS fragmentography of (A2) F-I; (B2) GSH; (C2) F-II; (D2) γ-Glu-Gln.
To understand the distribution of GSH and γ-Glu-Gln in green tea samples with different kokumi intensities, 3 high-kokumi teas (HKs) and 3 low-kokumi teas (LKs) were selected for analysis under the concentration of 3 g/150 mL (tea-water ratio of 1:50). Table 2 showed the distribution of GSH content in high-kokumi-flavored green tea samples (HKs); this ranged from 8.50 μg/mL to 9.80 μg/mL, compared with 5.98 μg/mL to 6.96 μg/mL of low-kokumi-flavored green tea samples (LKs). The GSH contents in HKs were significantly higher than that in LKs. On the other hand, the γ-Glu-Gln content of high-kokumi-flavored green tea samples (HKs) ranged from 9.45 μg/mL to 12.50 μg/mL, compared with 5.49 μg/mL to 7.34 μg/mL of low-kokumi-flavored green tea samples (LKs). The γ-Glu-Gln contents of HKs were also significantly higher than those of LKs. Similarly, the total peptides contents of HKs (19.10–21.90 μg/mL) were significantly higher than that of LKs (12.28–14.30 μg/mL). These results suggest that the identified peptides may be the major kokumi peptides in green tea infusions.
Table 2.
Kokumi intensity and content of kokumi peptides in different tea infusions.
2.3. The Chemicals Contributing to the Kokumi-Taste of Tea Infusions
To explore other potential contributors to the kokumi-taste of tea infusions, the following 39 chemical compositions within the above six tea samples (HKs and LKs, tea-water ratio of 1:50) were quantified, including 20 amino acids, 2 kokumi peptides, 8 catechins, 3 alkaloids, gallic acid (GA), total amino acids, total peptides (GSH and γ-Glu-Gln), total proteins, total polyphenols, and total water-soluble sugars. After row normalization, the 39 chemical compositions were automatically clustered into 3 groups by TBtools (https://github.com/CJ-Chen/TBtools accessed on 31 May 2022) software according to the distribution characteristics of substances among samples (Figure 3). Group-1 contained 14 compositions, including 9 amino acids (His, Asn, Theanine, Arg, Gln, Ser, GABA, Glu, and Asp), 3 non-gallated catechins (EC, EGC, and C), total amino acids, and total water-soluble sugars. These 14 compositions (Group-1) were mainly distributed in HK-1, HK-2, and LK-1, while rarely distributed in LK-2 and 3. Notably, the total amino acids contents of LK-1 were significantly higher than those of others (p < 0.05) (Table S2 from Supplementary Materials), because LK-1 represents Anji White tea, which is a special albino tea variety with high levels of amino acids [20]. However, the kokumi intensity of LK-1 was weaker than HKs, which may be due to the lower concentration of peptides in LK-1 (Table 2). Group-2 contained 13 compositions, including 5 amino acids (Met, Val, Phe, Gly, and Leu), 2 catechins (GC and CG), 2 kokumi peptides (GSH and γ-Glu-Gln), 2 alkaloids (CAF and TB), total proteins, and total peptides. These 13 compositions (Group-2) were mainly distributed in HK-1, HK-2, and LK-2, while rarely distributed in HK-3, LK-1, and LK-3. There were 3 compositions that showed higher concentrations in HKs, which were GSH, γ-Glu-Gln and total peptides. Group-3 contained 12 compositions, including 6 amino acids (Trp, Tyr, Ile, Lys, Ala, and Thr), 3 gallated catechins (EGCG, GCG, ECG), GA, TP, and total polyphenols. These 12 compositions (Group-3) were mainly distributed in LKs and HK-3, while rarely distributed in HK-1 and 2. In general, HKs contained more amino acids, kokumi peptides, and total proteins than LKs, while LKs contained higher concentrations of gallated catechins, GA and total polyphenols (Table S2). Gallated catechins were important contributors to the astringency of tea infusions [21].
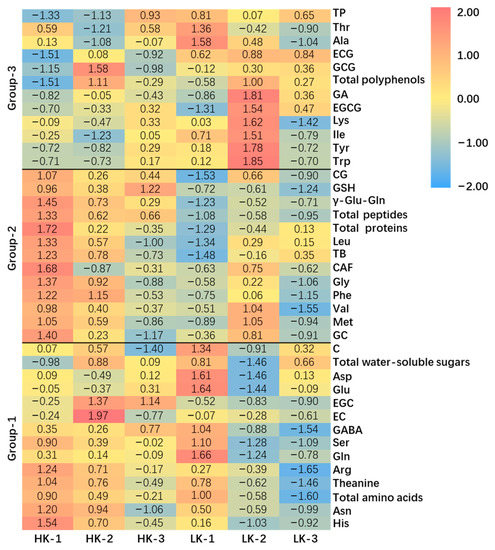
Figure 3.
Heatmap of high-kokumi teas (HKs) and (low-kokumi teas) LKs.
The color scale bar for each compound indicates the abundance of the compound among six tea samples, and results in the same row are comparable. The normalization method was using Z-score, where Xzscore = (Xi − Xmean)/Xsd. The abbreviations and full names are as follows: Asp (aspartic acid), Glu (glutamic acid), Asn (asparaginase), Ser (serine), Gln (glutamine), His (histidine), Gly (glycine), Thr (threonine), Arg (arginine), Ala (alanine), GABA (γ-aminobutyric acid), Thea (theanine), Tyr (tyrosine), Val (valine), Met (methionine), Trp (tryptophan), Phe (phenylalanine), Ile (isoleucine), Leu (leucine), Lys (lysine), GC ((−)-gallocatechin), EGC ((−)-epigallocatechin), C ((+)-catechin), EC ((−)-epicatechin), EGCG ((−)-epigallocatechin gallate), GCG ((−)-gallocatechin gallate), ECG ((−)-epicatechin gallate), CG ((−)-catechin gallate), CAF (caffeine), TB (theobromine), TP (theophylline), GA (gallic acid), and total peptides (GSH and γ-Glu-Gln).
To further investigate the potential kokumi-taste compounds, principal component analysis (PCA), Pearson correlation, and sensory evaluation were employed. The data used were those in the heatmap and kokumi intensities in Table 2. According to Carr et al. [22], the cos (∠kokumi, substance) were calculated, and 20 substances (17 monomers and 3 mixtures) had cosines higher than 0.707, which indicated that they may have positive correlations with kokumi. The above 17 monomers’ taste profiles were evaluated by panelists under a 40 μg/mL concentration in Huiming green tea (1:150). Among them, only γ-Glu-Gln and GSH exhibited kokumi tastes, and theanine exhibited umami taste, while others showed bitter, astringent, and sweet tastes. In order to compare whether the correlation is significant, the Pearson correlation coefficient and p-value between kokumi and substances were calculated. The results showed that only γ-Glu-Gln, GSH, and their mixture (total peptides) had significant positive correlations with kokumi (p < 0.05) (Table 3 and Figure S1 from Supplementary Materials).
Table 3.
Principal component analysis (PCA) loadings of variables and correlations between kokumi and substances.
From the above results, γ-Glu-Gln and GSH were proved to be significantly correlated to the kokumi intensity of tea infusion. However, in other foods, amino acids were also positively contributed to kokumi. The concentrations of amino acids and kokumi peptides in fermented soybeans were increased by the addition of γ-Glutamyltranspeptidase (GGT) in the process of fermentation, which enhanced the umami and kokumi tastes [23]. A dynamic fermentation method of black tea could increase the contents of theaflavins, thearubigins, amino acids, and soluble sugars, leading to the enhanced umami tastes of black tea and ultimately resulting in superior sensory qualities [24]. These studies combined with the positive correlationship between kokumi and theanine in the above result made us wonder whether umami compound, theanine, has the potential to contribute to kokumi. Hence, theanine, the only amino acid, which showed an umami taste and had a positive correlation with kokumi, was further investigated in the next part.
2.4. Verification of the Effects of Identified Kokumi-Tasting Compounds
In order to verify the effects of identified kokumi-tasting compounds above, a sensory reconstruction experiment and quantitative description analysis (QDA) were carried out. Four samples were prepared for panelists to evaluate. The control sample was a basic tea infusion, which had the 5 basic but faint tastes (kokumi, umami, sweet, bitter, and astringent) of green tea with the same score of 0.50. Group-GSH was a 40 μg/mL GSH-Control sample solution, Group-theanine was an 80 μg/mL theanine-Control sample solution, and Group-mix was a GSH-theanine-Control sample solution (40 μg/mL GSH, 80 μg/mL theanine) (Table 4). In this experiment, γ-Glu-Gln was not involved because of the purification is difficult thus the price of standard is high. Since γ-Glu-Gln and GSH have the same taste profile (Table S3 from Supplementary Materials), we then only used GSH to verify peptides’ effect.
Table 4.
The information of reconstituted samples for sensory evaluation.
Although these additives had no enhancing effect on the sweet taste, the intensities of other taste properties were enhanced to varying degrees, especially the kokumi taste. The intensities of kokumi taste were: Group-mix (3.17), Group-GSH (1.93), Group-theanine (1.17), and Control sample (0.50). Both theanine (Group-theanine) and GSH (Group-GSH) could significantly increase the kokumi intensities. Moreover, their mixture (Group-mix) exhibited a synergistic enhancing effect. For other taste properties, however, Group-mix showed no enhancing effects compared to other groups. Specifically, Group-GSH, Group-mix, and Group-theanine significantly enhanced the intensities of umami, among which theanine showed the most substantial enhancing effect. Besides, only Group-GSH significantly enhanced the astringent and bitter tastes. Therefore, GSH is confirmed to contribute to the kokumi, umami, astringent, and bitter tastes of tea infusions, while theanine mainly enhanced the kokumi and umami tastes of tea infusions. The intensity of kokumi was significantly increased when GSH and theanine were both presented in tea infusion (Figure 4 and Table S4 from Supplementary Materials).
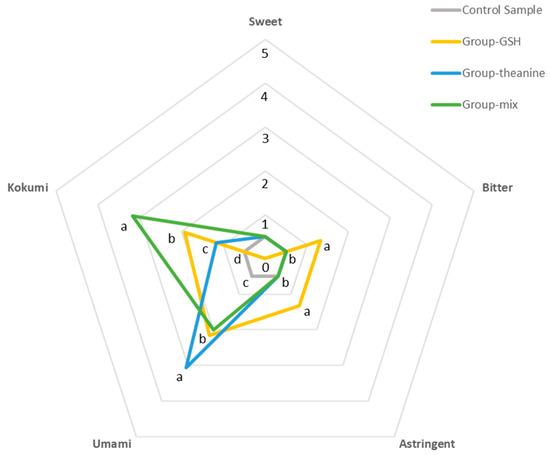
Figure 4.
Spider plot of reconstituted samples.
Synergistic enhancing effects have been reported in numerous flavoring substances. Amino acids and organic acids can significantly enhance umami when co-existing in foods and beverages [25]. 5′-Mononucleotides and L-α-amino acids had a strong synergistic enhancing effect on umami taste [26]. Hence, it is reasonable to assume that amino acids are able to enhance specific tastes through synergistic effects with a variety of flavor compounds. Thus, we consider that theanine might enhance the kokumi flavor through the synergistic effect with the kokumi peptide GSH.
The preparations of solutions were shown in Table 4. The temperature of the solution at the time of sensory evaluation was about 55 °C. Different lowercase letters in the same taste attribute indicate significant differences between mean values (p < 0.05).
3. Materials and Methods
3.1. Chemicals and Materials
Sephadex G-15 was purchased from Shanghai Yuanye Bio-Technology Co., Ltd. (Shanghai, China); γ-Glu-Gln (≥98%) was purchased from GL Biochem, Ltd. (Shanghai, China). Glutathione (≥98%), NaOH (≥99%) and HPLC-grade formic acid were obtained from Aladdin Bio-Chem Technology Co., Ltd. (Shanghai, China); HPLC-grade methanol was obtained from Merck & Co., Inc. (Rahway, NJ, USA); Pellicon 2 Mini PLBC was purchased from EMD Millipore (Billerica, MA, USA). Individual free amino acids aspartic acid (Asp, ≥98%), glutamic acid (Glu, ≥98%), asparaginase (Asn, ≥98%), serine (Ser, ≥98%), glutamine (Gln, ≥98%), histidine (His, ≥98%), glycine (Gly, ≥98%), threonine (Thr, ≥98%), arginine (Arg, ≥98%), alanine (Ala, ≥98%), γ-aminobutyric acid (GABA, ≥98%), theanine (Thea, ≥98%), tyrosine (Tyr, ≥98%), valine (Val, ≥98%), methionine (Met, ≥98%), tryptophan (Trp, ≥98%), phenylalanine (Phe, ≥98%), isoleucine (Ile, ≥98%), leucine (Leu, ≥98%), and lysine (Lys, ≥98%) were purchased from Shanghai Yuanye Bio-Technology Co., Ltd. (Shanghai, China). The catechins, including (−)-gallocatechin (GC), (−)-epigallocatechin (EGC), (+)-catechin (C), (−)-epicatechin (EC), (−)-epigallocatechin gallate (EGCG), (−)-gallocatechin gallate (GCG), (−)-epicatechin gallate (ECG), and (−)-catechin gallate (CG), caffeine (CAF), theobromine (TB), theophylline (TP), and gallic acid (GA) were purchased from Aladdin (Shanghai, China). The ultra-pure water (>18 MΩ cm) was prepared by Milli-Q™ reference system (Merck Millipore, Milford, USA).
Six tea samples with different kokumi intensities were selected according to the results of sensory evaluations. Three tea samples with strong kokumi taste were Huiming green tea, Tangji green tea, and Dafo Longjing tea, which were termed HK-1, HK-2, and HK-3 in order. Three green tea samples with low kokumi intensity were Anji white tea, Yuezhou Longjing tea, and Xihu Longjing tea, which were termed LK-1, LK-2, and LK-3.
3.2. Ultrafiltration of Tea Infusions and Fraction Separation
According to the Chinese national standard GB/T 23776-2018 (methodology of sensory evaluation of tea), 3.00 g of tea sample was infused in 150 mL of 100 °C boiled water for 4 min. The tea infusion was filtered through a 0.45 μm microfiltration membrane and cooled to room temperature, followed by an ultrafiltration membrane separation of 3 kDa molecular weight cut-off (Pellicon 2 Mini PLBC). The ultrafiltration (<0.01 μm) was operated at room temperature (25 ± 3 °C) and under the pressure of 0.15 MPa. The filtrates with molecular weight less than 3 kDa or above 3 kDa were respectively concentrated by a rotary vacuum evaporator and freeze-dried for sensory evaluation and further separation.
Gel filtration chromatography, also known as gel exclusion chromatography or molecular sieve chromatography, was applied for further separation of the ultrafiltration mixture based on molecular size and polarity [27]. Three grams of the freeze-dried powder (molecular weight < 3 kDa) was dissolved in 30 mL of ultra-pure water, followed by a 0.45 μm membrane filtration. Then the filtrate was loaded to Sephadex G-15 column (2 × 60 cm) prerinsed by 1% formic acid aqueous solution (w/w). Formic acid aqueous solution (1%, w/w) was used for elution at a flow rate of 0.8 mL/min, and 35 fractions (A1–A35, 8 mL for each fraction) were collected. According to the absorbance at 220 nm of eluates [16], these 35 fractions were combined into three groups: F-I (A3–A10), F-II (A11–A16), and F-III (A17–A30). F-I, F-II, and F-III were respectively concentrated by a rotary vacuum evaporator and freeze-dried at −40 °C for 48 h. The freeze-dried powders were kept at −20 °C before sensory evaluation and chemical analysis.
3.3. Kokumi Taste Fractions Identified by Taste Dilution Analysis (TDA)
The taste profile of each fraction was described by sensory evaluation first. TDA procedure was modified and applied for the assessment of kokumi intensity [11]. Since the tastes of kokumi substances can be hardly sensed in water but clearly perceived in tea infusion (tea-water ratio of 1:150), tea infusion was used as the solvent for TDA. The powders achieved from ultrafiltration and gel filtration were dissolved in tea infusion at the concentration of 3 mg/mL and then stepwise 1 + 1-diluted with water. The serially diluted solutions were presented to eight panelists in order of decreased concentrations. The dilution fold at which no kokumi difference could be perceived between the diluted solution and tea infusion (tea-water ratio of 1:150) was defined as the taste dilution factor (TD-factor) of kokumi, and higher TD-factor represents stronger kokumi intensity. The temperature of the solution at the time of sensory evaluation was about 55 °C. Before and after each sample evaluation, water was offered to the panelists for palate cleansing. Each sample was evaluated twice by each panelist, and the mean value was presented.
3.4. Analysis of Peptides by UHPLC-MS/MS
The composition of peptides was analyzed using a UHPLC-MS/MS system (Waters, Milford, MA, USA). The peptides powders associated with kokumi taste were dissolved by ultrapure water at the concentration of 3 mg/mL. After filtration through a 0.22 μm membrane, 10 μL of the solution was injected into the UHPLC-MS system. The UHPLC conditions were: Waters Acquity UPLC HSST3 column (2.1 × 100 mm, 1.8 μm), column temperature 40 °C, injection volume 5 μL, mobile phase A = 0.1% formic acid + 99.9% water (v/v), mobile phase B = 0.1% formic acid + 99.9% methanol (v/v), flow rate 0.1 mL/min, linear gradient elution: starting with 100% phase A for the first 8 min, to 65% (v) A/35% (v) B at 10 min, to 1% (v) A/99% (v) B at 14 min, then keeping at 100% (v) A for 4 min re-equilibrium. An electrospray ionization (ESI) technique (positive ion mode) was employed for MS analysis. The ion source conditions were set as follows: capillary voltage 3 kV, cone voltage 30 V, extractor 3.0 V and RF lens 0.2 V, ion source temperature 150 °C, cone gas 50 L/h, desolvation gas at a flow rate of 600 L/h and temperature at 350 °C. Argon was used as the collision gas (collision energy of 16 Ev, flow rate 0.25 mL/min). LM resolution 1 and 2:15; HM resolution 1 and 2:15; ion energy 1 and 2:1. Full scan range of 45 to 600 atomic mass unit (amu) were recorded. Multiple reaction monitoring (MRM) method as shown in Table S1 from Supplementary Materials was used for determination of all the kokumi peptides. The acquired data were analyzed using MassLynx 4.0 software. The concentrations of GSH and γ-Glu-Gln were quantified by an external standard method.
3.5. Spectrophotometric Analyses of Total Proteins, Amino Acids, Water-Soluble Sugars, and Polyphenols
The content of total proteins was determined by the Coomassie Brilliant Blue method; the content of total amino acids was determined by the ninhydrin method (GB/T 8313-2018); the content of total water-soluble sugars was determined by the anthrone-sulfuric acid method [28]; the content of total polyphenols was determined by the Folin-Ciocalteu method [29].
3.6. HPLC Analysis of Catechin Compounds and Amino Acids
The catechins were analyzed by the HPLC method (GB/T 8313-2018): Injection volume 10 μL, Agilent TC-C18 column (4.6 mm × 250 mm, 5 μm, Agilent Technologies, Santa Clara, CA, USA), column temperature 35 °C, mobile phase A = acetonitrile/acetic acid/EDTA-2Na/water (9:2:0.2:88.8, v), mobile phase B = acetonitrile/acetic acid/EDTA-2Na/water (80:2:0.2:17.8, v), linear gradient elution: starting with 100%A/0%B for the first 10 min, to 68%A/32% B at 25 min, keeping at 68%A/32% B for another 10 min, then keeping at 100%A/0%B at 55 min, flow rate 1 mL/min, detection wavelength 278 nm.
The individual free amino acids were analyzed according to the reported method [30]. Prior to HPLC analysis, amino acids were derivatized by mixing 5 μL of sample with 500 μL of borate buffer (pH 10.2), 100 μL of ortho-phthalaldehyde (10 mg/mL), 100 μL of fluolenylmeghyl chloroformate (1.5 mg/mL), and 300 μL of deionized water. HPLC condition was: Zorbax Eclipse-AAA column (4.6 mm × 150 mm, 3.5 μm, Agilent Technologies Inc., Santa Clara, CA, USA), column temperature 40 °C, injection volume 10 μL. Mobile phase A = 40 mM Na2HPO4 (pH 7.8), mobile phase B = acetonitrile/methanol/water (45:5:10, v/v/v), linear gradient elution: linearly increasing from 95%A/5%B to 40%A/60%B during the first 18 min, then increasing to 0%A/100%B at 23 min, keeping at 95%A/5%B for 7 min re-equilibrium, flow rate 1.5 mL/min, fluorescent detector with the excitation wavelength of 340 nm and the emission wavelength of 450 nm.
3.7. Sensory Evaluation
3.7.1. Evaluation of Kokumi Intensity
Based on the reported method [31], the panelists rated the kokumi intensity of samples on a scale from 0 (not detectable) to 5 (intensively perceived). Green tea infusion was prepared by brewing tea sample (3.00 g) with 150 mL boiling water for 4 min, and then the green tea infusion was presented to panelists. Water was used as a palate cleanser between samples. The temperature of tea infusion at the time of evaluation was about 55 °C.
3.7.2. Quantitative Descriptive Analysis (QDA) of Reconstituted Samples
QDA was used to evaluate the taste properties of tea samples according to the previous method [32]. Eight panelists (four males and four females, ages 20–35 years) were trained by the same taste references, including 1.5% glucose solution for sweetness, 0.2% theanine solution for umami taste, 0.1% quinine sulfate solution for bitterness, 0.75% EGCG solution for astringency, and a mixture of 0.8% glutathione and 0.4% theanine for tea-flavored kokumi. One gram of tea sample was brewed with 150 mL boiling water for 4 min, and the tea infusion (150 mL) with a certain additive agent labeled with a three-digit code was presented to each panelist in a randomized order for taste evaluation according to GB/T 23776-2018 (Methodology of sensory evaluation of tea). The panelists rated the intensity of taste attributes on a five-point scale (0: not detectable, 1: very weak, 2: a little weak, 3: neither weak nor strong, 4: a little strong, 5: very strong). The average score of each attribute was used for plotting the spider chart. Table 4 gives the information of reconstituted samples for sensory evaluation.
3.8. Statistical Analyses
Statistical analyses were conducted using XLSTAT statistical software (Version 2019.2.2; Addinsoft, New York, NY, USA). Fisher’s Least Significant Differences (LSD) were calculated at a 5% significance level to compare variable means. A probability level of 5% was considered significant. Pearson correlation analysis was conducted to investigate correlations with a confidence interval of 95%. The heatmap was illustrated by TBtools (https://github.com/CJ-Chen/TBtools accessed on 31 May 2022) software. Three repeats of each were used for the chemical analysis.
4. Conclusions
In this study, tea-flavored kokumi-tasting compounds in green tea infusions were investigated. GSH and γ-Glu-Gln were extracted and identified as major tea-flavored kokumi peptides. These two components had a remarkable effect on tea-flavored kokumi taste, despite their relatively low concentration in tea infusions. Sensory reconstitution evaluation results indicated that the addition of kokumi peptides significantly enhanced kokumi intensity of green tea infusion. Theanine could enhance the kokumi taste of tea infusion when coexisting with kokumi peptides. The kokumi substances isolated in our study can be used as flavor modifying agents in the production of tea beverages.
Supplementary Materials
The following supporting information can be downloaded at: https://www.mdpi.com/article/10.3390/molecules27175677/s1, Table S1. MRM channels of kokumi peptides; Table S2. Original data for heatmap of HKs and LKs; Table S3. Triangle test of GSH and γ-Glu-Gln; Table S4. Original data for spider plot; Table S5. Pre-experiment; Figure S1. PCA plot of variables.
Author Contributions
Conceptualization, P.C.; methodology, J.L.; formal analysis, J.L.; investigation, J.L., Y.C., Y.P. and G.Z.; validation, Y.C., Y.P. and S.M.; writing—original draft preparation, J.L.; writing—review and editing, P.C. and Y.C.; visualization, J.L. and Y.C.; supervision, P.C. and Q.C.; project administration, P.C.; funding acquisition, P.C. All authors have read and agreed to the published version of the manuscript.
Funding
This work was supported by China Agriculture Research System of MOF and MARA (CARS-19).
Institutional Review Board Statement
Not applicable.
Informed Consent Statement
Informed consent was obtained from all subjects involved in the study.
Data Availability Statement
Not applicable.
Conflicts of Interest
The authors declare no conflict of interest.
Sample Availability
Samples of the compounds mentioned above are available from the authors.
References
- Ohsu, T.; Amino, Y.; Nagasaki, H.; Yamanaka, T.; Takeshita, S.; Hatanaka, T.; Maruyama, Y.; Miyamura, N.; Eto, Y. Involvement of the calcium-sensing receptor in human taste perception. J. Biol. Chem. 2010, 285, 1016–1022. [Google Scholar] [CrossRef] [PubMed]
- Zhao, C.J.; Schieber, A.; Ganzle, M.G. Formation of taste-active amino acids, amino acid derivatives and peptides in food fermentations—A review. Food Res. Int. 2016, 89, 39–47. [Google Scholar] [CrossRef]
- Miyamura, N.; Jo, S.; Kuroda, M.; Kouda, T. Flavour improvement of reduced-fat peanut butter by addition of a kokumi peptide, γ-glutamyl-valyl-glycine. Flavour 2015, 4, 16. [Google Scholar] [CrossRef]
- Li, Q.; Zhang, L.; Lametsch, R. Current progress in kokumi-active peptides, evaluation and preparation methods: A review. Crit. Rev. Food Sci. Nutr. 2020, 62, 1230–1241. [Google Scholar] [CrossRef]
- Das, P.R.; Kim, Y.; Hong, S.-J.; Eun, J.-B. Profiling of volatile and non-phenolic metabolites—Amino acids, organic acids, and sugars of green tea extracts obtained by different extraction techniques. Food Chem. 2019, 296, 69–77. [Google Scholar] [CrossRef] [PubMed]
- Hillmann, H.; Hofmann, T. Quantitation of key tastants and re-engineering the taste of Parmesan cheese. J. Agric. Food Chem. 2016, 64, 1794–1805. [Google Scholar] [CrossRef]
- Toelstede, S.; Hofmann, T. Kokumi-active glutamyl peptides in cheeses and their biogeneration by Penicillium roquefortii. J. Agric. Food Chem. 2009, 57, 3738–3748. [Google Scholar] [CrossRef]
- Miyamura, N.; Kuroda, M.; Kato, Y.; Yamazaki, J.; Mizukoshi, T.; Miyano, H.; Eto, Y. Determination and quantification of a kokumi peptide, γ-glutamyl-valyl-glycine, in fermented shrimp paste condiments. Food Sci. Technol. Res. 2014, 20, 699–703. [Google Scholar] [CrossRef]
- Kuroda, M.; Kato, Y.; Yamazaki, J.; Kageyama, N.; Mizukoshi, T.; Miyano, H.; Eto, Y. Determination of gamma-glutamyl-valyl-glycine in raw scallop and processed scallop products using high pressure liquid chromatography-tandem mass spectrometry. Food Chem. 2012, 134, 1640–1644. [Google Scholar] [CrossRef]
- Kuroda, M.; Kato, Y.; Yamazaki, J.; Kai, Y.; Mizukoshi, T.; Miyano, H.; Eto, Y. Determination and quantification of the kokumi peptide, γ-glutamyl-valyl-glycine, in commercial soy sauces. Food Chem. 2013, 141, 823–828. [Google Scholar] [CrossRef]
- Frank, O.; Ottinger, H.; Hofmann, T. Characterization of an intense bitter-tasting 1H,4H-quinolizinium-7-olate by application of the taste dilution analysis, a novel bioassay for the screening and identification of taste-active compounds in foods. J. Agric. Food Chem. 2001, 49, 231–238. [Google Scholar] [CrossRef] [PubMed]
- Amin, M.; Kusnadi, J.; Hsu, J.-L.; Doerksen, R.J.; Huang, T.-C. Identification of a novel umami peptide in tempeh (Indonesian fermented soybean) and its binding mechanism to the umami receptor T1R. Food Chem. 2020, 333, 127411. [Google Scholar] [CrossRef]
- Yang, Q.; Mei, X.; Wang, Z.; Chen, X.; Zhang, R.; Chen, Q.; Kan, J. Comprehensive identification of non-volatile bitter-tasting compounds in Zanthoxylum bungeanum Maxim. by untargeted metabolomics combined with sensory-guided fractionation technique. Food Chem. 2010, 347, 129085. [Google Scholar] [CrossRef] [PubMed]
- Zhang, H.-X.; Wang, Z.-Z.; Du, Z.-Z. Sensory-guided isolation and identification of new sweet-tasting dammarane-type saponins from Jiaogulan (Gynostemma pentaphyllum) herbal tea. Food Chem. 2022, 388, 132981. [Google Scholar] [CrossRef] [PubMed]
- Zhang, Y.; Ma, Y.; Ahmed, Z.; Geng, W.; Tang, W.; Liu, Y.; Jin, H.; Jiang, F.; Wang, J.; Wang, Y. Purification and identification of kokumi-enhancing peptides from chicken protein hydrolysate. Int. J. Food Sci. Technol. 2019, 54, 2151–2158. [Google Scholar] [CrossRef]
- Schindler, A.; Dunkel, A.; Stähler, F.; Backes, M.; Ley, J.; Meyerhof, W.; Hofmann, T. Discovery of salt taste enhancing arginyl dipeptides in protein digests and fermented fish sauces by means of a sensomics approach. J. Agric. Food Chem. 2011, 59, 12578–12588. [Google Scholar] [CrossRef]
- Feng, T.; Wu, Y.; Zhang, Z.; Song, S.; Zhuang, H.; Xu, Z.; Yao, L.; Sun, M. Purification, identification, and sensory evaluation of kokumi peptides from Agaricus bisporus mushroom. Foods 2019, 8, 43. [Google Scholar] [CrossRef]
- Mittermeier, V.K.; Pauly, K.; Dunkel, A.; Hofmann, T. Ion-mobility-based liquid chromatography-mass spectrometry quantitation of taste-enhancing octadecadien-12-ynoic acids in mushrooms. J. Agric. Food Chem. 2020, 68, 5741–5751. [Google Scholar] [CrossRef]
- Toelstede, S.; Dunkel, A.; Hofmann, T. A series of kokumi peptides impart the long-lasting mouthfulness of matured Gouda cheese. J. Agric. Food Chem. 2009, 57, 1440–1448. [Google Scholar] [CrossRef]
- Li, C.-F.; Ma, J.-Q.; Huang, D.-J.; Ma, C.-L.; Jin, J.-Q.; Yao, M.-Z.; Chen, L. Comprehensive dissection of metabolic changes in albino and green tea cultivars. J. Agric. Food Chem. 2018, 66, 2040–2048. [Google Scholar] [CrossRef]
- Scharbert, S.; Holzmann, N.; Hofmann, T. Identification of the astringent taste compounds in black tea infusions by combining instrumental analysis and human bioresponse. J. Agric. Food Chem. 2004, 52, 3498–3508. [Google Scholar] [CrossRef]
- Carr, B.T.; Dzuroska, J.; Taylor, R.O.; Lanza, K.; Pansini, C. Multidimensional Alignment (MDA): A simple numerical tool for assessing the degree of association between products and attributes on perceptual maps. In Proceedings of the 8th Rose-Marie Pangborn Sensory Science Symposium, Florence, Italy, 26–30 July 2009. [Google Scholar]
- Ho, T.V.; Suzuki, H. Increase of “Umami” and “Kokumi” compounds in miso fermented soybeans by the addition of bacterial γ-glutamyltranspeptidase. Int. J. Food Stud. 2013, 2, 39–47. [Google Scholar] [CrossRef]
- Hua, J.; Xu, Q.; Yuan, H.; Wang, J.; Wu, Z.; Li, X.; Jiang, Y. Effects of novel fermentation method on the biochemical components change and quality formation of Congou black tea. J. Food Compos. Anal. 2021, 96, 103751. [Google Scholar] [CrossRef]
- Wu, N.; Gu, S.; Tao, N.; Wang, X. Research progress in interaction between umami substances. Sci. Technol. Food Ind. 2014, 35, 389–392+400. [Google Scholar] [CrossRef]
- Kawai, M.; Okiyama, A.; Ueda, Y. Taste enhancements between various amino acids and IMP. Chem. Senses 2002, 27, 739–745. [Google Scholar] [CrossRef]
- Shah, A.K.M.A.; Ogasawara, M.; Egi, M.; Kurihara, H.; Takahashi, K. Identification and sensory evaluation of flavour enhancers in Japanese traditional dried herring (Clupea pallasii) fillet. Food Chem. 2010, 122, 249–253. [Google Scholar] [CrossRef]
- Zhong, L. The Physical and Chemical Analysis of Tea Quality; Shangh Science and Technology Press: Shanghai, China, 1989; pp. 449–451. [Google Scholar]
- Qin, A.X.; Ji, S.; Gao, Z.; He, B.B.; Kang, X.H.; Jia, Y.N.; Chen, C.; Cui, T. Determination of oil-soluble tea polyphenols in oil by solid phase extraction and folin-ciocalteu colorimetry. J. Food Saf. Qual. 2014, 4, 1185–1190. [Google Scholar] [CrossRef]
- Li, C.; Guo, H.; Zong, B.; He, P.; Fan, F.; Gong, S. Rapid and non-destructive discrimination of special-grade flat green tea using Near-infrared spectroscopy. Spectrochim. Acta Part A 2019, 206, 254–262. [Google Scholar] [CrossRef] [PubMed]
- Singldinger, B.; Dunkel, A.; Bahmann, D.; Bahmann, C.; Kadow, D.; Bisping, B.; Hofmann, T. New taste-active 3-(O-β-d-glucosyl)-2-oxoindole-3-acetic acids and diarylheptanoids in Cimiciato-infected hazelnuts. J. Agric. Food Chem. 2018, 66, 4660–4673. [Google Scholar] [CrossRef]
- Dunkel, A.; Koster, J.; Hofmann, T. Molecular and sensory characterization of γ-glutamyl peptides as key contributors to the kokumi taste of edible beans (Phaseolus vulgaris L.). J. Agric. Food Chem. 2007, 55, 6712–6719. [Google Scholar] [CrossRef] [PubMed]
Publisher’s Note: MDPI stays neutral with regard to jurisdictional claims in published maps and institutional affiliations. |
© 2022 by the authors. Licensee MDPI, Basel, Switzerland. This article is an open access article distributed under the terms and conditions of the Creative Commons Attribution (CC BY) license (https://creativecommons.org/licenses/by/4.0/).